strater quick start guide - golden softwaredownloads.goldensoftware.com/guides/strater2guide.pdf ·...
TRANSCRIPT
Strater® Quick Start Guide Well Log and Borehole Plotting for Geoscientists
Golden Software, Inc.
809 14th Street, Golden, Colorado 80401-1866, U.S.A.
Phone: 303-279-1021 Fax: 303-279-0909
www.goldensoftware.com
COPYRIGHT NOTICE
Copyright Golden Software, Inc. 2010
The Strater® program is furnished under a license agreement. The Strater software
and quick start guide may be used or copied only in accordance with the terms of the agreement. It is against the law to copy the software or quick start guide on any
medium except as specifically allowed in the license agreement. Contents are subject to change without notice.
Strater is a registered trademark of Golden Software, Inc. All other trademarks are the property of their respective owners.
August 2010
i
Table of Contents
Introduction to Strater ........................................................................................ 1 Data ............................................................................................................. 1 Multiple Boreholes or Multiple Views ................................................................. 1 Reuse, Reuse, Reuse ...................................................................................... 1 Strater Projects .............................................................................................. 1
System Requirements ......................................................................................... 2
Installation Directions ......................................................................................... 2 Updating Strater ............................................................................................ 2 Uninstalling Strater......................................................................................... 2 Borehole View and Data Tables ........................................................................ 3
The Strater Interface .......................................................................................... 4 Data, Schemes, and Log Properties ...................................................................... 5
Five-Minute Tour ............................................................................................ 6
Sample Strater Files.................................................................................... 6 Example Logs.SDG ..................................................................................... 6
Using Strater ................................................................................................. 7 Working with Borehole Views ........................................................................... 9
Add Borehole Views .................................................................................... 9
Opening an Existing Borehole View ............................................................. 10 Closing a Borehole View ............................................................................ 10
Panes ...................................................................................................... 10 Borehole View Properties ............................................................................... 11
Opening Borehole View Properties .............................................................. 11 View Mode ............................................................................................... 11 View Name .............................................................................................. 11 Borehole Orientation ................................................................................. 12
ID Filter ................................................................................................... 12 Depth Settings ......................................................................................... 12 Auto-recalculate Scale ............................................................................... 12 Depth Units ............................................................................................. 12
Log Display Mode ..................................................................................... 12 Template Name ........................................................................................ 12 Log, Header, and Footer Pane Line Properties .............................................. 13
Project Properties ..................................................................................... 13 Schemes ..................................................................................................... 13
Scheme Requirements .............................................................................. 13 Data and Schemes .................................................................................... 13 Scheme Contents ..................................................................................... 13 Scheme Types .......................................................................................... 15 Opening the Scheme Editor ........................................................................ 15
Creating New Schemes .............................................................................. 15
Opening Existing Schemes ......................................................................... 15 Saving Schemes ....................................................................................... 16
ii
Copying Schemes ..................................................................................... 16 Converting Schemes ................................................................................. 16 Deleting Schemes ..................................................................................... 16 Insert and Delete Items ............................................................................ 16
Updating Schemes .................................................................................... 16 Templates ................................................................................................... 16
Creating Templates ................................................................................... 17 Saving Templates ..................................................................................... 17 Loading Templates .................................................................................... 17
Template Information ............................................................................... 17 Data Tables ..................................................................................................... 18
Table Types ................................................................................................. 18 Collars Table ............................................................................................ 18 Text Table ............................................................................................... 18 Depth Table ............................................................................................. 18 Interval Table .......................................................................................... 18 Lithology Table ......................................................................................... 18
Project Settings Table ............................................................................... 20 Well Construction Table ............................................................................. 20 Associating Well Construction Data to a Well Log .......................................... 21
Project Data .................................................................................................... 23
File Formats ................................................................................................ 23 Loading Data ............................................................................................... 23 Creating New Tables and Data ....................................................................... 23
Columns ...................................................................................................... 24 Rows .......................................................................................................... 24 Multiple Boreholes in the Data Table ............................................................... 25
Borehole Logs .................................................................................................. 25 Adding Logs to a Borehole View ..................................................................... 26 Adding Objects to a Borehole View ................................................................. 26 Working in Design Mode ................................................................................ 26
Editing Object Properties ................................................................................... 27
Object Manager ............................................................................................ 27 Changing Properties ..................................................................................... 27
Log Items ....................................................................................................... 28 Depth ......................................................................................................... 28 Line/Symbol ................................................................................................ 28
Crossplot ..................................................................................................... 28 Zone Bar ..................................................................................................... 29 Bar ............................................................................................................. 29 Percentage .................................................................................................. 29 Post ............................................................................................................ 30 Classed Post ................................................................................................ 30 Complex Text .............................................................................................. 30
Graphic ....................................................................................................... 31 Lithology ..................................................................................................... 31
iii
Well Construction ......................................................................................... 31 Drawing Objects .............................................................................................. 32
Imported Objects ......................................................................................... 32 Linked Text ................................................................................................. 32
Scale Bar .................................................................................................... 32 Legends ...................................................................................................... 33
Tutorial ........................................................................................................... 33 Starting Strater ............................................................................................ 33 Creating Log Items ....................................................................................... 33
Creating a Line/Symbol Log ....................................................................... 33 Creating a Depth Log ................................................................................ 35
Creating a Zone Bar Log ............................................................................ 35 Creating a Complex Text Log ..................................................................... 36
Editing Log Properties ................................................................................... 36 Editing Log Item Positions ......................................................................... 36 Editing Schemes ....................................................................................... 37 Edit Scheme Properties ............................................................................. 38
Use a Scheme in a Zone Bar Log ................................................................ 39 Editing the Complex Text Log Properties ...................................................... 39
Creating and Editing Objects in the Header and Footer Panes ............................ 40 Scale Bars ............................................................................................... 41
Creating Text ........................................................................................... 41 Creating Linked Text ................................................................................. 41
Changing Boreholes ...................................................................................... 42
Change the Borehole for All Logs in the Log Pane ......................................... 42 Change the Borehole ID for Individual Logs ................................................. 42
A Note about the Documentation ....................................................................... 43 Printing the Online Help .................................................................................... 43
Printing One Topic ........................................................................................ 43 Printing One Section ..................................................................................... 43 Printing the Entire Help File ........................................................................... 44
Getting Help .................................................................................................... 44
Online Help ................................................................................................. 44 Context-Sensitive Help .................................................................................. 44 Internet ...................................................................................................... 45 Technical Support ......................................................................................... 45 Contact Information ..................................................................................... 45
Index ............................................................................................................. 46

Quick Start Guide
1
Introduction to Strater Strater is a well log and borehole plotting software application. There are 12 log types available in Strater: line/symbol, crossplot, depth, zone bar, bar, percentage, post, classed post, complex text, graphic, lithology and well construction logs. Each of the logs can be modified to suit your needs.
Data Data can be imported from many sources, including ASCII text files, Excel
spreadsheets, LAS files, and just about any database. Strater's internal database can contain multiple tables, and data for multiple boreholes can be stored in the data tables at one time in a single project file.
Multiple Boreholes or Multiple Views Strater allows you to display multiple boreholes in a single borehole view, and create multiple borehole views in a single project. You can specify a different borehole for each log in a borehole view with a few mouse clicks.
Reuse, Reuse, Reuse Once you design a borehole view, you can use the design repeatedly with other data. There are several features in Strater designed to save time with borehole graphic processing. After creating an initial design, you can take advantage of:
Templates
Schemes
Templates store the design elements of a project, including log items, header and footer items, data tables and schemes.
Schemes contain detailed information of how the data relate to drawing properties. For example, a lithology log uses lithology schemes, which contain keywords, such as
granite, clay, etc. Each of these keywords is assigned a fill pattern, contact line properties, line properties, and text properties. Schemes can be reused; therefore, you do not have to go through the process of assigning properties each time you create a log.
Strater Projects A project file consists of all borehole views, data tables, and optional schemes, and is saved in a single .sdg file. When Strater first opens you see a blank, unnamed project to which you can add all the components necessary to create the borehole design.
Once the borehole design is complete, use File | Save to save it to an .sdg project file.
Strater
2
System Requirements The minimum system requirements for Strater are:
Microsoft Windows® XP, Vista, 7, or higher. 1024 x 768 or higher monitor resolution with 16-bit (or higher) color depth.
At least 100 MB of additional free hard disk space. At least 512 MB RAM above the Windows requirement for simple data sets.
Installation Directions You need to have administrator rights to install and run Strater. To install Strater from a CD:
1. Insert the Strater CD into the CD-ROM drive. The install program automatically begins on most computers. If the installation does not begin automatically, locate the SETUP.EXE file on the Strater CD and then double-click the SETUP.EXE.
2. Select Install Strater from the Strater Auto Setup dialog to begin the installation.
To install Strater from a download:
1. Download Strater according to the directions you received.
2. Double-click the downloaded file to begin the installation process.
Updating Strater To update Strater, open the program and select Help | Check for Update. This launches the Internet Update program which will check Golden Software's servers for any updates. If there is an update for your version of Strater you will be prompted to download the update.
When Strater is initially launched, you will be prompted to allow the program to automatically check for updates. It is highly recommended that you select Yes. You
can turn this update option on, off, or adjust the update interval by selecting Tools | Options. The update options are available by clicking the Update page on the left side of the dialog.
Uninstalling Strater Windows XP: To uninstall Strater, go to the Windows Control Panel and double-click Add/Remove Programs. Select Strater 2 from the list of installed applications. Click Remove to uninstall Strater.
Quick Start Guide
3
Windows Vista: To uninstall Strater when using the Classic View, go to the Windows Control Panel and double-click Programs and Features. Select Strater from the list of installed applications. Click Uninstall to uninstall Strater.
Windows Vista and 7: To uninstall Strater when using the Regular Control Panel Home, go to the Windows Control Panel and click Uninstall a program. Select Strater 2 from the list of installed applications. Click Uninstall to uninstall Strater.
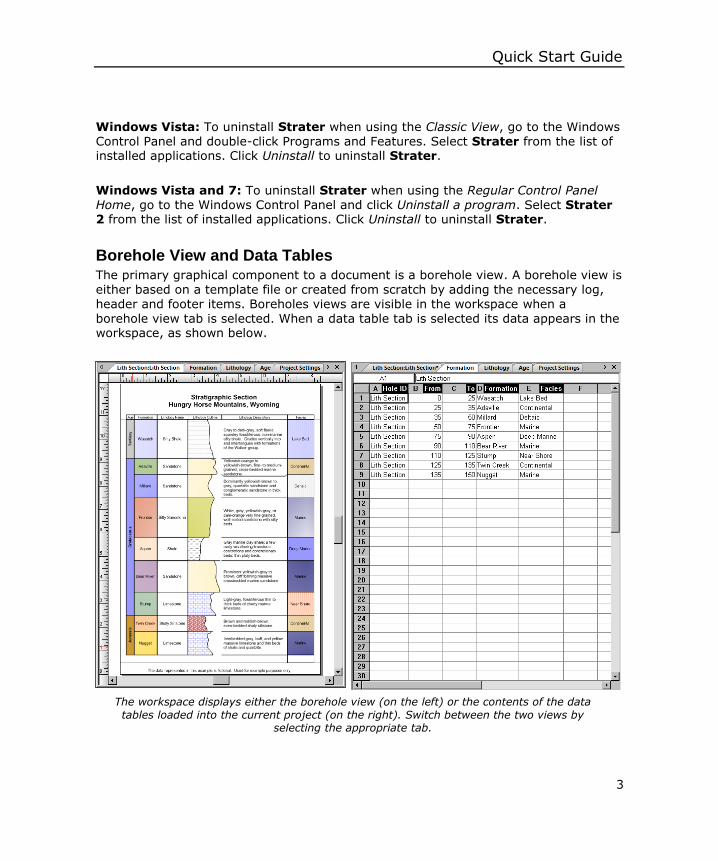
Borehole View and Data Tables The primary graphical component to a document is a borehole view. A borehole view is either based on a template file or created from scratch by adding the necessary log, header and footer items. Boreholes views are visible in the workspace when a borehole view tab is selected. When a data table tab is selected its data appears in the workspace, as shown below.
The workspace displays either the borehole view (on the left) or the contents of the data
tables loaded into the current project (on the right). Switch between the two views by selecting the appropriate tab.
Strater
4
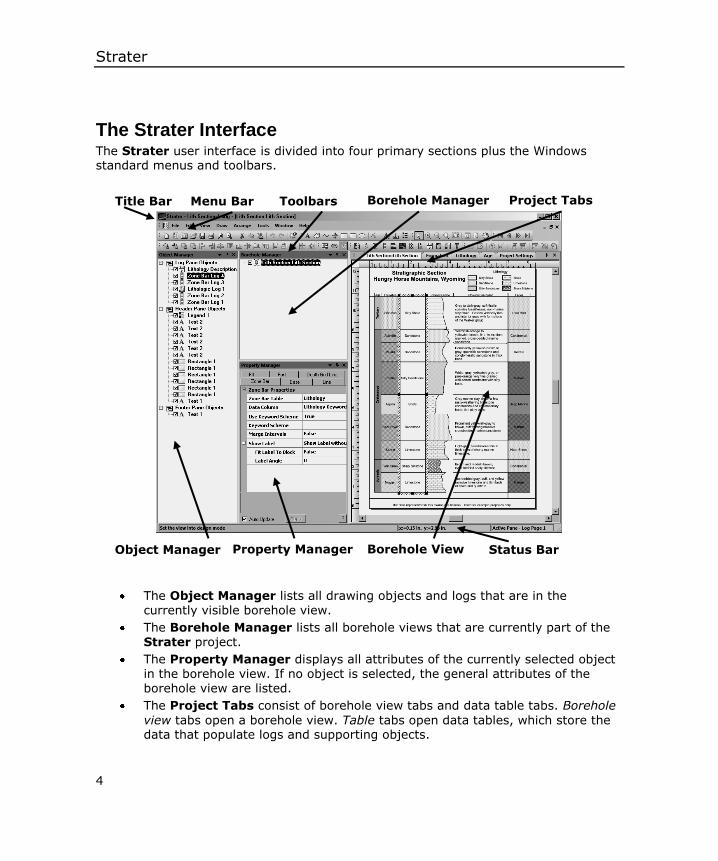
The Strater Interface The Strater user interface is divided into four primary sections plus the Windows standard menus and toolbars.
The Object Manager lists all drawing objects and logs that are in the currently visible borehole view.
The Borehole Manager lists all borehole views that are currently part of the Strater project.
The Property Manager displays all attributes of the currently selected object in the borehole view. If no object is selected, the general attributes of the borehole view are listed.
The Project Tabs consist of borehole view tabs and data table tabs. Borehole
view tabs open a borehole view. Table tabs open data tables, which store the data that populate logs and supporting objects.
Title Bar Menu Bar Toolbars Borehole Manager Project Tabs
Object Manager Property Manager Borehole View Status Bar
Quick Start Guide
5
Data, Schemes, and Log Properties
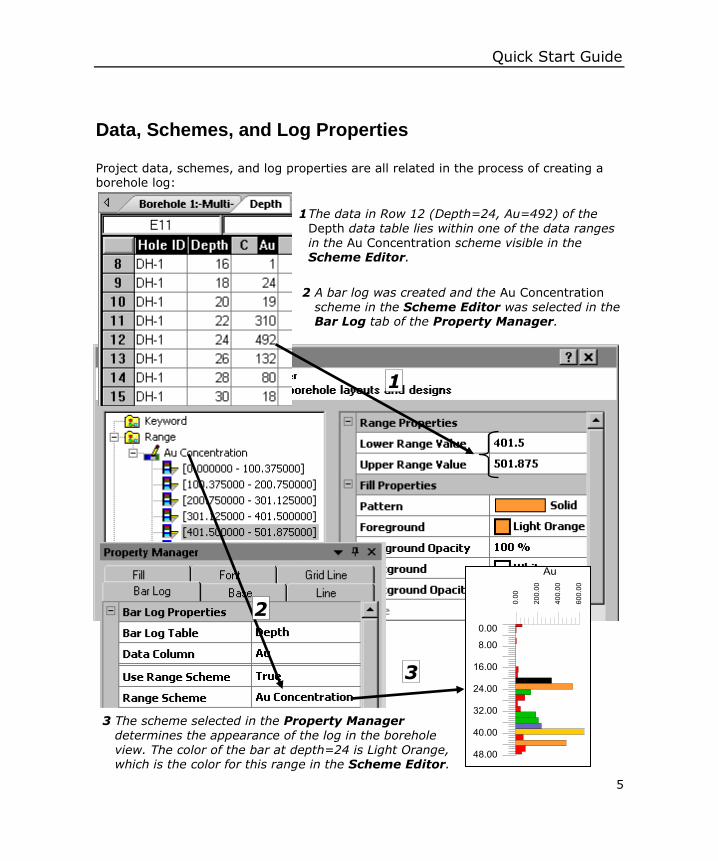
Project data, schemes, and log properties are all related in the process of creating a borehole log:
2 A bar log was created and the Au Concentration scheme in the Scheme Editor was selected in the Bar Log tab of the Property Manager.
1 The data in Row 12 (Depth=24, Au=492) of the Depth data table lies within one of the data ranges in the Au Concentration scheme visible in the Scheme Editor.
1
2
3
3 The scheme selected in the Property Manager determines the appearance of the log in the borehole view. The color of the bar at depth=24 is Light Orange, which is the color for this range in the Scheme Editor.
Strater
6
The data contain depth information (either depth or interval), borehole names, and the data to be displayed on the log. Schemes contain property information that is linked to data and is based on ranges or keywords. When scheme information is found in the data, the graphical borehole log displays the properties of the scheme. The Property
Manager determines which data table and field are used to create the log, the scheme to use (if any), and properties such as the color and location.
Five-Minute Tour Included in your installation are several sample files so you can quickly see some of Strater’s capabilities.
Sample Strater Files
To see the sample Strater files:
1. Open Strater.
2. Select File | Open and navigate to the
default installation folder, which is by default C:\Program Files\Golden Software\Strater 2\Samples.
3. Double-click a file with the .sdg extension.
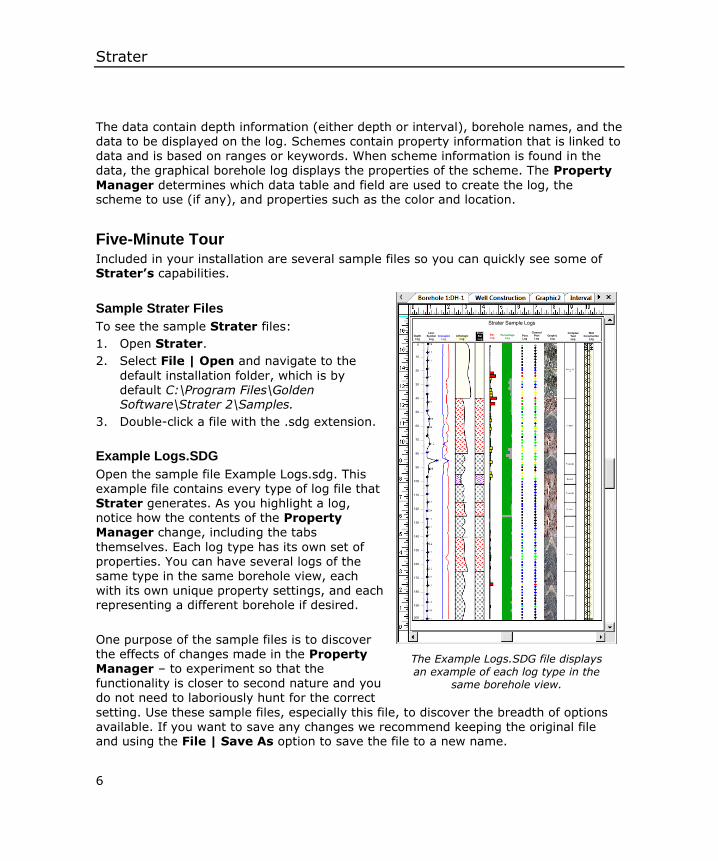
Example Logs.SDG
Open the sample file Example Logs.sdg. This example file contains every type of log file that Strater generates. As you highlight a log, notice how the contents of the Property Manager change, including the tabs
themselves. Each log type has its own set of properties. You can have several logs of the same type in the same borehole view, each with its own unique property settings, and each representing a different borehole if desired.
One purpose of the sample files is to discover the effects of changes made in the Property Manager – to experiment so that the functionality is closer to second nature and you do not need to laboriously hunt for the correct
setting. Use these sample files, especially this file, to discover the breadth of options available. If you want to save any changes we recommend keeping the original file and using the File | Save As option to save the file to a new name.
The Example Logs.SDG file displays an example of each log type in the
same borehole view.
Quick Start Guide
7
Using Strater The general steps for creating a borehole design are:
1. Open a new, empty Strater project.
2. Select a log type and its location in the borehole view.
3. Load data into a Strater project.
4. Use the Property Manager to associate the log with the data and specify the properties of the log.
5. Either repeat the above action to add more logs, or modify the new log with objects, legends, and scale bars.
One of the most common tasks in Strater is to create a log, add a depth scale, and modify the appearance of the log. The following will show you the steps to do this.
1. Open Strater. When you do so, a new blank project is automatically generated.
2. We will add a bar log to this project. Click or select Tools | Log Items | Bar.
3. Click the mouse button in the middle of the log pane, in the center of the borehole view, to determine the location where the bar is displayed. The Open dialog appears, where you select the source data file used by the log. Navigate to the Samples folder in the Strater installation directory.
4. Select Tutorial 1.XLS as the data file and click Open.
5. In the XLS Import Options dialog, select Depth as the data sheet to import and click OK.
6. The Specify Worksheet Column Definitions dialog opens, where you set up the columns and rows in the imported file. The defaults are OK, so click Next.
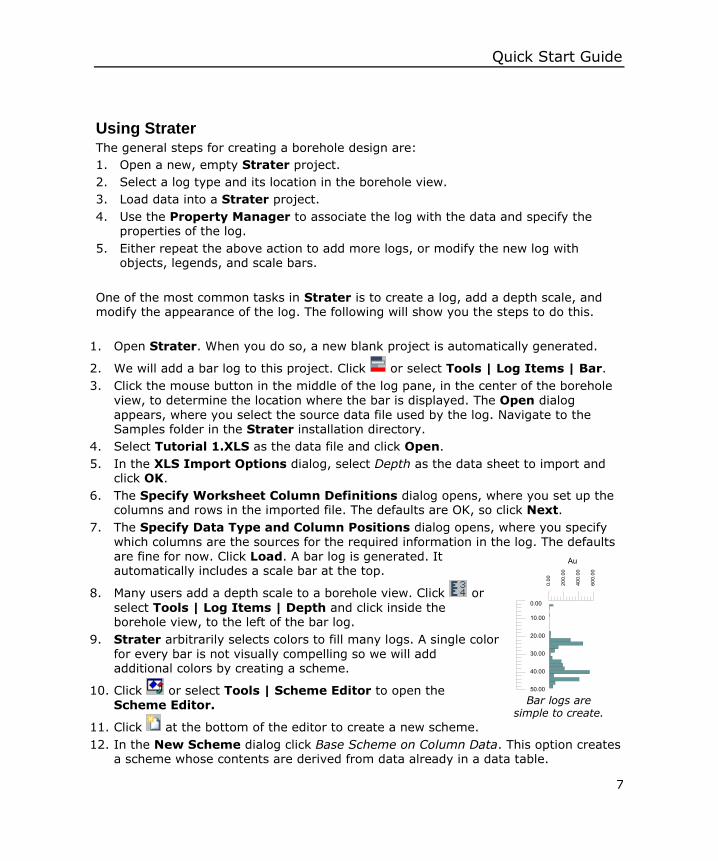
7. The Specify Data Type and Column Positions dialog opens, where you specify which columns are the sources for the required information in the log. The defaults are fine for now. Click Load. A bar log is generated. It automatically includes a scale bar at the top.
8. Many users add a depth scale to a borehole view. Click or
select Tools | Log Items | Depth and click inside the borehole view, to the left of the bar log.
9. Strater arbitrarily selects colors to fill many logs. A single color for every bar is not visually compelling so we will add additional colors by creating a scheme.
10. Click or select Tools | Scheme Editor to open the Scheme Editor.
11. Click at the bottom of the editor to create a new scheme.
12. In the New Scheme dialog click Base Scheme on Column Data. This option creates a scheme whose contents are derived from data already in a data table.
Bar logs are simple to create.
Strater
8
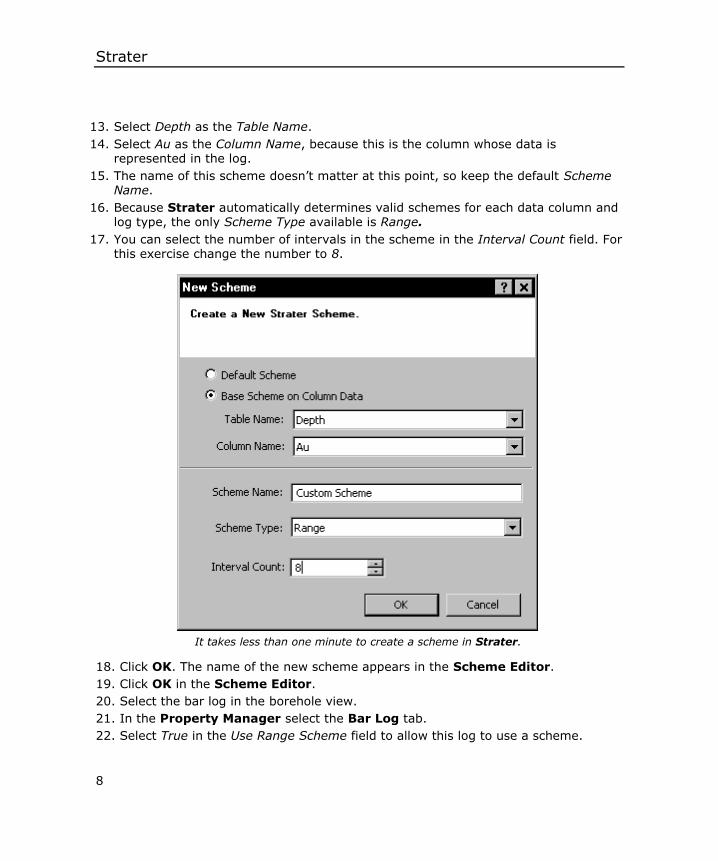
13. Select Depth as the Table Name.
14. Select Au as the Column Name, because this is the column whose data is represented in the log.
15. The name of this scheme doesn’t matter at this point, so keep the default Scheme Name.
16. Because Strater automatically determines valid schemes for each data column and log type, the only Scheme Type available is Range.
17. You can select the number of intervals in the scheme in the Interval Count field. For this exercise change the number to 8.
18. Click OK. The name of the new scheme appears in the Scheme Editor.
19. Click OK in the Scheme Editor.
20. Select the bar log in the borehole view.
21. In the Property Manager select the Bar Log tab.
22. Select True in the Use Range Scheme field to allow this log to use a scheme.
It takes less than one minute to create a scheme in Strater.
Quick Start Guide
9
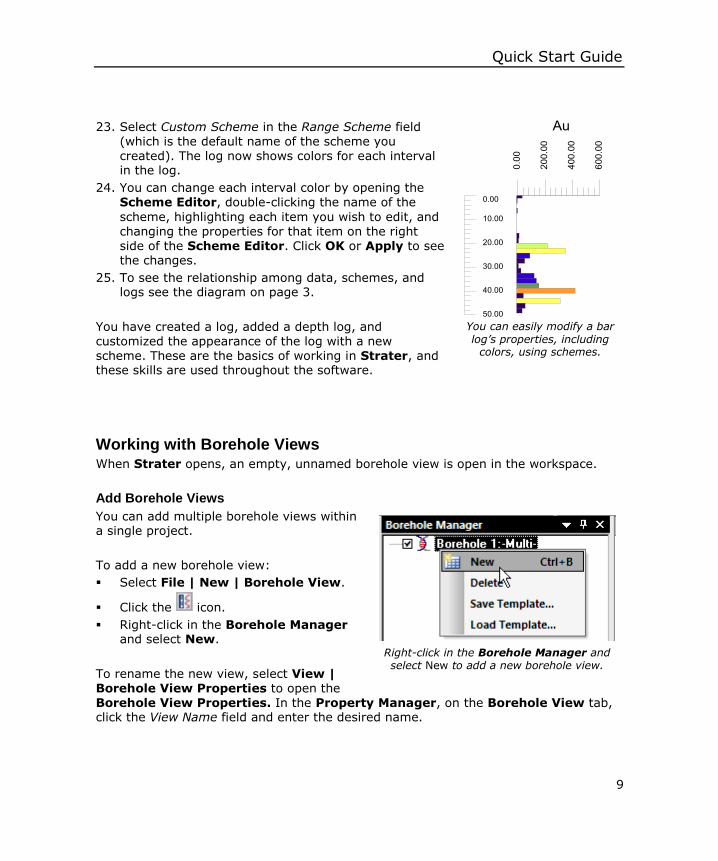
23. Select Custom Scheme in the Range Scheme field (which is the default name of the scheme you created). The log now shows colors for each interval in the log.
24. You can change each interval color by opening the Scheme Editor, double-clicking the name of the
scheme, highlighting each item you wish to edit, and changing the properties for that item on the right side of the Scheme Editor. Click OK or Apply to see the changes.
25. To see the relationship among data, schemes, and logs see the diagram on page 3.
You have created a log, added a depth log, and customized the appearance of the log with a new scheme. These are the basics of working in Strater, and these skills are used throughout the software.
Working with Borehole Views When Strater opens, an empty, unnamed borehole view is open in the workspace.
Add Borehole Views
You can add multiple borehole views within a single project.
To add a new borehole view:
Select File | New | Borehole View.
Click the icon.
Right-click in the Borehole Manager and select New.
To rename the new view, select View | Borehole View Properties to open the Borehole View Properties. In the Property Manager, on the Borehole View tab, click the View Name field and enter the desired name.
You can easily modify a bar log’s properties, including
colors, using schemes.
Right-click in the Borehole Manager and select New to add a new borehole view.
Strater
10
Opening an Existing Borehole View
An existing borehole view is opened by clicking its
tab at the top of the workspace. By default, the first borehole view in a project is named Borehole 1. You can also select Window | Borehole 1 to open the borehole view.
To open a closed borehole view, double-click the name of the borehole view in the
Borehole Manager.
Closing a Borehole View
To close a borehole view, right-click on the borehole tab and select Close, or uncheck
the check box to the left of the borehole view name in the Borehole Manager. The borehole view closes. This does not delete the borehole view from the project; it only removes the tab from the project tab array. If the borehole view you closed is the only borehole view tab in the project, then closing the tab will close the project. You may be prompted to save the project.
Panes
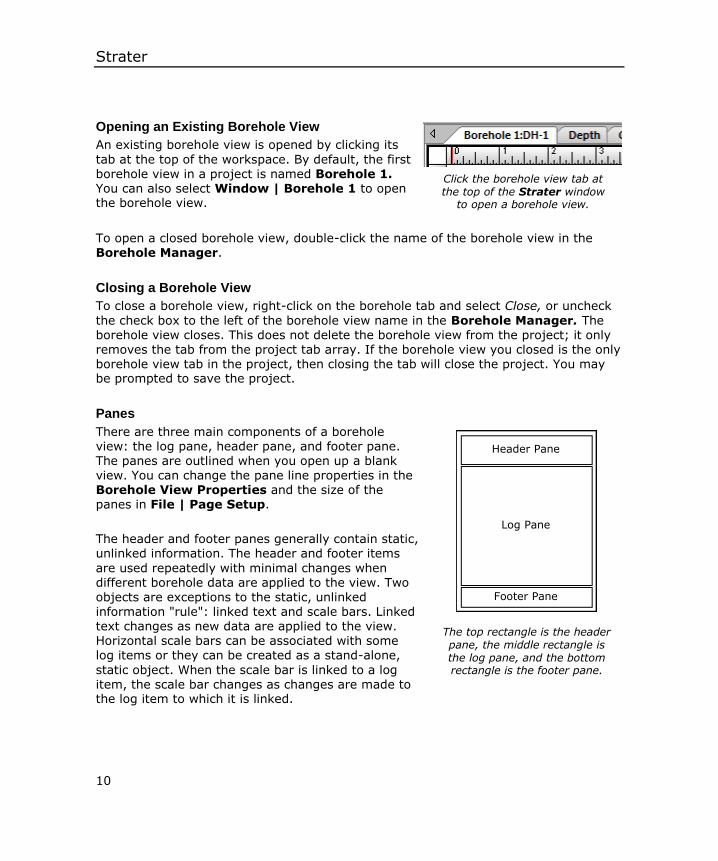
There are three main components of a borehole view: the log pane, header pane, and footer pane. The panes are outlined when you open up a blank view. You can change the pane line properties in the Borehole View Properties and the size of the panes in File | Page Setup.
The header and footer panes generally contain static, unlinked information. The header and footer items
are used repeatedly with minimal changes when different borehole data are applied to the view. Two
objects are exceptions to the static, unlinked information "rule": linked text and scale bars. Linked text changes as new data are applied to the view. Horizontal scale bars can be associated with some log items or they can be created as a stand-alone,
static object. When the scale bar is linked to a log item, the scale bar changes as changes are made to the log item to which it is linked.
Click the borehole view tab at the top of the Strater window
to open a borehole view.
The top rectangle is the header pane, the middle rectangle is the log pane, and the bottom rectangle is the footer pane.
Header Pane
Log Pane
Footer Pane
Quick Start Guide
11
The information displayed in the log pane is usually dependent on linked data tables and columns. The log pane is also dependent on depth and scaling values. These values determine the size of the pane rectangle and/or the number of pages.
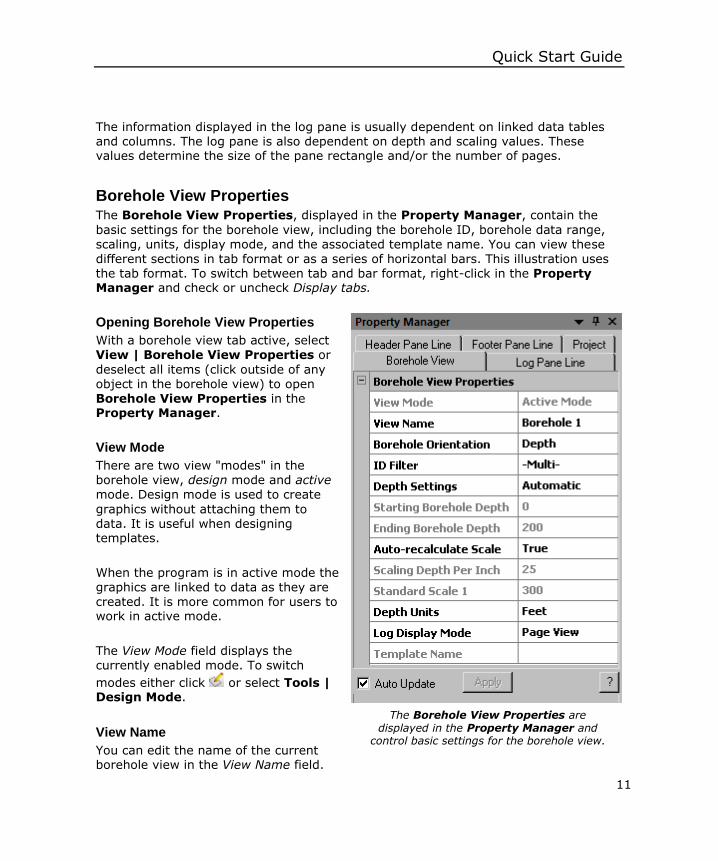
Borehole View Properties The Borehole View Properties, displayed in the Property Manager, contain the
basic settings for the borehole view, including the borehole ID, borehole data range, scaling, units, display mode, and the associated template name. You can view these
different sections in tab format or as a series of horizontal bars. This illustration uses the tab format. To switch between tab and bar format, right-click in the Property Manager and check or uncheck Display tabs.
Opening Borehole View Properties
With a borehole view tab active, select View | Borehole View Properties or
deselect all items (click outside of any object in the borehole view) to open Borehole View Properties in the Property Manager.
View Mode
There are two view "modes" in the borehole view, design mode and active mode. Design mode is used to create
graphics without attaching them to data. It is useful when designing templates.
When the program is in active mode the graphics are linked to data as they are
created. It is more common for users to work in active mode.
The View Mode field displays the currently enabled mode. To switch
modes either click or select Tools | Design Mode.
View Name
You can edit the name of the current borehole view in the View Name field.
The Borehole View Properties are displayed in the Property Manager and
control basic settings for the borehole view.
Strater
12
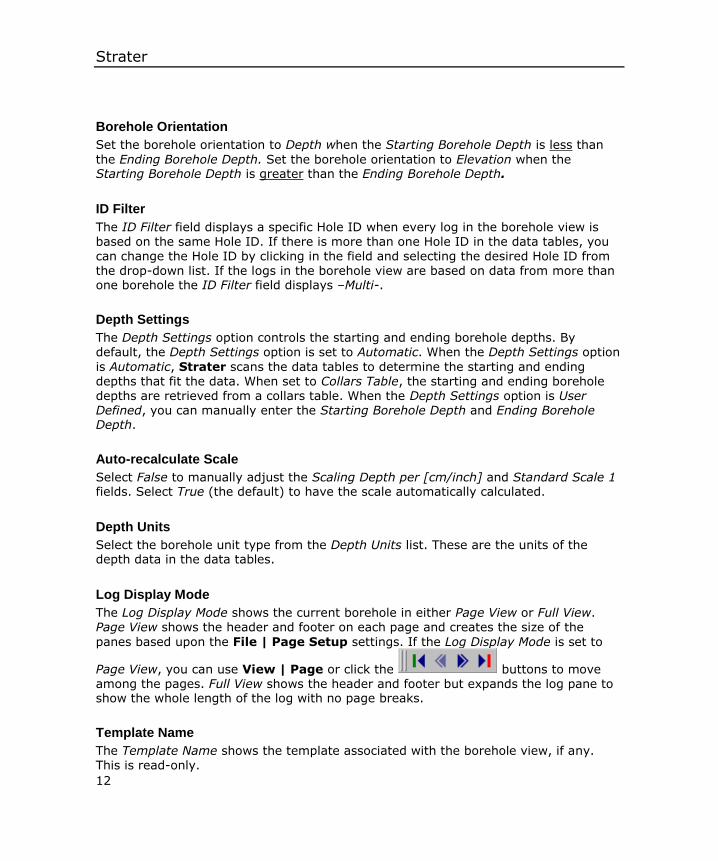
Borehole Orientation
Set the borehole orientation to Depth when the Starting Borehole Depth is less than
the Ending Borehole Depth. Set the borehole orientation to Elevation when the Starting Borehole Depth is greater than the Ending Borehole Depth.
ID Filter
The ID Filter field displays a specific Hole ID when every log in the borehole view is based on the same Hole ID. If there is more than one Hole ID in the data tables, you
can change the Hole ID by clicking in the field and selecting the desired Hole ID from the drop-down list. If the logs in the borehole view are based on data from more than one borehole the ID Filter field displays –Multi-.
Depth Settings
The Depth Settings option controls the starting and ending borehole depths. By default, the Depth Settings option is set to Automatic. When the Depth Settings option
is Automatic, Strater scans the data tables to determine the starting and ending depths that fit the data. When set to Collars Table, the starting and ending borehole depths are retrieved from a collars table. When the Depth Settings option is User Defined, you can manually enter the Starting Borehole Depth and Ending Borehole Depth.
Auto-recalculate Scale
Select False to manually adjust the Scaling Depth per [cm/inch] and Standard Scale 1 fields. Select True (the default) to have the scale automatically calculated.
Depth Units
Select the borehole unit type from the Depth Units list. These are the units of the depth data in the data tables.
Log Display Mode
The Log Display Mode shows the current borehole in either Page View or Full View. Page View shows the header and footer on each page and creates the size of the
panes based upon the File | Page Setup settings. If the Log Display Mode is set to
Page View, you can use View | Page or click the buttons to move among the pages. Full View shows the header and footer but expands the log pane to show the whole length of the log with no page breaks.
Template Name
The Template Name shows the template associated with the borehole view, if any.
This is read-only.
Quick Start Guide
13
Log, Header, and Footer Pane Line Properties
You can edit the log, header, and footer pane line properties in the Log Pane Line, Header Pane Line, and Footer Pane Line tabs.
Project Properties
The Project tab contains a NULL Value option, which is a number treated as missing data. This option allows you to store a null value with the Strater.sdg file, and this value can be different from the null value set in Tools | Options. This NULL Value setting overrides the Null Data Value in Tools | Options on the General page.
Schemes Schemes provide a mechanism to define various drawing properties, such as fill properties, that are matched to the data table information. For example, you may have the word "Granite" in a lithology keyword field. You can create a scheme containing a fill pattern, line pattern, contact line pattern, and keyword label text properties for granite. When the scheme is assigned to a lithology log, for example, every time the word "Granite" is used in the data table column, Strater uses the properties assigned in the scheme in the graphical borehole display.
Scheme Requirements
Some log items are dependent on schemes for display; for example, lithology and well construction logs require schemes. Other logs, such as bar logs, can optionally use schemes. The scheme keywords are case-sensitive, so it is advisable to have Strater automatically create the schemes using column data in the New Scheme dialog.
Data and Schemes
Since schemes are tied to the data, be sure to understand the log data requirements and column requirements for the associated schemes. For example, to use schemes with lithology logs, you must have specific keywords defined in specific columns.
Scheme Contents
The Scheme Editor dialog contains a list of the scheme types on the left, each of
which is indicated by the icon. If a scheme is included in this project there is a plus symbol next to the scheme type.
Strater
14
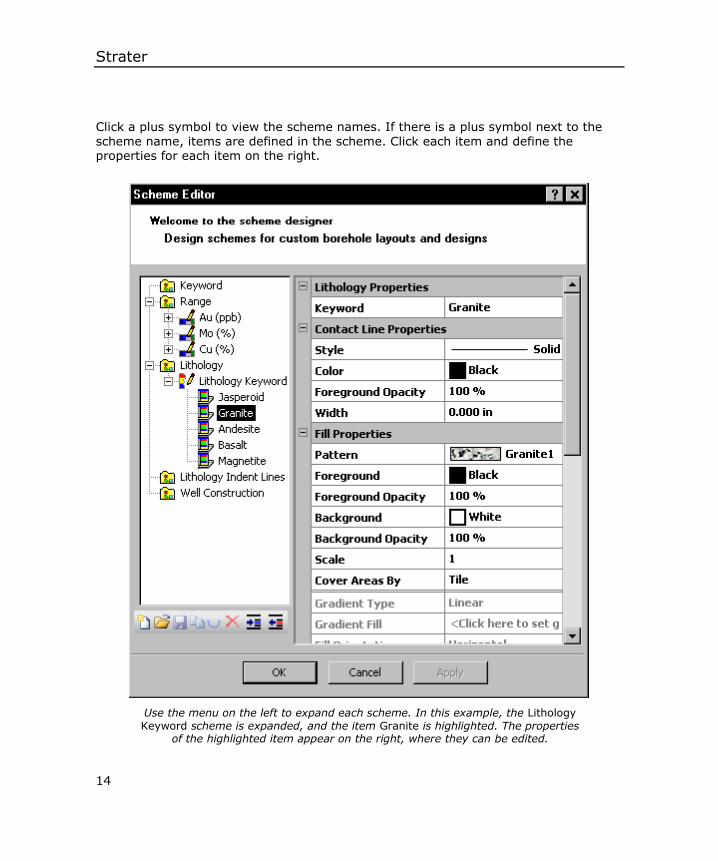
Click a plus symbol to view the scheme names. If there is a plus symbol next to the scheme name, items are defined in the scheme. Click each item and define the properties for each item on the right.
Use the menu on the left to expand each scheme. In this example, the Lithology
Keyword scheme is expanded, and the item Granite is highlighted. The properties of the highlighted item appear on the right, where they can be edited.
Quick Start Guide
15
Scheme Types
There are five main scheme types: keyword, range, lithology, lithology indent lines,
and well construction. The properties for each scheme item vary depending on the scheme type. Refer to the online help file for more details on each scheme type.
Opening the Scheme Editor
With a borehole view active, select Tools | Scheme Editor. In the Property
Manager, click to open the Scheme Editor, which is available in properties that
request schemes. You can also click to open the Scheme Editor.
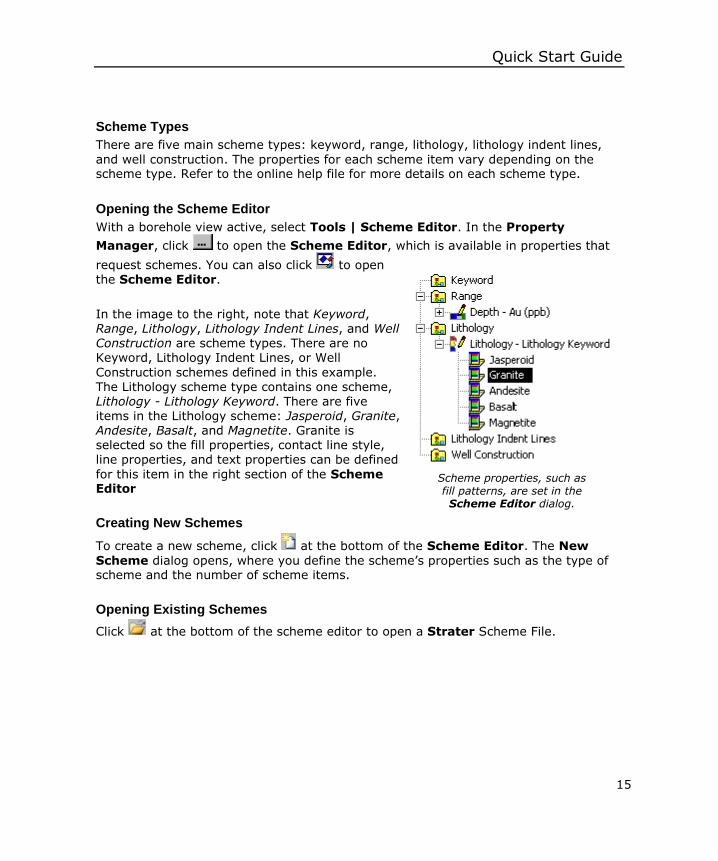
In the image to the right, note that Keyword, Range, Lithology, Lithology Indent Lines, and Well Construction are scheme types. There are no Keyword, Lithology Indent Lines, or Well
Construction schemes defined in this example. The Lithology scheme type contains one scheme, Lithology - Lithology Keyword. There are five items in the Lithology scheme: Jasperoid, Granite,
Andesite, Basalt, and Magnetite. Granite is selected so the fill properties, contact line style, line properties, and text properties can be defined
for this item in the right section of the Scheme Editor
Creating New Schemes
To create a new scheme, click at the bottom of the Scheme Editor. The New
Scheme dialog opens, where you define the scheme’s properties such as the type of scheme and the number of scheme items.
Opening Existing Schemes
Click at the bottom of the scheme editor to open a Strater Scheme File.
Scheme properties, such as fill patterns, are set in the Scheme Editor dialog.
Strater
16
Saving Schemes
If you would like to reuse schemes with other projects, or to share schemes with
colleagues, save the scheme by clicking the icon. The scheme is saved as a
Strater Scheme File (.sch).
Copying Schemes
You can copy a scheme by selecting a scheme name and clicking . A duplicate of the scheme appears in the scheme type list. You can edit the copy of the scheme,
including the scheme name and scheme item properties. If copy is disabled, you have not selected a scheme name.
Converting Schemes
Click to convert a lithology scheme to a keyword scheme and vice-versa. This option is active only when a lithology or keyword scheme is selected. This is useful if you wish to reuse schemes for different log types without the necessity of recreating complex schemes.
Deleting Schemes
You can delete a scheme by clicking a scheme name and clicking . If the delete
option is disabled, you have not selected a scheme name.
Insert and Delete Items
Select an item within a scheme and click to delete it. Insert a new item by clicking
when an item is selected. If the options are disabled, you have not selected a
scheme item.
Updating Schemes
If you have made a change to a scheme after it has been applied to a log, you can click Apply to show the changes in the borehole view.
Templates Once a borehole is designed you can reuse the design by saving it as a template. Templates allow you to create, save, and load borehole designs to be reused in other
projects or by other Strater users. Template files store the borehole views, the data tables, and the schemes, but without any actual data in the data tables. Template files (.tsf) are stand-alone files from the main project files (.sdg).
Quick Start Guide
17
Creating Templates
Templates can be created by either opening an existing project and saving it as a template, or starting with an empty borehole view, creating the borehole design and saving it as a template.
You can open a new, empty borehole view by:
Selecting File | New | Borehole View.
Clicking the icon.
Right-clicking in the Borehole Manager and selecting New.
When the borehole view opens, design the borehole by adding objects to the header, log, and footer panes. If you do not have data for the logs, you can design the borehole view in design mode.
Saving Templates
You can save templates from either the active or design modes. A saved template is stored in the exact format in which it was saved. Once the borehole is designed either:
Select File | Save As to save a template file (.tsf).
In the Borehole Manager right-click and select Save Template; save it as a .tsf file.
Loading Templates
To load an existing template file click File | Open or right-click in the Borehole Manager and select Load Template. Templates are loaded into a new borehole view and the data tables are automatically created. When the template is loaded you can import data into the data tables, edit log item properties to reflect the data, and create additional objects if necessary.
Once a template has been loaded into a borehole view the appearance of the borehole
view remains unchanged if the original source template is changed elsewhere. In order
to use any changes made to the original template you must open that template into a new borehole view.
Only one template can be used in each borehole view. However, you can open multiple templates into multiple borehole views and save them all in a single project file.
Template Information
If there is a template associated with a borehole view it is listed in Borehole View Properties. If the Template Name field is blank a template is not used for this borehole view.
Strater
18
Data Tables The data tables are the source for the information used to create objects and logs in a borehole view. You can base different logs on the same data table and modify the appearance of each log individually without changing the data table itself.
Table Types There are four main data table types in Strater: collars, text, depth, and interval. There are also some specialized tables based on the four main table types: lithology, project settings, and well construction.
Collars Table
Collars tables contain location information for each borehole. The default column definitions include Hole ID, Starting Depth, Ending Depth, Elevation, Easting, Northing, and Scale. The data in this table is usually used for header and footer linked text. It
can also be used to set the scaling parameters for the borehole view, or specify the elevation of the well collar for depth logs.
Text Table
Text tables are blank tables designed to store attributes for the particular borehole; for example, drilling date, temperature, geologist, location, etc. Any type of data can be imported into this table. If there is a Hole ID defined in the table, the data can be used for header and footer linked text.
Depth Table
Depth tables are used for depth and variable information. The depth information is contained in one column. Depth tables are used for bar, classed post, crossplot, line/symbol, percentage, and post logs.
Interval Table
Interval tables are used to show a variable that occurs over a distance interval. There are two depth columns (From and To) in interval tables. Interval tables are used for bar, classed post, complex text, crossplot, graphic, lithology, line/symbol, percentage, post, well construction, and zone bar logs.
Lithology Table
Lithology tables are a special type of interval table. These tables define the properties of lithology logs using schemes. Lithology tables are also used with complex text, graphic, and zone bars logs. When creating a lithology log in active mode, a lithology
table is created. The default column definitions include Hole ID, From, To, Lithology Keyword, Lithology Description, Indent Percentage, Indent Keyword, and Indent Scale.
Quick Start Guide
19
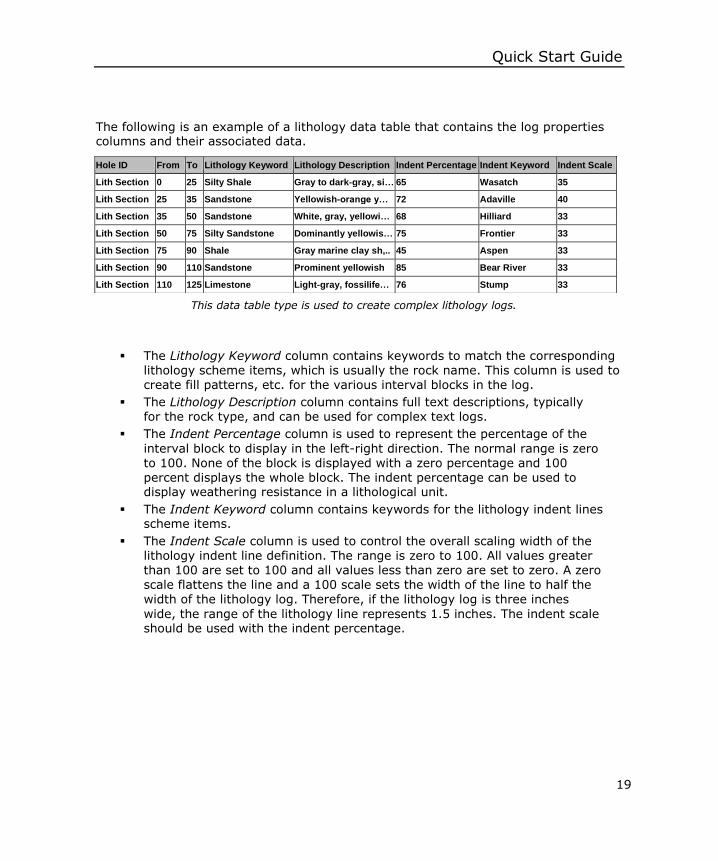
The following is an example of a lithology data table that contains the log properties columns and their associated data.
The Lithology Keyword column contains keywords to match the corresponding lithology scheme items, which is usually the rock name. This column is used to create fill patterns, etc. for the various interval blocks in the log.
The Lithology Description column contains full text descriptions, typically for the rock type, and can be used for complex text logs.
The Indent Percentage column is used to represent the percentage of the
interval block to display in the left-right direction. The normal range is zero to 100. None of the block is displayed with a zero percentage and 100 percent displays the whole block. The indent percentage can be used to display weathering resistance in a lithological unit.
The Indent Keyword column contains keywords for the lithology indent lines scheme items.
The Indent Scale column is used to control the overall scaling width of the lithology indent line definition. The range is zero to 100. All values greater than 100 are set to 100 and all values less than zero are set to zero. A zero scale flattens the line and a 100 scale sets the width of the line to half the
width of the lithology log. Therefore, if the lithology log is three inches
wide, the range of the lithology line represents 1.5 inches. The indent scale should be used with the indent percentage.
Hole ID From To Lithology Keyword Lithology Description Indent Percentage Indent Keyword Indent Scale
Lith Section 0 25 Silty Shale Gray to dark-gray, si… 65 Wasatch 35
Lith Section 25 35 Sandstone Yellowish-orange y… 72 Adaville 40
Lith Section 35 50 Sandstone White, gray, yellowi… 68 Hilliard 33
Lith Section 50 75 Silty Sandstone Dominantly yellowis… 75 Frontier 33
Lith Section 75 90 Shale Gray marine clay sh,.. 45 Aspen 33
Lith Section 90 110 Sandstone Prominent yellowish 85 Bear River 33
Lith Section 110 125 Limestone Light-gray, fossilife… 76 Stump 33
This data table type is used to create complex lithology logs.
Strater
20
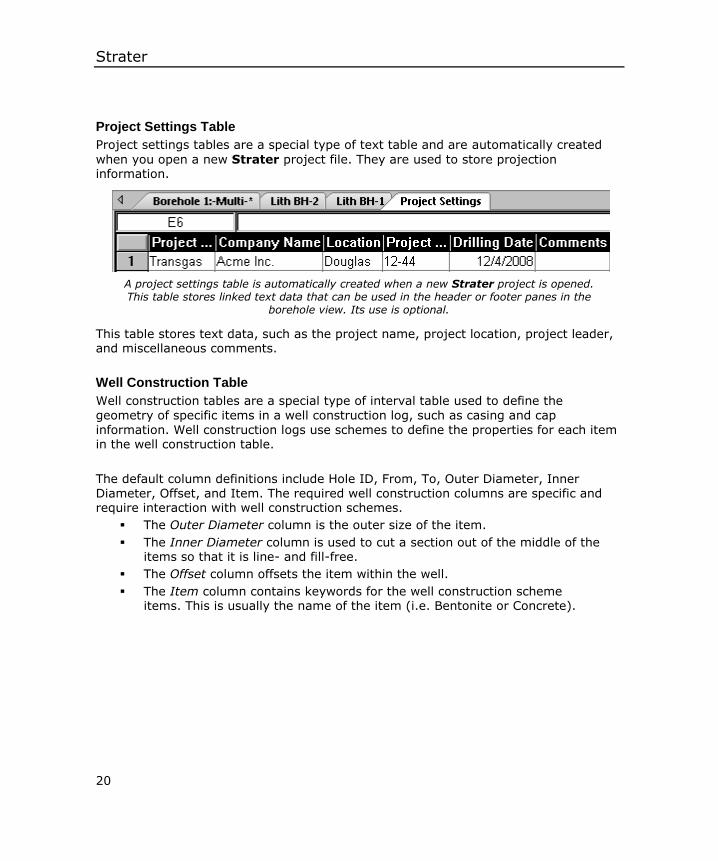
Project Settings Table
Project settings tables are a special type of text table and are automatically created
when you open a new Strater project file. They are used to store projection information.
This table stores text data, such as the project name, project location, project leader, and miscellaneous comments.
Well Construction Table
Well construction tables are a special type of interval table used to define the geometry of specific items in a well construction log, such as casing and cap
information. Well construction logs use schemes to define the properties for each item in the well construction table.
The default column definitions include Hole ID, From, To, Outer Diameter, Inner Diameter, Offset, and Item. The required well construction columns are specific and require interaction with well construction schemes.
The Outer Diameter column is the outer size of the item.
The Inner Diameter column is used to cut a section out of the middle of the items so that it is line- and fill-free.
The Offset column offsets the item within the well.
The Item column contains keywords for the well construction scheme items. This is usually the name of the item (i.e. Bentonite or Concrete).
A project settings table is automatically created when a new Strater project is opened. This table stores linked text data that can be used in the header or footer panes in the
borehole view. Its use is optional.
Quick Start Guide
21
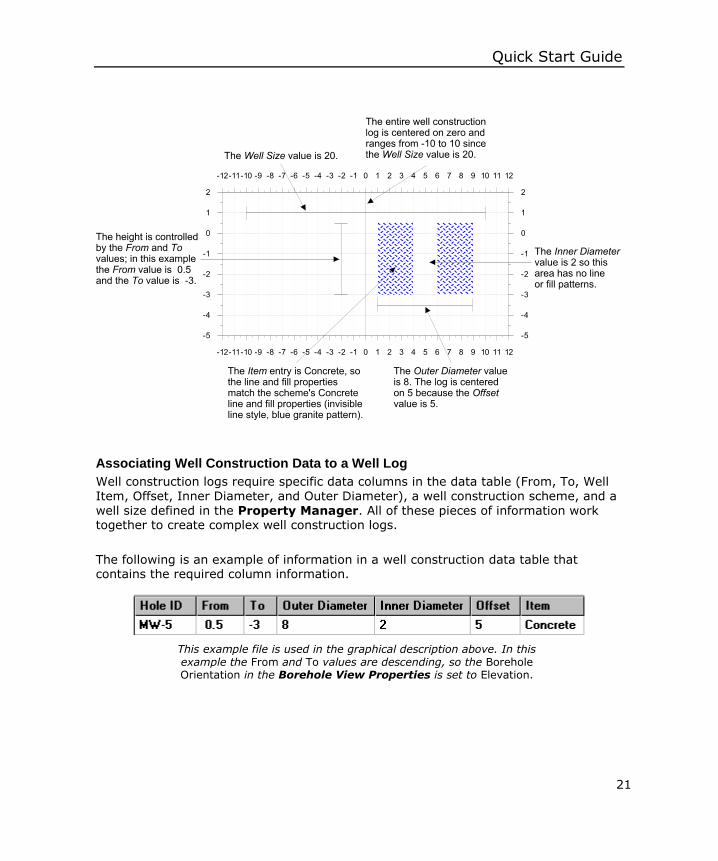
Associating Well Construction Data to a Well Log
Well construction logs require specific data columns in the data table (From, To, Well Item, Offset, Inner Diameter, and Outer Diameter), a well construction scheme, and a well size defined in the Property Manager. All of these pieces of information work together to create complex well construction logs.
The following is an example of information in a well construction data table that contains the required column information.
This example file is used in the graphical description above. In this example the From and To values are descending, so the Borehole Orientation in the Borehole View Properties is set to Elevation.
Strater
22
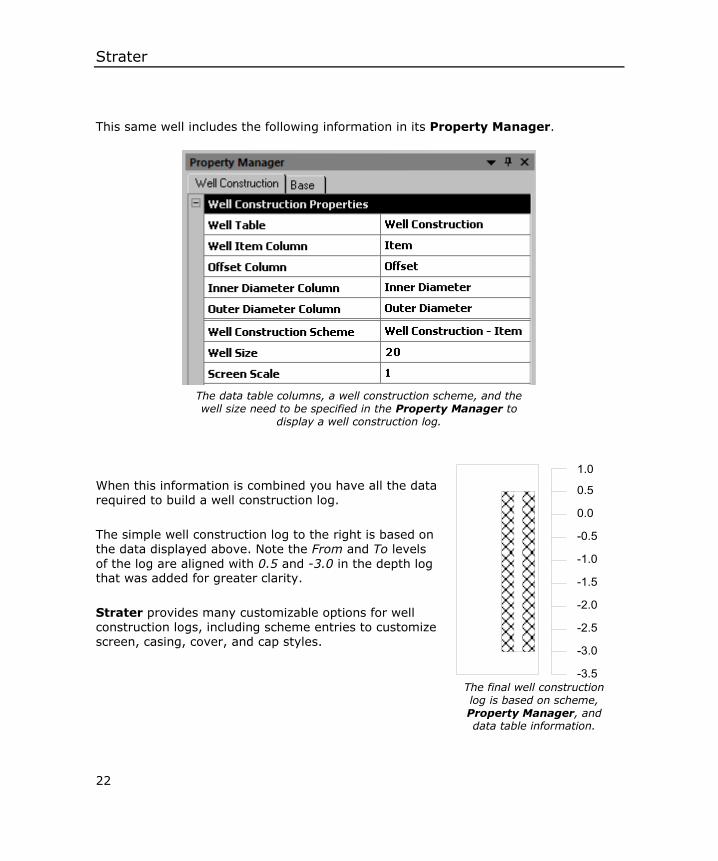
This same well includes the following information in its Property Manager.
When this information is combined you have all the data required to build a well construction log.
The simple well construction log to the right is based on the data displayed above. Note the From and To levels
of the log are aligned with 0.5 and -3.0 in the depth log that was added for greater clarity.
Strater provides many customizable options for well construction logs, including scheme entries to customize screen, casing, cover, and cap styles.
The data table columns, a well construction scheme, and the well size need to be specified in the Property Manager to
display a well construction log.
The final well construction log is based on scheme, Property Manager, and data table information.
Quick Start Guide
23
Project Data All data represented in boreholes reside in data tables and must be in column and row format. You can load data into a new table, load data into an existing table, or manually enter data into an existing table within a Strater project. Each log type requires specific setup requirements for their associated data table; please see the online help topic Data Formatting Requirements for Log Types for detailed information.
File Formats Strater can read numerous file formats, such as data files (including Excel spreadsheets, LAS files, and ASCII text files) and databases. Strater can also link to virtually any database system installed on your computer using the Data link source in the Open dialog during data import. To link to a database click Load Database in the Open dialog. Use the four tabbed pages on the Data Link Properties dialog to select the data type in the connection and establish the connection to the database.
Loading Data
With a data table tab active, select File | Load Data or click . Use the Look In field
to locate the desired file to download. Select the data file and click Open. The data is opened into a new data table.
To load the data to an existing data table in the project, click on that data table tab to
make it active. Select File | Load Data or click . Use the Look In field to locate the desired file to download. Select the data file and check the Import data into current table checkbox. Click Open and the data is added to the active table.
Creating New Tables and Data Although new data tables are automatically created when you load data, you can also create a blank table.
1. With a data tab active, select File | New | Table or click . The Create New Table dialog opens.
2. Enter a Table Name.
3. Select the table type from the Base Table Type drop-down list.
4. Click Create. A blank data table appears in the project tabs with the required columns associated with the selected base table type.
Strater
24
5. Enter data manually, either by typing data in each cell or cutting and pasting data across multiple rows and columns. Make sure that the pasted data conforms to the columns in the table. Alternatively, you can load data into this table. See the Loading Data section above.
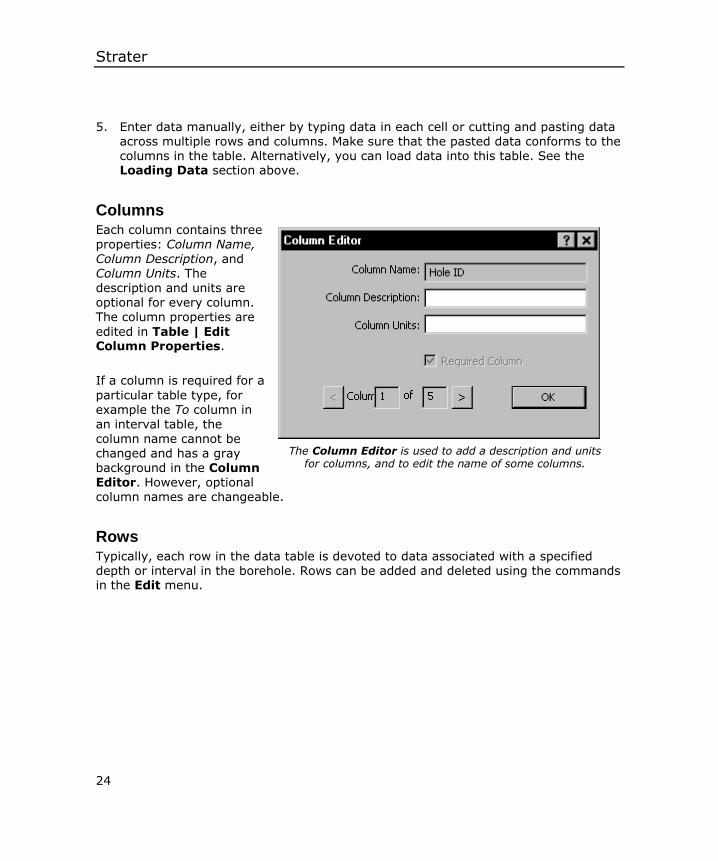
Columns Each column contains three properties: Column Name,
Column Description, and Column Units. The description and units are optional for every column. The column properties are
edited in Table | Edit Column Properties.
If a column is required for a
particular table type, for example the To column in
an interval table, the column name cannot be changed and has a gray background in the Column Editor. However, optional column names are changeable.
Rows Typically, each row in the data table is devoted to data associated with a specified depth or interval in the borehole. Rows can be added and deleted using the commands in the Edit menu.
The Column Editor is used to add a description and units for columns, and to edit the name of some columns.
Quick Start Guide
25
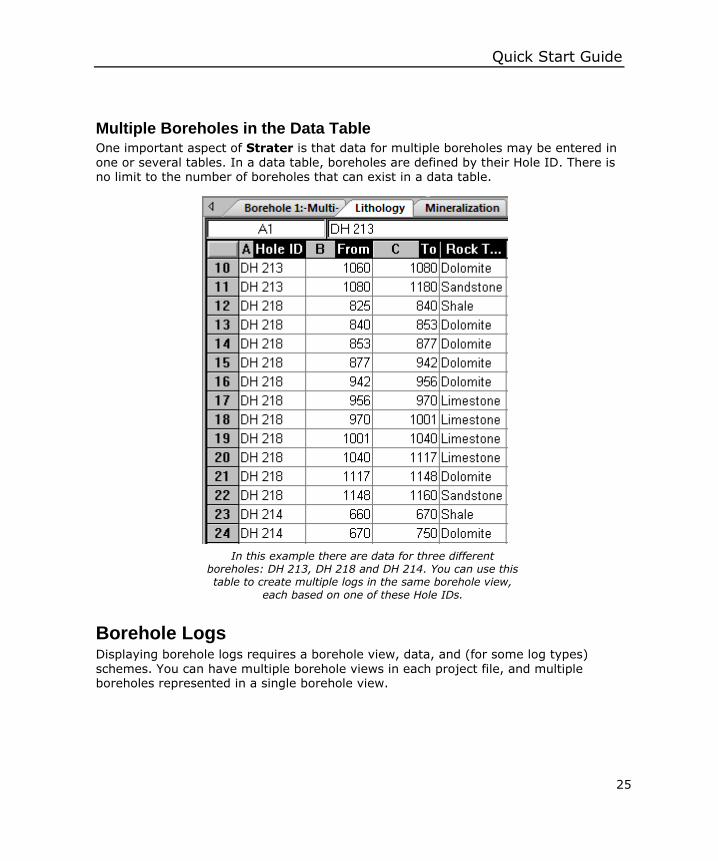
Multiple Boreholes in the Data Table One important aspect of Strater is that data for multiple boreholes may be entered in one or several tables. In a data table, boreholes are defined by their Hole ID. There is no limit to the number of boreholes that can exist in a data table.
Borehole Logs Displaying borehole logs requires a borehole view, data, and (for some log types) schemes. You can have multiple borehole views in each project file, and multiple boreholes represented in a single borehole view.
In this example there are data for three different boreholes: DH 213, DH 218 and DH 214. You can use this table to create multiple logs in the same borehole view,
each based on one of these Hole IDs.
Strater
26
Adding Logs to a Borehole View 1. With a borehole view active in the workspace either select Tools | Log Items |
[log type] or click the icon associated with the desired log item.
2. Move the cursor to the desired position in the log pane and click where the log should be displayed. Log items cannot be added to headers and footers panes. This action sets the location for the log in the view. You can change its location later.
3. After clicking in the log pane you are prompted to select data. You have two options for selecting data for this log:
a. Select a new data source via the Look In field in the Open dialog.
b. Associate the new log with existing data in the project. In the Use Current Table field use the drop-down list to select an existing data table.
4. Because Strater allows each log in a borehole view to represent a different Hole ID you must make sure that the new log is representing the desired borehole. Highlight the new log and click the Base tab in the Property Manager.
5. Select the desired Hole ID from the ID Filter drop-down list.
Adding Objects to a Borehole View An object is any log or drawing item that you can add to a borehole view. In this section we will discuss adding drawing objects to the view.
1. Select Draw | [drawing object] or click one of the drawing object icons.
2. Move the cursor to the borehole view and click in the location where you want the object to appear. This could be in any of the three panes.
3. Draw the item.
4. Use the information in the Strater online help to move and edit the object.
There is no limit to the number of objects that can appear in a borehole view.
Working in Design Mode If you are in design mode and have created a log in the borehole view, a graphical image appears for display purposes to represent the log. This graphic is just a place holder and is not related to real data. Refer to the online help file for information on linking data to the design.
Quick Start Guide
27
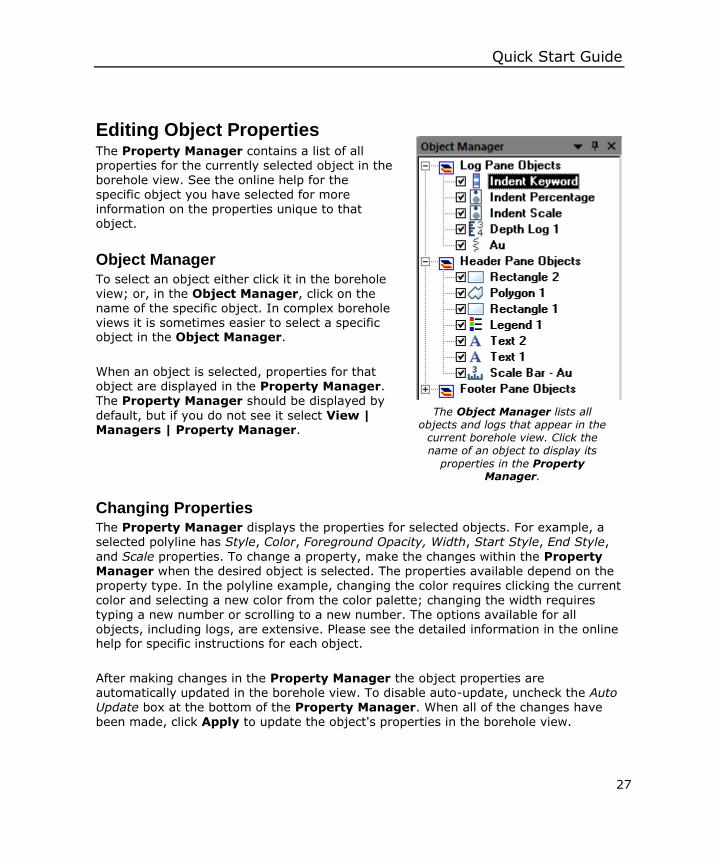
Editing Object Properties The Property Manager contains a list of all properties for the currently selected object in the borehole view. See the online help for the specific object you have selected for more information on the properties unique to that object.
Object Manager To select an object either click it in the borehole view; or, in the Object Manager, click on the name of the specific object. In complex borehole views it is sometimes easier to select a specific object in the Object Manager.
When an object is selected, properties for that object are displayed in the Property Manager. The Property Manager should be displayed by
default, but if you do not see it select View | Managers | Property Manager.
Changing Properties The Property Manager displays the properties for selected objects. For example, a selected polyline has Style, Color, Foreground Opacity, Width, Start Style, End Style,
and Scale properties. To change a property, make the changes within the Property Manager when the desired object is selected. The properties available depend on the property type. In the polyline example, changing the color requires clicking the current
color and selecting a new color from the color palette; changing the width requires typing a new number or scrolling to a new number. The options available for all objects, including logs, are extensive. Please see the detailed information in the online help for specific instructions for each object.
After making changes in the Property Manager the object properties are automatically updated in the borehole view. To disable auto-update, uncheck the Auto Update box at the bottom of the Property Manager. When all of the changes have been made, click Apply to update the object's properties in the borehole view.
The Object Manager lists all objects and logs that appear in the
current borehole view. Click the name of an object to display its
properties in the Property Manager.
Strater
28
Log Items The following log items are available in Strater.
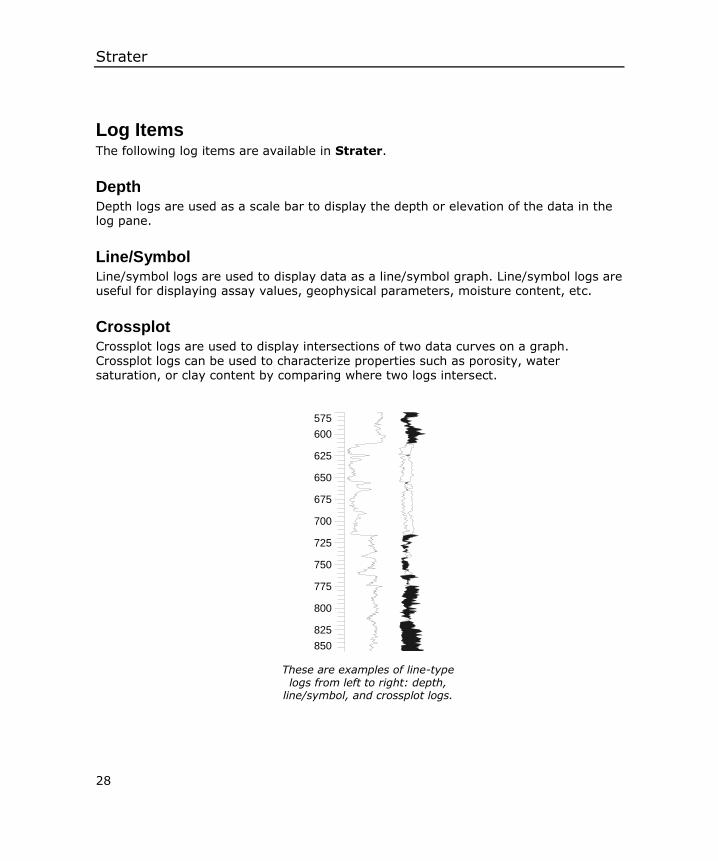
Depth Depth logs are used as a scale bar to display the depth or elevation of the data in the log pane.
Line/Symbol Line/symbol logs are used to display data as a line/symbol graph. Line/symbol logs are useful for displaying assay values, geophysical parameters, moisture content, etc.
Crossplot Crossplot logs are used to display intersections of two data curves on a graph. Crossplot logs can be used to characterize properties such as porosity, water saturation, or clay content by comparing where two logs intersect.
These are examples of line-type logs from left to right: depth,
line/symbol, and crossplot logs.
850
825
800
775
750
725
700
675
650
625
600
575
Crossplot Log 1
10
4.0
084
.00
64
.00
44
.00
24
.00
Line/Symbol Log 1
Quick Start Guide
29
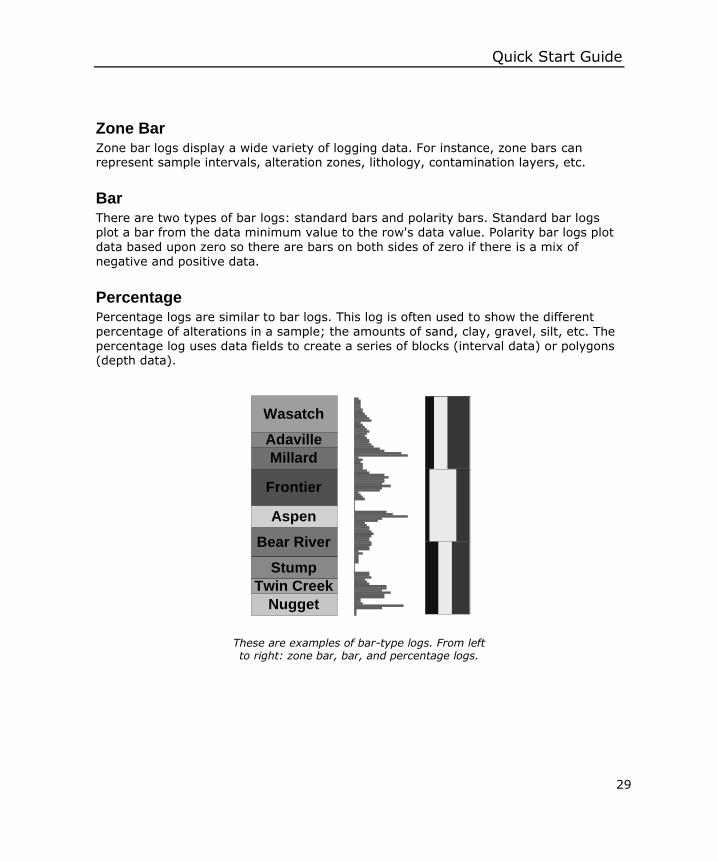
Zone Bar Zone bar logs display a wide variety of logging data. For instance, zone bars can represent sample intervals, alteration zones, lithology, contamination layers, etc.
Bar There are two types of bar logs: standard bars and polarity bars. Standard bar logs plot a bar from the data minimum value to the row's data value. Polarity bar logs plot data based upon zero so there are bars on both sides of zero if there is a mix of
negative and positive data.
Percentage Percentage logs are similar to bar logs. This log is often used to show the different percentage of alterations in a sample; the amounts of sand, clay, gravel, silt, etc. The percentage log uses data fields to create a series of blocks (interval data) or polygons (depth data).
These are examples of bar-type logs. From left to right: zone bar, bar, and percentage logs.
Wasatch
Adaville
Millard
Frontier
Aspen
Bear River
Stump
Twin Creek
Nugget
Strater
30
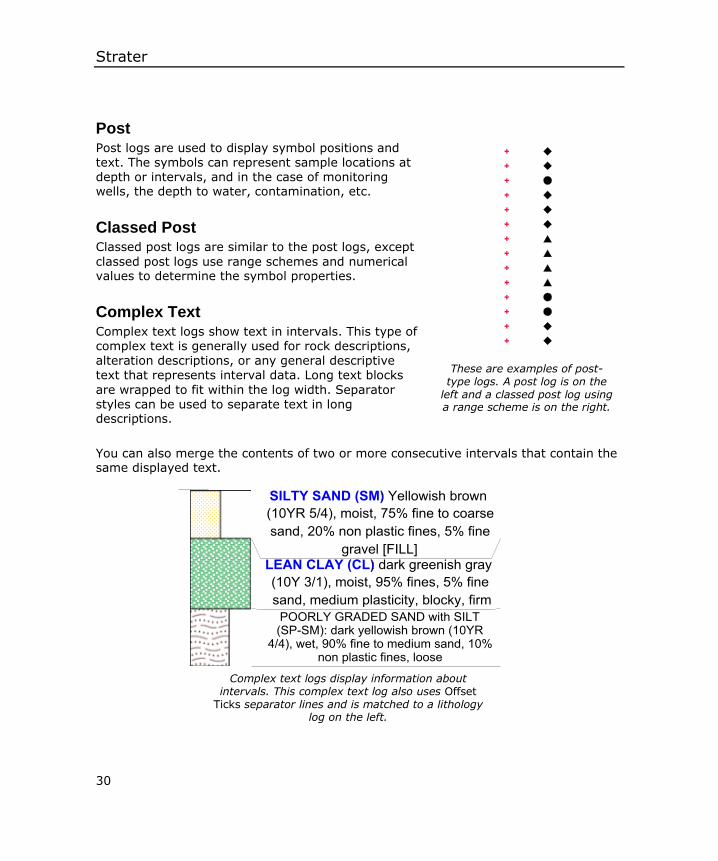
Post Post logs are used to display symbol positions and text. The symbols can represent sample locations at depth or intervals, and in the case of monitoring wells, the depth to water, contamination, etc.
Classed Post Classed post logs are similar to the post logs, except
classed post logs use range schemes and numerical values to determine the symbol properties.
Complex Text Complex text logs show text in intervals. This type of complex text is generally used for rock descriptions, alteration descriptions, or any general descriptive text that represents interval data. Long text blocks
are wrapped to fit within the log width. Separator styles can be used to separate text in long descriptions.
You can also merge the contents of two or more consecutive intervals that contain the same displayed text.
These are examples of post-type logs. A post log is on the
left and a classed post log using a range scheme is on the right.
Complex text logs display information about intervals. This complex text log also uses Offset
Ticks separator lines and is matched to a lithology log on the left.
Quick Start Guide
31
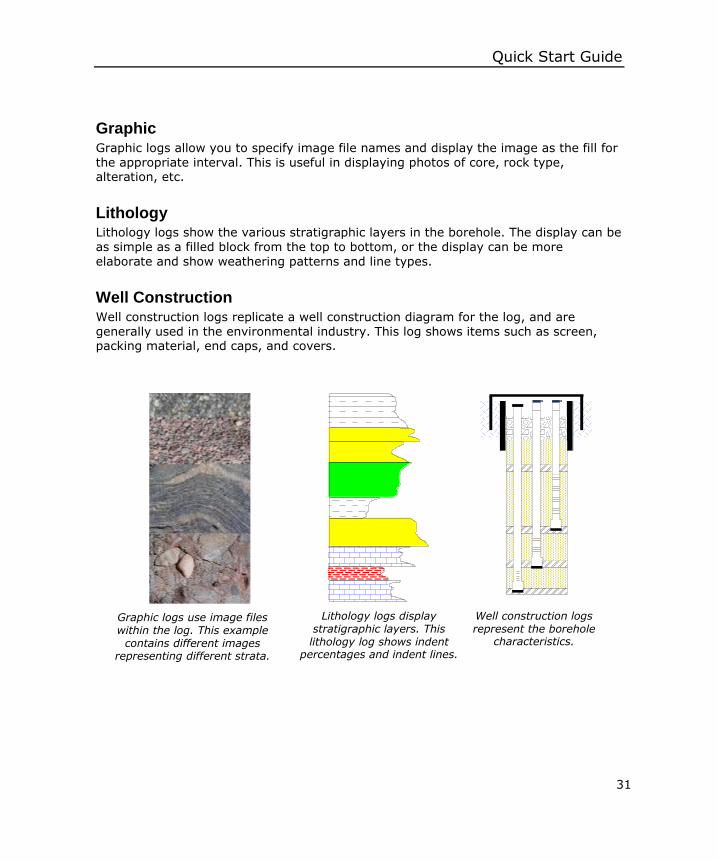
Graphic Graphic logs allow you to specify image file names and display the image as the fill for the appropriate interval. This is useful in displaying photos of core, rock type, alteration, etc.
Lithology Lithology logs show the various stratigraphic layers in the borehole. The display can be as simple as a filled block from the top to bottom, or the display can be more
elaborate and show weathering patterns and line types.
Well Construction Well construction logs replicate a well construction diagram for the log, and are generally used in the environmental industry. This log shows items such as screen, packing material, end caps, and covers.
Lithology logs display stratigraphic layers. This lithology log shows indent
percentages and indent lines.
Graphic logs use image files within the log. This example
contains different images representing different strata.
Well construction logs represent the borehole
characteristics.
Strater
32
Drawing Objects You can draw text, polygons, polylines, symbols, rectangles, rounded rectangles, and
ellipses in Strater's header, footer, and log panes. In addition to these drawing objects you can import graphics, link text to a data table, add scale bars for log items, and add legends for scheme data.
Imported Objects Imported objects are generally used to display information such as company logos, location maps, or other graphic images. You can import images, metafiles, and vector files and can place them anywhere in the borehole view.
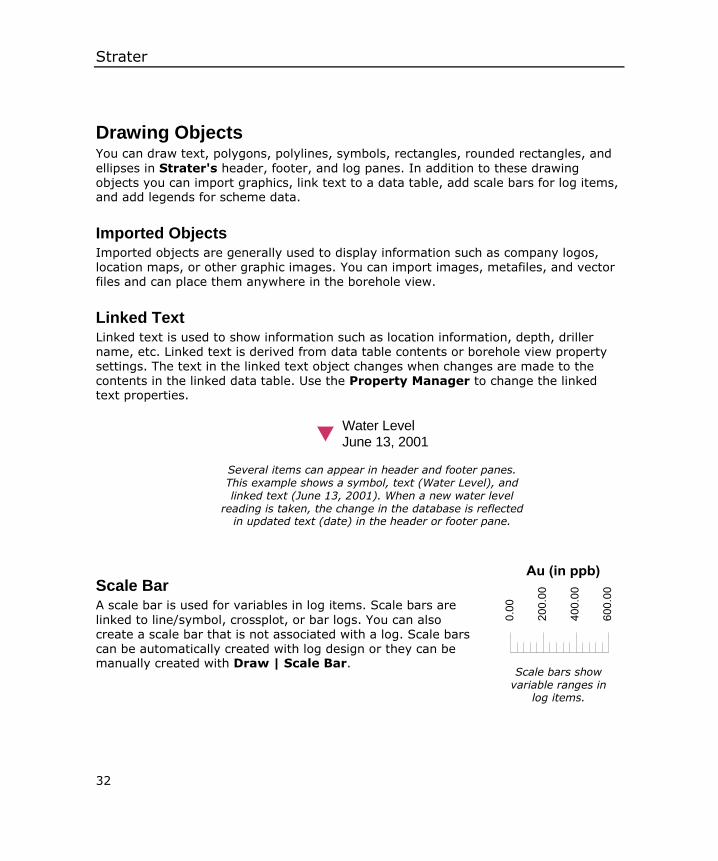
Linked Text Linked text is used to show information such as location information, depth, driller name, etc. Linked text is derived from data table contents or borehole view property settings. The text in the linked text object changes when changes are made to the contents in the linked data table. Use the Property Manager to change the linked text properties.
Scale Bar A scale bar is used for variables in log items. Scale bars are
linked to line/symbol, crossplot, or bar logs. You can also create a scale bar that is not associated with a log. Scale bars can be automatically created with log design or they can be manually created with Draw | Scale Bar.
Water LevelJune 13, 2001
Several items can appear in header and footer panes. This example shows a symbol, text (Water Level), and linked text (June 13, 2001). When a new water level
reading is taken, the change in the database is reflected in updated text (date) in the header or footer pane.
Scale bars show variable ranges in
log items.
Quick Start Guide
33
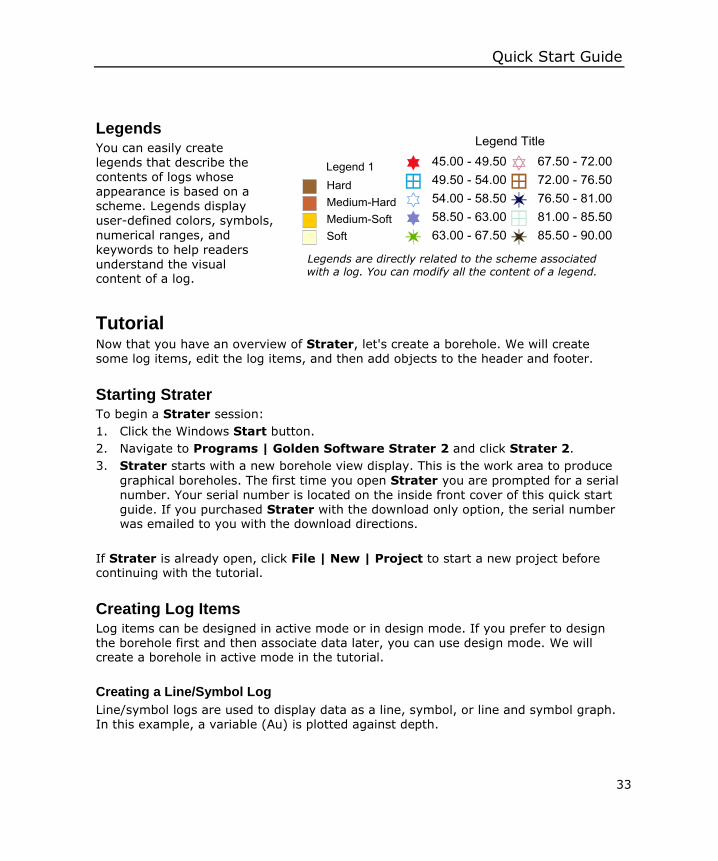
Legends You can easily create legends that describe the contents of logs whose appearance is based on a scheme. Legends display user-defined colors, symbols,
numerical ranges, and keywords to help readers
understand the visual content of a log.
Tutorial Now that you have an overview of Strater, let's create a borehole. We will create some log items, edit the log items, and then add objects to the header and footer.
Starting Strater To begin a Strater session:
1. Click the Windows Start button.
2. Navigate to Programs | Golden Software Strater 2 and click Strater 2.
3. Strater starts with a new borehole view display. This is the work area to produce
graphical boreholes. The first time you open Strater you are prompted for a serial number. Your serial number is located on the inside front cover of this quick start guide. If you purchased Strater with the download only option, the serial number was emailed to you with the download directions.
If Strater is already open, click File | New | Project to start a new project before continuing with the tutorial.
Creating Log Items Log items can be designed in active mode or in design mode. If you prefer to design the borehole first and then associate data later, you can use design mode. We will create a borehole in active mode in the tutorial.
Creating a Line/Symbol Log
Line/symbol logs are used to display data as a line, symbol, or line and symbol graph. In this example, a variable (Au) is plotted against depth.
Legends are directly related to the scheme associated with a log. You can modify all the content of a legend.
Strater
34
To create a line/symbol log:
1. Select Tools | Log Items | Line/Symbol. Alternatively, you can click .
2. Click near the center of the log pane because we will position the log item more exactly later. The Open dialog appears.
3. Browse to Strater's SAMPLES folder. The folder is typically in the installation folder for the Strater software. The default directory path is C:\Program Files\Golden Software\Strater 2\Samples.
4. Double-click the TUTORIAL 1.XLS file to open. Alternatively, you can click the TUTORIAL 1.XLS file once and click Open.
5. The XLS Import Options dialog is displayed because there are two worksheets in the file. Select Depth and click OK.
6. In the Specify Worksheet Column Definitions dialog, check the Specify Column Header Row box. Checking this box means the information in the specified row is used for field names. The headers
(Hole ID, Depth, and Au) are located in the first row, which is the default row header box. If the headers were located in another row, you could enter another number to the right of the Specify Column Header Row
text. This dialog also allows you to limit the range of imported rows or enter new field titles.
7. Click Next to open the Specify Data Type and Column Positions dialog.
8. The table we are importing is a depth table because there is only one column of depth information. Select Depth (Single Depth) as the Data Type if it is not already selected.
9. Because our column names match the requested fields
(Hole ID and Depth), they are automatically entered into the Hole ID and Depth boxes in the Specify
Column Definitions group. You can choose new columns by clicking and
selecting a column from the drop-down list. Leave the column definitions at the defaults for this example.
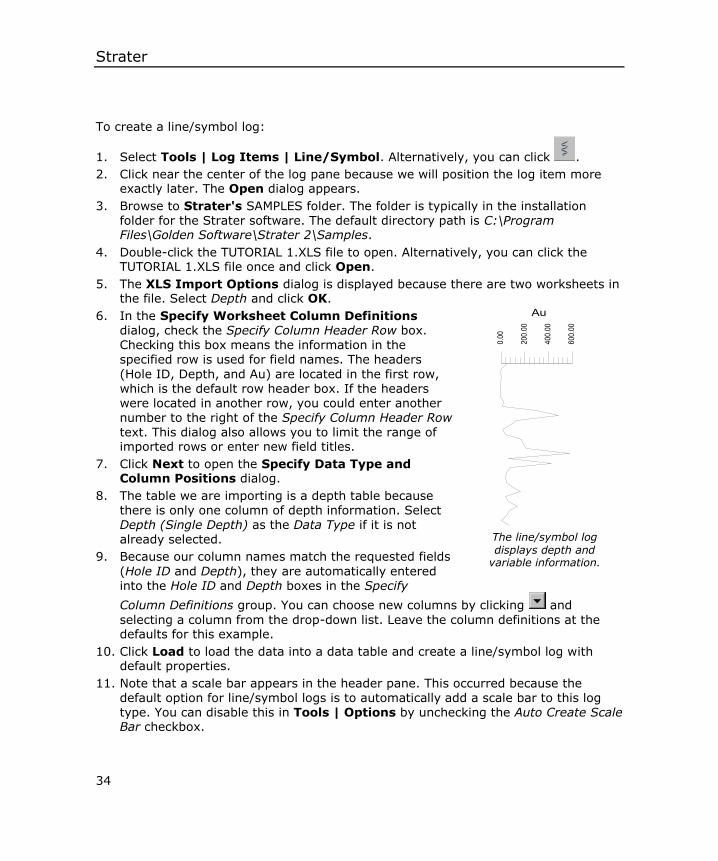
10. Click Load to load the data into a data table and create a line/symbol log with default properties.
11. Note that a scale bar appears in the header pane. This occurred because the default option for line/symbol logs is to automatically add a scale bar to this log type. You can disable this in Tools | Options by unchecking the Auto Create Scale Bar checkbox.
The line/symbol log displays depth and
variable information.
Quick Start Guide
35
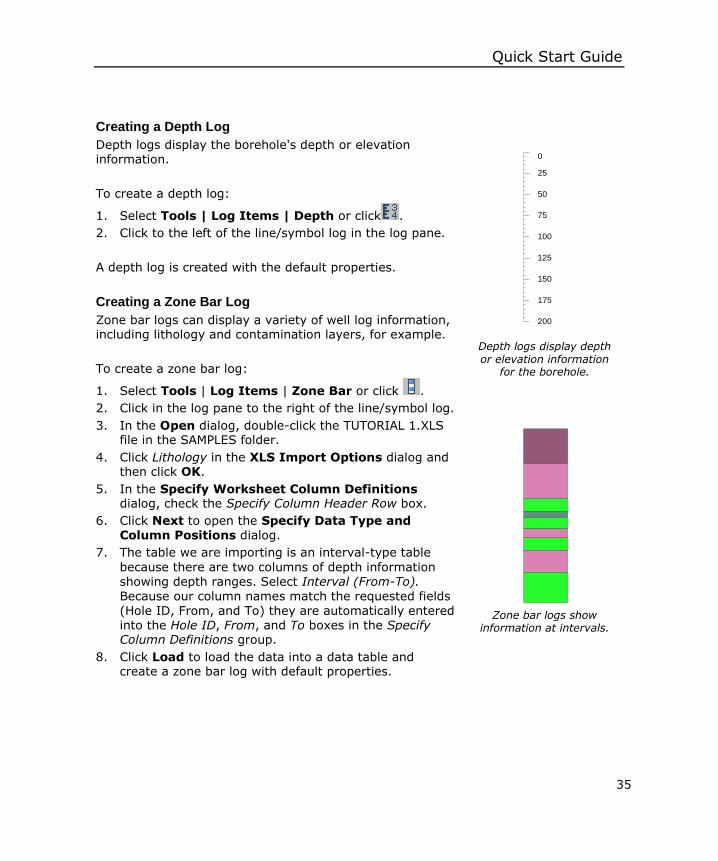
Creating a Depth Log
Depth logs display the borehole's depth or elevation information.
To create a depth log:
1. Select Tools | Log Items | Depth or click .
2. Click to the left of the line/symbol log in the log pane.
A depth log is created with the default properties.
Creating a Zone Bar Log
Zone bar logs can display a variety of well log information, including lithology and contamination layers, for example.
To create a zone bar log:
1. Select Tools | Log Items | Zone Bar or click .
2. Click in the log pane to the right of the line/symbol log.
3. In the Open dialog, double-click the TUTORIAL 1.XLS file in the SAMPLES folder.
4. Click Lithology in the XLS Import Options dialog and then click OK.
5. In the Specify Worksheet Column Definitions dialog, check the Specify Column Header Row box.
6. Click Next to open the Specify Data Type and Column Positions dialog.
7. The table we are importing is an interval-type table
because there are two columns of depth information showing depth ranges. Select Interval (From-To).
Because our column names match the requested fields (Hole ID, From, and To) they are automatically entered into the Hole ID, From, and To boxes in the Specify Column Definitions group.
8. Click Load to load the data into a data table and create a zone bar log with default properties.
200
175
150
125
100
75
50
25
0
Depth logs display depth or elevation information
for the borehole.
Zone bar logs show information at intervals.
Strater
36
Creating a Complex Text Log
Complex Text is text that is descriptive or longer than a simple title or mineral/formation name.
To create a complex text log:
1. Select Tools | Log Items | Complex Text or click .
2. Click inside the log pane to the right of the zone bar log.
3. In the Open dialog, select Lithology in the Use Current Table field and click Open.
Because the table we are going to use is already in the project there is no need to go through the import process again. A complex text log is created with the default properties.
Editing Log Properties The log properties are edited through the Property Manager. (If you do not see the Property Manager, click View | Managers | Property Manager.) When an object is selected, all of its properties appear in tabbed pages in the Property Manager.
Editing Log Item Positions
Position log items by selecting a log and dragging it to the left or right to a new location. More accurately position log items through the Property Manager or menu commands.
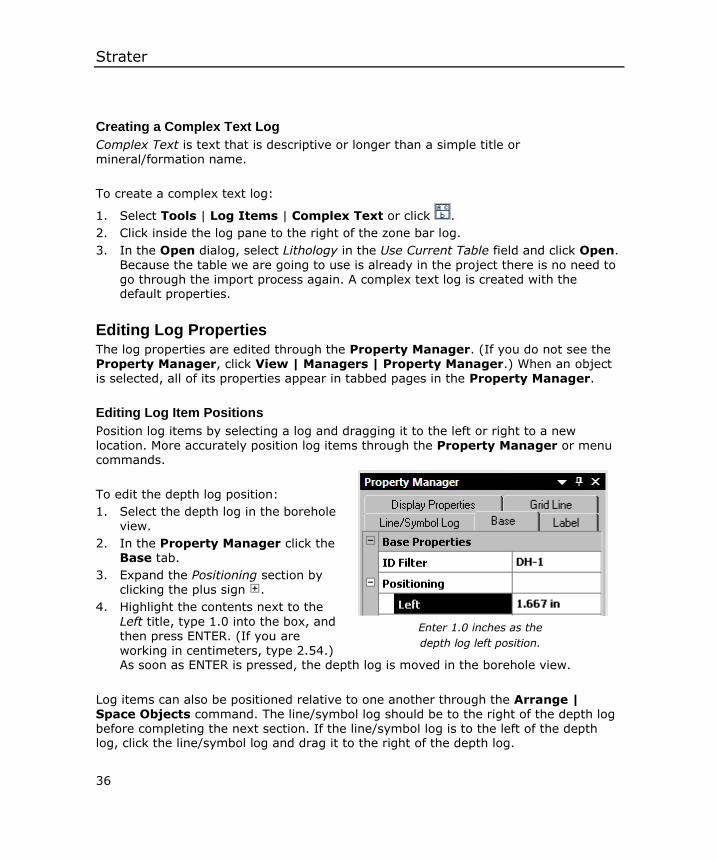
To edit the depth log position:
1. Select the depth log in the borehole view.
2. In the Property Manager click the Base tab.
3. Expand the Positioning section by clicking the plus sign .
4. Highlight the contents next to the
Left title, type 1.0 into the box, and then press ENTER. (If you are working in centimeters, type 2.54.) As soon as ENTER is pressed, the depth log is moved in the borehole view.
Log items can also be positioned relative to one another through the Arrange | Space Objects command. The line/symbol log should be to the right of the depth log before completing the next section. If the line/symbol log is to the left of the depth log, click the line/symbol log and drag it to the right of the depth log.
Enter 1.0 inches as the
depth log left position.
Quick Start Guide
37
To space the line/symbol log relative to the depth log:
1. Select the depth log and the line/symbol log. The easiest method of selecting both logs is through the Object Manager. In the Object Manager, click Depth Log 1, hold down the CTRL key on your keyboard, and then click Au.
2. Click Arrange | Space Objects | Right to Left. This aligns the left edge of the line/symbol log bounding box to the right edge of the depth log bounding box.
Editing Schemes
Zone bar logs use schemes to relate data table information to interval block properties, such as fill color. When a zone bar log is first created, a default scheme is
automatically created to fill the log. Create your own schemes by editing an existing scheme, by creating a new scheme from scratch, or by importing scheme files. When a scheme is created it can be used repeatedly. If you have many logs with the same properties, apply the log properties with a scheme instead of editing the properties for each log.
Schemes are optional with bar, classed post, post, and zone bar logs. Schemes are required with lithology, percentage, and well construction logs.
To create a new zone bar log scheme:
1. Select Tools | Scheme Editor or click . The Scheme Editor opens.
2. Click the button in the bottom left corner of the Scheme Editor dialog.
3. In the New Scheme dialog, select Base Scheme on Column Data.
4. Select Lithology in the Table Name list.
5. Select Lithology Keyword in the Column Name list.
6. Type Zone Scheme into the Scheme Name box.
7. Select Keyword as the Scheme Type.
8. Click OK to return to the Scheme Editor dialog.
When creating a keyword scheme based on a column, Strater searches for all unique
words in the Lithology Keyword column and determines the appropriate number of scheme items. There are five scheme items in this example.
In the Scheme Editor you can see the scheme types listed: Keyword, Range, Lithology, Lithology Indent Lines, and Well Construction. There are two schemes in the
Keyword group, Zone Scheme and Lithology:Indent Keyword. Lithology:Indent Keyword is the default scheme that was created when the zone bar log was created. Zone Scheme is the scheme we just created. We can edit each of the scheme items in the Zone Scheme to set properties for each keyword.
Strater
38
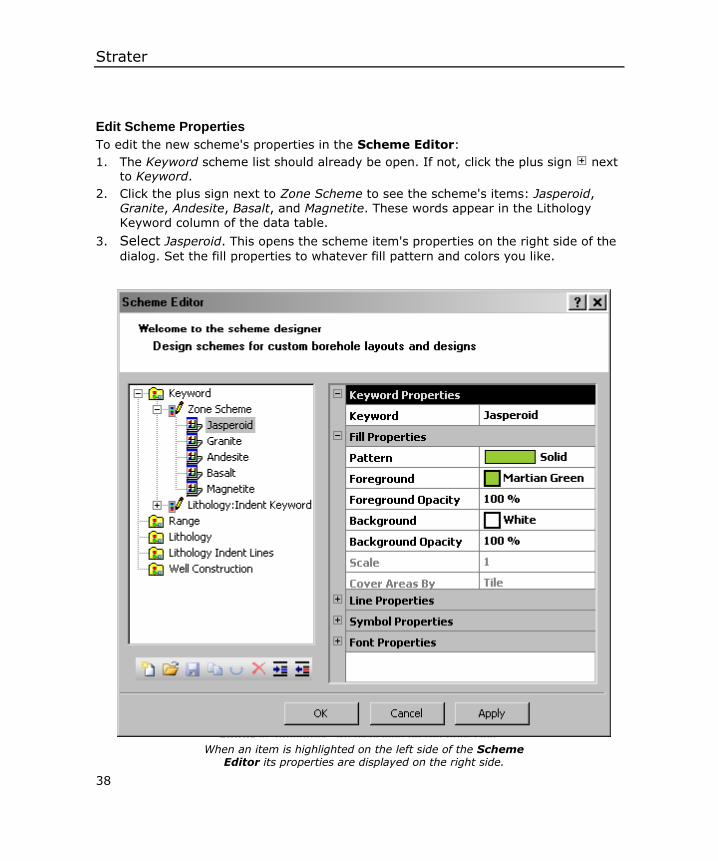
Edit Scheme Properties
To edit the new scheme's properties in the Scheme Editor:
1. The Keyword scheme list should already be open. If not, click the plus sign next to Keyword.
2. Click the plus sign next to Zone Scheme to see the scheme's items: Jasperoid, Granite, Andesite, Basalt, and Magnetite. These words appear in the Lithology Keyword column of the data table.
3. Select Jasperoid. This opens the scheme item's properties on the right side of the
dialog. Set the fill properties to whatever fill pattern and colors you like.
When an item is highlighted on the left side of the Scheme Editor its properties are displayed on the right side.
When an item is highlighted on the left side of the Scheme Editor its properties are displayed on the right side.
Quick Start Guide
39
4. Continue setting the fill patterns for each of the scheme items.
5. After setting the fill patterns, click OK in the Scheme Editor.
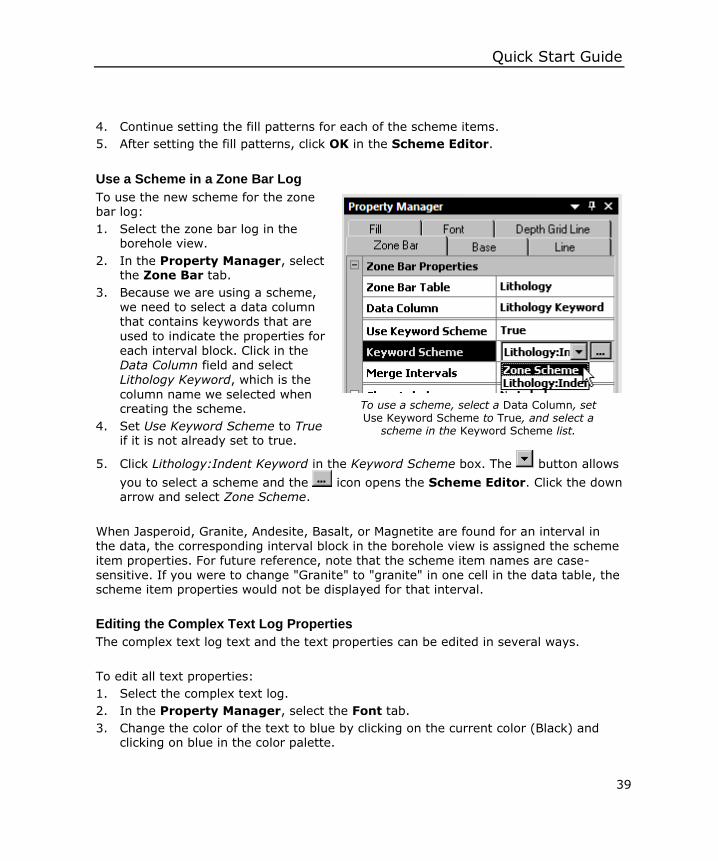
Use a Scheme in a Zone Bar Log
To use the new scheme for the zone bar log:
1. Select the zone bar log in the borehole view.
2. In the Property Manager, select the Zone Bar tab.
3. Because we are using a scheme, we need to select a data column that contains keywords that are used to indicate the properties for each interval block. Click in the Data Column field and select Lithology Keyword, which is the
column name we selected when creating the scheme.
4. Set Use Keyword Scheme to True if it is not already set to true.
5. Click Lithology:Indent Keyword in the Keyword Scheme box. The button allows
you to select a scheme and the icon opens the Scheme Editor. Click the down arrow and select Zone Scheme.
When Jasperoid, Granite, Andesite, Basalt, or Magnetite are found for an interval in the data, the corresponding interval block in the borehole view is assigned the scheme item properties. For future reference, note that the scheme item names are case-sensitive. If you were to change "Granite" to "granite" in one cell in the data table, the scheme item properties would not be displayed for that interval.
Editing the Complex Text Log Properties
The complex text log text and the text properties can be edited in several ways.
To edit all text properties:
1. Select the complex text log.
2. In the Property Manager, select the Font tab.
3. Change the color of the text to blue by clicking on the current color (Black) and clicking on blue in the color palette.
To use a scheme, select a Data Column, set Use Keyword Scheme to True, and select a
scheme in the Keyword Scheme list.
Strater
40
Changes in the Font Properties group are applied to all of the text in the complex text log.
You can also change the text properties and text contents of each individual text block.
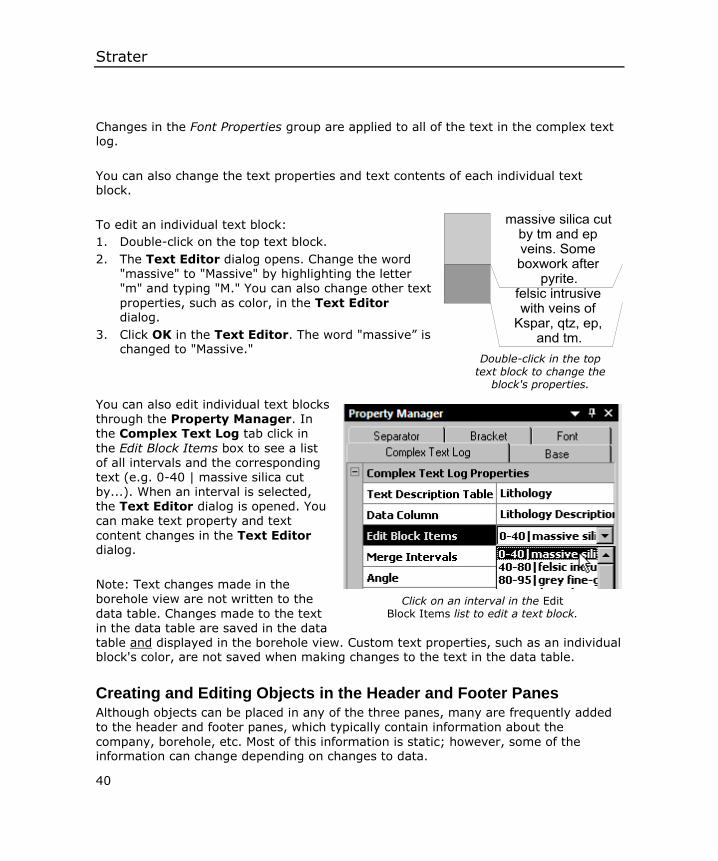
To edit an individual text block:
1. Double-click on the top text block.
2. The Text Editor dialog opens. Change the word "massive" to "Massive" by highlighting the letter "m" and typing "M." You can also change other text
properties, such as color, in the Text Editor dialog.
3. Click OK in the Text Editor. The word "massive” is changed to "Massive."
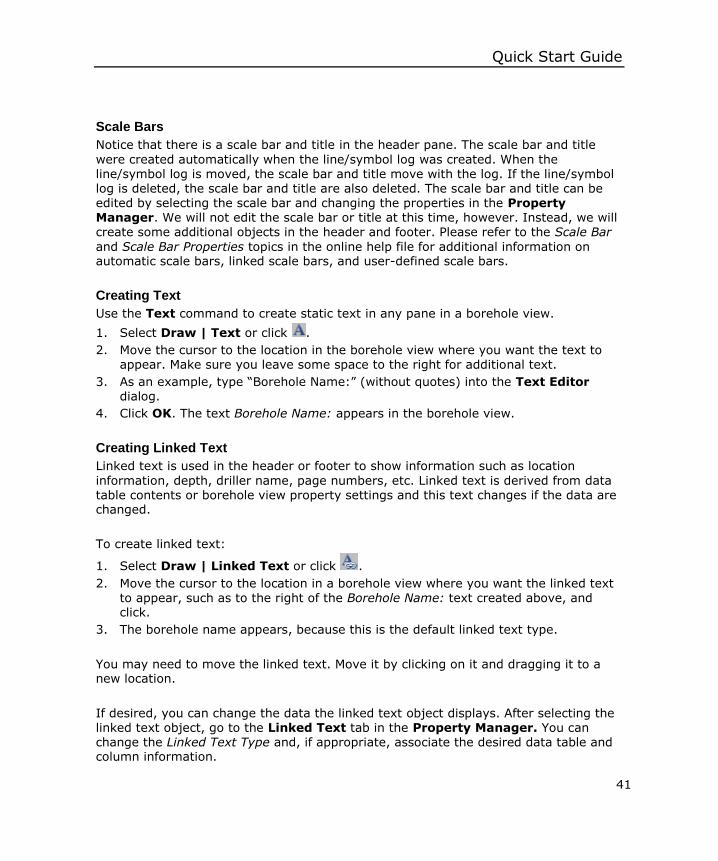
You can also edit individual text blocks through the Property Manager. In
the Complex Text Log tab click in
the Edit Block Items box to see a list of all intervals and the corresponding text (e.g. 0-40 | massive silica cut by...). When an interval is selected, the Text Editor dialog is opened. You can make text property and text
content changes in the Text Editor dialog.
Note: Text changes made in the
borehole view are not written to the
data table. Changes made to the text in the data table are saved in the data table and displayed in the borehole view. Custom text properties, such as an individual block's color, are not saved when making changes to the text in the data table.
Creating and Editing Objects in the Header and Footer Panes Although objects can be placed in any of the three panes, many are frequently added to the header and footer panes, which typically contain information about the
company, borehole, etc. Most of this information is static; however, some of the information can change depending on changes to data.
Double-click in the top text block to change the
block's properties.
Click on an interval in the Edit Block Items list to edit a text block.
Quick Start Guide
41
Scale Bars
Notice that there is a scale bar and title in the header pane. The scale bar and title
were created automatically when the line/symbol log was created. When the line/symbol log is moved, the scale bar and title move with the log. If the line/symbol log is deleted, the scale bar and title are also deleted. The scale bar and title can be edited by selecting the scale bar and changing the properties in the Property Manager. We will not edit the scale bar or title at this time, however. Instead, we will create some additional objects in the header and footer. Please refer to the Scale Bar
and Scale Bar Properties topics in the online help file for additional information on automatic scale bars, linked scale bars, and user-defined scale bars.
Creating Text
Use the Text command to create static text in any pane in a borehole view.
1. Select Draw | Text or click .
2. Move the cursor to the location in the borehole view where you want the text to appear. Make sure you leave some space to the right for additional text.
3. As an example, type “Borehole Name:” (without quotes) into the Text Editor dialog.
4. Click OK. The text Borehole Name: appears in the borehole view.
Creating Linked Text
Linked text is used in the header or footer to show information such as location
information, depth, driller name, page numbers, etc. Linked text is derived from data table contents or borehole view property settings and this text changes if the data are changed.
To create linked text:
1. Select Draw | Linked Text or click .
2. Move the cursor to the location in a borehole view where you want the linked text
to appear, such as to the right of the Borehole Name: text created above, and click.
3. The borehole name appears, because this is the default linked text type.
You may need to move the linked text. Move it by clicking on it and dragging it to a new location.
If desired, you can change the data the linked text object displays. After selecting the linked text object, go to the Linked Text tab in the Property Manager. You can change the Linked Text Type and, if appropriate, associate the desired data table and column information.
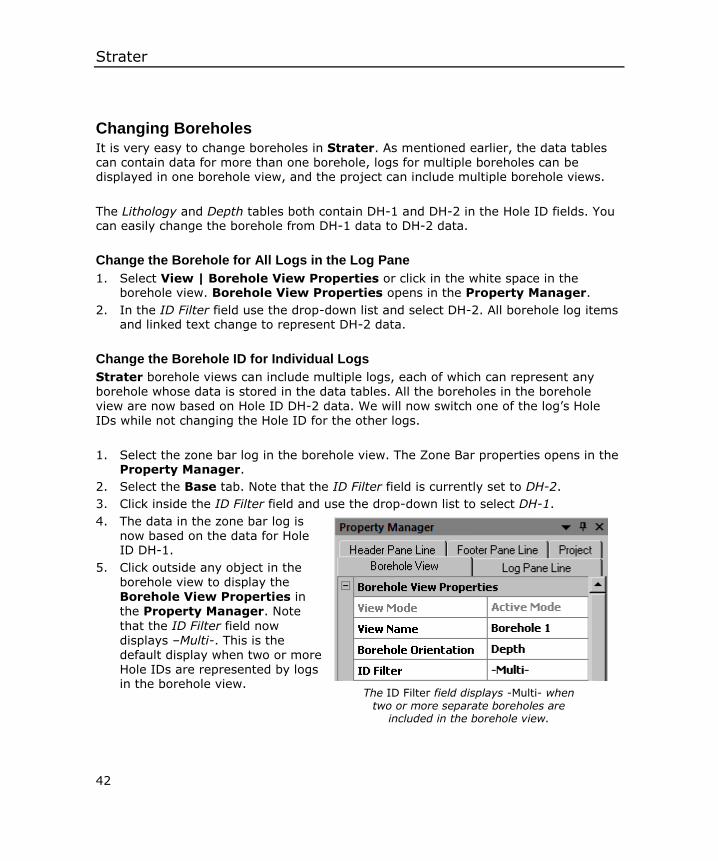
Strater
42
Changing Boreholes It is very easy to change boreholes in Strater. As mentioned earlier, the data tables can contain data for more than one borehole, logs for multiple boreholes can be displayed in one borehole view, and the project can include multiple borehole views.
The Lithology and Depth tables both contain DH-1 and DH-2 in the Hole ID fields. You can easily change the borehole from DH-1 data to DH-2 data.
Change the Borehole for All Logs in the Log Pane
1. Select View | Borehole View Properties or click in the white space in the borehole view. Borehole View Properties opens in the Property Manager.
2. In the ID Filter field use the drop-down list and select DH-2. All borehole log items and linked text change to represent DH-2 data.
Change the Borehole ID for Individual Logs
Strater borehole views can include multiple logs, each of which can represent any borehole whose data is stored in the data tables. All the boreholes in the borehole view are now based on Hole ID DH-2 data. We will now switch one of the log’s Hole IDs while not changing the Hole ID for the other logs.
1. Select the zone bar log in the borehole view. The Zone Bar properties opens in the Property Manager.
2. Select the Base tab. Note that the ID Filter field is currently set to DH-2.
3. Click inside the ID Filter field and use the drop-down list to select DH-1.
4. The data in the zone bar log is now based on the data for Hole ID DH-1.
5. Click outside any object in the borehole view to display the
Borehole View Properties in the Property Manager. Note
that the ID Filter field now displays –Multi-. This is the default display when two or more Hole IDs are represented by logs in the borehole view.
The ID Filter field displays -Multi- when two or more separate boreholes are
included in the borehole view.
Quick Start Guide
43
A Note about the Documentation The Strater documentation includes this quick start guide and the online help file, accessed by going to Help | Contents from within Strater. Information about each command and feature of Strater is included in the online help file. The online help file also includes advanced information such as overlaying log items and creating depth log lines that extend the width of the page. In the event the information you need is
not located in the online help file, other forms of Strater help include our support forum, knowledge base, FAQs, and technical support.
If you prefer printed documentation, the online help file can be printed in part or in full. See the Printing the Online Help section for more information.
Various font styles are used throughout the Strater documentation. Bold text indicates menu commands, dialog names, and page names. Italic text indicates items within a dialog such as group box names, options, and field names. For example, the
Save As dialog contains a Save as type drop-down list. Bold and italic text may occasionally be used for emphasis.
In addition, menu commands appear as Edit | Undo. This means, "click the Edit
menu at the top of the Strater window, then click Undo within the Edit menu list." The first word is always the menu name, followed by the commands within the menu list.
Printing the Online Help The online help topics may be printed. You can print part of the file or the complete file.
Printing One Topic To print one topic:
1. Open the topic you wish to print.
2. Click .
3. If the Contents page is open in the help navigation pane, you are prompted to Print the selected topic or Print the selected heading and all subtopics. Select Print the selected topic and click OK.
Printing One Section To print one section such as a tutorial:
1. Open the online help file by clicking Help | Contents in the Strater window.
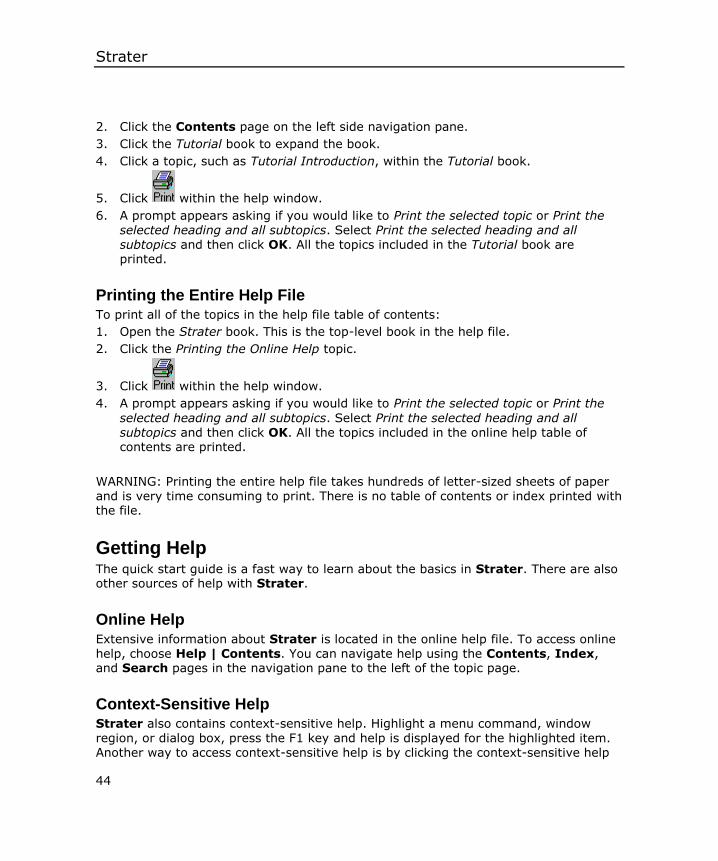
Strater
44
2. Click the Contents page on the left side navigation pane.
3. Click the Tutorial book to expand the book.
4. Click a topic, such as Tutorial Introduction, within the Tutorial book.
5. Click within the help window.
6. A prompt appears asking if you would like to Print the selected topic or Print the selected heading and all subtopics. Select Print the selected heading and all subtopics and then click OK. All the topics included in the Tutorial book are printed.
Printing the Entire Help File To print all of the topics in the help file table of contents:
1. Open the Strater book. This is the top-level book in the help file.
2. Click the Printing the Online Help topic.
3. Click within the help window.
4. A prompt appears asking if you would like to Print the selected topic or Print the
selected heading and all subtopics. Select Print the selected heading and all
subtopics and then click OK. All the topics included in the online help table of contents are printed.
WARNING: Printing the entire help file takes hundreds of letter-sized sheets of paper and is very time consuming to print. There is no table of contents or index printed with the file.
Getting Help The quick start guide is a fast way to learn about the basics in Strater. There are also other sources of help with Strater.
Online Help Extensive information about Strater is located in the online help file. To access online help, choose Help | Contents. You can navigate help using the Contents, Index, and Search pages in the navigation pane to the left of the topic page.
Context-Sensitive Help Strater also contains context-sensitive help. Highlight a menu command, window region, or dialog box, press the F1 key and help is displayed for the highlighted item. Another way to access context-sensitive help is by clicking the context-sensitive help

Quick Start Guide
45
icon . After clicking, the cursor appears with a ? next to it. Select the item for which help is desired with the modified cursor and a help window appears.
Internet There are several Internet help resources.
Click Forums in the online help to research a Strater question or to post a question.
Click Knowledge Base in the online help to research additional information in the online knowledge base.
Use the Help | Feedback commands to send a problem report, suggestion, or information request by email.
You can search the FAQs on our web page at www.goldensoftware.com. Direct links to the FAQs, the main Strater product page, and the Golden Software main website are available by selecting Help | Golden Software on the Web.
Technical Support Golden Software’s technical support is free to registered users of Golden Software products. Our technical support staff is trained to help you find answers to your
questions quickly and accurately. We are happy to answer any of your questions about any of our products, both before and after your purchase. We also welcome suggestions for improvements to our software and encourage you to contact us with any ideas you may have for adding new features and capabilities to our programs.
Technical support is available Monday through Friday 8:00 AM to 5:00 PM Mountain Time, excluding major United States holidays. We respond to email and fax technical questions within one business day. When contacting us with your question, have the following information available:
Your Strater serial number (located in the front cover of the quick start guide or in Help | About Strater).
Your Strater version number, found in Help | About Strater.
The operating system you are using (Windows XP, Vista, or 7).
The exact wording of the first error message that appears (if any).
Contact Information Telephone: 303-279-1021
Fax: 303-279-0909
Email: [email protected]
Web: www.goldensoftware.com (includes FAQs, KB, and support forum)
Mail: Golden Software, Inc., 809 14th Street, Golden, Colorado 80401-1866, USA
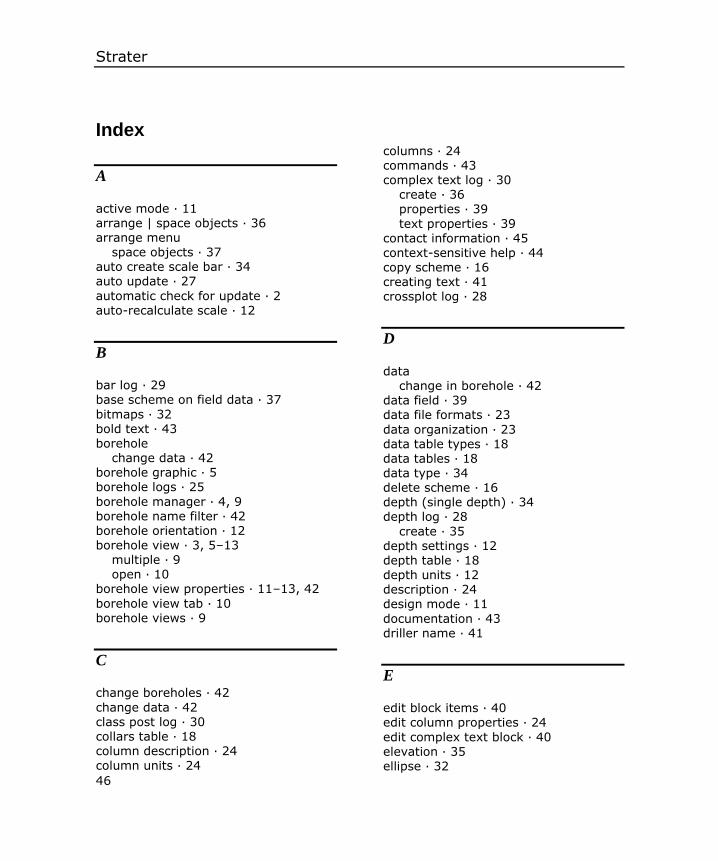
Strater
46
Index
A
active mode · 11 arrange | space objects · 36 arrange menu
space objects · 37 auto create scale bar · 34 auto update · 27
automatic check for update · 2 auto-recalculate scale · 12
B
bar log · 29 base scheme on field data · 37
bitmaps · 32
bold text · 43 borehole
change data · 42 borehole graphic · 5 borehole logs · 25
borehole manager · 4, 9 borehole name filter · 42 borehole orientation · 12 borehole view · 3, 5–13
multiple · 9 open · 10
borehole view properties · 11–13, 42
borehole view tab · 10 borehole views · 9
C
change boreholes · 42
change data · 42 class post log · 30 collars table · 18 column description · 24
column units · 24
columns · 24 commands · 43 complex text log · 30
create · 36 properties · 39
text properties · 39 contact information · 45
context-sensitive help · 44 copy scheme · 16 creating text · 41 crossplot log · 28
D
data change in borehole · 42
data field · 39 data file formats · 23
data organization · 23 data table types · 18 data tables · 18 data type · 34 delete scheme · 16 depth (single depth) · 34 depth log · 28
create · 35 depth settings · 12 depth table · 18 depth units · 12 description · 24
design mode · 11
documentation · 43 driller name · 41
E
edit block items · 40 edit column properties · 24
edit complex text block · 40 elevation · 35
ellipse · 32
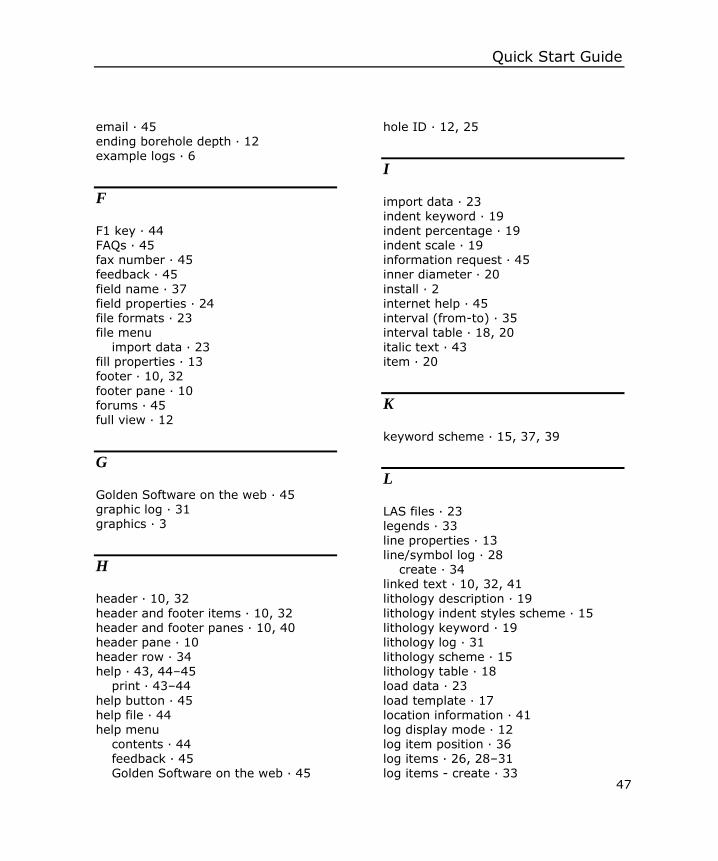
Quick Start Guide
47
email · 45 ending borehole depth · 12 example logs · 6
F
F1 key · 44 FAQs · 45
fax number · 45 feedback · 45
field name · 37 field properties · 24 file formats · 23 file menu
import data · 23 fill properties · 13 footer · 10, 32
footer pane · 10 forums · 45 full view · 12
G
Golden Software on the web · 45 graphic log · 31 graphics · 3
H
header · 10, 32
header and footer items · 10, 32 header and footer panes · 10, 40 header pane · 10 header row · 34 help · 43, 44–45
print · 43–44
help button · 45 help file · 44 help menu
contents · 44 feedback · 45
Golden Software on the web · 45
hole ID · 12, 25
I
import data · 23 indent keyword · 19 indent percentage · 19 indent scale · 19
information request · 45 inner diameter · 20
install · 2 internet help · 45 interval (from-to) · 35 interval table · 18, 20 italic text · 43 item · 20
K
keyword scheme · 15, 37, 39
L
LAS files · 23 legends · 33 line properties · 13 line/symbol log · 28
create · 34 linked text · 10, 32, 41
lithology description · 19
lithology indent styles scheme · 15 lithology keyword · 19 lithology log · 31 lithology scheme · 15 lithology table · 18 load data · 23
load template · 17 location information · 41 log display mode · 12 log item position · 36 log items · 26, 28–31
log items - create · 33
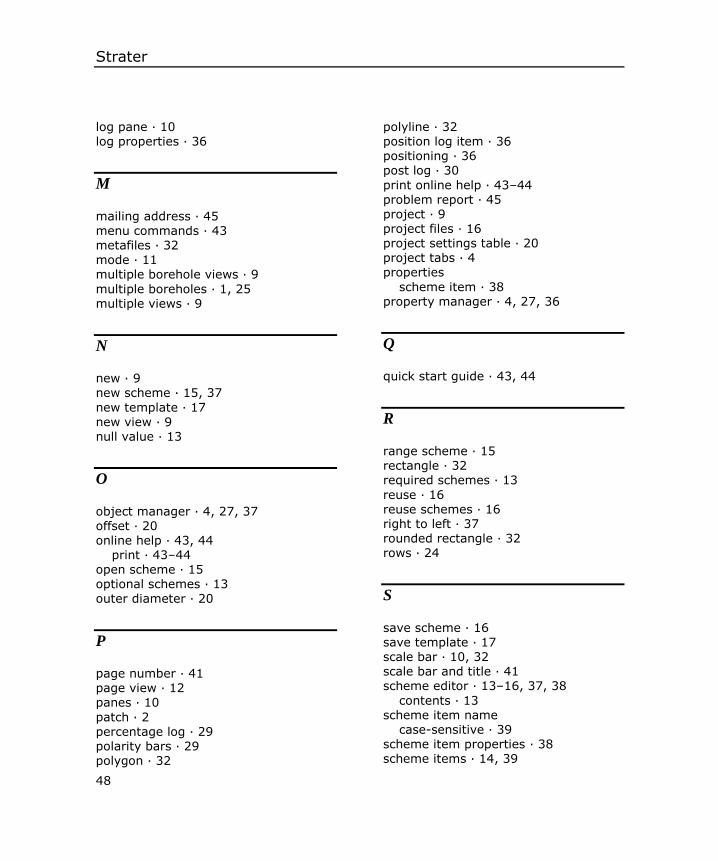
Strater
48
log pane · 10 log properties · 36
M
mailing address · 45 menu commands · 43 metafiles · 32
mode · 11 multiple borehole views · 9
multiple boreholes · 1, 25 multiple views · 9
N
new · 9 new scheme · 15, 37
new template · 17
new view · 9 null value · 13
O
object manager · 4, 27, 37 offset · 20 online help · 43, 44
print · 43–44 open scheme · 15 optional schemes · 13
outer diameter · 20
P
page number · 41 page view · 12 panes · 10
patch · 2 percentage log · 29 polarity bars · 29 polygon · 32
polyline · 32 position log item · 36 positioning · 36 post log · 30
print online help · 43–44 problem report · 45 project · 9 project files · 16 project settings table · 20
project tabs · 4 properties
scheme item · 38 property manager · 4, 27, 36
Q
quick start guide · 43, 44
R
range scheme · 15 rectangle · 32 required schemes · 13
reuse · 16 reuse schemes · 16 right to left · 37 rounded rectangle · 32 rows · 24
S
save scheme · 16 save template · 17 scale bar · 10, 32 scale bar and title · 41 scheme editor · 13–16, 37, 38
contents · 13 scheme item name
case-sensitive · 39 scheme item properties · 38 scheme items · 14, 39
Quick Start Guide
49
scheme name · 14, 37 scheme type · 13, 15, 37 schemes · 13–16
copy · 16
delete · 16 edit · 37 item · 14 name · 14 new · 15, 37
open · 15 reuse · 16
save · 16 type · 15
schemes - converting · 16 schemes - copy · 16 schemes - create · 15 schemes - deleting · 16
schemes in a log · 39 space objects · 37 specify column definitions · 34 specify column header row · 34
specify data type and column positions · 34
specify worksheet column definitions ·
34 standard bars · 29 starting borehole depth · 12 starting strater · 33 Strater files · 16 Strater scheme file · 15 Strater template files · 16
suggestion · 45
support forums · 45 symbol · 32 system requirements · 2
T
table menu edit column properties · 24
table name · 37 table types
collars · 18
depth · 18
interval · 18 lithology · 18 project settings · 20 text · 18
well construction · 20 tables
multiple boreholes · 25 technical support · 45 telephone number · 45
template · 3, 16–17 load · 17
new · 17 save · 17
template name · 12 text · 32
create · 41 linked to database · 32, 41
text editor · 40 text properties · 13 text table · 18 title · 41
tools menu design mode · 11 log items · 26
scheme editor · 15, 37 tutorial · 33–42
U
uninstall · 2
units · 12, 24
update Voxler · 2 use keyword scheme · 39 user interface · 4
V
vector files · 32 version number · 45 view menu
borehole view properties · 11, 42 property inspector · 36
view name · 11
Strater
50
views multiple · 9
vista · 3
W
web address · 45 well construction log · 31
well construction scheme · 15 well construction table · 20 workspace · 3
Z
zone bar log · 29 create · 35