stratosphere tower
DESCRIPTION
windTRANSCRIPT
Wind Engineering for the Las Vegas Stratosphere Tower
Daryl Boggs1), Brent Wright2), and Roy Denoon3)
1),3)CPP, Inc., Fort Collins, Colorado USA 2)Wright Engineers, Las Vegas, Nevada USA
ABSTRACT
A wind tunnel model of the Las Vegas Stratosphere Tower was first tested as part of its design in 1991, but this proved to be only the beginning of a long series of modifications and additions that warranted additional wind-engineering investigations lasting through 2004. These features included proposed changes in geometry, a proposed extended spire that would have made it the world’s tallest free-standing tower, construction challenges that required evaluation of wind loads on partially completed segments for limited exposure periods, the addition of several amusement rides, and the proposed addition of a variety of broadcast antennas. Integra-tion of wind engineering and structural design concepts have allowed the extension of tower operations by the addition of several new attractions without compromising structural integrity.
INTRODUCTION
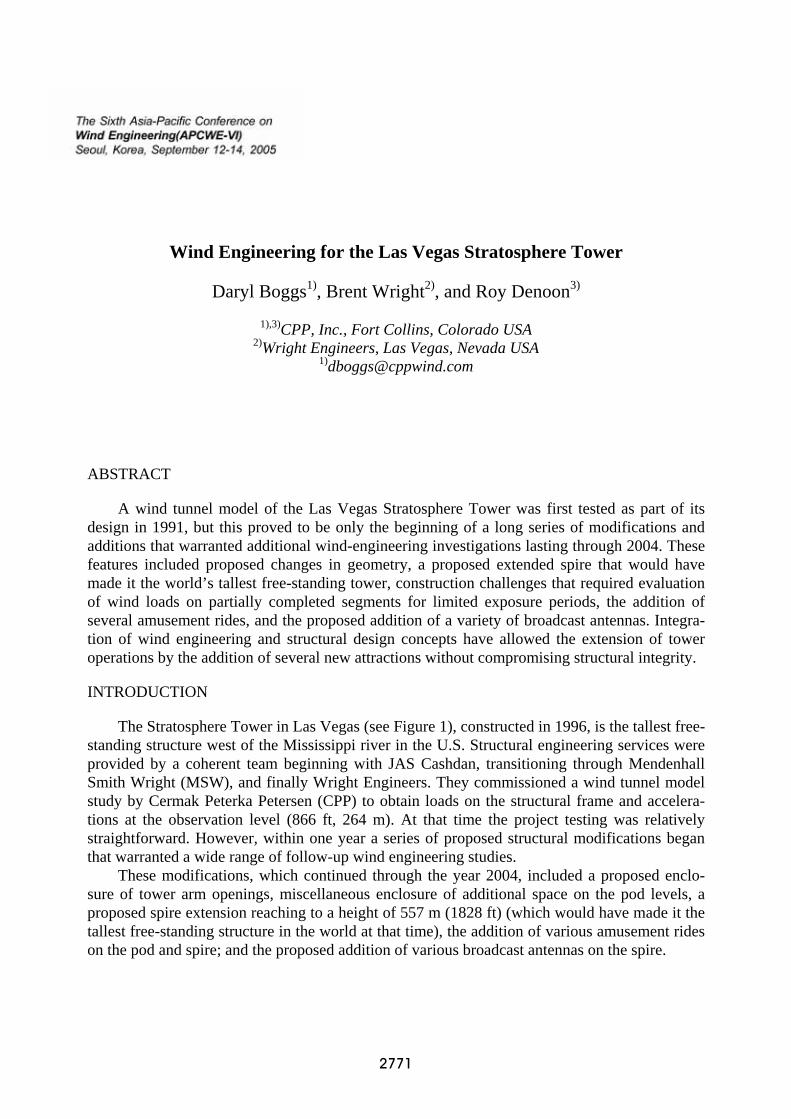
The Stratosphere Tower in Las Vegas (see Figure 1), constructed in 1996, is the tallest free-standing structure west of the Mississippi river in the U.S. Structural engineering services were provided by a coherent team beginning with JAS Cashdan, transitioning through Mendenhall Smith Wright (MSW), and finally Wright Engineers. They commissioned a wind tunnel model study by Cermak Peterka Petersen (CPP) to obtain loads on the structural frame and accelera-tions at the observation level (866 ft, 264 m). At that time the project testing was relatively straightforward. However, within one year a series of proposed structural modifications began that warranted a wide range of follow-up wind engineering studies.
These modifications, which continued through the year 2004, included a proposed enclo-sure of tower arm openings, miscellaneous enclosure of additional space on the pod levels, a proposed spire extension reaching to a height of 557 m (1828 ft) (which would have made it the tallest free-standing structure in the world at that time), the addition of various amusement rides on the pod and spire; and the proposed addition of various broadcast antennas on the spire.
CPP continued to provide wind-engineer-ing services throughout this period, including additional wind tunnel testing of various tower configurations, section testing of various un-usual mast lattice configurations, analytical evaluation of wind loading and dynamic re-sponse of the proposed extended configuration including a proposed multi-level aeroelastic model test, estimated loads on various unusual appendages, and re-evaluation of the local wind climate. These investigations were especially insightful to the proper superposition of multi-mode response and dynamic interactions in primary-secondary systems.
INITIAL TESTING
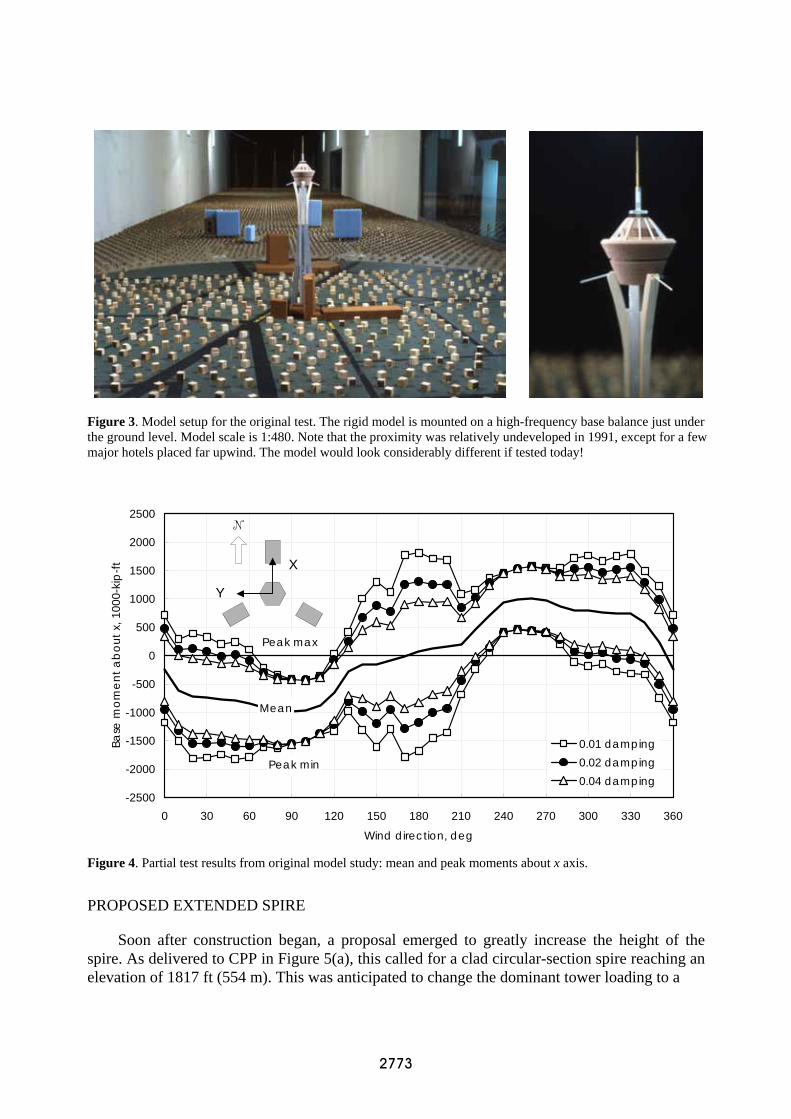
The high-frequency base balance (HFBB) test method (Boggs & Peterka 1989; Boggs 1982) was initially used to obtain structural frame loads and accelerations at the observation deck level. This original test setup is shown in Figures 2 and 3. Results (Figure 4) showed that wind loads were dominated by gust buffeting in
the near-along-wind direction (90 or 270 degrees azimuth for Mx) for a damping ratio of 0.02 or more, and that the maximum cross-wind response (with two tripod legs facing upwind, at 180 dgrees azimuth) would only match or exceed this if the damping ratio were less than 0.01. This aerodynamic characteristic played a key role in many of the investigations to follow.
A climatic study was included to assess design wind speeds. Although lo-cal building code at that time required a basic 50-year recurrence speed of 70 mph (fastest-mile at 10 m in open coun-try), CPP recommended a 100-year speed of 79 mph. MSW elected to in-crease this further to 85 mph, a decision that ultimately paid significant benefits.
It was initially anticipated that added damping might be required to mitigate excessive motions, so both loads and accelerations were predicted
for damping ranging from 0.02 to 0.04. Strain energy calculations were made for initial design of viscoelastic-type dampers by the 3M company. Eventually it was determined that dampers would be expensive, that acceptable motion levels could be obtained without them, and that structural loads could be adequately resisted, even for a low inherent damping level, because of the conservative design procedures and wind speeds assumed.
Figure 1. The Las Vegas Stratosphere tower.
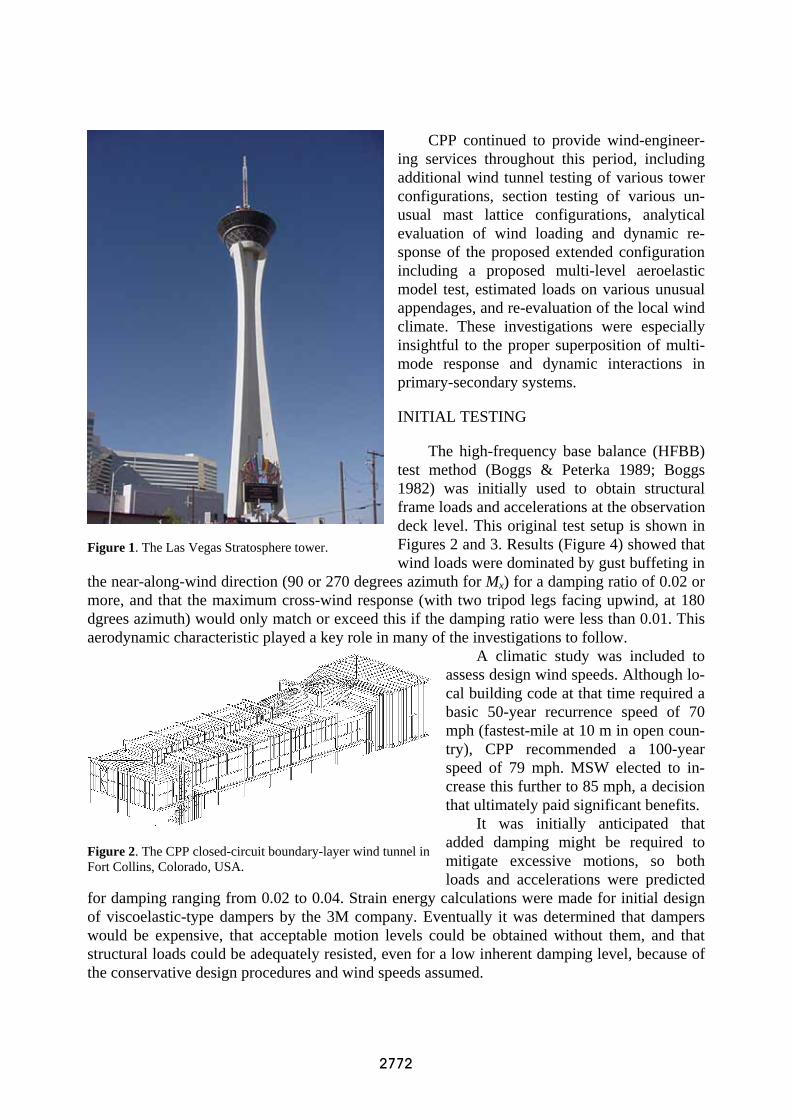
Figure 2. The CPP closed-circuit boundary-layer wind tunnel in Fort Collins, Colorado, USA.
PROPOSED EXTENDED SPIRE
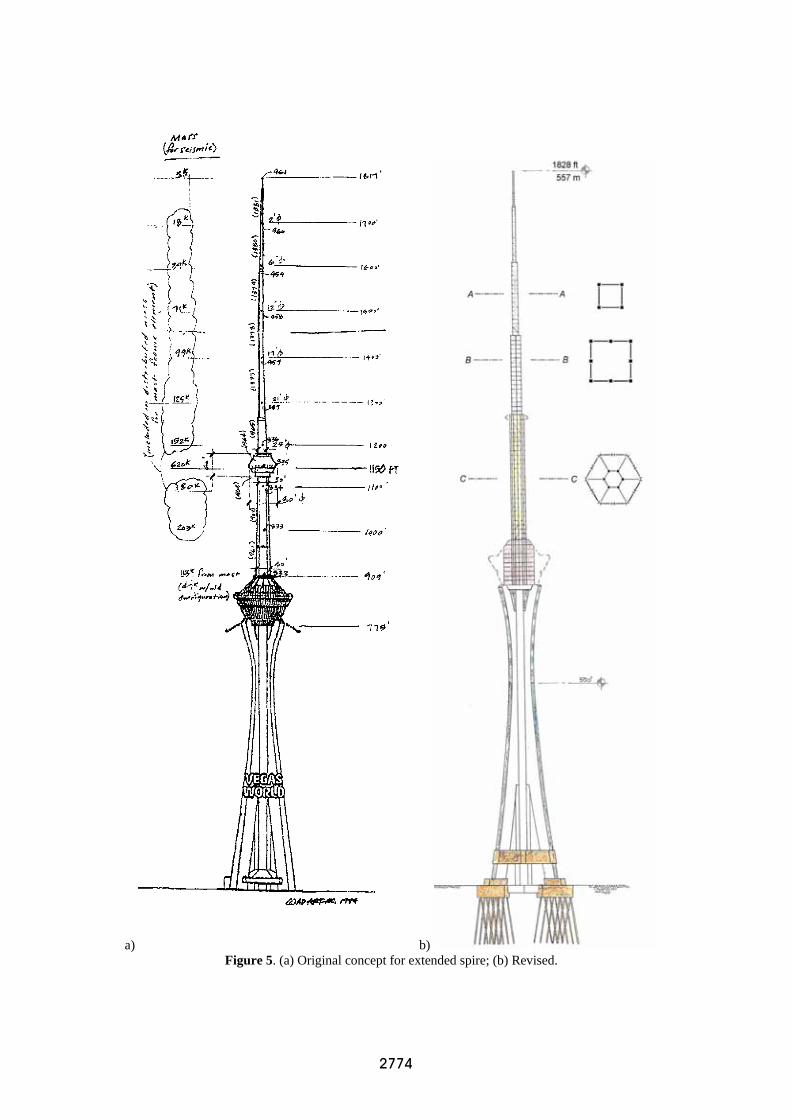
Soon after construction began, a proposal emerged to greatly increase the height of the spire. As delivered to CPP in Figure 5(a), this called for a clad circular-section spire reaching an elevation of 1817 ft (554 m). This was anticipated to change the dominant tower loading to a
Figure 3. Model setup for the original test. The rigid model is mounted on a high-frequency base balance just under the ground level. Model scale is 1:480. Note that the proximity was relatively undeveloped in 1991, except for a few major hotels placed far upwind. The model would look considerably different if tested today!
Mean
Peak min
Peak max
-2500
-2000
-1500
-1000
-500
0
500
1000
1500
2000
2500
0 30 60 90 120 150 180 210 240 270 300 330 360
Wind direction, deg
Base
mom
ent a
bout
x, 1
000-
kip-
ft
0.01 damping0.02 damping0.04 damping
X
Y
N
Figure 4. Partial test results from original model study: mean and peak moments about x axis.
a)
b) Figure 5. (a) Original concept for extended spire; (b) Revised.
cross-wind response due to vortex shedding, possibly in a mode of vibration higher than the fundamental, and plans commenced for a multi-level aeroelastic model test combined with—because of Reynolds-no. sensitivity—analytical evaluation of vortex shedding and response.
Before this commenced, the design was modified as shown in Figure 5(b). The spire now consisted of unclad lattice sections of various size and configura-tions, and the height was increased to 1828 ft (557 m), making it the tallest free-standing structure in the world. With this change the dominant loading would once again be along-wind, and the initial investigation strategy was changed to a different type of analysis. CPP wrote a computer program, MAST, to analyze the dynamic response, treating it as a line-like structure with height-dependent drag coefficients and
aerodynamic properties. Aerodynamic properties, treated as parameters, included mean wind speed, turbulence intensity and spectral density, vertical coherence, and length scale. Structural properties included the natural frequency, shapes, and damping ratios of any number of modes, and section properties width, mass per unit height, and drag coefficient. Drag coefficient data
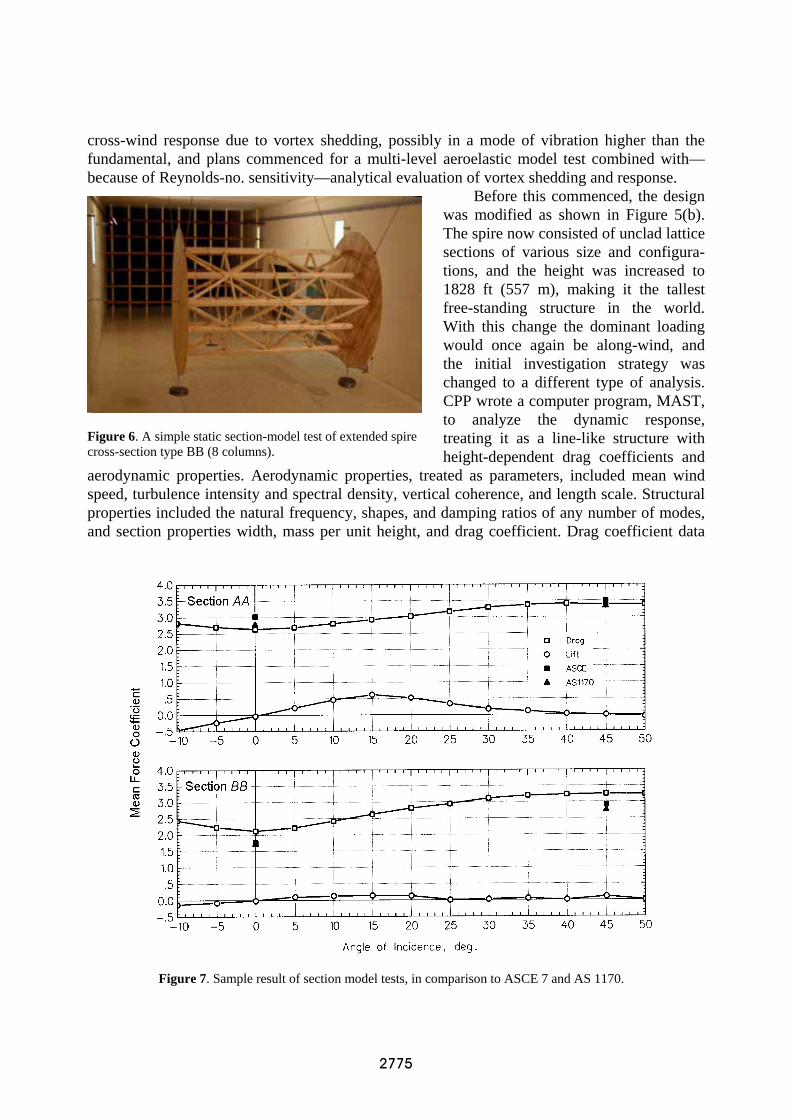
Figure 6. A simple static section-model test of extended spire cross-section type BB (8 columns).
Figure 7. Sample result of section model tests, in comparison to ASCE 7 and AS 1170.
for the lower tower portions were derived from the already-completed model test, and data for the lattice segments were obtained from new section model tests.
Because only along-wind loads were of concern, only static testing was needed and the section tests could be performed quite simply using rigid models, capped with end plates, and suspended in the wind tunnel with cable and in-line load cells (Figure 6). Sample results, con-sisting of lift and drag coefficients as a function of wind angle, are shown in Figure 7. The lift data confirmed that cross-wind response of the spire would not be significant, from buffeting, vortex shedding, or potential galloping considerations. Drag coefficients are compared to values obtained from standards ASCE 7-88 and AS1170.2-89. For the more ordinary 4-column section
AA (Figure 5(b)), test results agreed very well with the codes (within 1 percent, in fact, for the most-critical diagonal wind angle). For the unconventional 8-column BB and 12-column CC sections, loads were 5 to 15 percent higher than code (Figure 7).
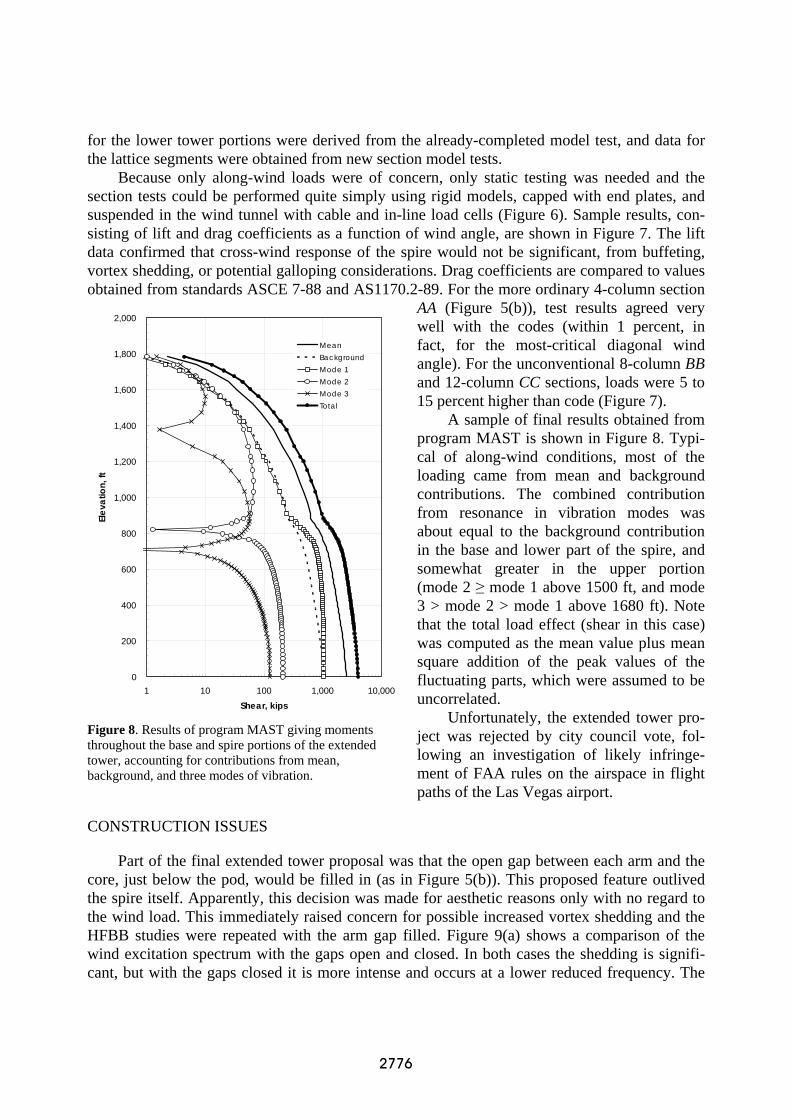
A sample of final results obtained from program MAST is shown in Figure 8. Typi-cal of along-wind conditions, most of the loading came from mean and background contributions. The combined contribution from resonance in vibration modes was about equal to the background contribution in the base and lower part of the spire, and somewhat greater in the upper portion (mode 2 ≥ mode 1 above 1500 ft, and mode 3 > mode 2 > mode 1 above 1680 ft). Note that the total load effect (shear in this case) was computed as the mean value plus mean square addition of the peak values of the fluctuating parts, which were assumed to be uncorrelated.
Unfortunately, the extended tower pro-ject was rejected by city council vote, fol-lowing an investigation of likely infringe-ment of FAA rules on the airspace in flight paths of the Las Vegas airport.
CONSTRUCTION ISSUES
Part of the final extended tower proposal was that the open gap between each arm and the core, just below the pod, would be filled in (as in Figure 5(b)). This proposed feature outlived the spire itself. Apparently, this decision was made for aesthetic reasons only with no regard to the wind load. This immediately raised concern for possible increased vortex shedding and the HFBB studies were repeated with the arm gap filled. Figure 9(a) shows a comparison of the wind excitation spectrum with the gaps open and closed. In both cases the shedding is signifi-cant, but with the gaps closed it is more intense and occurs at a lower reduced frequency. The
-
200
400
600
800
1,000
1,200
1,400
1,600
1,800
2,000
1 10 100 1,000 10,000Shear, kips
Elev
atio
n, ft
MeanBackgroundMode 1Mode 2Mode 3Total
0
Figure 8. Results of program MAST giving moments throughout the base and spire portions of the extended tower, accounting for contributions from mean, background, and three modes of vibration.
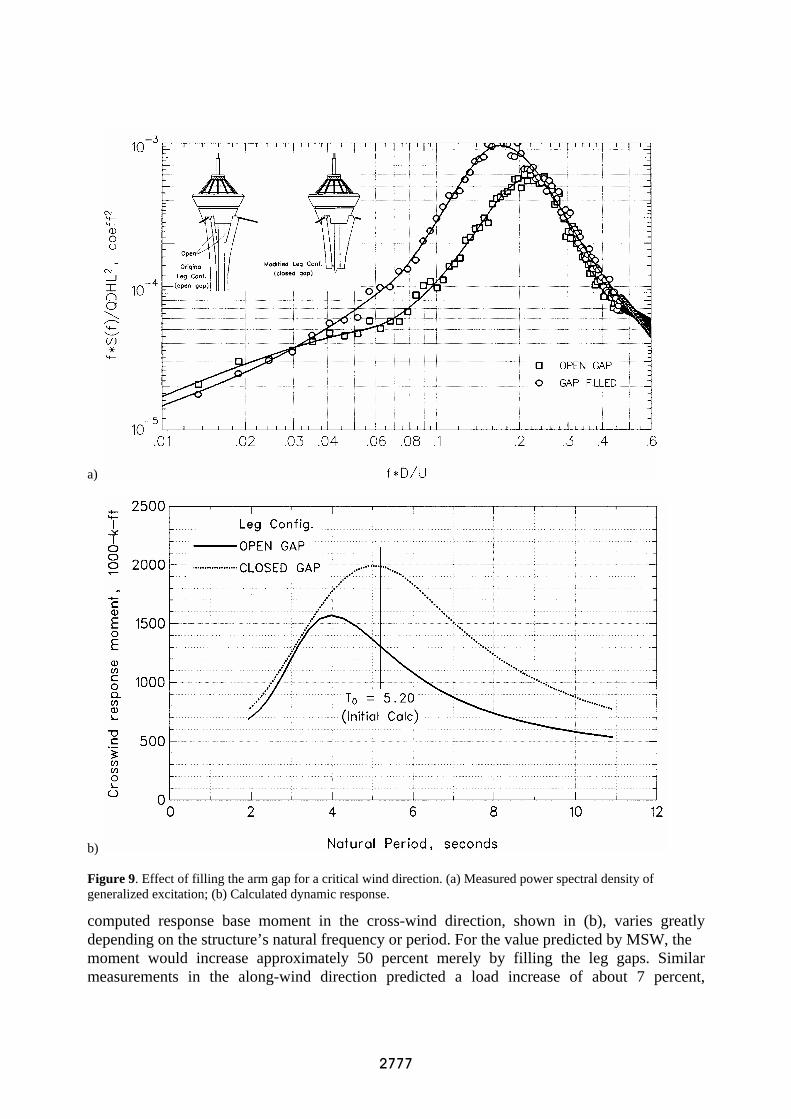
computed response base moment in the cross-wind direction, shown in (b), varies greatly depending on the structure’s natural frequency or period. For the value predicted by MSW, the moment would increase approximately 50 percent merely by filling the leg gaps. Similar measurements in the along-wind direction predicted a load increase of about 7 percent,
a)
b) Figure 9. Effect of filling the arm gap for a critical wind direction. (a) Measured power spectral density of generalized excitation; (b) Calculated dynamic response.
regardless of natural frequency. Upon reporting these results to the engineer, architect, and owner, plans to fill the arm gaps were immediately abandoned.
An anomaly occurred during construction when the pod was approximately half completed, for a period of approximately three months during which structural modifications were made to the legs. The question arose whether the pod framing, and especially the pod cladding, could continue based on a reduced wind load, or whether it should be delayed for the duration of the modification. MSW called on CPP to assist in this decision, who (1) estimated wind loads on the unclad portion of the pod, treating it as an open-framed structure, and (2) re-examined the local wind climate to estimate the maximum likely wind speed in view of the limited period of exposure of this temporary condition. This latter evaluation made extensive use of a special recently published study proposing design wind loads for temporary structures (Boggs & Peterka 1992). The former condition was estimated based on handbook values and various lattice structure methods found in the wind engineering research literature, made possible because the governing loads on the structure were known to occur in the along-wind direction.
These studies concluded that the addition of cladding to the pod area would have little effect on wind loads, because the additional surface area would be nearly compensated by the more aerodynamic profile—the drag coefficient was estimated to be 1.09 clad vs. 1.05 unclad. Regarding the temporary condition, it was determined that a suitable design speed for an expo-sure period of up to one year would be a 10-year-recurrence wind, while maintaining the same probability of overstress as the full-strength structure designed for a 50-year wind (yet without threatening life-safety). The reduced strength evaluated by MSW was judged sufficient for the 10-year wind, and so the pod construction was allowed to continue without delay.
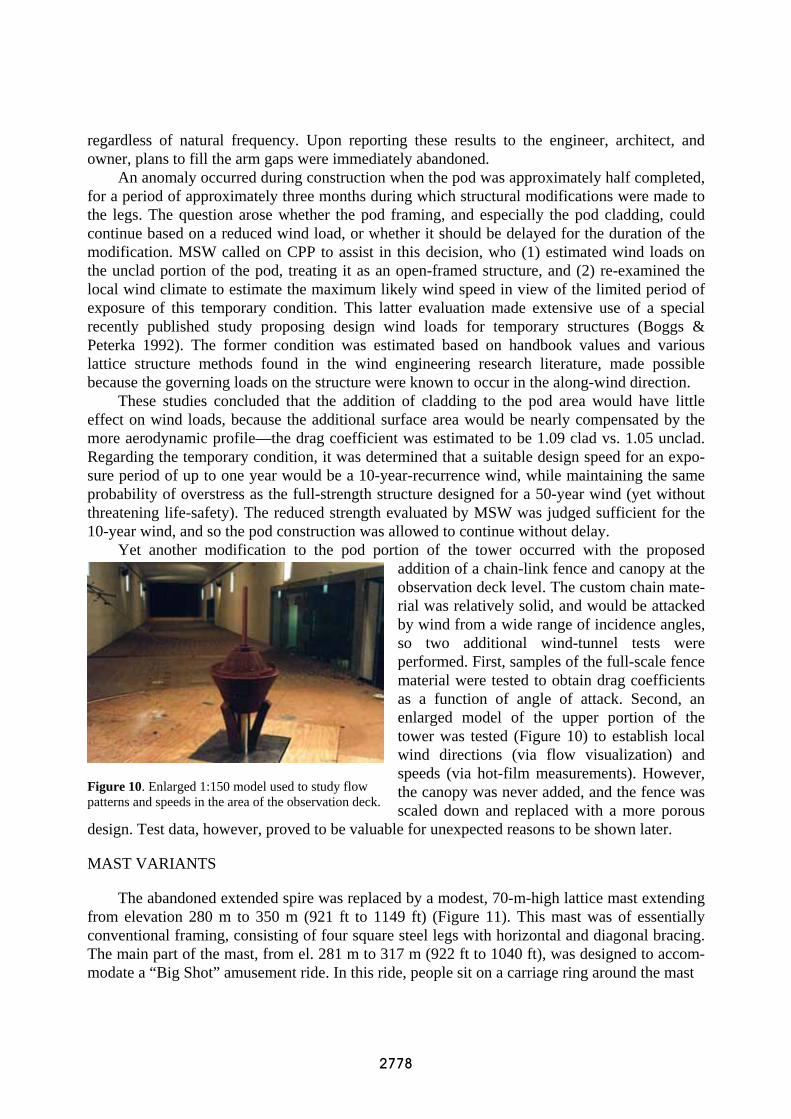
Yet another modification to the pod portion of the tower occurred with the proposed addition of a chain-link fence and canopy at the observation deck level. The custom chain mate-rial was relatively solid, and would be attacked by wind from a wide range of incidence angles, so two additional wind-tunnel tests were performed. First, samples of the full-scale fence material were tested to obtain drag coefficients as a function of angle of attack. Second, an enlarged model of the upper portion of the tower was tested (Figure 10) to establish local wind directions (via flow visualization) and speeds (via hot-film measurements). However, the canopy was never added, and the fence was scaled down and replaced with a more porous
design. Test data, however, proved to be valuable for unexpected reasons to be shown later.
MAST VARIANTS
The abandoned extended spire was replaced by a modest, 70-m-high lattice mast extending from elevation 280 m to 350 m (921 ft to 1149 ft) (Figure 11). This mast was of essentially conventional framing, consisting of four square steel legs with horizontal and diagonal bracing. The main part of the mast, from el. 281 m to 317 m (922 ft to 1040 ft), was designed to accom-modate a “Big Shot” amusement ride. In this ride, people sit on a carriage ring around the mast
Figure 10. Enlarged 1:150 model used to study flow patterns and speeds in the area of the observation deck.
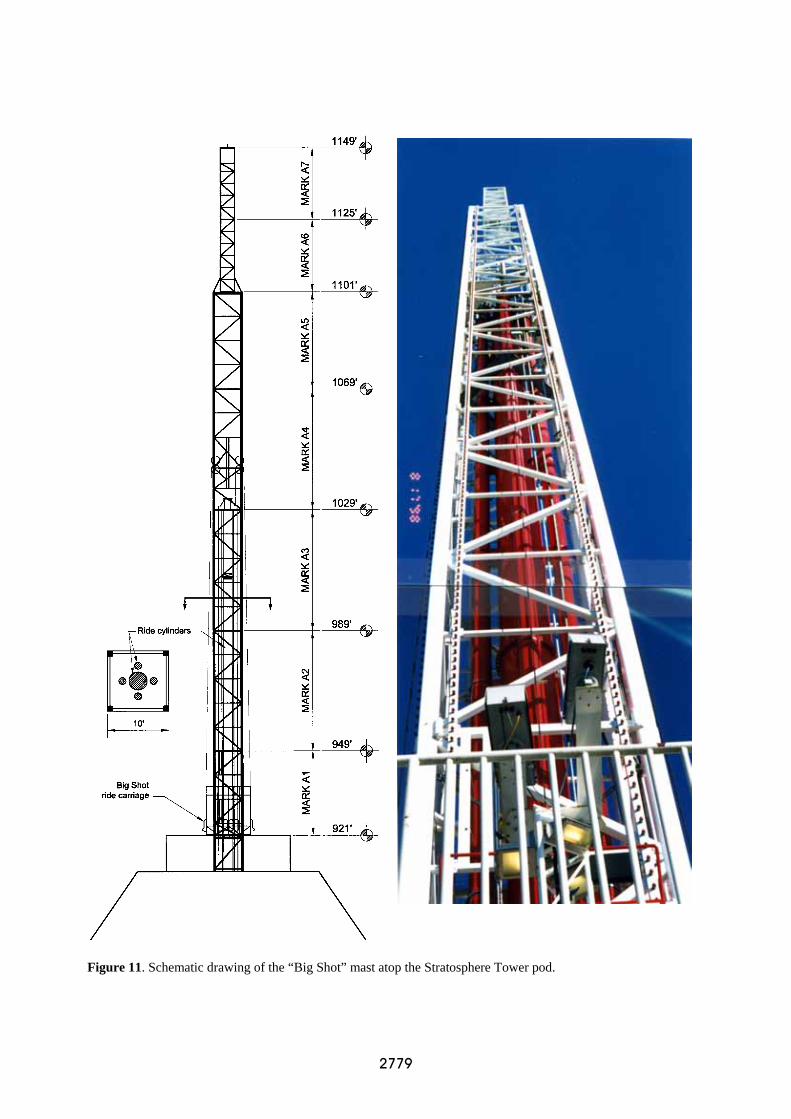
Figure 11. Schematic drawing of the “Big Shot” mast atop the Stratosphere Tower pod.
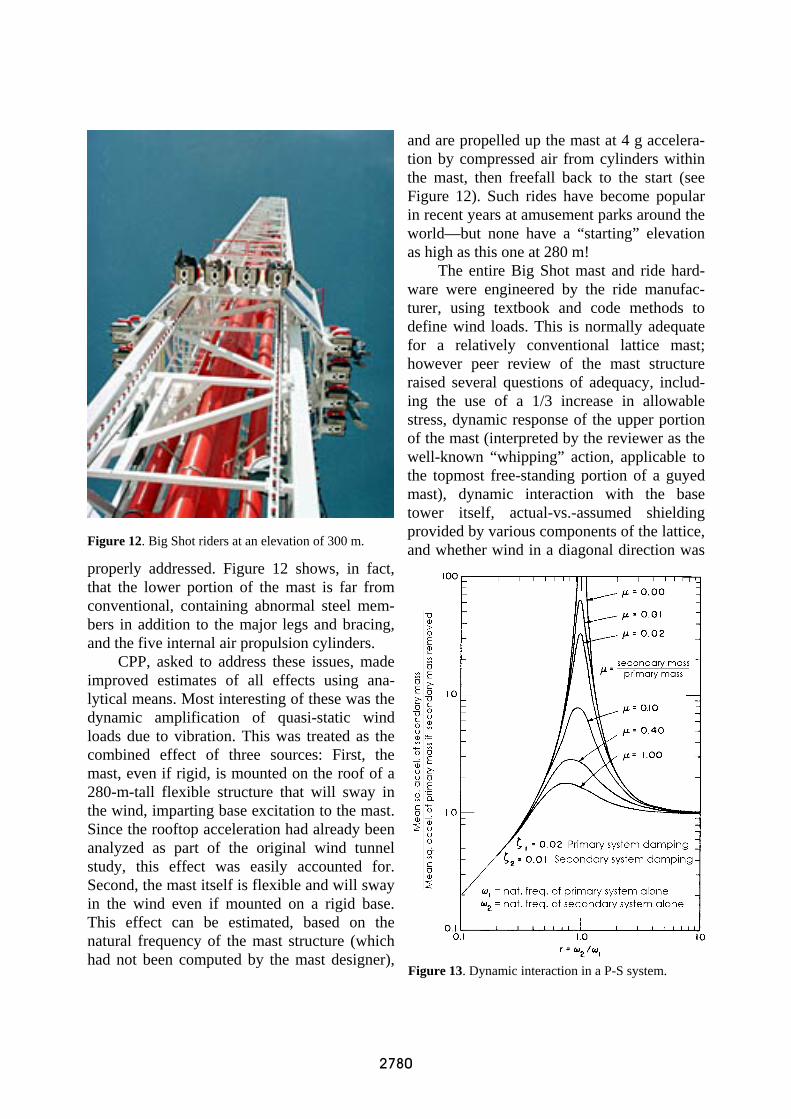
and are propelled up the mast at 4 g accelera-tion by compressed air from cylinders within the mast, then freefall back to the start (see Figure 12). Such rides have become popular in recent years at amusement parks around the world—but none have a “starting” elevation as high as this one at 280 m!
The entire Big Shot mast and ride hard-ware were engineered by the ride manufac-turer, using textbook and code methods to define wind loads. This is normally adequate for a relatively conventional lattice mast; however peer review of the mast structure raised several questions of adequacy, includ-ing the use of a 1/3 increase in allowable stress, dynamic response of the upper portion of the mast (interpreted by the reviewer as the well-known “whipping” action, applicable to the topmost free-standing portion of a guyed mast), dynamic interaction with the base tower itself, actual-vs.-assumed shielding provided by various components of the lattice, and whether wind in a diagonal direction was
properly addressed. Figure 12 shows, in fact, that the lower portion of the mast is far from conventional, containing abnormal steel mem-bers in addition to the major legs and bracing, and the five internal air propulsion cylinders.
CPP, asked to address these issues, made improved estimates of all effects using ana-lytical means. Most interesting of these was the dynamic amplification of quasi-static wind loads due to vibration. This was treated as the combined effect of three sources: First, the mast, even if rigid, is mounted on the roof of a 280-m-tall flexible structure that will sway in the wind, imparting base excitation to the mast. Since the rooftop acceleration had already been analyzed as part of the original wind tunnel study, this effect was easily accounted for. Second, the mast itself is flexible and will sway in the wind even if mounted on a rigid base. This effect can be estimated, based on the natural frequency of the mast structure (which had not been computed by the mast designer),
Figure 12. Big Shot riders at an elevation of 300 m.
Figure 13. Dynamic interaction in a P-S system.
using textbook methods. Finally, the base-induced acceleration may be amplified by dynamic interaction between the mast structure and the base structure, depending on their damping ratios and the ratio of their natural frequencies and effective masses. This effect was analyzed using the method of Crandall and Mark (1963), as illustrated in Figure 13. The maximum base tower roof acceleration under a 100-year wind had been predicted to be 0.043 g, and this would be amplified by a factor of 1.5 based on the calculated frequency ratio (mast/base tower) of about 3. The induced lateral load on the entire mast is therefore approximately equal to 0.064 of its weight, or 7,400 lb. This was an increase of about 8 percent beyond the designer’s assumed load. Although the analysis represented in Figure 13 is somewhat simplified, experience with this tower and others that soon followed led to more complete and systematic treatment of wind excitation and response in primary-secondary (P-S) systems.
Other effects were estimated to be of similar magnitude; for example, the effect of a diagonal wind would be a 10-percent increase, while the use of a realistic code-required wind speed in place of MSW’s more conservative speed would result in a 10- to 15-percent reduction in load. In the end result, the Big Shot mast supplier’s design was judged to be acceptable.
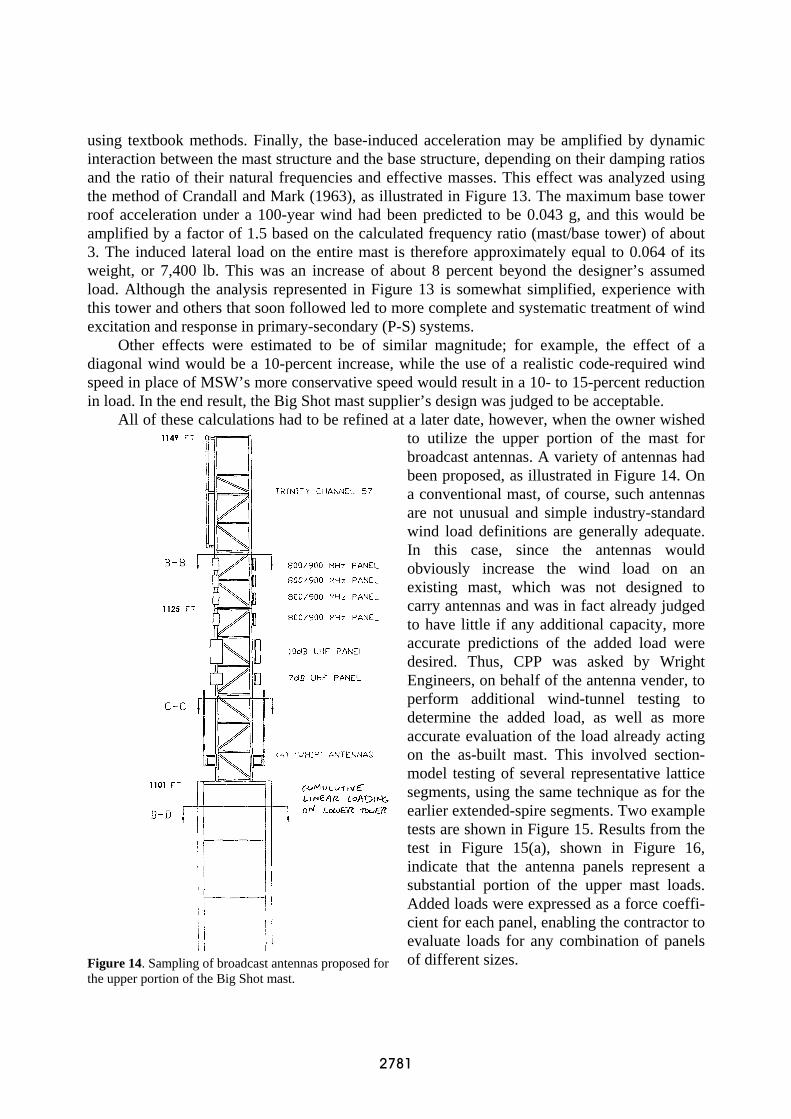
All of these calculations had to be refined at a later date, however, when the owner wished to utilize the upper portion of the mast for broadcast antennas. A variety of antennas had been proposed, as illustrated in Figure 14. On a conventional mast, of course, such antennas are not unusual and simple industry-standard wind load definitions are generally adequate. In this case, since the antennas would obviously increase the wind load on an existing mast, which was not designed to carry antennas and was in fact already judged to have little if any additional capacity, more accurate predictions of the added load were desired. Thus, CPP was asked by Wright Engineers, on behalf of the antenna vender, to perform additional wind-tunnel testing to determine the added load, as well as more accurate evaluation of the load already acting on the as-built mast. This involved section-model testing of several representative lattice segments, using the same technique as for the earlier extended-spire segments. Two example tests are shown in Figure 15. Results from the test in Figure 15(a), shown in Figure 16, indicate that the antenna panels represent a substantial portion of the upper mast loads. Added loads were expressed as a force coeffi-cient for each panel, enabling the contractor to evaluate loads for any combination of panels of different sizes. Figure 14. Sampling of broadcast antennas proposed for
the upper portion of the Big Shot mast.

At the conclusion of this testing, accurate and detailed wind loads were computed throughout the height of the entire mast, including all of the dynamic effects addressed earlier. It was determined that the as-built capacity of the Big Shot mast was still accept-able, but there was insufficient reserve capac-ity to add any antennas. Thus, hopes for this additional source of revenue were abandoned.
RIDES AND APPENDAGES
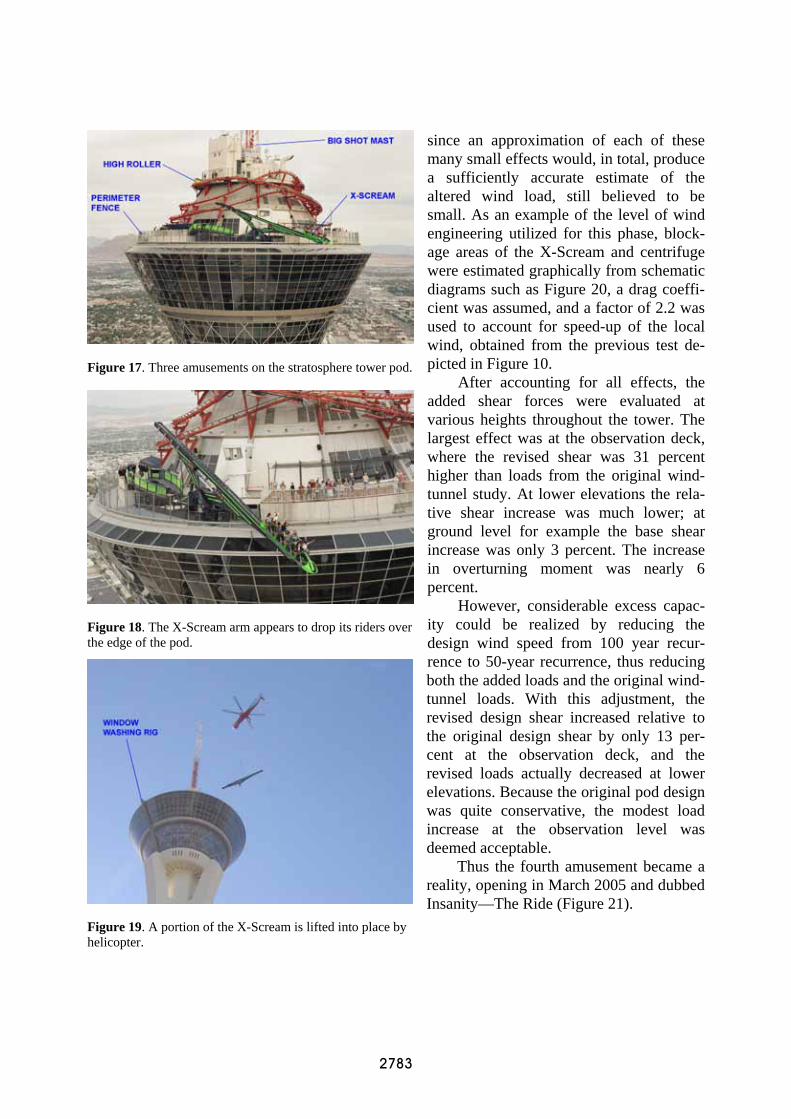
Big Shot was the second ride to be added to the Stratosphere Tower, after the High Roller coaster, which was conceived early in the design stage. In 2003 a third ride, called X-Scream, was added to the observation deck. All three rides are shown in Figure 17. Obvi-ously, these rides along with their support and staging area houses added a small wind block-age to the upper portion of the Stratosphere tower. These added areas were originally ne-glected (except for the Big Shot mast, de-scribed above), believing that the added loads were well within the range of the conservative tower design.
However, when a fourth centrifuge-like amusement was proposed in 2004, Wright Engineers performed a general review of the tower’s structural capacity and again called on CPP to perform a general review of wind loads. This review was to account for all as-built additions, each of which was certainly quite small but could, in aggregate, amount to a significant condition. Installation of the cen-trifuge was delayed until this review could guarantee safety. The review included, in ad-dition to the major added rides, such items as renewed calculation of the structure’s natural frequency, the absence of added damping that was never installed, re-evaluation of the re-quired design wind speed, a window-washing rig that had never been considered for wind (Figure 19), and the as-built observation deck perimeter fence (Figure 17).
No testing was performed for this review,
a)
b) Figure 15. Section model tests for the Big Shot mast. (a) 1:6.7 scale lower segment with cylinder tanks; (b) 1:2.7 scale upper segment with 10dB UHF panel antennas.
Structure w/ 10-dB UHF Panel Antennas
0
1
2
3
4
5
6
0 10 20 30 40 50Angle of incidence, deg
Dra
g co
effic
ient
Cf
Struct + test frameStruct+TF+antennasNet antennas
Note: dual curves represent data for ± angles of incidence
Figure 16. Section test results: model including test frame (solid circles), and model including test frame with added antenna panels (solid squares). Differences represent added loads due to antennas (open squares).
since an approximation of each of these many small effects would, in total, produce a sufficiently accurate estimate of the altered wind load, still believed to be small. As an example of the level of wind engineering utilized for this phase, block-age areas of the X-Scream and centrifuge were estimated graphically from schematic diagrams such as Figure 20, a drag coeffi-cient was assumed, and a factor of 2.2 was used to account for speed-up of the local wind, obtained from the previous test de-picted in Figure 10.
After accounting for all effects, the added shear forces were evaluated at various heights throughout the tower. The largest effect was at the observation deck, where the revised shear was 31 percent higher than loads from the original wind-tunnel study. At lower elevations the rela-tive shear increase was much lower; at ground level for example the base shear increase was only 3 percent. The increase in overturning moment was nearly 6 percent.
However, considerable excess capac-ity could be realized by reducing the design wind speed from 100 year recur-rence to 50-year recurrence, thus reducing both the added loads and the original wind-tunnel loads. With this adjustment, the revised design shear increased relative to the original design shear by only 13 per-cent at the observation deck, and the revised loads actually decreased at lower elevations. Because the original pod design was quite conservative, the modest load increase at the observation level was deemed acceptable.
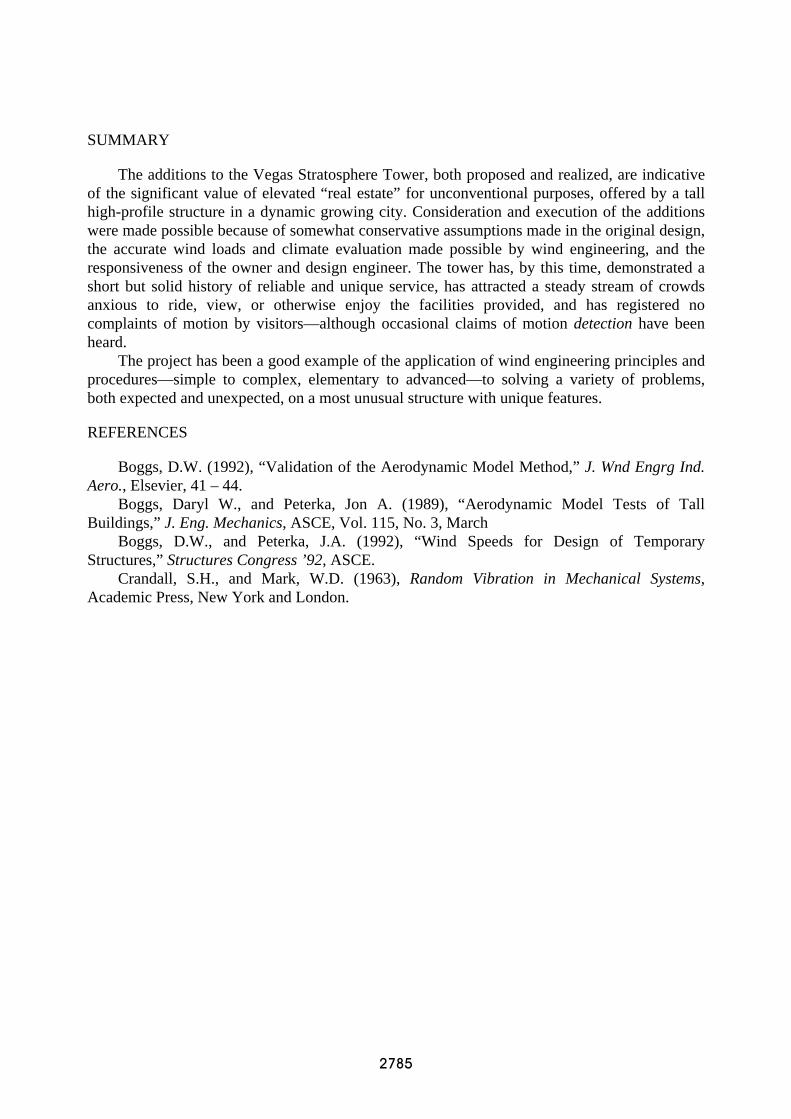
Thus the fourth amusement became a reality, opening in March 2005 and dubbed Insanity—The Ride (Figure 21).
Figure 17. Three amusements on the stratosphere tower pod.
Figure 18. The X-Scream arm appears to drop its riders over the edge of the pod.
Figure 19. A portion of the X-Scream is lifted into place by helicopter.
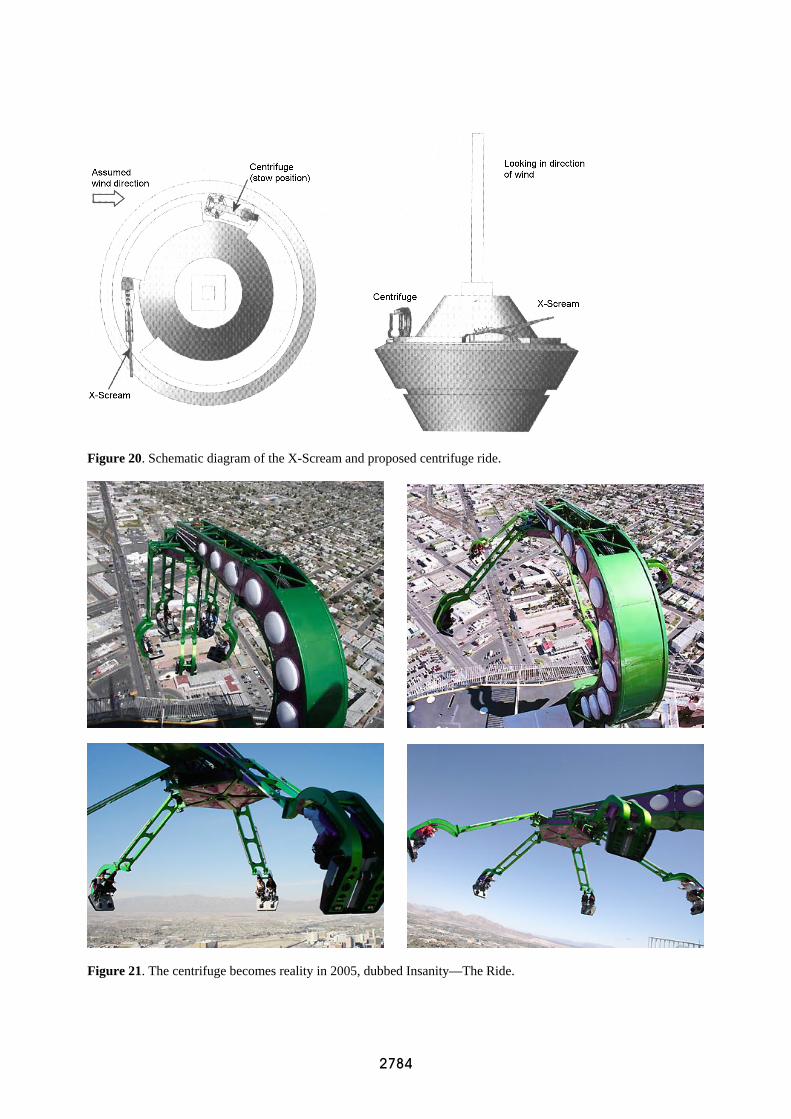
Figure 20. Schematic diagram of the X-Scream and proposed centrifuge ride.
Figure 21. The centrifuge becomes reality in 2005, dubbed Insanity—The Ride.
SUMMARY
The additions to the Vegas Stratosphere Tower, both proposed and realized, are indicative of the significant value of elevated “real estate” for unconventional purposes, offered by a tall high-profile structure in a dynamic growing city. Consideration and execution of the additions were made possible because of somewhat conservative assumptions made in the original design, the accurate wind loads and climate evaluation made possible by wind engineering, and the responsiveness of the owner and design engineer. The tower has, by this time, demonstrated a short but solid history of reliable and unique service, has attracted a steady stream of crowds anxious to ride, view, or otherwise enjoy the facilities provided, and has registered no complaints of motion by visitors—although occasional claims of motion detection have been heard.
The project has been a good example of the application of wind engineering principles and procedures—simple to complex, elementary to advanced—to solving a variety of problems, both expected and unexpected, on a most unusual structure with unique features.
REFERENCES
Boggs, D.W. (1992), “Validation of the Aerodynamic Model Method,” J. Wnd Engrg Ind. Aero., Elsevier, 41 – 44.
Boggs, Daryl W., and Peterka, Jon A. (1989), “Aerodynamic Model Tests of Tall Buildings,” J. Eng. Mechanics, ASCE, Vol. 115, No. 3, March
Boggs, D.W., and Peterka, J.A. (1992), “Wind Speeds for Design of Temporary Structures,” Structures Congress ’92, ASCE.
Crandall, S.H., and Mark, W.D. (1963), Random Vibration in Mechanical Systems, Academic Press, New York and London.