stream gaging by continuous injection of tracer elements...
TRANSCRIPT

Stream gaging by continuous injection of tracer elements
Item Type text; Thesis-Reproduction (electronic)
Authors Werrell, William Lewis, 1931-
Publisher The University of Arizona.
Rights Copyright © is held by the author. Digital access to this materialis made possible by the University Libraries, University of Arizona.Further transmission, reproduction or presentation (such aspublic display or performance) of protected items is prohibitedexcept with permission of the author.
Download date 24/05/2018 06:19:13
Link to Item http://hdl.handle.net/10150/554034

STREAM GAGING BY CONTINUOUS INJECTION
OF TRACER ELEMENTS
by
W illiam Lewis W errell
A T hesis Submitted to the Faculty of the
GRADUATE COMMITTEE ON HYDROLOGY
In P a rtia l Fulfillm ent of the Requirem ents F o r the Degree of
MASTER OF SCIENCE
In the Graduate College
THE UNIVERSITY OF ARIZONA
1967


STATEMENT BY AUTHOR
This thesis has been submitted in p artia l fulfillm ent of req u ire m ents fo r an advanced degree a t The U niversity of Arizona and is deposited in the U niversity L ib rary to be m ade available to borrow ers under ru les of the lib ra ry .
B rief quotations from th is thesis a re allowable without special perm ission , provided that accurate acknowledgment of source is m ade. Requests fo r perm ission fo r extended quotation from or reproduction of th is m anuscript in whole o r in p art m ay be granted by the head of the m ajor departm ent o r the Dean of the Graduate College when in h is judgment the proposed use of the m ateria l is in the in te rests at scho larship. In a ll other instances, however, perm ission m ust be obtained from the author.
SIGNED:
APPROVAL BY THESIS DIRECTOR
This thesis has been approved on the date shown below:

ACKNOWLEDGMENTS
The author w ishes to thank D r. E. S. Simpson, who suggested
the thesis topic and directed the study. Acknowledgment a lso is given
to M r. Dallas C hilders, who conducted the cu rren t-m e te r m easu re
m ents on the discharge of Sabino Creek. Thanks a re given to the
following individuals, who accompanied m e on field tr ip s and served
as sam ple co llectors: m y wife, Robin; M r. and M rs. Jack Edmonds;
Mr. S tuart Brown; M r. Robert Lichty; and M r. Raymond H arshbarger.
iii

TABLE OF CONTENTS
LIST OF ILLUSTRATIONS .................................................................... vi
LIST OF T A B L E S ............................................. v ii
ABSTRACT...................................................................................................... v iii
INTRODUCTION............................................................................................. 1
TRACER -DILUTION METHOD OF DETERMINING STREAM DISCHARGE.................................................................................. 5
In tro d u c tio n ............................................................................................. 5T r a c e r s ...................................................................................................... 8F luorescein Dye-Dilution M e th o d ..................................................... 10
Dye S o lu tio n s ............................................................................. 10Background F lu o re s c e n c e ...................................................... 12Computation of S tream D isch a rg e ........................................ 13Dye In jection ................................................................................ 15
M ario tte-F lask M ethod................................................... 16Floating-Syphon M e th o d ..................................................... 19Constant-Head Tank M ethod........................................... 19
A Review of Mixing Length and D ispersion Equations . . 20Dye Samples Collected ............................................................ 23Fluorom eter Operating P r o c e d u r e ..................................... 24
Laboratory E x p e rim e n ts ................................................................. 30
Matching of C u v e t te s ............................................................... 30Fluorescence Loss Due to D irect S u n lig h t............................ 32
Page
iv

V
TABLE OF CONTENTS— Continued
Page
F ield E x p erim en ts ............................................................................. 38
Willow Creek T e s t .................................................................... 39Sabino Creek T est . . . . ......................................................... 46P aria R iver T e s t ............................... 51
, Chinle Wash T e s t ....................................................................... 55
DISCUSSION AND SUMMARY................... 58
Possible Sources of E r r o r .............................................................. 58Future Uses ................................................ 60Future Developments .................................... 63C onc lusion ........................................................................................... 63
APPENDIX A —WILLOW CREEK TEST .................... 65
APPENDIX B — SABINO CREEK T E S T ................... 73
APPENDIX C— PARIA RIVER TEST................................................... 76
APPENDIX D— CHINLE WASH TEST ................................................ 81
REFERENCES 84

LIST OF ILLUSTRATIONS
Figure
1. M ariotte flask, principle of operation .................................. 17
2. D iagram of the T urner Model HIfluorometer optical B ystem ................................................ 25
3. V ariation of fluorescence withexposure to su n lig h t............................................................... 34
4. Decay of B rillian t Pontacyl Pink B onexposure to direct su n lig h t ................................................ 36
5. Flow in Willow C r e e k .............................................................. 41
6. R ecorder chart from Willow Creek diversionof Black R iver gaging s ta tio n .............................................. 43
7. R ecorder chart from Sabino Creek gaging s ta tio n ............ 48
8. Flow in Sabino C re e k ................................................................. 49
9. Dye injection at the upper end of the P a riaR iver te s t r e a c h .................................................................... 52
10. R ecorder chart from P a ria R iver gaging s ta tio n ............... 53
11. R ecorder chart from Chinle Wash gaging station . . . . . 56
Page
vi

LEST OF TABLES
Page
Table
1. D ischarge computations fo r Sabino C reek based on U. S. Geological Survey gaging-station reco rd and dye-dilution m easurem ent . . . . . . 50
vii

STREAM GAGING BY CONTINUOUS INJECTION OF TRACER ELEMENTS
By
W illiam Lewis W errell
ABSTRACT
The practical application of the use of fluorescent-dye tra c e r
elem ents as a m eans of determ ining stream discharge was the con
sideration of th is study. Although this approach is not new in p rin c i
ple, recen t developments in fluorom etry and the development of new
and le ss expensive fluorescent dyes w arrant reapp ra isa l of the
method.
During th is study, the proper use of the fluorom eter was
m astered , p roperties of the dye w ere examined by laboratory te s ts ,
and four field te s ts w ere conducted. T hree of the field te s ts allowed
d irec t com parison between discharge computed by the dye-dilution
method and discharge m easured by a cu rren t m eter; the maximum
variation between the re su lts of these te s ts was 11 percent.
viii

lx
The dye-dilution method m ay be used on stream s in the South
west fo r high-w ater m easurem ents of flow above wading stage where
no cableway is p resen t o r where no adequate cu rren t-m ete r m easure
m ent section can be found. The possibility of future automation of
this m easurem ent system holds prom ise for the rating of new gaging
stations and for providing stream flow reco rds in rem ote a reas .

INTRODUCTION
The sem iarid and d esert regions of the United States p resen t
special problem s in the determ ination of the factors included in a
w ater budget— surface-w ater inflow, outflow, evapotranepiration, etc.
In these regions, efficient utilization of the available w ater resou rces
is of utm ost im portance in o rder to m aintain even the p resen t degree
of w ater usage. In addition, the predicted rapid population growth will
fu rther tax the w ater reso u rces.
The im portance of surface w ater cannot be overestim ated.
Flowing stream s offer the m ost accessib le and often the m ost economic
w ater supply fo r m an 's use. S tream s m aintain lakes and ponds fo r
recrea tion and sustain the a re a 's natural wildlife. Influent s tream s
a re the m ajor source of ground-w ater recharge in a reas of rapid
ground-water decline. However, sedim ent problem s a re inherently
connected with stream flow .
In the sem iarid Southwest, s tream s that have sm all drainage
areas flow interm ittently , perhaps only two or th ree tim es a year in
response to local rainfall; however, when precipitation does occur, a
substantial p a rt of the to tal runoff fo r the year m ay occur within a few
1

2
hours. Steep stream gradients and the lack of vegetative cover allow
rapid runoff. R ainstorm s generate stream flow in which the ris ing
lim b of the hydrograph is characte ris tica lly steep, and the recession
to zero flow may occur within m inutes o r hours.
As the need for accurate data for scientific w ater management
becom es m ore c ritica l, new methods fo r obtaining these data m ust be
developed. The provision of these data, in a la rg e part, is the respon
sibility of the U. S. Geological Survey. In o rder to obtain these data,
su rface-w ater gaging stations have been established throughout the
Southwest. New stations constantly a re being added to the existing p ro
gram . In many p laces, these stations, by necessity , a re established
along sand-channel streeunbeds on alluvial plains. The establishm ent
of the stage-discharge rela tions for these stations is difficult, tim e
consuming, and never-ending. D ischarge ratings for sand-channel
s tream s a re shifting continually, as the controlling section of the r iv e r
changes. In many instances, i t is difficult o r im possible to m easure
the discharge by cu rren t-m e te r methods without a bridge o r cableway,
because the force of the cu rren t is too strong to perm it wading. Some
stations a re not easily accessib le , and often there is no flood warning
because of th e ir location in sparse ly populated a rea s .
P resen t methods for the continuous determ ination of stream
discharge a re based on a stage-discharge relation, in which gage
height, the independent variable, is determ ined by erne of two types of

3
gages— recording or nonrecording. Recording gages a re necessary to
record the stage-tim e relation, which is used with the stage-discharge
relation to determ ine discharge. Stage reco rd ers a re either sh o rt- or
long -term — 7-day or continuous— and a re of the analog or digital type.
Nonrecording gages used to m easure stage a re the staff, w ire-weight,
tape-weight, chain-weight, float, e lectric , hook, and p ressu re gages,
which may be used alone o r in conjunction with continuous reco rd e rs .
The stage-discharge relation is determ ined by m easuring the d is
charge, at different stages, with a cu rren t m eter o r through computa
tions using indirect methods.
F acto rs that affect the stage-discharge relations fo r individual
stream s are scour and fill of the stream bed, stream bed regim e, v a r i
able slope, ice, aquatic vegetation, debris on the control, and changes
in velocity and direction of the curren t.
Indirect m easurem ents used to determ ine the instantaneous
peak discharge a re the slope a rea (application of the Bernoulli energy
equation) and flow through contracted openings, cu lverts, over roadway
embankments, and over dam s. The c res t-s tag e gage, which m easures
only the peak stage of a particu lar flow, is often used to a s s is t with
indirect m easurem ents.
The extrem ely short periods of flow, the sco u r-o n -rise and
fill-on -recession cha rac te ris tic s of sand-channel s tream s, the diffi
culty of making cu rren t-m ete r m easurem ents, and the inaccessibility

4
of stations that have no flood-warning system p resen t serious difficul
tie s in collecting surface -w ater data in the Southwest and other arid o r
sem iarid regions. S tream gaging by continuous injection and m onitor
ing of t ra c e r elem ents shows prom ise in overcoming many of these
difficulties.

TRACER -DILUTION METHOD OF DETERMINING STREAM DISCHARGE
Introduction
The tracer-d ilu tion method of determ ining stream discharge
consists Of injecting a highly concentrated but sm all quantity of tra c e r
solution of known or determ inable strength into stream flow. A fter
re lease , the fluid is allowed to flow downstream fo r a distance, so that
it w ill become homogeneously, vertically , and la te ra lly dispersed
throughout the stream c ro ss section. Monitoring of the tra c e r is con
ducted downstream from th is point. By determ ining the amount of
tra c e r dilution, the quantity of flow can be computed, if it can be a s
sumed that no lo ss o r gain of the tra c e r occurred during the te s t.
D ischarge computed by the dye-dilution method is the quantity
of flow occurring at the point where homogeneous mixing of the dye
takes place. Assuming that th e re is no lo ss or gain of dye during the
te s t and that the s tream is not influent, valid sampling may be conduct
ed a t any point downstream . Thus, fo r the ra ting of a gaging station,
the dye-dilution te s t m ust be located so that mixing will occur up
stream from the gaging station; sam pling should be conducted at the
5

6
station if possible. If additional w ater is added to the stream , such as
tribu ta ry inflow, sampling m ust be done at some distance downstream,
the distance being sufficient so that the dye will become homogeneously
mixed with the to tal o r combined flow.
The cross-sec tiona l a rea of the channel and the stream veloc
ities a re not necessary to determ ine discharge by the dye-dilution
method, which is a great advantage. This elim inates the necessity of
wading the stream or, during high flow, the need fo r a cable ca r. The
dye-dilution method can be used in m ost reaches of the stream channel
without reg ard for the usual facto rs that m ust be considered in p roper
selection of a cu rren t-m e te r m easurem ent section or the facto rs that
affect the choice of sections fo r a slope-area m easurem ent— channel
roughness, velocity direction, and straightness of channel.
At typical sand-channel gaging stations, the computation of
the stage-tim e records requ ires the use of adjustm ent o r shift curves
due to scou r-fill conditions in the channel. Between cu rren t-m ete r
m easurem ents, the proper adjustm ent of the stage reco rd m ay be high
ly speculative. The dye-injection method of computing flow elim inates
this problem . F u ture development of a continuous sampling apparatus
will allow com plete automation of the dye-dilution method of determ in
ing stream discharge. D ischarge m easurem ents could be obtained at
distant infrequently v isited stations. This method will provide a rating

7
for the stream at all stages a t which flow occurs during a te s t. The
rating will be subject to the percent deviation caused by channel shift;
however, fo r the rating of many stations (c res t-s tag e gage sites) th is
deviation will be within desired accuracy. T herefore, one continuous
dye-injection te s t could suffice fo r a number of cu rren t-m ete r m eas
urem ents. This 1-flood ra ting technique m ay b e especially im portant
where different hydrologic studies a re being conducted and statical
ratings a re needed quickly ra th e r than waiting until gaging personnel
have been fortunate enough to observe and gage flow at a wide range of
stream stages.
The disadvantages of the dye-dilution method a re ; (1) high
cost of the fluorom eter; (2) the delicacy of the instrum ent, which tends
to lim it field usage; (3) the necessity fo r an e lec trica l power source
fo r operation; (4) the complexity of fluorom eter serv ice; (5) the need
for exact m easurem ent of weights and volumes in the laboratory; and
(6) the cost of the fluorescent dyes.
At the presen t tim e the cost of the dyes is $16.00 p e r pound;
the dye may be purchased in powder or solution form . A powder-
form dye was used in th is study— B rillian t Pontacyl Pink B.
Without modification, the fluorom eter is capable of detecting
fluorescence of m ore than 2 ppb (parts per billion); fluorom eter m odi
fication will allow detection at considerably low er concentration. The
8
amount of dye used is a function of the lower lim it of detectability of
the fluorom eter, the peak amount of w ater into which the dye is in
jected, and the length of tim e of injection. Extrem e cleanliness is
n ecessary in conducting calibration and apparatus preparation, w hich .
requ ires a special physical facility and considerable tim e fo r mixing
and washing before and a fte r each te s t. Mixing of the injection solution
m ay be extrem ely m essy, causing stains on equipment and clothing.
This is especially tru e if the dye is powdered. The fine powder is
introduced easily into the a ir , and within a few hours, although no dye
is v isible on objects in a room , the wetting of any surface will produce
a highly concentrated dye solution. Obviously, it is n ecessary that dye
mixing be done elsew here than in the cleaning and (or) fluorom eter
room.
T ra c e rs
Originally, it was proposed that two tra c e rs be examined in
this study— salt and a fluorescent dye. The use of sa lt as a tra c e r was
soon deemed im practical. The proposal called fo r m onitoring the sa lt
concentration by e lec trica l conductivity of the stream w ater. However,
to increase the e lec trica l conductivity by a m easurable amount would
add la rg e quantities of sa lt to the stream . Because of the la rg e amount
of sa lt necessary , the physical space and weight required fo r sa lt

9
Injection is probably im practical; also, downstream w ater u se rs migpit
complain about the change in the chemical quality of the w ater. Salt,
however, could be used fo r stream gaging if chemical analyses fo r
chlorine ra th e r than conductivity m easurem ent w ere made or if a flam e
photometer was used. B arsby and Cede (1963) detected sa lt using a
flame photom eter, which indicated cations at levels as low as 1 ppm
(part p er m illion). The tim e and expense that would have been involved
in using either of the above p rocesses would have been beyond the
scope of the w rite r’s resou rces.
Another tra c e r that has been used to determ ine discharge is
the radioactive isotope (U. S. Bureau of Reclamation and others, 1961).
Common isotopes used a re cesium -134, sodium-24, brom ine-82, and
gold-198. The advantages of the use of isotopes for tra c e rs a re the
very low concentrations necessary for detection and the low rad io
active background of the stream . Reasonably accurate in situ field
detection by use of portable instrum entation also is possible. D isad
vantages arising from the peculiar nature of the toxicity a re : (1) the
tra c e r m ust be kept in a lead container from its point of origin until it
is put in the stream ; (2) personnel m ust be m onitored fo r radioactive
exposure during the te s t; (3) it m ust be dem onstrated to the appropriate
licensing agencies that the study will be harm less to the surrounding
population. In addition, it has been found that people a re hostile to the

10
use of radioactive isotopes under any condition. Some of the purely
technical disadvantages a re the high cost of the instrum entation and
tra c e r and the low half life of some tra c e rs , which puts a constraint
cm available tim e, o r the high half life of other tra c e rs , which puts a
constraint on maximum concentration.
T herefore, only the fluorescent dye was tested as a t ra c e r in
determ ining stream discharge. In low concentrations the dye is v isua l
ly undetectable, but i t can be detected in extrem ely low concentrations
using a fluorom eter. Many fluorescent dyes do not a lte r the odor or
ta s te of the w ater. They a re not harm ful to plants o r anim als, and the
dye used in th is study is manufactured fo r the tex tile industry and has
been used in women’s cosm etics.
F luorescein Dye-Dilution Method
Dye Solutions
The dye used in a ll the experim ents—B rillian t Pontacyl Pink
B — is in powder form . The dye was selected because of its reported
low adsorption ch a rac te ris tic s , la rg e range in pH tolerance, and lack
of salin ity effect (F euerste in and Selleck, 1963; W right and Ceilings,
1964).
Two types of dye solution a re required . F irs t , a quantity of
dye m ust be prepared fo r use in the calibration of the fluorom eter.

This solution may be very sm all in volume but m ust be p repared to
exacting standards. The preparation of standard solutions is accom
plished m ost accurately by the use of clean dry laboratory equipment.
A standard solution is obtained by diluting a high-coneentration solution
with d istilled w ater; large-volum e pipettes and volum etric flasks a re
used in th is procedure. F luorom eter calibration req u ires two or m ore
standard solutions, a ll of which a re within the range of detectable con
centrations by the fluorom eter. Each concentration is checked on all
fluorom eter ranges, and the corresponding dial readings a re recorded.
The second type of dye solution is fo r injection into the stream flow. A
rela tively la rg e volume of dye solution is required , but i t is not neces
sa ry fo r the dye concentration to be specifically known at the tim e of
preparation. However, ample dye m ust be injected into the stream to
be within the detectable lim its of the fluorom eter afte r s tream dilution.
Once prepared , the exact dye concentration may be determ ined by the
fluorom eter using the above-mentioned calibration standards.
A volume of 1 m l of w ater at 60*F is equal to 1 cc, and 1 cc
of w ater at 60*F is equal to 1 g. T herefore, 1 g of dye in solution with
1,000 m l of w ater provides a dye concentration of 1 m illion ppb (parts
p e r billion), or 0.25 g provides a solution of 250,000 ppb in 1,000 m l.
No adjustment was made fo r w ater tem peratu res. To compute the
approximate concentration of injection solution, the value fo r is
11

12
obtained in equation (4) a fte r estim ating or guessing a reasonable
value for peak discharge. To assu re complete homogeneity of the
dye-injection solution, dye m ay b e predissolved in sm all amounts of
liquid before being mixed in the la rg e injection apparatus.
Background F luorescence
The natural fluorescence of r iv e r o r s tream w ater is term ed
“ background. “ It is generally very low, ranging from 0 to 1 o r 2
units on range 30 of the fluorom eter. This value m ust be determ ined
and subtracted from all readings obtained from the sam ples collected
during a dye-dilution te s t. Samples of w ater collected upstream of
the injection point o r p rio r to the dye-cloud a rr iv a l at the sampling
station a re used to establish the magnitude of the fluorescence of the
background. It is suggested that a sam ple be collected at the end of
the te s t to determ ine if any variation in background fluorescence
occurred during the te s t. No variation in background was experienced
in the te s ts conducted in conjunction with th is thesis . Adjustment fo r
background m ay b e accomplished (1) by adjustm ent of the fluorom eter
dial so that readings w ill be indicative of the injected fluorescence
only, (2) by arithm etically subtracting the background value from the
fluorom eter dial reading obtained fo r each sam ple, o r (3) by adjust
ment of the y axis of a d ia l-tim e plot of the data points.

13
Computation of Stream Discharge
The dye-dilution technique used in th is study involved contin
uous injection, at a constant ra te , of a homogeneous dye solution.
If
C0 * N atural fluorescence background of the stream w ater;
= Concentration of injection fluid;
C2 * Concentration of s tream w ater afte r the injection
fluid is homogeneously mixed;
Q * Stream discharge, in cfs; and
q « Injection ra te , in m l p e r sec
o r
q(3.53 x 10"*5 ) * Injection ra te , in cfs,
then
the amount of tra c e r added to the stream per unit tim e may be
expressed as:
C i |q (3 .53 x 10‘ 5 )J (1)
and
the amount of tra c e r in the stream , after mixing, is:
C2 [q (3 .53x 10-5) + q J . c oQ

or
14
C2 [q(3.53 x 10~5 )] + C2 Q - C0 Q.
Because the theory of the dye-dilution method assum es no
lo ss o r gain of the tra c e r m ateria l, we may equate equations (1) and
(2), thus:
Cj [q (3 .53 x 10-5 )] » C2 [q (3 .53 x 10"5 )] + C2 Q - C0 Q
or
q(3.53 x 10- 5 ) (C i - C2) * Q(C2 - C0)
or
Q ~ Cg
q(3.53 x 10⁻⁵ ) * C2 - C0
or
o r
Q = q(3.53 x 10- 5 ) C 1 - c 2 c 2 " c o
q(3.53 x 10"5 ) Co - C , Co - C,
If we consider that the background has been compensated for,
our equation becom es:
CC
12
CC
22
Q - q(3.53 x lO"5 )

15
or
c CiQ « q(3.53 x 10”& ) (3)
Because the concentration of the stream w ater is extrem ely em ail
com pared to the concentration of the injection solution, we may
sim plify equation (3) to:
It is in teresting to note that the concentrations a re expressed as a
ratio . Thus, the units m ay be e ither p a rts per billion or fluorom eter
dial readings if all readings a re taken on the sam e range and the
fluorom eter is operating properly in a lin ear m anner.
The ra te that dye is injected into the stream m ust be known.
Dye is injected at a constant ra te to facilita te calculations of s tream
discharge using the dye-dilution method. All types of constan t-rate
discharge apparatus— M ariotte flask, floating syphon, and constant-
head tank— are designed so that the fluid-head of the system rem ains
constant as the fluid is discharged.
Q » E L q(3.53 x 10"5 ). C2
(4)
Dye Injection

16
M arlotte "flask method, —The constan t-ra te injection system
used In th is study is te rm ed the 4 ‘M ariotte-flask m ethod" (fig. 1).
The M ariotte flask apparatus is sim ply designed, constructed,
and compact and does not requ ire a power source. The flask is filled
with a highly concentrated dye solution and is sealed airtigh t, except
fo r the a i r tube. F luid is discharged from the flask by opening the
orifice at the bottom. As fluid escapes, an a rea of reduced p ressu re
is created at the top of the flask, and, as a re su lt, the liquid level
within the a ir tube begins to fall. Continued discharge fu rth er reduces
the p ressu re in the upper p art of the flask , and the liquid level in the
a ir tube continues to fall until, finally, a ir bubbles a re re leased from
the bottom of the tube. At th is tim e, atm ospheric p ressu re exists a t
the bottom of the tube, reg ard less of the fluid level, and the flask be
gins to discharge at a uniform ra te and continues to do so until the
liquid level falls below the bottom of the a ir tube.
It is suggested that the flask be made of ru s t- re s is ta n t m a te
r ia l to reduce the possibility of ru s t or scale plugging the orifice. The
flask should be thoroughly flushed and the orifice cleansed a fte r use. A
cockstop-type valve should be used. During transpo rt of a loaded flask
to a higher altitude, the a ir tube should be plugged at the top o r r e
moved from the flask, in o rd er to prevent reduced atm ospheric p re s
su re from forcing the injection fluid out of the a ir tube and spilling out.

17
F igure 1. —M ariotte flask, 'principle of operation.

18
M r. F . A. K ilpatrick of the U. S. Geological Survey, who has
been experim enting with the method at Denver, Colorado, stated (o ra l
communication), that difficulties a re encountered in the operation of a
M ariotte flask designed to deliver a t a ra te of le s s than 1 m l per sec.
The reduced p ressu re in the valve allows the re lease of a ir from the
w ater. These a ir bubbles slowly build up, and cause a decrease in
orifice a rea and a decrease in discharge ra te . He found that de-a ired
w ater and (or) the addition of a few drops of liquid labora to ry detergent
will alleviate the problem .
In o rder to determ ine accurately the ra te of flow from the
M ariotte flask and to substantiate the fact that the discharge was con
stant, th ree experim ents w ere conducted during th is study. F irs t , a
card was made in the f ir s t few m inutes of d ischarge to check the t r a
jectory angle. The ca rd was cut so that when it was placed along the
upper p a rt of the discharge tube a co rn er barely touched the discharge
stream . The card was placed in the sam e positions at different in te r
vals during the discharge period. Toward the end of the te s t, the co r
n e r of the card s ti ll bare ly in tersected the discharge stream . The
second and th ird experim ents w ere conducted at the sam e tim e as the
f irs t . In the second experim ent a p a rt of the discharge was caught in
a graduated cylinder during a tim ed interval. In the th ird experim ent
the amount of discharge collected during th is in terval was weighed.

The variation, as determ ined by a graduated cylinder, was le ss than
1 percent: 7.99 to 8.04 m l p er sec. The variation, as determ ined by
weight, also was le s s than 1 percent: 7.98 to 8.03 m l p er sec.
Floating-syphon m ethod .—The floating-syphon method has
about the sam e advantages as the M ariotte-flask method. The floating
syphon consists of an open container filled with fluid for d ischarge, a
free ly floating platform on the fluid surface, and the syphon tube, which
is attached to the platform and pro jects to the low er surface of the p la t
form . The tube is an inverted “ U, " the height of which m ust exceed
the depth of the container. The discharge end of the syphon tube m ust
extend beyond the edge of the container. The hydraulic head is adjusted
by the length to which the discharge end of the tube extends below the
elevation of the intake opening of the tube. Once the syphon is started ,
discharge is constant; as the fluid level fa lls , the floating platform is
lowered, but the re la tive positions of the tube openings a re constant.
Constant-head tank method. —Recent industrial needs fo r a
constant low -rate discharge apparatus have prompted the development
of a new product— the constant-head tank. The high cost of the appa
ra tu s is the m ain disadvantage. The tank, m arketed under the name of
Aerofeed, is a closed container with a p re ssu re cap of a ir. A highly
sensitive p re ssu re valve adjusts the orifice apertu re so that the flow
19

ra te is constant as the p re ssu re head of a ir is depleted. The low
stable-flow ra te fo r the apparatus is about 1 m l p er sec.
A Review of Mixing Length and D ispersion Equations
The exact distance requ ired fo r homogeneous mixing of the
dye with the unknown quantity of stream flow is a function of the d iffer
ent hydraulic p roperties of the stream downstream from the injection
point— e. g . , the roughness of the stream channel (Manning’s n),
hydraulic radius, etc. The point or number of points of injection also
influence th is distance. Generally, if dye injection is made at the
s tream ’s center, le ss distance will be necessary for homogeneous
mixing than if injection was made at the s trea m 's edge. In addition,
if injection is made at several points across the stream , the distance
required fo r homogeneous mixing will be fa r th e r reduced. The follow
ing equation used to determ ine the distance required for mixing was
developed by Nobuhiro Yotsukura (engineer, U. S. Geological Survey,
w ritten communication, 1965):
L , i l iL . H1 /6 . wL (5)2 a 2/3 n / g " Dm
where
L * the distance downstream from the dye-solution injection
20
point;

21
a * a constant that is given as 6, fo r L equal to the point
w here the dye f irs t comes in contact with the banks
and as 2 fo r L equal to the point of complete mixing of
the dye;
y3 * an em pirically determ ined coefficient fo r which values
have been found ranging from 0.3 to 0.8 in natural
s tream s but which may have values over a g rea te r
range;
R * the hydraulic radius of the channel;
n = the Manning roughness coefficient;
g = gravitational acceleration;
W = the m ean width of the stream ; and
Dm * the m ean depth of the stream .
The following equations a re lis ted by Andre (1964, p. 28) for
determ ining the distance n ecessary for dye to becom e homogeneously
mixed with stream flow.
D. E. Hull’s equation;
L - a Q l / 3 (6)
where
L = minimum length required fo r homogeneous mixing;

a = 50 if injection is perform ed at stream center, 200 if
perform ed at stream edge; and
Q * discharge.
E im m er’s equation:
h2L * 0.13 k _ J L _ (7)d
where
L * length requ ired fo r homogeneous mixing;
b * average width of the stream between injection
point and sampling point;
d ■ average depth; and
k = C(0.7 C + 6)g
where
C = Chezy coefficient of the given reach with 15 <
C < 50; and
g = acceleration of gravity.
P e re z ’s equation:
22
L = 9.5 nd ( 8 )
where

23
L = length required fo r homogeneous mixing; and
n * 0.32 KR1/ 6
where
K ■ coefficient ■ ■ of Manning’s equation;II
and
R = hydraulic radius
d ■ average stream depth.
In th is study the sam pling point was always a t a distance of
m ore than 50 channel widths, this distance being about 10 tim es the
computed value from any of the above equations.
Dye Samples Collected
W ater sam ples w ere taken downstream from the point of homo
geneous vertica l and la te ra l mixing of the dye-injection solution. A
sm all quantity of stream flow was collected in c lea r pharm aceutical
d ispensary vials of 5-dram capacity, which provided enough liquid to
allow two separate te s ts on the fluorom eter. The sam ples then w ere
placed in a closed box to deter any fluorescence lo ss from the dye due
to exposure to sunlight. Each sam ple taken cm the plateau of the dye
cloud allows computation of the instantaneous s tream discharge.
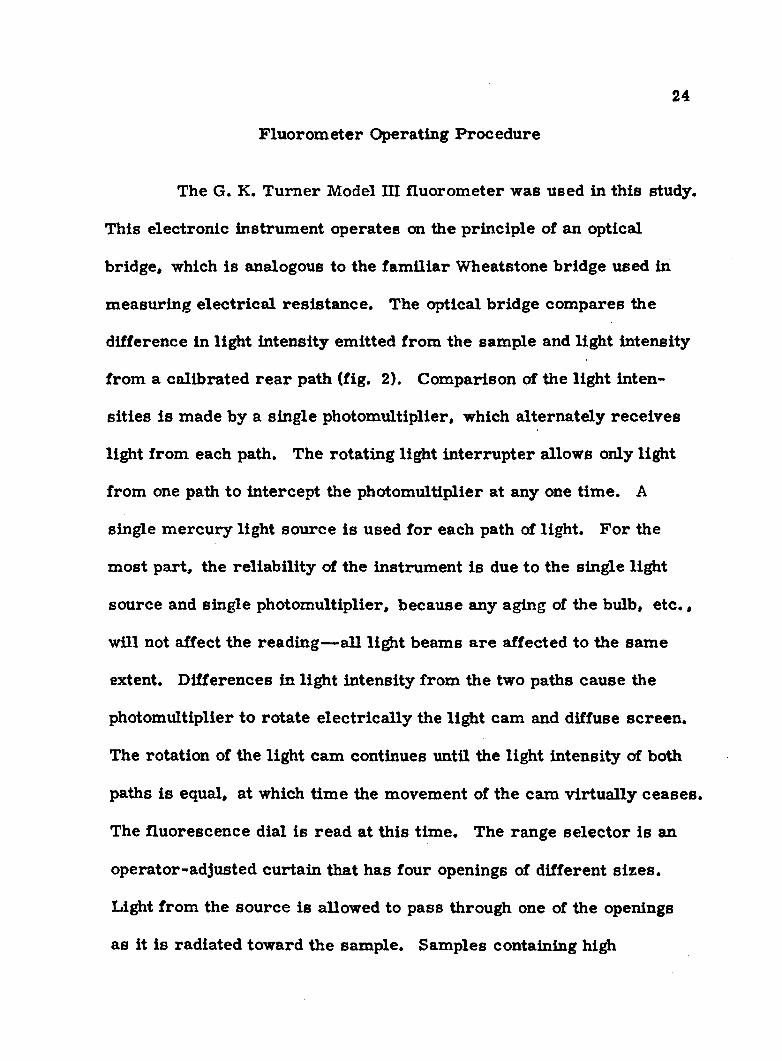
Fluorometer Operating Procedure
The G. K. T urner Model III fluorom eter was used in th is study.
This electronic instrum ent operates on the principle of an optical
bridge, which is analogous to the fam iliar Wheatstone bridge used in
m easuring e lec trica l resis tance . The optical bridge com pares the
difference in light intensity em itted from the sample and light intensity
from a calibrated r e a r path (fig. 2). Com parison of the light inten
sities is made by a single photom ultiplier, which alternately receives
light from each path. The rotating light in te rru p te r allows only light
from one path to in tercept the photom ultiplier at any one tim e. A
single m ercury light source is used fo r each path of light. F o r the
m ost part, the reliab ility of the instrum ent is due to the single light
source and single photom ultiplier, because any aging of the bulb, e tc . ,
will not affect the reading— all light beams a re affected to the sam e
extent. D ifferences in light intensity from the two paths cause the
photomultiplier to ro tate e lec trica lly the light cam and diffuse screen .
The rotation of the light cam continues until the light intensity of both
paths is equal, at which tim e the movement of the cam v irtually ceases.
The fluorescence dial is read at th is tim e. The range se lec to r is an
operator-adjusted curtain that has four openings of different sizes.
Light from the source is allowed to pass through one of the openings
as it is radiated toward the sam ple. Samples containing high

BLANK KNOB
FLUORESCENCE DIAL__
PHOTOMULTIPLIER
BLANKSHUTTERLIGHT INTERRUPTER
LIGHTCAM
MOUNTING BLOCKDIFFUSELUCiTE LIGHT
I PIPES
FORWARD LIGHT PATHULTRAVIOLET
SOURCE
FILTER Passes no u.v.
SAMPLERANGE SELECTOR Four apertures
MOTOR COOLING FAN
Figure 2 .—Diagram of the T urner Model III fluorom eter optical system . (From G. K. T urner A ssociates, 1964.)

26
concentrations of fluorescein dye requ ire the use of the sm alle r open
ing so that the fluorescence dial w ill not run off scale on the upper
magnitude.
The fluorom eter has two locations fo r optical f ilte rs . Both
of these a re on the forw ard light path, the f irs t ju st before the sam ple
and the second im m ediately after the sam ple. The f ilte rs allow light
of only a very re s tric tiv e wavelength to p ass. The f ir s t se t of f ilte rs
passes light that closely coincides to the peak absorption wavelength
of the sam ple compound, and the second se t passes light of the wave
length that the sample em its when excited by the light that passes the
f irs t filte r. The two f ilte r locations a re at right angles to each other,
so that if f ilte r transm ission is somewhat overlapping, only fluorescent
light will reach the photom ultiplier. The instrum ent was used without
a special high-sensitivity green bulb o r a high-sensitivity door, which
increase the fluorom eter sensitiv ity by 10-20 fold.
Although the instructions distributed with the fluorom eter
sta te that a warmup period of 15 m inutes is sufficient fo r operation,
repeated unsuccessful attem pts to reproduce dial readings and (or)
calibrate the fluorom eter showed that a warmup period of several
hours was necessary . A minimum warmup period of 6 hours was
used fo r th is study.

27
Room tem peratu re was therm ostatically controlled at all
tim es. Before examination of the sample, the vials w ere placed in
the fluorom eter room fo r a period of not le s s than 8 hours, which
allowed fo r tem perature stabilization. The sam ple was tran sfe rred
from the vial to a tem peratu re-stab ilized cuvette. The cuvette was
placed 2 o r 3 feet from the fluorom eter to prevent it from gaining
heat from the fluorom eter.
About the sam e length of tim e was taken to run each sam ple.
Cuvettes w ere alternated as quickly as possible without ca re lessn ess .
The fluorom eter door was opened only when necessary in o rder to
m aintain a constant tem peratu re within the cham ber.
The main consideration when reading the fluorom eter dial
should be consistency of method. W hatever method is adopted by the
operator for reading unknown sam ples m ust be adhered to when the
fluorom eter is calibrated. A fter the instrum ent is w arm , it m ust be
checked and possibly adjusted to a ssu re that a reading of zero is shown
when a blank o r dummy cuvette is tested . The dial w avers slightly
during operation, which is due to the servom otor movement, as it
constantly seeks to establish the balance of the optical bridge system
of the fluorom eter. The dial movement is in the magnitude of + 0.25
unit and occurs every half second to a second. A gradual decrease in
magnitude of fluorescence occurs owing to the gradual increase in

tem perature of the sam ple. The tem perature of the cham ber where
the cuvette Is placed is higher than the room tem peratu re . The tem
peratu re of the cham ber is higher because it is located close to the
electronic c ircu itry of the fluorom eter. The tem perature of the sam
ple also increases because the sample is subjected to intense light.
The tem perature increase causes a decrease in the fluorescence of the
sample with tim e. The tem perature increase occurs in 15 to 25 se c
onds, and the fluorom eter readings may drop 1 to 2 units during th is
tim e.
A com plicated chem ical breakdown of the dye occurs when it
is subjected to u ltrav io let lig h t— either sunlight o r the light from the
fluorom eter. However, th is p rocess is accelerated greatly when the
dye is in the fluorom eter, due to the intensity of the light. Labora
to ry experience has shown that if sam ples a re allowed to rem ain in
the fluorom eter fo r le ss than 1 minute and allowed 30-60 m inutes fo r
restabilization to room tem perature, the f ir s t reading usually could be
repeated. Third attem pts, however, usually resu lted in low er read
ings. After considering the above physical variations and operating
characte ris tic s of the instrum ent, the procedure for testing a sam ple
with the fluorom eter is :
(1) A cuvette containing only distilled w ater (a blank sample)
is placed in the fluorom eter and the dial is se t at zero .
28

29
(2) A dye sam ple to placed in the fluorom eter.
(3) The dial to read 20 seconds a fte r the fluorom eter door
is closed. The tim e in terval is sufficient to allow full
dial movement from zero to any reading. This technique
subjects all sam ples to the higher tem perature of the
instrum ent for the sam e length of tim e; therefore , the
tem perature of all sam ples is the sam e at the tim e of
dial reading.
(4) The blank cuvette is placed in the fluorom eter after the
dial reading fo r the sam ple, which re tu rn s the fluorom
e te r dial to the proxim ity of zero . Recent inform ation
from a G. K. T urner represen tative indicates that this
step can be elim inated in future te s ts .
A cuvette to the sm all te s t tube that contains the solution to be
tested in the fluorom eter. To insure accurate fluorescent testing of
the dye solution by the fluorom eter, each cuvette was thoroughly
cleansed and dried before it was filled with the solution to be tested .
E laborate washing of the cuvettes between te s ts is unnecessary, and
thorough flushing with distilled w ater is adequate. A fter washing the
cuvettes w ere placed in the cuvette stand in an inverted position to
facilitate draining; the cuvettes w ere then tran sfe rred to the fluorom
e te r laboratory where they w ere stored in a closed cupboard to re ta rd

30
collection of dust. A period of not le ss than 8 hours was allowed to
elapse before the cuvettes w ere used, which allowed adequate tim e fo r
drying and tem perature stabilization. Cuvettes w ere handled only at
th e ir ex trem ities to prevent the possible fluorescence of fingerprints
from yielding an erroneous reading. The cen ter of the cuvette is
where the u ltraviolet light from the fluorom eter penetrates to d e te r
mine the fluorescence of the solution being tested .
L aboratory Experim ents
Matching of Cuvettes
The instructions fo r the operation of the fluorom eter sta te
that the instrum ent is designed in such a way that any variance in the
optical p roperties of the cuvettes will not be shown in the readings. In
order to substantiate th is, two te s ts w ere m ade. In th is study, 46 new
cuvettes w ere used. Each cuvette was m arked with an identifying num
b e r d irectly below the cuvette lip , well above the p a rt of the cuvette
through which light p asses.
In the f ir s t te s t, a weak dye solution was mixed at an a rb i
tra ry strength. The solution was s tir re d with a m agnetic s t i r r e r for
15 m inutes to assu re homogeneity of the solution and was placed in a
cupboard in the laboratory for 12 hours to allow tem peratu re stab ili
zation. A fter a 12-hour warmup period of the fluorom eter, the

31
cuvettes w ere filled with the dye solution and tested . A listing of the
fluorom eter readings that corresponded to the appropriate cuvette was
made. All readings w ere obtained on range 30. Of the 46 cuvettes
tested , 42 produced readings of 22.5 units, and the rem aining 4 p ro
duced readings of 23.0 units.
The second te s t utilized a strong dye solution, and the sam e
procedure was used as in te s t one. The readings in te s t two w ere
obtained on range 1, and the re su lts a re tabulated below:
F luorom eter reading Number of cuvettes ______ (units)_______
2 96.02 96.58 97.05 97.56 98.0
16 98.55 99.02 99.5
The four cuvettes that produced the higher readings in the f ir s t te s t
gave readings of 97.0, 97. 5, 98.0, and 98. 5 in the second te st. The
higher readings obtained in the f ir s t te s t a re attributed to an inherent
play of + 0.25 unit in the fluorom eter dial. The g rea te r variation in
readings in the second te s t, however, is not com pletely understood,
but it may be due to the increasing in terference of one dye partic le with
another as concentration increased.

32
The resu lts of the two te s ts show that no calibration of Individ
ual cuvettes is necessary . The te s ts indicate that the e r ro rs fo r
individual cuvettes are not system atic and that calibration of cuvettes
would make no significant improvem ent on precision of final resu lts .
F luorescence Loss Due to D irect Sunlight
Adsorption of dye by apparatus and photochemical changes in
dye cm exposure to d irect sunlight have been reported by many w orkers.
Each of these factors causes a loss of dye from the system and resu lts
in e r ro r of the dye-dilution method, because the theory of the method
assum es no lo ss o r gain of dye during the procedure. The e r ro r would
resu lt in overcalculation of the tru e ra te of stream flow. The m ost
recent developments in fluorescent dyes a re ' ‘B rillian t Pontacyl Pink
B ” and “ Rhodamine WT E xtra, " which a re m anufactured by the
General Analine and F ilm Corp. The m anufacturer rep o rts that the
dyes have qualities superio r to those of previous products— i. e . , le s s
adsorption on solids and g rea te r photochemical stability. These prop
ertie s w ere examined in two experim ents using B rillian t Pontacyl
Pink B.
The purpose of the f ir s t experim ent was (1) to determ ine if
dye adsorption would occur in m easureable amounts on the plastic

33
pharm aceutical dispensary vials used for dye sampling purposes, and
(2) to examine the extent of photochemical change.
The dye solution was fresh ly prepared and m agnetically
s tirred fo r 15 m inutes in a glass beaker to a ssu re homogeneity. Dye
concentration was a rb itra r ily chosen but was within the detectable
range of the fluorom eter. Each of the 12 new vials was flushed with
distilled w ater, dried, and filled with solution. F our of the vials w ere
placed in a cupboard, and the 8 rem aining vials w ere placed outdoors
on the night of June 9, 1965. The 8 vials w ere exposed to the sun fo r
different periods of tim e ranging from 1 to 4-1 /2 days (fig. 3). The
vials that w ere exposed fo r le ss than 4-1/2 days w ere placed in the
cupboard until the end of the te s t. F luorom etric testing of the solution
was conducted in two periods— afte r the f ir s t day, 2 of the 4 v ials in
the cupboard w ere analyzed, and at the end of the 4-1 /2 days, the r e
maining vials w ere analyzed. The conclusions from the f ir s t experi
ment a re : (1) within the range of the experim ent, the decay of fluo
rescence of the dye on exposure to d irect sunlight is a lin ea r function
of tim e, (2) the decay of the dye that rem ained inside the cupboard
was negligible, and (3) the amount of dye adsorption onto the p lastic
v ials was negligible.
In 1967—January 9-14 and January 16-20— a second experi
ment was conducted to examine the photochemical decay p roperties of

34
9 30 —
20 -
Time, in days
June 9-15, 1965
F igure 3. —Variation of fluorescence with exposure to sunlight.

35
B rillian t Pontacyl Pink B. The second experim ent was s im ila r to the
f irs t, except that four standard solutions of differing concentrations—
313 ppb, 156.25 ppb, 62.6 ppb, and 6.26 ppb—w ere used. An attem pt
also was made to m easure the total so la r energy absorbed by each
sam ple. V ials w ere filled with each of the four standard solutions
(26 vials of each); a to tal of 104 vials was used. F our v ials of each
concentration w ere sto red in the laboratory cupboard in nearly to tal
darkness to calibrate the fluorom eter. It is assum ed that solutions
a re stable under these conditions.
The rem aining vials w ere placed in d irec t sunlight from 0930
to 1530 hours during different days of the te s t. The cumulative expo
su re to sunlight was converted to langleys (cal per cm 5*) by consulting
records of radiation intensity at the U niversity of Arizona Departm ent
of Atmospheric Physics. F igure 4 shows the rela tion between change
in fluorescence and to tal exposure. It should be noted, however, that
the langleys given w ere m easured by a pyrheliom eter; therefore , they
provide a m easure of so la r energy absorbed by the sam ples. The
actual energy absorbed by the sam ples would have to be m ultiplied
by a factor (factor unknown) to account for reflection and absorption
of energy by the p lastic containers. Unfortunately, the value of
this facto r is not known. All sam ples w ere tested at the sam e tim e,
after proper fluorom eter warmup and tem peratu re stabilization.

Dye concentration, in parts per b illion
1 f> l l I
H 2000
I I l
Figure 4. --D ecay of B rillian t Pontacyl Pink B on exposure to d irec t sunlight.
000 3

37
The apparent lo ss of dye due to photochemical decay m ay be observed
from the fluorom eter calibration curve constructed from the standard
solutions that rem ained In the cupboard. All lines on figure 4 a re
parallel; 313 ppb concentration is somewhat uncertain, however. In
each case 50 percent of the original fluorescence was lo st a fte r a
cumulative exposure of about 2,300 langleys, as recorded by the
pyrheliom eter.
Since there a re about 500 langleys p er 6 hours of d irec t noon
day sunlight on a bright January day, we have an apparent half life of
fluorescence equal to about 27 hours. By analogy with radioactive
decay, we m ay use the equation
F « F o e* * 1 , (9)
where
F * F inal concentration;
F q * Initial concentration;
e = A m athem atical constant;
„ , 0.693T
where
T * Tim e of half life; and
t » Tim e during which decay occurred.

38
Assuming that 6 hours is the maximum amount of d irec t sun
light possible In any given te s t and that the original concentration was
100 ppb, we obtain
e )F * 100 e ' 27 A /
- 100 e ‘ *154
100* e .154
1001.1666
* 95.76,
which indicates that the maximum percentage of decay fo r any te s t is
about 14 percent.
F ield Experim ents
F our field te s ts w ere conducted during th is study—Willow
Creek te s t, Sabino C reek te s t, P a ria R iver te s t, and Chinle Wash te s t.
Sampling of stream flow fo r analysis of fluorescent dye was conducted
at 2-1 /2 minute in tervals. The sam ples w ere collected in 5-dram
c lea r p lastic pharm aceutical d ispensary v ia ls . In sam ples that con
tained sedim ent, the v ia ls w ere allowed to stand until the sedim ent
settled to the bottom; only the c lea r supem ate was fluorom etrically
tested . B rillian t Pontacyl Pink B tr a c e r was injected using a

39
30-gallon M arietta flask. A sm all amount of t ra c e r fluid was collected
from the flask at the beginning and end of the injection period for te s t
ing in the fluorom eter to determ ine if the dye was of equal concentration
during the en tire te s t. The fluorom eter showed each injection solution
to be homogeneous. C urrent -m ete r m easurem ents w ere conducted
using the specifications of Corbett and others (1943). The m easu re
m ents a re on file in offices of the U .S. Geological Survey, W ater R e
sources Division, Tucson. The fluorom eter readings fo r a ll sam ples
and the background fluorescence of each te s t a re given in the appendices.
Sampling for background fluorescence was conducted several feet up
stream from the injection point a t the beginning and end of the injection
period. The background fluorescence was constant during each te s t.
Sediment sam ples w ere collected using the equipment and methods out
lined by the U .S. Inter-A gency Committee on W ater R esources (1965)
and w ere analyzed by the W ater R esources Division of the U. S. Geo
logical Survey, Tucson. A com posite sam ple was analyzed, and a
sieve analysis was conducted to determ ine sedim ent size.
Willow C reek T est
Willow C reek is on the Apache Indian R eservation in Graham
County. A prelim inary te s t was conducted on the creek under uniform
flow conditions on Septem ber 5, 1965. At the tim e of the te s t, the

40
discharge of the creek was due to pumping—pumpage reco rds Indicate
that a discharge of 9,200 gpm (20.49 cfs) was maintained throughout
the day (fig. 5).
The reach used during the te s t extends downstream from the
pipe outlet fo r 2.2 m iles. Injection took place 50 feet below the pipe
outlet (fig. 5A). The tra c e r was injected at a ra te of 13.17 m l per sec
for 67 m inutes. A 45-m inute lapse in injection allowed the stream flow
to re tu rn to norm al fluorescence. The second injection period lasted
for 17 m inutes, and fluid was injected at a ra te of 51.29 m l per sec.
O bservers took sam ples sim ultaneously 0.3, 1.2, and 2.2
m iles downstream from the injection point. Several hundred sm all
wooden blocks w ere dropped into Willow C reek 15 m inutes before the
f irs t injection to se rve as m a rk e rs fo r the observers. O bservers
counted from the tim e the blocks w ere sighted until the sixth 2-1/2
minute in terval th e reafte r, when they filled four v ials at equidistant
increm ents across the stream . This procedure was repeated a t the
twelfth 2-1/2 minute interval, when five vials w ere filled at equidistant
increm ents. The regu la r sam ples w ere taken throughout th is period.
The c ro ss -channel sam pling was done to check each station fo r validity
of represen tative sam ples. The cross-channel sampling also served
as a check fo r homogeneity of dye m ixture throughout the stream width
at that point.

FIGURE 5
FLOW IN WILLOW CREEK
A.
Willow Creek diversion from Black R iver gaging station.
M ariotte flask in place and discharging.
B.
Flum e used for discharge m easurem ent. Flow from right to
left.

41
FIGURE 5

42
The reco rd e r chart from the U. S. Geological Survey gaging
station at the pipe outlet is shown in figure 6. The slight variation in
stage indicates essentially constant discharge. A cu rren t-m ete r
m easurem ent was made during the f ir s t injection period, and showed
a discharge of 20.03 cfs. The sedim ent concentrations of Willow Creek
was extrem ely low during the te s t, and the flow appeared c ry s ta l-
c lear. R esults of the dye-dilution te s t a re shown in Appendix A. F o r
the f ir s t injection period, a d ischarge of 20.24 cfs was calculated from
the plateau of the upperm ost sam pling site .
The fluorom eter dial readings v ersus tim e fo r each site w ere
plotted. The a reas under the respective curves w ere determ ined and
a re as follows:
P a r ts per billionSite D ial-m inutes fluorescence-
m inutes
1 2,453. 25 921.69
2 2,447. 00 919. 34
3 2, 447. 56 919.55
The percent variation of the extrem es (Sites 1 and 2) varies
by only 0.26 percent. T herefore, the lo ss of dye by adsorption was
very slight during th is experim ent; any lo ss would have been reflected
in a decrease in a rea under the curve fo r each site downstream.

43
2.4
Time, in hours September 5, 1965
Figure 6. —R ecorder chart from Willow Creek diversion of Black R iver gaging station.

44
Inasmuch as the discharge of Willow C reek was constant,
analysis of the te s t is possible by the to ta l-recovery method. This
method is used where a " s lu g " of dye is injected into the stream , and
the dye cloud is m onitored downstream. The theory of the method
does not requ ire that the dye be injected instantaneously. The follow
ing equation is applicable:
QVT C1
<C2-C0)dt( 10)
where
Vip ■ The volume of dye solution injected into the
stream ;
C i = The concentration of injection solution;
C2 * The concentration of stream flow (variable)
a fte r the injection fluid is homogeneously
mixed across the stream section;
C0 * The natural fluorescence background of the
stream flow; andr°o
(C2 -C Q)dt = The total a rea under the concentration-tim e
curve.
Applying equation (10) to data from the upper site , the f ir s t
part of the Willow C reek te s t, where the injection ra te using the
M ariotte flask was 13.17 m l p e r sec:

45
where
Vr ■ 13.17 m l p e r sec
Vr = V olum e-rate of injection,
so
VR = 0. 01317 1 p er sec,
o r VR * (0.01317X0.03531)
* 0. 00046503 cfs
Injection was continued for 67 m inutes (4, 020 seconds).
VT = (0.000465031X4020)
« 1.86943 ft3
The concentration of the injection fluid was determ ined to be
335,140 ppb.
Thus:
VT C1 = (1.86943X335,140)
= 626,521.26 ppb f t3 (11)
The fluorom eter readings from tim e 1115 to 1315 w ere plotted
and a smooth curve was passed through the points. (See Appendix A .)
From this curve, fluorom eter readings w ere selected at 1.2 5-minute
increm ents. Using the fluorom eter calibration curve, each fluorom e
te r reading was converted to parts per billion. Thus, by the histogram
method, the a rea under the curve is 29, 700 ppb sec. Using this
figure and substituting equation (11) into equation (10), we obtain:

O . 826,521 V 29,700
Q == 21.09 cfs
The la rg e r discharge indicated by the to ta l-recovery method
may be due to a slight inaccuracy in determ ining the a rea under the
concentration-tim e curve o r to the possible lo ss by sorption of dye on
the leading front of the initial dye cloud.
Results of the Willow Creek te s t a re as follows:
M easuring methodD ischarge
(cfs)
V ariation from cu rren t-m e te r m easurem ent
(percent)
Variation from dye-
dilution te s t (percent)
Pumping station 20.49 + 2 .3 + 2 .2
C urrent m e te r 20.03 0 .0 - 1.0
Dye dilution 20.24 + 1.1 0 .0
Total recovery 21.09 + 5 .3 + 4 .0
Sabino Creek T est
Sabino Creek is in the Coronado National F o re s t, P im a
County. A te s t was made on the creek under nonuniform flow condi
tions on November 25, 1965.
The reach used extends 0.85 m ile downstream from the low er
stream crossing on upper Sabino Canyon D rive. The low er end of the

47
reach is m arked by a Survey gaging station cableway located about 300
feet downstream from the gaging station. Injection was made at the
crossing at a ra te of 13.17 m l,per sec. Samples w ere taken beneath
the cableway.
The reco rd e r chart from the gaging station is shown in
figure 7.
Three cu rren t-m ete r m easurem ents w ere made during the
te s t under the cableway (fig. 8):
Mean tim e of the Computed dischargem easurem ent _______ (cfs)
2110 2202320 1480040 118
The sedim ent concentration was very low, and the flow was
c lea r and clean on visual inspection. Results of the dye-dilution te s t
a re shown in Appendix B. The discharge determ ined by the second
cu rren t-m eter m easurem ent was 148 cfs com pared with a discharge
of 141 cfs by the dye-dilution method. D ischarge by the dye -dilution
method was 4.7 percent below that given by the cu rren t-m e te r
m easurem ent (table 1).

Gag
e he
ight
, in
fee
t48
Time, in h o u rs ;
Novem ber 25, 1965; November 26, 1965
•Figure 7, —R ecorder chart from Sabino Creek gaging station.

FIGURE 8
FLOW IN SABINO CREEK
A.
Dye Injection site for Sabino Creek test.
B.
Dye sampling and curren t-m eter-m easurem ent site fo r Sabino
Creek te s t.

49

TABLE 1DISCHARGE COMPUTATIONS FOR SABINO CREEK BASED ON
U. S. GEOLOGICAL SURVEY GAGING-STATION RECORD AND DYE-DILUTION MEASUREMENT
Tim e(hours)
GAGING STATION DYE-DILUTIONMETHOD
Difference between dye-dilution method and gaging-station
record (percent)
Gageheight(feet)
Shiftadjustm ent
(feet)
Adjustedgage
height(feet)
D ischarge(cfs) Discharge
(cfs)
2245 3. 77 -0.38 3.36 163 148 -10.1
2300 3. 72 -0. 38 3. 34 159 145 - 9 .7
2315 3. 68 -0.38 3. 30 153 142 - 7.7
2330 3. 64 -0.38 3.26 147 140 - 4 . 8
2345 3. 60 -0. 38 3.23 141 138 - 2.1
2400 3. 57 -0.38 3. 19 137 137 0 .0

51
P a r is R iver T est
The P a r is R iver is in Coconino County. A te s t was conducted
on the r iv e r on A pril 3, 1966, to determ ine the validity of the dye-
dilution method in sedim ent-laden stream s.
The reach used during the te s t was the 1.5 m iles above the
junction of the P a r is and Colorado R ivers. Injection took place a t the
upper end of the reach . The tr a c e r was injected at a ra te of 4.22 m l
p e r sec fo r 2 hours and 20 m inutes (fig. 9).
O bservers took sam ples 0.4 and 1.2 m iles downstream from
the injection site . The reco rd e r chart from the U .S. Geological Survey
gaging station 0.2 m ile downstream from the injection site is shown in
figure 10.
At the low er site , the data obtained by the dye-dilution te s t
w ere erroneous, because the station was too close to the Colorado
R iver. The Colorado R iver flow increased during the te s t, and the
observer reported an increase in stage of the P a ria at the sam pling
site . The evidence suggests that backwater conditions from the
Colorado R iver affected the data obtained from the low er sam pling site .
In the P a ria R iver te s t, an unusual degree of sca tte r of the
data is evident, which is probably due to slight contamination of the
sam ples afte r an accident with the M ariotte flask in transpo rt. F luid
spilled from the tank resu lted in the staining of the cardboard

FIGURE 9
DYE INJECTION AT THE UPPER END OF THE PARIA RIVER TEST REACH

53
Tim e, in hours April 3, 1966
Figure 10. —R ecorder chart from P a r is R iver gaging station.
1

54
containers in which the new and unused sampling vials w ere stored.
Special ca re , however, was exercised by the sampling personnel to
avoid vial contamination. Results of the te s t data show a slight random
distribution which m ay b e due to (1) sam ple contamination due to the
accident, (2) the sedim ent load of the stream , and (3) variation of
background due to differences in sedim ent in the vials at the tim e of
fluorom eter analysis.
Two cu rren t-m ete r m easurem ents w ere made in order to
com pare the amount of discharge given by the cu rren t m eter with the
amount given by the dye-dilution method. The f i r s t cu rren t-m ete r
m easurem ent was made at the point of dye injection (8.79 cfs) and the
second was made at the upper sampling site (7.85 cfs). It was neces
sa ry to extend the dye-dilution data to the tim e of the cu rren t-m eter
m easurem ent. The data w ere extended by drawing a straigh t line
through the mean of the data points, which rep resen t instantaneous
stream fluorescence. The tim e interval fo r the points used was from
1205 to 1330 hours. Three sedim ent sam ples w ere taken 50 feet up
stream from the injection site . The sedim ent load was 1,470 ppm by
weight; 99.8 percent of the sedim ent was finer than 0.053 mm. The
re su lts of the dye-dilution te s t a re shown in Appendix C and a re com
pared with the cu rren t-m e te r m easurem ent below;

55
V ariation fromDischarge cu rren t-m ete r
M easuring method (cfs) m easurem ent(percent)
C urrent m eter 7.85 0.0
Dye dilution 8. 71 + 11.0
Chinle Wash T est
Chinle Wash is in Apache County. A second te s t on sedim ent-
laden stream s was conducted on A pril 10, 1966.
The reach used during the te s t extends 1.2 m iles downstream
from the bridge on Arizona Highway 64. Injection took place beneath
the bridge at a ra te of 4.22 m l per sec for 4 hours.
The observer took sam ples 1.2 m iles downstream from the
bridge. The reco rd e r chart from the U. S. Geological Survey gaging
station 100 feet upstream from the bridge is shown in figure 11, and
the resu lts of the dye-dilution te s t a re given in Appendix D.
A cu rren t-m ete r m easurem ent was made 160 feet upstream
from the bridge and showed a discharge of 2.68 cfs. The sedim ent
load was 3,720 ppm by weight, and 99.9 percen t of the sedim ent was
finer than 0.053 mm.
A d irect com parison of discharge computed from the cu rren t-
m eter m easurem ent with discharge computed from the dye-dilution

Tim e, in hours April 10, 1966
Figure 11. —R ecorder chart from Chinle Wash gaging station.

57
method is not possible. The cu rren t-m ete r m easurem ent was conduct
ed at the injection point ra th e r than at the sampling site . T herefore,
a d irect com parison of the two means of s tream m easurem ent would
requ ire a tim e adjustm ent of the m ean tim e of the cu rren t-m ete r
m easurem ent so that it would apply to the sam e stream discharge at
the sampling site . The fact that the mean tim e of the cu rren t-m ete r
m easurem ent was 55 minutes afte r the s ta rt of injection is of no help,
because the sampling site was chosen a rb itra r ily and has no rating
relation with the gaging station, and the staff o r r iv e r stage was not
recorded at the sampling s ite .
This te s t shows the im portance of taking sam ples and cu rren t-
m eter m easurem ents at the sam e location. If the purpose of a dye-
dilution te s t is the rating of a gaging station, the sampling site m ust be
close to the gaging station.
Because the sca tte r of data points was sm all in spite of the
high suspended-sedim ent concentration during the Chinle Wash te st, it
seem s likely that the sca tte r in the P a ria R iver te s t was due to causes
other than suspended-sedim ent concentration.
D ischarge as determ ined by the dye-dilution method ranged
from 2.40 to 4.00 cfs.

DISCUSSION AND SUMMARY
Possible Sources of E rro r
If system atic e r ro rs a re disregarded, the m ean of e r ro rs in
cu rren t-m eter m easurem ents is random and is norm ally distributed
(C arte r and Anderson, 1963, p. 106). The sam e is assum ed tru e for
fluorom eter operation, but not fo r the dye-injection method as a whole.
Dye adsorption onto organic o r inorganic substances and fluorescence
breakdown of the dye with exposure to light reduce the magnitude of
fluorescence recovered in the sampling procedure. The lo ss resu lts
in departure from the theory used in the dye-injection method. B e
cause the degree of fluorescence is inversely proportional to discharge,
the mean of the e r ro rs involved in the dye-dilution method will resu lt
in some plus value— i. e . , the dye-dilution method w ill tend to over
estim ate the tru e o r exact discharge.
This study indicates that collectively the e r ro rs a re very
m inor. Although no sediment was present in the flow of Willow Creek,
the homogeneous dye solution was in contact with the stream channel
fo r 2.2 m iles. Several v a rie ties of g rass in la rg e stands occur in and
along the channel. Willow Creek is at an altitude of 5,975 feet, w here
58

59
there was d irect noonday sunlight during the early hours of the test.
At this altitude, the sunlight should contain considerable u ltraviolet
rays. Although the rays m ay be responsible for fluorescence decay of
the dye the Willow Creek te s t showed no m easureable adsorption or
fluorescent decay. T herefore, fo r p ractical purposes the plus mean
e r ro r fo r dye-dilution te s ts is negligible.
It is suspected that different organic and inorganic substances
will exhibit slightly different affinities fo r dye adsorption and absorp
tion. Conducting the dye-injection te s t at night elim inates the fluo res
cence-decay factor; however, floods occur anytime, and the u se r of
automated dye-injection te sts m ust consider th is possibility.
Dye m anufacturers a re engaged in re sea rch to develop dyes
that will reduce the p roperties of sorption and light decay presen t in
curren t products.
The deviation between computed discharge by the cu rren t-
m eter method and computed discharge by the dye-dilution method does
not always indicate e r ro r in the la tte r method. Computation of d is
charge using the P ric e cu rren t m eter u tilizes the following equation:
Q « VA (12)
where
Q * discharge, in cubic feet per second;

V * velocity, in feet p e r second; and
A = area , in square feet.
Equation (12) allows the computation of the ra te of discharge
of w ater in c lea r s tream s. Suspended sedim ent in a s tream will occupy
a certa in percent of the stream area , and the computed value of Q will
no longer rep resen t the flow of w ater alone. Normally, th is facto r is
ignored, because of the extrem ely low -sedim ent concentrations in most
s tream s. Even sedim ent loads that a re term ed “ heavy" norm ally do
not consist of concentrations la rg e enough to cause an e r ro r of a m ag
nitude that would equal the e r ro r of a cu rren t-m e te r m easurem ent. In
the Southwest, however, sedim ent loads at high stage riva l World r e c
ords fo r suspended-sedim ent concentrations. In som e northern
Arizona stream s, as much as 20 percent of the volume of stream flow
is occupied by sedim ent (600,000 ppm by weight). T herefore, this
factor should be considered when com paring cu rren t-m e te r m easu re
ments and dye-dilution m easurem ents made on s tream s with high
suspended-sedim ent concentrations.
F u ture Uses
The greatest potential afforded by the dye-dilution method of
computing flow is in the ra ting of different types of surface-w ater
stations. In this regard , the dye-dilution method may be utilized in
60

61
conjunction with slope-area m easurem ents; where difficulty In acquir
ing slope-area m easurem ents is encountered, it alone m ay be used.
Where dye Injection and sampling a re continuous fo r the
duration of flow, the dye-dilution method offers a d irec t method fo r
determ ining total discharge. This approach offers g reat prom ise fo r
flashflood studies in the Southwest, where station ratings have not
been established. The dye-dilution method especially lends itse lf to
studies involving a w ater budget.
Continuous injection and sampling will allow a h y ste resis
analysis of flood hydrographs and w ill provide both the rating for peak
discharge and the to tal discharge. Storm hydrographs typically show
very steep ris in g lim bs and m ore extended recession lim bs. Most
cu rren t-m eter m easurem ents a re made at peak discharge o r on the
recession lim b of the hydrograph. In many instances, th is is due to
the lack of flood warnings, which prevent personnel from being at the
site and ready to take m easurem ents when flow begins. However,
ris ing stages typically c a rry huge quantities of debris, which make
cu rren t-m eter m easurem ent difficult o r im possible. As a resu lt, few
cu rren t-m ete r m easurem ents exist fo r the ris in g lim b of hydrographs.
Even if a cu rren t -m ete r m easurem ent is obtained on the ris in g lim b
of a hydrograph, another problem is encountered in the computation
of the m easurem ent. The v ery rapid change in r iv e r stage during
m easurem ent req u ires that the computed gage height be weighted.

62
This weighting reduces the accuracy of the gage-hei^it value assigned
to the m easurem ent. T herefore, the evaluation of the hyste resis ef
fect of rating curves for different stations is im possible or produces
questionable resu lts . The dye-dilution method, however, may allow
this evaluation.
Before using the dye-dilution method fo r evaluation of the
hyste resis effect, however, the following factors m ust be considered.
During the ris in g limb of the hydrograph, w ater en ters the stream bank
and form s bank storage. If a dye-dilution m easurem ent is in p rog ress,
the dye concentration in th is w ater will be dependent on the ra te of
discharge. As discharge increases, dye concentration decreases, a t
the sam e tim e that m ore w ater is lo st to bank storage. Thus the dye
concentration of the w ater in bank storage will vary . As discharge
decreases, w ater will be re leased from bank storage but at a different
ra te than that at which it entered; also , the to tal volume of w ater r e
leased will be le s s than the volume stored. The dye concentration in
the w ater re leased from bank storage will be of a different magnitude
than that of the r iv e r w ater. The above facto rs would com plicate any
analysis. Fortunately, in m ost cases these effects m ay be neglected
without significantly affecting the accuracy of the discharge calculation.

63
F utu re Developments
U .S. Geological Survey personnel a re , a t the present tim e,
involved in studies to determ ine the applicability of the dye-dilution
method in m easuring stream flow under different conditions and in
different localities . The Survey is developing apparatus designed to
inject and sam ple autom atically when triggered by stream flow. M ajor
factors in the consideration of automatic apparatus a re the initial
expense, sim plicity of operation, and physical size. The withdrawal
of a d iscre te dye sample at short tim e in tervals w ill be necessary .
In s tream s in the Southwest, sampling m ust begin at o r n ea r zero flow
and continue for the duration of flow. The method will provide data
for rating the station at all r iv e r stages during the te s t, and total
discharge also may be computed.
Conclusion
The feasibility of conducting discharge m easurem ents by the
dye-dilution method has been examined by laboratory and field experi
m ents. The d irec t com parison of d ischarge computed from the cu rren t-
m eter m easurem ent and computed from the dye-dilution method was
possible in th ree field te s ts . The maximum deviation between the two
methods was 11 percent. This percentage contains possible e r ro rs in
the cu rren t-m ete r m easurem ent and the dye-dilution method. The

64
figure corresponds favorably with the computed discharge from gaging
stations cm sand-channel s tream s. F o r a slope-area m easurem ent,
15 percent accuracy is considered near optimum. Therefore, the
conclusion is made that computation of stream flow by the dye-dilution
method holds prom ise fo r gaging stream s in the Southwest. Such
m easurem ents fa ll well within the acceptable lim its of accuracy.

APPENDIX A —WILLOW CREEK TEST
Fluorom eter calibration: 34 ppb ■ 90.5 on fluorom eter dial.
Injection solution * 335,140 ppb.
Injection ra te * 13.17 m l per sec.
D ischarge obtained by cu rren t-m e te r m easurem ents is lis ted as CMM.
A background of 1.0 dial units has been rem oved from the following data.
Tim e(hours)
F luorom eterreading D ischarge
(dial units) (cfs)
1115
(Upper station)
0.00.50.00 .00.02.5
1130 2.56.0
13.517.019.0 20.03 CMM19.5
1145 19.5 20.020.520.0 20.2420.5 20.2420.5 20.24
65

66
Tim e(hours)
1200
1215
1230
1245
1300
1315
Fluorom eter reading
. (dial unite)
20.520.520.520.520.520.5
20.520.520.520.5 20.0 20.0
20.520.517.5
8.54.52 .0
1.51 .00.50.50.50.5
0.50.50 .00.50.00.5
0 .00.00 .00.5
26.053.5
D ischarge(cfs)
20.2420.2420.2420.2420.2420.24
20.2420.2420.2420.24

67
Fluorom eterTime reading
(hours) (dial units)
1330 66.566.567.567.553.526.5
1345 13.57.05.03.01.51.0
1400 0.50 .00 .00 .0
(Middle station)
1200 0 .00.00 .00.00 .00.5
1215 1.53.04.58 .0
10.512.5
1230 14.515.516.517.018.018.5
D ischarge(cfs)

6 8
Tim e(hours)
1245
1300
1315
1330
1345
1400
Fluorom eter reading
(dial units)
18.519.019.019.019.019.5
19.519.519.519.519.519.5
20.019.519.016.513.511.0
8.56.55.54 .53.5 3.0
2.52 . 01.51.5 1.0 1.0
0.50.51.54 .58.5
22.5
Discharge(cfs)
21.28
21.2821.2821.2821.2821.2821.28
21.28

69
Time(hours)
1415
1430
1445
1500
1515
Fluorom eter reading
(dial units)
33.542.552.551.048.042.5
34.026.019.515.012.510.0
8 .06.55.54.53.52.5
2 .01.51.0
0.50.50 .00 .0
(Lower station)
0 .00 .00.51 .01.52.5
D ischarge(cfs)
1300

70
Time(hours)
1315
1330
1345
1400
1415
1430
Fluorom eter reading
(dial units)
4.05.06.58 .08.5
10.0
Discharge(cfs)
11.012.514.513.514.515.0
15.516.016.516.516.516.5
17.017.017.019.518.017.5
16.515.514.5 13.011.510.5
9.58 .07.56.56 .05.5

71
Time(hours)
1445
1500
1515
1530
1545
1600
Fluorom eter reading
(dial units)
4 .54.04.03.53.53.5
5.58 .0
11.517.023.028.0
32.5
33.531.028.5
24.521.519.516.514.512.5
11.09.58.57.5 7.06.5
5.55.04.54.03.53.0
Discharge(cfs)

72
Fluorom eterTime reading
(hours) (dial units)
1615 2.52.52.02.0
1.5
1630 1.51.0
1645 0.0
Discharge(cfs)

APPENDIX B —SABIN O CREEK TEST
Fluorom eter calibration: 9.5 ppfo = 25 on fluorom eter dial.
Injection solution ■ 2,730,000 ppb.
Injection ra te * 13.17 ml p er sec.
A smooth curve was passed through the plotted curve of the fluorom eter reading versus tim e. The value in the ' ‘Average*' column was taken from this curve.
D ischarge obtained by cu rren t-m ete r m easurem ents is lis ted as CMM.
A background of 1.0 dial units has been removed from the following data.
F luorom eterTim e reading A verage D ischarge
(hours) (dial units) (dial units) (cfs)
2145 0.00.5 0 .0 0 .0 0.51.5
2200 3.56.57.5
11.512 .016.0
73

74
Time(hours)
2215
2230
2245
2300
2315
F luorom eter reading
(dial units)
18.520 .020.520.5 21.0 21.0
21.521.522.522.522.022.5
23.522.522.523.522.522.5
22.5 23; 023.523.523.523.0
23.524.032.0
23.523.523.0
23.024.523.523.523.523.5
Average (dial units)
2 2 .022.122 . 222.322.422.5
22 .8 22. 7 22 . 8 22.923.023.0
23.123.223.323.423.423.5
23.523.623.7
23.723.823.8
23.924.024.024.124.124.1
D ischarge(cfs)
151.9151.2150.6150.0149.4148.5
148.0147.4146.7146.0145.3145.3
144.7144.1143.5142.8142.8142.3
142.3141.6
' 141.0 148.0 CMM
141.0140.1140.1
139.8139.3139.3138.7138.7138.7
2330

75
Time(hours)
F luorom eter reading
(dial units)Average
(dial units)D ischarge
(cfs)
2345 24.0 24.2 138.123.5 24.2 138.123.5 24.3 137.524.5 24.3 137.524.5 24.3 137.524.5 24.4 137.0
2400 24.5 24.4 137.024.5 24.4 137.024.5 24.5 136.424.5 24.5 136.424.5 24.5 136.424.5 24.5 136.4
2415 23.52 2 .02 1 .020 .015.012.5
2430 10.09.05.55.53.02.5
2445 2.51.5 0.5 0.0 0 . 0 0.0
0100 0.0

APPENDIX C— PARIA RIVER TEST
Fluorom eter calibration: 29 ppb = 39.5 on fluorom eter dial.
Injection solution * 1,740,000 ppb.
Injection ra te * 4.22 m l p e r sec.
A smooth curve was passed through the plot of the fluorom eter reading versus tim e. The value in the "A verage" column was taken from this curve.
D ischarge obtained by cu rren t-m e te r m easurem ent is lis ted as CMM.
Tim e(hours)
1100
Fluorom eterreading Average D ischarge
(dial units) (dial units) (cfs)
(Upper station)
0 .00 .00.51.05.57.5
1115 11.017.522.531.034.539.0
76

77
Time(hours)
F luorom eter reading
(dial units)Average
(dial units)Discharge
(cfs)
1130
1145
1200
42.542.548.544.549.543.0
43.543.543.042.543.541.5
40.539.5 39.0 9.0639.5 39.0 9.0639.0 39.1 9.0443.5 39.1 9.0440.0 39.1 9. 04
1215 39.5 39.2 9. 0240.0 39.2 9.0239.0 39.2 9.0238.5 39.3 9.0043.0 39.3 9.0039.5 39.3 9.00
1230 38.5 39.4 8.9738.5 39.4 8.9739.5 39.4 8.9739.5 39.5 8.9440.0 39.5 8.9439.5 39.5 8. 94
1245 40.0 39.6 8. 9239.5 39.6 8.9239.5 39.6 8.9239.5 39.7 8. 9039.5 39.7 8.9039.5 39.7 8.90

78
TimeF luorom eter
reading Average(hours) (dial units) (dial units)
1300 40.0 39.839.5 39.839.5 39.840.5 39.944.5 39.939.5 39.9
1315 40.5 40.045.0 40.039.5 40.041.0 40.140.5 40.139.5 40.1
1330 39.5 40.2
1345
39.038.028.528.524.5
18.0
1400
13.07.07.55.52.0
3.02.01.01.01.00.5
Discharge(cfs)
8. 88 8. 88 8. 88 8. 85 8.85 8. 85
8. 83 8. 83 8. 83 8. 81 8. 81 8.81
8.79
7.85 CMM

79
Tim e(hours)
1200
1215
1230
1245
1300
F luorom eterreading Average
(dial units) (dial units)
(Lower station)
0.00.50 .00 .00 .00.5
0.51.5 4.06.5
11.5 16.0
20.524.028.534.537.541.0
41.042.043.545.046.043.5
46.545.544.545.545.542.5
Discharge(cfs)
Univ. of Arizona Library

80
Tim e(hours)
1315
1330
1345
1400
1415
1430
F luorom eter reading
(dial units)
41.541.541.541.541.544.5
42.542.044.542.040.540.5
40.540.541.542.041.041.5
Average (dial units)
Discharge(cfs)
41.544.541.540.5 42.041.5
42.046.041.042.0 45.544.0
43.543.043.541.041.5

APPENDIX D— CHINLE WASH TEST
F luorom eter calibration: 108 ppb = 49.5 on fluorom eter dial.
Injection solution * 1,700,000 ppb.
Injection ra te * 4.22 m l p e r sec.
A smooth curve was passed through the plot of the fluorom eter reading versus tim e. The value in the "A verage’' column was taken fromthis curve.
Tim e(hours)
F luorom eterreading Average D ischarge
(dial units) (dial units) (cfs)
1215 0.00.00.00.00.01.0
1230 1.5 2.03.04.05.06.5
1245 8.09.5
11.513.015.017.0
81

82
Tim e(hours)
F luorom eter reading
(dial units)Average
(dial units)Discharge
(cfs)
1300
1315
1330
18.020.5 21.021.5 23.024.5
25.525.526.527.527.528.5
28.5 29.0 4.0029.0 29.3 3.9629.5 29.5 3.9429.5 29.8 3.9029.5 30.0 3.8730.0 30.2 3.85
1345 30.5 30.4 3.8230.0 30.5 3.8030.0 30.6 3.7930.0 30.7 3. 7830.5 30.9 3. 7830.0 31.0 3.75
1400 30.5 31.1 3.7331.0 31.2 3.7231.0 31.3 3.7130.5 31.4 3. 7030.5 31.4 3.7030.5 31.5 3.68
1415 31.0 31.5 3.6830.5 31.5 3.6830.0 31.5 3.6830.5 31.5 3.6831.0 31.6 3.6731.5 32.0 3.63

83
Tim eFluorom eter
reading(hours) (dial unite)
1430 32.533.534.034.5
1445
35.537.5
38.5
1500
39.040.540.541.542.5
43.0
1515
45.044.546.047.046.5
48.0
1530
48.049.549.550.050.5
50.5
Average (dial units)
D ischarge(cfs)
33.0 3.5234.0 3.4234.5 3.3735.5 3.2836.5 3.1937.2 3.13
38.0 3.0739.0 3.0040.0 2.9240.6 2.8741.5 2.8142.5 2.74
43.2 2.6944.0 2.6445.0 2.5845.7 2.5446.5 2.5047.5 2.45
48.3 2.40

REFERENCES
Andre, H ., 1964, Hydrom etrle pratique dee coure d’eau: DivisionTechnique G enerale de la Production Hydraulique d 'E lec tric ite de F rance.
Barsby, A ., and Cole, J . A ., 1963, The calibration of two flum es by sa lt dilution: W ater and W ater E ng ., June, p. 1-4.
C arte r, R. W ., and Anderson, I. E . , 1963, A ccuracy of curren t m eter m easurem ents: Am. Soc. Civil Engineers P ro c . ,Jour. Hydraulics D iv ., v. 89, no. HY4, p. 105-115.
Corbett, D. M ., and o thers, 1943, Stream -gaging procedure— amanual describing methods and p ractices of the Geological Survey: U. S. Geol. Survey W ater-Supply P aper 888, 245 p.
Feuerste in , D. L . , and Selleck, R. E . , 1963, F luorescent tra c e rs for d ispersion m easurem ents: Am. Soc. Civil Engineers P ro c . , Jou r. Sanitary Engineering D iv ., v. 89, no. SA4, pt. 1, p. 1-21.
G. K. T urner A ssociates, 1964, Operating and serv ice m anual— model III fluorom eter: Palo Alto, C a lif., G. K. T u rner A ssociates,6 p.
Grover, N. C ., and Harrington, A. W ., 1943, Stream flow m easu rem ents, records and th e ir uses: New York, John Wiley and Sons, In c ., 354 p.
Linsley, R. K ., J r . , Kohler, M. A ., and PauLhus, J . L. H ., 1958, Hydrology fo r engineers: New York, M cGraw-Hill Book C o ., In c ., 340 p.
84

85
U. S. Bureau of Reclamation, Lynch Radiation Services, and University of California, 1961, Report on field dem onstration use of isotopes in hydrographic m easurem ents, Gila P ro ject, Arizona: U. S. Bur. Reclamation, duplicated report, 73 p.
U. S. Inter-Agency Committee cm W ater R esources, 1965, A study of methods used in m easurem ent and analysis of sedim ent loads in s tream s: Minneapolis, M inn., St. Anthony F a lls Hydraulic L ab ., Report J , 5 p.
Wright, R. R . , and Collings, M. R . , 1964, Application of fluorescent trac ing techniques to hydrologic studies: Am. W ater Works Assoc. J o u r . , v. 56, no. 6, p. 748-754.

117 CB
a j y o o 1 0 0 1 3 1 9 0 7 1 b
£ t i *u/9C7/ 9 1