stream water chemistry in three meso-scale hydrologic basins in eastern amazonian ricardo de o....
TRANSCRIPT

Stream water chemistry in Stream water chemistry in three meso-scale hydrologic three meso-scale hydrologic basins in Eastern Amazonianbasins in Eastern Amazonian
Ricardo de O. FigueiredoRicardo de O. Figueiredo11, Daniel Markewitz, Daniel Markewitz22, , Eric A. DavidsonEric A. Davidson33, Ewerton S. da Cunha, Ewerton S. da Cunha44, ,
Marysol A.E. SchulerMarysol A.E. Schuler44, and Patrício de S. Silva, and Patrício de S. Silva55
1. Embrapa Amazônia Oriental; 1. Embrapa Amazônia Oriental; 2. The University of Georgia; 2. The University of Georgia;
3. The Woods Hole Research Center;3. The Woods Hole Research Center; 4. Instituto de Pesquisa Ambiental da Amazônia; 4. Instituto de Pesquisa Ambiental da Amazônia; 5. Universidade do Estado do Pará / CNPq-CTHidro5. Universidade do Estado do Pará / CNPq-CTHidro

Main Objective and Previous StudiesMain Objective and Previous Studies
This work addresses the effects of land use This work addresses the effects of land use
change on stream water chemistry change on stream water chemistry
In previous studies, we showed:In previous studies, we showed: significantly lower soil nitrate concentration in significantly lower soil nitrate concentration in
pasture soils compared to forest soilspasture soils compared to forest soils significant leaching of cations from pasture soils significant leaching of cations from pasture soils
to the stream (larger concentrations at high to the stream (larger concentrations at high
flows)flows)

Streams (Igarapés):Cq = Igarapé Cinquenta e quatroSt = Igarapé do SetePj = Igarapé Pajeú
Three watersheds Three watersheds near Paragominas near Paragominas (Eastern Amazonia)(Eastern Amazonia) * * Landsat 1999 scenesLandsat 1999 scenes
Cq (130 kmCq (130 km22) - 18% forest ) - 18% forest St (150 kmSt (150 km22) - 34% forest ) - 34% forest
Pj (45 kmPj (45 km22) - 45% of forest) - 45% of forest
FField campaigns from ield campaigns from April/2003 to July/2004, April/2003 to July/2004,
from headwaters in remnant from headwaters in remnant mature forests, through mature forests, through
pastures, secondary forests, pastures, secondary forests, and agricultural fields.and agricultural fields.

headwaters in remnant mature forests
headwaters in an extremely explored forest

CropsPasture
IGARAPÉ DO SETE
IGARAPÉ PAJEÚ
A view of a farm area between two of the studied streamsA view of a farm area between two of the studied streams

Stream dammed up
flow completely interrupted
controled flow
A very typical streamwater use:A very typical streamwater use:water supply and electricity water supply and electricity
for the farmsfor the farms

Two distinct Two distinct downstream patternsdownstream patterns
Let’s see the Let’s see the first results …first results …

0
20
40
60
80
100
120
Cq St Pj FL
ºC a
nd
FT
U
0.0
1.0
2.0
3.0
4.0
5.0
6.0
7.0
pH
FTU ºC pH
Decrease in turbidity, temperature and pH related to decreasing in Decrease in turbidity, temperature and pH related to decreasing in percentual watersheds forested areas.percentual watersheds forested areas.
In this graph we also present values of an entire forested microbasin In this graph we also present values of an entire forested microbasin (FL) situated about 80 km from Paragominas.(FL) situated about 80 km from Paragominas.

4.20
4.40
4.60
4.80
5.00
5.20
5.40
St1 St2 St3 St4 St5 St6 St74.00
4.20
4.40
4.60
4.80
5.00
5.20
5.40
5.60
Pj1 Pj2 Pj3
4.20
4.40
4.60
4.80
5.00
5.20
5.40
5.60
5.80
6.00
6.20
6.40
6.60
6.80
Cq1 Cq2 Cq3 Cq4 Cq5
Sete - 34% forest Sete - 34% forest
Cinquenta e Quatro - Cinquenta e Quatro - 18%18% forest forest
Pajeú - 45% of forestPajeú - 45% of forest
downstream downstream
downstream
In the watershed where the In the watershed where the remmant forest has been extremely remmant forest has been extremely explored, pH is high at headwaters explored, pH is high at headwaters decreasing downstream. decreasing downstream.
It is the opposite downstream It is the opposite downstream pattern of the other two watersheds pattern of the other two watersheds that have remnant mature forests that have remnant mature forests and larger percentual forested and larger percentual forested areas.areas.

4.06
6.43 6.306.51
5.73 5.906.236.20
8.77
8.01
8.93
7.53
8.52
10.18
0.00
2.00
4.00
6.00
8.00
10.00
12.00
IG7-1 IG7-2 IG7-3 IG7-4 IG7-5 IG7-6 IG7-7
O2
(mg
/L)
avg
max
dammed flowingflowing
flowing just after dam
dammed dammed dammed
Dissolved oxygen (mg LDissolved oxygen (mg L-1-1) decreases due to the low flow ) decreases due to the low flow caused by dams in the Igarapé do Sete.caused by dams in the Igarapé do Sete.

Temporal variation of Nitrate month means Temporal variation of Nitrate month means ((M LM L-1-1)) in in the 3 streams from April to July/2003.the 3 streams from April to July/2003.
1.54
1.75
1.91
0.17
y = -0.3081x3 + 1.8256x2 - 3.1148x + 3.1406
0.00
0.50
1.00
1.50
2.00
2.50
apr may jun jul
NO
3 (u
M/L
)
* nitrate month averages in the 3 streams increase with rainy season and decreases sharply when stop raining. This fact may be related to the importance of superficial and subsuperficial flows as main sources of nitrate.
equation of the polynomial trendline

Nitrate means and range (Nitrate means and range (M LM L-1-1) for the first 4 months ) for the first 4 months (April to July/2003) in each station of the Igarapé Pajeú.(April to July/2003) in each station of the Igarapé Pajeú.
y = -3.8151Ln(x) + 4.9128
0.00
1.00
2.00
3.00
4.00
5.00
6.00
7.00
8.00
Pj1 Pj2 Pj3
NO
3 (u
M/L
)
equation of logarithimic trendline
Pj1 - forested headwaters (flowing slowly)
Pj2 - pasture/capoeira (flowing just after dam)
Pj3 - capoeira/pasture/crops (flowing)
* trend of nitrate decreasing from forested headwaters
* denitrification in the lake formed by dam at Pj2 may be an important factor for nitrate decreasing
* secondary vegetation may function nitrate source at Pj3

Nitrate means (Nitrate means (M LM L-1-1) for the first 4 months (April ) for the first 4 months (April to July/2003) in each station of the Igarapé Pajeú.to July/2003) in each station of the Igarapé Pajeú.
0.00
1.00
2.00
3.00
4.00
5.00
6.00
apr may jun jul
NO
3 (u
M/L
)Pj1
Pj2
Pj3
forested headwaters (flowing slowly)
pastures/capoeiras (flowing just after dam)
capoeira/pastures/crops (flowing)
* Nitrate decreases when stop raining in July
* forests as nitrate sources are clear at these more preserved headwaters areas among studied catchments

0.0
1.0
2.0
3.0
4.0
5.0
6.0
7.0
8.0
9.0
IG54-1 IG54-2 IG54-3 IG54-4 IG54-5
NO
3 (u
M/L
)
forested headwaters (dammed)
pasture (dammed)
pasture/sewage (flowing just after dam)
crops/pasture (flowing)
crops/pasture (flowing)Nitrate pattern (forests as N sources) has been affected by land use:
* after decreasing at dams (mainly at station 2) nitrate values are so much larger at 4 and 5, what may be due to crops (3 at dam is also affected by pastures and urbanization).
Nitrate means and range (Nitrate means and range (M LM L-1-1) for the first 4 months (April ) for the first 4 months (April to July/2003) in each station of the Igarapé Cinquenta e Quatro.to July/2003) in each station of the Igarapé Cinquenta e Quatro.

Nitrate means (Nitrate means (M LM L-1-1) for the first 4 months (April to ) for the first 4 months (April to July/2003) in each station of the Igarapé Cinquenta e Quatro.July/2003) in each station of the Igarapé Cinquenta e Quatro.
0.00
1.00
2.00
3.00
4.00
5.00
6.00
7.00
8.00
9.00
apr may jun jul
NO
3 (u
M/L
)
IG54-1
IG54-2
IG54-3
IG54-4
IG54-5
Nitrate pattern (forests as N sources) has been affected by land use:
* nitrate clearly increases from April to June and decreases in july at stations 4 and 5, what is related to more intensive
agriculture practices.
forested headwater (dammed)
pasture (dammed)
pasture/sewage (flowing just after dam)
crops/pasture (flowing)
crops /pasture (flowing)
0.0
1.0
2.0
3.0
4.0
5.0
6.0
IG7-1 IG7-2 IG7-3 IG7-4 IG7-5 IG7-6 IG7-7
NO
3 (u
M/L
)
fore
sted
hea
dwat
ers
dammed
cap
oeira
/pas
ture
flowing
past
ure/
capo
eira
flowingafter dam
past
ure/
capo
eira
dammed
past
ure/
capo
eira
dammed
past
ure/
crop
s
dammed
flowing
capo
eira
/cro
ps/p
astu
re
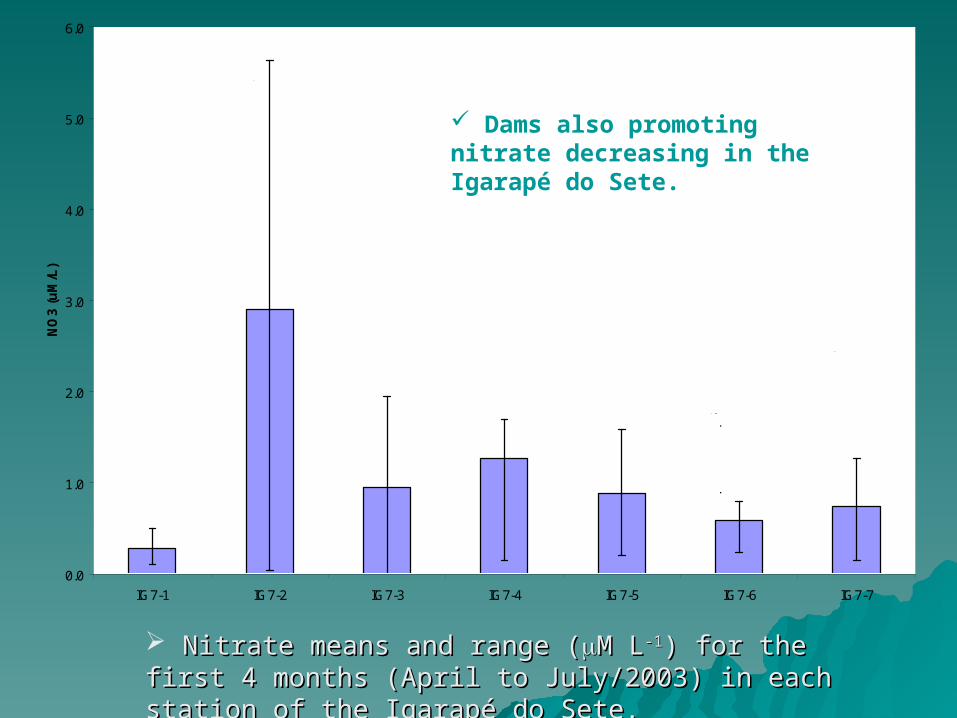
Nitrate means and range (Nitrate means and range (M LM L-1-1) for the first 4 months ) for the first 4 months (April to July/2003) in each station of the Igarapé do Sete.(April to July/2003) in each station of the Igarapé do Sete.
Dams also promoting nitrate decreasing in the Igarapé do Sete.

13.06
26.96
21.06
17.66
y = -3.6938x2 + 19.006x
0.00
5.00
10.00
15.00
20.00
25.00
30.00
apr may jun jul
Ca
(uM
/L)
* calcium month average in the 3 streams increases with rainy season and decreases when stop raining.
* we will continue to monitore this to check the assumption of the important contribution of soil surface processes to the stream chemistry (Markewitz et al., 2001)
equation of the polynomial trendline
Temporal variation of Calcium month means Temporal variation of Calcium month means ((M LM L-1-1)) in the 3 streams from April to July/2003.in the 3 streams from April to July/2003.

Calcium means (Calcium means (M LM L-1-1) for the first 4 months (April to ) for the first 4 months (April to July/2003) in the Igarapé do Pajeú.July/2003) in the Igarapé do Pajeú.
0.00
2.00
4.00
6.00
8.00
10.00
12.00
14.00
16.00
18.00
apr may jun jul
Ca
(uM
/L)
Pj1
Pj2
Pj3
forested headwaters (flowing slowly)
pastures/capoeiras (flowing just after dam)
capoeira/pastures/crops (flowing)
* As observed in early studies calcium concentrations are larger during rainy season.
* Perhaps there is a signal of agriculture at Pj3. This must be investigated along a larger period of time.

0
20
40
60
80
100
120
apr may jun jul
Ca
(uM
/L)
IG54-1
IG54-2
IG54-3
IG54-4
IG54-5
* different temporal pattern at stations 2 may be related to the obstructed outflow (dam).
forested headwater (dammed)
pasture (dammed)
pasture/sewage (flowing just after dam)
crops/pasture (flowing)
crops/pasture (flowing)
Calcium means (Calcium means (M LM L-1-1) for the first 4 months (April to ) for the first 4 months (April to July/2003) in each station of the Igarapé Cinquenta e Quatro.July/2003) in each station of the Igarapé Cinquenta e Quatro.

An ongoing research work…An ongoing research work…
We are measuring: temperature, pH, conductivity, turbidity, alkalinity, O2, Ca2+, Mg2+, K+, Na+, NH4
+, NO3-, PO4
3-, Cl-, DOC, DIC, pCO2, stream discharge, and rainfall.
Since March 2004 we are also sampling runoff, soil solution and groundwater at these watersheds (transects across riparian zones).
In addition, storm events will be sampled four times on each stream during 2005 rainy season to evaluate hydrologic flow paths during storm events.
Because soils are relatively similar within the study area, we suspect land use conversion is an important factor affecting the observed trends in stream chemistry.