streamlined sales and use tax agreement sourcing study · 2016-04-14 · streamlined sales and use...
TRANSCRIPT

Streamlined Sales and Use Tax Agreement Sourcing Study
Report of the Department of Revenue
Prepared Pursuant to Chapter 168, Laws of 2003 (SB 5783)
Washington State Department of Revenue William N. Rice, Acting Director
Prepared by the Legislation & Policy Division Russ Brubaker, Assistant Director
Analysis by the Research Division
Mary Welsh, Assistant Director
December 2003

Department of Revenue SSTA Sourcing Study
ACKNOWLEDGEMENTS Jim Bacon City of Puyallup Martin Chaw City of Redmond Doug Cochran Yakima County Administrator Kim Davis Department of Revenue Dwight Dively City of Seattle Al Doerschel City of Tukwila Mark Foutch City of Olympia Sheila Gall Association of Washington Cities Don Gutmann Department of Revenue Chris Haugen King County Bob Heller Department of Revenue John Ingram Clark County Jim Justin Association of Washington Cities Vicki Kirkpatrick Washington State Association of Counties Glen Lee City of Seattle Bob Lothspeich Whitman County Mike Martin City of Kent Maureen Morris Washington Association of Counties Glenn Olson Clark County Greg Potegal Department of Revenue Glenn Rice City of Yakima Amy Rotter Department of Revenue Rachel Solemsaas Snohomish County Nicole Stewart Department of Revenue Ilene Thomson Yakima County George Walk Pierce County Iwen Wang City of Federal Way Mary Welsh Department of Revenue Ben Yazici City of Sammamish
Department of Revenue SSTA Sourcing Study
TABLE OF CONTENTS Introduction ............................................................................................................................. 1Fiscal Impacts ............................................................................................................................. 1 Findings........................................................................................................................... 1 Methodology................................................................................................................... 4Mitigation Options ...................................................................................................................... 5 Advisory Committee....................................................................................................... 5 Committee Meetings....................................................................................................... 6 History of the SSTA........................................................................................................ 7 Sourcing .......................................................................................................................... 8 Why Sourcing Matters .................................................................................................... 9 Immediate Revenue ............................................................................................ 10 Washington’s Voice in Simplification................................................................ 10 Future Revenue ................................................................................................... 10 Mitigation Principles....................................................................................................... 11Option 1 – City of Seattle ........................................................................................................... 13Option 2 – Washington State Association of Counties............................................................... 16Option 3 – City of Kent .............................................................................................................. 20Option 4 – City of Kent – Simplified.......................................................................................... 24Option 5 – Department of Revenue ............................................................................................ 27Option 6 – City of Redmond....................................................................................................... 30Option 7 – City of Puyallup........................................................................................................ 33Appendices ............................................................................................................................. 35 Appendix A – Basic and Optional Local Tax................................................................. A-1 Appendix B - Estimated Fees for Administration........................................................... B-1 Appendix C – SST Simplification Survey and Cover Letter.......................................... C-1 Appendix D – Streamlined Sourcing Discussion Questions – Mitigation Options ........ D-1 Appendix E – State Legislative Status of SSTA............................................................. E-1 Appendix F – Other States’ Sales Tax Sourcing Status.................................................. F-1 Appendix G – Estimate of Remote Sales Losses............................................................ G-1 Appendix H – Mitigation Principles ............................................................................... H-1 Appendix I – Sourcing Legality Response Memorandum.............................................. I-1
Department of Revenue SSTA Sourcing Study
- 1 -
INTRODUCTION In 2003, the Legislature enacted Senate Bill 5783 (Chapter 168, Laws of 2003) to adopt several provisions of the Streamlined Sales and Use Tax Agreement (SSTA). The SSTA provisions for determining where a sale is deemed to occur for local sales and use tax purposes were not adopted. These provisions of the SSTA are known as the “sourcing” provisions. The location or “source” of the sale determines which local jurisdiction can levy and collect their local sales and use tax. The legislation directed the Department of Revenue to conduct a study of the fiscal impact on local jurisdictions that would result from adopting the sourcing provisions proposed in the SSTA. The Department was also directed to use, and regularly consult, a committee composed of city and county officials to assist with the study. The committee was responsible for the identification of elements of the study, including mitigation options for jurisdictions negatively impacted by the SSTA sourcing provisions. The study was due to the Governor and fiscal committees of the Legislature by December 1, 2003. FISCAL IMPACTS Findings Under current Washington law, sales of goods are generally sourced to the location where delivery originates. Over the counter sales are sourced to the retail outlet where the sale occurs and delivered sales are sourced to the location where delivery originates. In some cases, delivered goods originate from a warehouse rather than a retail store location. In these instances current law sources the sale to the warehouse location. The SSTA would change the place of sale to the location where the purchaser takes delivery of the purchased item. A more detailed description of current law and the SSTA sourcing provisions is found later in this report. Adopting the SSTA will result in both gains and losses to local jurisdictions as the location of sales shifts from retail outlets to where sales are delivered. The value of delivered goods that would be affected by the change in sourcing would amount to $12.9 billion in taxable retail sales. This represents 15 percent of the total local sales tax base. Some of the delivered sales that would be affected by the change in sourcing are delivered to the same jurisdiction in which the sale originates. However, the majority of delivered sales would be shifted to another jurisdiction. When this shifting in sales occurs, individual jurisdictions may incur net revenue losses if sales delivered outside their boundaries exceed the sales delivered inside their boundaries. An estimated 97 cities would lose revenues. Cities that would lose revenues generally contain businesses with warehouses or retail stores from which deliveries are made. Delivered goods include office supplies and durable goods, such as office equipment and furniture. Some of these businesses are large department stores selling remotely to households in other jurisdictions. Finally, smaller cities that serve as a local business hub to a larger community also tend to lose sales.

Department of Revenue SSTA Sourcing Study
- 2 -
Almost all counties gain revenues (an estimated 34 out of 39), while two-thirds of the cities gain revenues (an estimated 184 out of 281). Jurisdictions that have a relatively high population base compared to their business base would tend to gain revenues.
TABLE 1 Summary of Estimated Impacts to All Local Taxing Jurisdictions
Tax Type
Number of
Districts with
Gains
Estimated Sales Tax
Gains
Number of
Districts with
Losses
Estimate Sales Tax
Losses Estimated Net
Gain (Loss)
Counties: County Basic & Optional 34 13,255,752 5 -868,413 12,387,339County Criminal Justice 16 509,688 14 -293,656 216,032County Correctional Facility 6 345,859 6 -247,869 97,989
Total County $14,111,298 -$1,409,938 $12,701,360
Cities: City Basic & Optional 184 13,831,021 97 -24,814,192 -10,983,170City Criminal Justice 102 389,549 158 -519,686 -130,137
Total City $14,220,571 -$25,333,878 -$11,113,307
Other Taxing Districts Transit Districts 13 6,855,445 10 -5,569,729 1,285,715RTA 1 171,223 0 0 171,223PFD 0 0 1 -95,012 -95,012Regional Centers 9 323,211 11 -272,012 51,199Metro Park (Pierce County) 1 182,576 0 0 182,576Baseball Stadium (King) 0 0 1 -63,853 -63,853Football Stadium (King) 0 0 1 -60,097 -60,097
Total Other Taxing Districts $7,532,455 -$6,060,703 $1,471,752 Total all Jurisdictions $35,864,324 -$32,804,519 $3,059,805 The following tables show the number of cities within loss and gain ranges.

Department of Revenue SSTA Sourcing Study
- 3 -
TABLE 2 Number of Cities that Would Gain Revenues by Percent Gain
Range of Gain as a Percent of Total Taxes Number of Cities
within Range Between 0% and 2% Gain 45 Between 2% and 5% Gain 45 Between 5% and 10% Gain 40 Between 10% and 20% Gain 25 Over 20% Gain 29 Total 184
TABLE 3 Number of Cities that Would Lose Revenues by Percent Loss
Range of Loss as a Percent of Total Taxes Number of Cities
within Range Between 0% and 2% Loss 25 Between 2% and 5% Loss 31 Between 5% and 10% Loss 24 Between 10% and 20% Loss 13 Over 20% Loss 4 Total 97
Included in Appendix A is a detailed estimate of the fiscal impacts for each local taxing jurisdiction that is authorized to impose sales and use taxes under Chapter 82.14 RCW. Each taxing jurisdiction has unique boundaries, tax rates, and distribution schemes. Therefore, the impact on each jurisdiction is separately estimated. The appendix contains:
• An alphabetical list of total losses to cities and counties (basic and optional taxes, criminal juvenile detention facilities and jails, county correctional facilities).
• County and city basic and optional sales taxes by location code. • County and city criminal juvenile detention facilities and jails by location code. • Transportation benefit areas (transit districts) and regional transportation authority. • Public facilities districts and regional centers. • Public sports facilities (baseball stadium), stadium and exhibition center (football
stadium); and metropolitan park districts.
Department of Revenue SSTA Sourcing Study
- 4 -
The Department of Revenue collects local sales and use taxes for local taxing jurisdictions pursuant to contract with the taxing jurisdictions. For most local sales and use taxes, the Department is authorized to charge up to 2 percent of the tax collected for administration and collection expenses incurred by the Department. In some instances, the Department is statutorily required to collect sales and use taxes at no charge. The Department currently has no contract that charges more than 1 percent of the tax collected. Amounts collected are deposited in the general fund. The estimates contained in Appendix A identify when the estimate has been reduced by Department charges for collection and administration. The total amount charged to local governments in fiscal year 2003 for the collection and administration of their sales taxes is contained in Appendix B. Methodology For each jurisdiction, gains and losses were estimated for both remote sales and in-store sales. The analysis was performed using existing data from the Departments of Revenue and Employment Security and data from a survey conducted by the Washington State University Social and Economic Sciences Research Center. All data is on the firm level for Washington businesses potentially affected by sourcing changes (businesses that make taxable retail sales and deliver products within the state). The Departments of Revenue and Employment Security data included taxable retail sales by establishment, business location for each establishment, and business classification (industry). The survey sample included approximately 2,400 businesses and was stratified by size and by industry classifications including:
• Manufacturing • Printing • Transportation and warehousing • Wholesale • Furniture retailing • Electronics and appliances retailing • Office supplies retailing • Other retailers
Businesses were asked questions in the survey about the percentage of sales made:
• Remotely. • From storefronts. • From storefronts but delivered from a warehouse. • To businesses. • To households. • To each county.

Department of Revenue SSTA Sourcing Study
- 5 -
Businesses were also asked to break out their store-based delivered retail sales: • Within the city where the store is located. • Within a radius of miles (5, 10, etc.) of the store location. • Within the rest of the county. • Within the rest of the state.
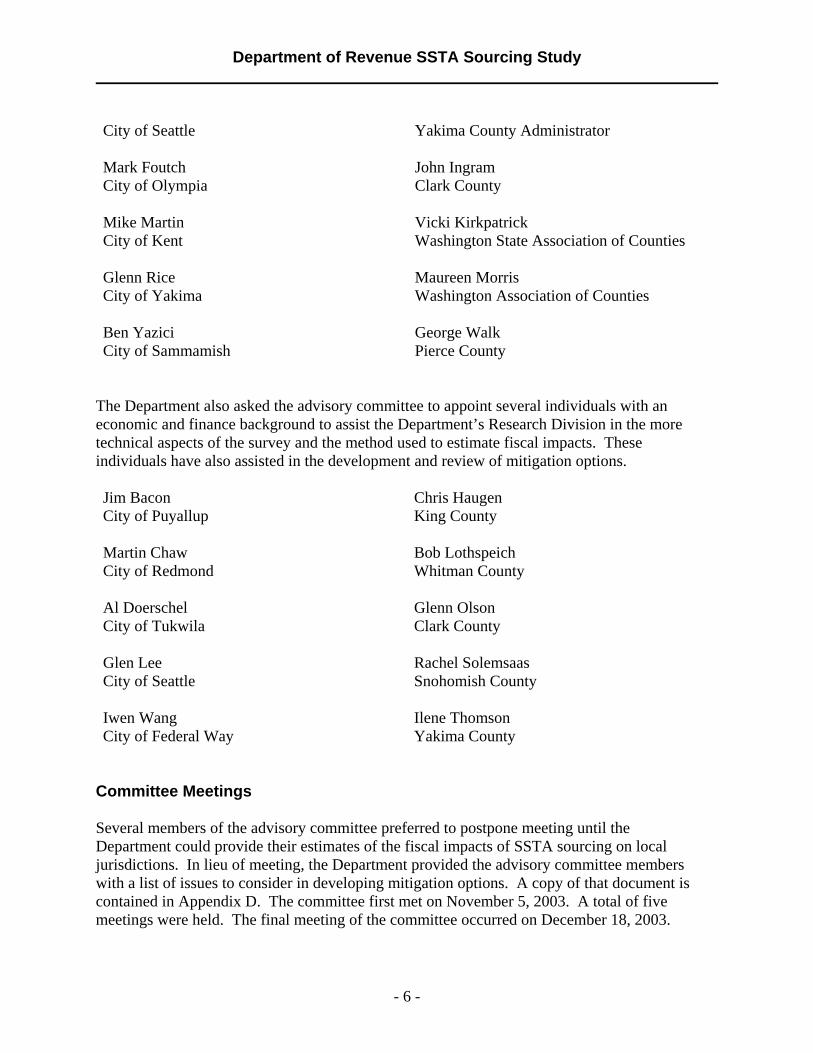
Approximately 1,200 businesses responded to the survey. Survey responses were matched by Washington State University to data provided by the Department of Revenue and the Employment Security Department. Survey data was used to calculate average answers for each question for each industry classification. The appropriate averages were applied to each firm that was sampled. The final database included each establishment of each Washington firm that is potentially affected by sourcing. The net fiscal impact for each jurisdiction includes both gains and losses. The total value of outgoing sales and deliveries, which represent a loss to each jurisdiction, was calculated using the survey responses combined with the departments’ data. Gains were derived from the estimated total value of incoming deliveries allocated to each jurisdiction using survey data, Department data on business purchasing activity, and household income data. Geographic Information System (GIS) was also used to map locations of each storefront and warehouse. GIS was then used to allocate gains to each jurisdiction based on survey data and census block level household income data. Although the survey data is intended to represent taxpayers by industry and location, it is less precise when used to estimate smaller jurisdictional losses and gains. One reason for this is that the larger cities are generally more likely to have firms that conform to industry averages. Larger cities are also better represented in the data because more firms responded to the survey. The results of the survey calculations are estimates and, as with all estimates, contain a margin of error. For these reasons, the results are intended to provide general information on jurisdictional losses and gains. A copy of the survey, the cover letter accompanying the survey, and a more detailed explanation of the methodology for calculating sourcing losses and gains in each jurisdiction is contained in Appendix C of this report. MITIGATION OPTIONS Advisory Committee The Department asked the Association of Washington Cities, the Washington State Association of Counties, and the Washington Association of County Officials to appoint members to the advisory committee directed in Senate Bill 5783. Dwight Dively Doug Cochran
Department of Revenue SSTA Sourcing Study
- 6 -
City of Seattle
Yakima County Administrator
Mark Foutch City of Olympia
John Ingram Clark County
Mike Martin City of Kent
Vicki Kirkpatrick Washington State Association of Counties
Glenn Rice City of Yakima
Maureen Morris Washington Association of Counties
Ben Yazici City of Sammamish
George Walk Pierce County
The Department also asked the advisory committee to appoint several individuals with an economic and finance background to assist the Department’s Research Division in the more technical aspects of the survey and the method used to estimate fiscal impacts. These individuals have also assisted in the development and review of mitigation options. Jim Bacon City of Puyallup
Chris Haugen King County
Martin Chaw City of Redmond
Bob Lothspeich Whitman County
Al Doerschel City of Tukwila
Glenn Olson Clark County
Glen Lee City of Seattle
Rachel Solemsaas Snohomish County
Iwen Wang City of Federal Way
Ilene Thomson Yakima County
Committee Meetings Several members of the advisory committee preferred to postpone meeting until the Department could provide their estimates of the fiscal impacts of SSTA sourcing on local jurisdictions. In lieu of meeting, the Department provided the advisory committee members with a list of issues to consider in developing mitigation options. A copy of that document is contained in Appendix D. The committee first met on November 5, 2003. A total of five meetings were held. The final meeting of the committee occurred on December 18, 2003.

Department of Revenue SSTA Sourcing Study
- 7 -
History of the SSTA The Department of Revenue has been involved in regional and national discussions dealing with multi-state retailers including e-commerce and remote sellers for the past seven years. These discussions led to a cooperative effort on behalf of states and private industry representatives to simplify sales tax structures and make them more uniform. This cooperative effort is known as the Streamlined Sales Tax Project (Project). The mission of the Project is to develop measures to design, test, and implement a nationwide system that radically simplifies reporting, collection, remittance, and administration of sales and use taxes. Forty states are involved in this effort. In order to provide structure and accountability within the Project and to ensure that each participating state has explicit authority to represent the state in the Project, a uniform act was developed. The act is known as the Uniform Sales and Use Tax Administration Act. When enacted by a participating state, the act authorizes the state to join with other states in negotiating a multi-state sales and use tax agreement. During the 2002 session, the Legislature enacted Senate Bill 6342 to adopt the Uniform Sales and Use Tax Administration Act. To date, 38 states have adopted the Act through legislative or executive action. Those states with such authorization (The Implementing States) have been meeting to develop an agreement to govern implementation of sales and use tax simplification. On November 12, 2002, the Implementing States adopted the Streamlined Sales and Use Tax Agreement (SSTA). By streamlining the sales tax system, the SSTA will make tax administration easier for both retailers and state tax agencies. The SSTA’s intent is also to create incentives for remote sellers to voluntarily collect sales or use tax on in-state sales. Remote sellers who do not have a taxable presence or tax “nexus” within the state may not be legally compelled to collect sales or use taxes on sales mailed or shipped to customers in the state. Federal legislation or court action is required in order for states to compel remote sellers to collect sales or use tax on in-state sales. State tax experts view a streamlined sales tax system as a prerequisite to Congressional or judicial action. Washington law already conforms to several major provisions of the SSTA, such as:
• A uniform state and local tax base. • A single state tax rate. • A single local rate per taxing jurisdiction. • State administration of both state and local sales and use taxes. • No tax caps or thresholds.
However, Washington law requires revisions to conform to the SSTA’s provisions on:
• Uniform definitions. • Uniform administrative procedures. • On-line registration of remote sellers.

Department of Revenue SSTA Sourcing Study
- 8 -
• Monetary allowance for sellers using certified service providers or tax compliance software.
• Amnesty. • Sourcing. • Confidentiality and privacy protections for sellers using certified service providers. • A taxability matrix.
During the 2003 legislative session, the Legislature enacted Senate Bill (SB) 5783, Department request legislation to implement the uniform definitions and administrative provisions of the SSTA. SB 5783 also incorporated the SSTA sourcing provisions for telecommunications, which substantially followed the Federal Mobile Telecommunications Sourcing Act that the Legislature enacted in 2002. As of October 2, 2003, twenty states have enacted streamlined sales and use tax legislation. The status of state legislation enacting the provisions of the SSTA is contained in Appendix E of this report. In response to concerns from local jurisdictions, the SSTA’s general sourcing provisions were removed from the legislation prior to its introduction. In its place, the Legislature directed the Department to work with a committee of city and county officials to study the effects of sourcing and to develop mitigation options for those jurisdictions negatively impacted by SSTA sourcing. The results of this study are included in this report. Sourcing Sourcing determines the place of sale, and therefore, what jurisdiction is entitled to the tax generated from a particular transaction. The SSTA adopts a destination-based sourcing method where the location the consumer takes delivery of the good or service is the place of sale. This allows businesses to have a single set of rules for their store-front, catalog, and online sales. Some states currently use destination-based sourcing, while other states use origin-based sourcing. Under an origin-based sourcing method, a sale generally takes place at the location where the sale’s transaction is completed. Other states, like Washington, source using both destination and origin-based methods depending on the type of sale. Included in Appendix F is a document prepared by the Kansas Department of Revenue that describes the sourcing method adopted in each state imposing sales and use taxes, and each state’s efforts to conform to SSTA sourcing. Under Washington law, local sales and use taxes are sourced according to the following rules:
• Sales tax from the sale of goods is sourced to the retail outlet at or from which delivery is made.
• Sales tax from the sale of a service, with or without a sale of goods, is sourced to the place where the service is primarily performed.
• Sales tax from the lease or rental of goods is sourced to the place of first use. In the case of short-term rentals, this is the place of business of the lessor. In the case of rentals or

Department of Revenue SSTA Sourcing Study
- 9 -
leases involving periodic payments, this is the primary place of use by the renter or lessee for each payment period.
Under the SSTA, purchases of motor vehicles, aircraft, watercraft, modular homes, manufactured homes, and mobile homes are excluded from SSTA sourcing. However, all other sales are to be sourced under the SSTA in the following order:
• Rule 1 – If a good or service is received by the purchaser at the business location of the seller, the sales tax is sourced to that business location.
• Rule 2 – If the good is not received by the purchaser at the business location of the seller, the sales tax is sourced to the location where receipt occurs, if known by the seller.
• Rule 3 – If Rules 1 and 2 do not apply, the sales tax is sourced to the address indicated for the purchaser in records normally maintained by the seller, if use of this address by the seller does not constitute bad faith.
• Rule 4 – If Rules 1, 2, and 3 do not apply, the sales tax is sourced to the address for the purchaser obtained during the consummation of the sale, including the address of the purchaser’s payment instrument, if use of this address by the seller does not constitute bad faith.
• Rule 5 – If Rules 1, 2, 3, and 4 do not apply, the sales tax is sourced to the address from which delivery was made.
The SSTA sourcing will have little impact on state revenue, but will create significant revenue shifts between local jurisdictions. The majority of the fiscal impact to local jurisdictions is caused by sourcing delivered goods to the location where the purchaser takes delivery rather than the location where delivery originates. Washington is unique in sourcing delivered goods to the retail outlet from which delivery took place. This sourcing rule has concentrated sales tax collections of delivered goods to a few jurisdictions that have warehouse districts. The SSTA sourcing rules will now distribute those revenues among the local jurisdictions where consumers are having their purchases delivered. For example, a person who lives in City A purchases a sofa from a furniture store in City B. The sofa will be delivered from a warehouse in City C to the consumer’s home in City A. Under current law, the local sales tax generated from that purchase would be sourced to City C, the location of the retail outlet from which delivery to place. Under the SSTA sourcing rules, the local sales tax would be sourced to City A, the point of delivery. Thus, City C loses revenue while City A gains revenue. Why Sourcing Matters Sourcing is a material part of the SSTA. Nonconformity with SSTA sourcing will prevent Washington from becoming a member state of the SSTA and its governing board. As a result, Washington will not enjoy the benefits of the SSTA.
Department of Revenue SSTA Sourcing Study
- 10 -
Immediate Revenue The SSTA provides an incentive to remote sellers to begin collecting and remitting sales tax to the state. Sellers who are required to collect sales and use taxes under current law, but have failed to do so, may be eligible for amnesty from assessment of back taxes and penalties. Some remote sellers may want amnesty because their current activities may have potentially created nexus (the legal obligation to collect tax) in a state. Other remote sellers want amnesty because it will enable them to consolidate their Internet and in-store activities or increase their markets without risking potential tax liabilities for past periods. To receive amnesty, the remote seller must agree to collect and remit taxes for a period of 36 months to all member states of the SSTA. Therefore, if a remote seller registers under the SSTA for whatever reason, it will be required to collect and remit tax on sales into Washington if Washington is a member state of the Agreement. The Department estimates that the state will realize $2.2 million in new revenue for the ‘03-‘05 biennium and $10.2 million for the ‘05-‘07 biennium from becoming a member state of the SSTA. Washington’s Voice in Simplification The SSTA, as adopted on November 12, 2002, is a work in progress. The member states of the SSTA continue to meet to develop additional uniform definitions and standards to simplify sales and use tax administration for retailers and state tax agencies. For example, the SSTA has been working to develop a uniform definition of “digital property.” The unbundling of telecommunications is another issue under discussion. The outcome of these discussions is very important for the state and its high-technology and telecommunication businesses. Washington is currently a voting member of the Implementing States. However, once ten states representing 20 percent of the population of states imposing sales tax are found to be substantially compliant with all SSTA provisions, a Governing Board comprised of those states is formed. The Governing Board becomes the body vested with exclusive authority to amend and implement the agreement. If Washington fails to adopt SSTA sourcing, Washington will not be substantially compliant with the SSTA. Therefore, Washington will not be a voting member of the Governing Board and will not have the ability to officially advance the interests of the state and its businesses. Future Revenue Using information from the United States Department of Commerce, the Department estimates that Washington is losing $191 million annually in state sales and use taxes from remote sales. Local jurisdictions imposing sales and use taxes are losing $59 million annually. Included in Appendix G is an estimate of remote sales losses, based on household income, to cities, counties, public transportation benefit areas, and the regional transit authority. Remote sales are growing at a rate 25 percent each year, while in-store sales are growing at a rate of 2 to 4 percent. The growth rate of remote sales will eventually plateau, but not in the foreseeable future.

Department of Revenue SSTA Sourcing Study
- 11 -
Mitigation Principles Over the past few years, local government funding has destabilized. The motor vehicle excise tax (MVET) supported transportation, transit, public health, local criminal justice funding, and sales tax equalization for cities and counties. However, in the 2000 legislative session the Legislature acted to eliminate the MVET in response to Initiative 695. Consequently, revenues for these programs were also eliminated. Although appropriations from the state General Fund (“backfill”) were provided during the 2000 legislative session to replace a portion of the revenue that cities, counties, public health, and transit lost through the elimination of the MVET, backfill was dramatically reduced in subsequent state budgets. In 2002, backfill was reduced to $5 million for counties and $8 million for cities. In 2003, counties were appropriated $5 million of federal funds in fiscal year 2004 as backfill. Also in 2003, cities were appropriated $3 million in fiscal year 2004 and $2 million in fiscal year 2005. Concurrent to this legislative action, the voters took action to place more stringent limits on local property tax powers. A property taxing district’s regular property tax levy is limited by a statutory maximum tax rate per $1,000 of assessed value as well as a limit on the growth of total taxes raised. In November 2001 the voters passed Initiative 747 which reduced the limit of property tax revenue growth from 6 percent to the lesser of 1 percent or inflation. No change was made to the mechanism that increases total revenue as a result of new construction, improvements to existing property, or to changes in state-assessed valuation of public utilities. Other special purpose revenues supporting transportation, including transit, have been repealed or limited by ballot measures. In addition as the Legislature has acted to change state and local tax systems in response to requests by businesses, individual jurisdictions have been disproportionately impacted. Local governments have suffered a sizeable loss of their general fund revenues that are essential to provide minimum levels of government services. In light of this experience, the Association of Washington Cities and the Washington State Association of Counties each developed mitigation principles to guide this process (included in Appendix H). The advisory committee found common ground in the four following principles based on the associations’ statements that guided the development of options to mitigate the effects of Streamlined Sales and Use Tax Agreement’s sourcing.
1. The committee supports the general objectives of the Streamlined Sales and Use Tax Agreement.
2. Mitigation must be based on actual experience, rather than projections. 3. Mitigation must be funded by the state. 4. Any mitigation method must address losses by all types of jurisdictions affected,
including counties, cities, transit, and special purpose districts.

Department of Revenue SSTA Sourcing Study
- 12 -
The advisory and technical committee members decided that options should be sponsored individually to recognize that no option received unanimous support. The committee agreed that each option would be presented in a standard format. Committee members were given the opportunity to provide written comments on each option. The committee also asked the Department of Revenue to provide comments on each option. The following seven options are contained in the next section of this report: Option 1 – City of Seattle Option 2 – Washington State Association of Counties (WSAC) Option 3 – City of Kent Option 4 – City of Kent – Simplified Option 5 – Department of Revenue (DOR) Option 6 – City of Redmond Option 7 – City of Puyallup Two options, Seattle and WSAC, use state revenues to mitigate the effects of SSTA sourcing. The Puyallup option delays SSTA sourcing until Congress or the Supreme Court acts to require remote sellers to collect and remit sales and use taxes to the states. Depending on the retailing activity in the jurisdiction, new revenues from remote sellers may partially or totally mitigate the effects of SSTA sourcing. The Redmond option would temporarily pool local sales taxes and distribute it based upon the proportion each jurisdiction or agency currently receives during a pre-selected period. Once the effects of SSTA sourcing are known, a mitigation option would be reexamined. Three of the options, both Kent options and DOR, mitigate SSTA sourcing by returning revenues sourced to the point of delivery to the point of origin. A question was raised whether the options sponsored by Kent, DOR, and Redmond, and the option of sourcing intrastate and interstate sales differently, raised legal concerns. Included in Appendix I is a brief legal memorandum in response to this question.

Department of Revenue SSTA Sourcing Study
- 13 -
OPTION 1 Sponsor City of Seattle Description The proposal would implement SSTA sourcing and mitigate the effects by providing state revenue to adversely impacted jurisdictions. Mechanism for Mitigation The Department of Revenue would estimate gains and losses of taxable sales due to change in sourcing for local jurisdictions on a quarterly basis. Estimates would be made by reviewing current return data post-SSTA sourcing, to return data pre-SSTA sourcing. Local jurisdictions receive proportionate share of mitigation money available per quarter based upon jurisdictions’ share of nominal loss. Mitigation payments sent to jurisdictions by end of third month after quarter ends.
Taxable Sales Period
Data Available for
Analysis Analysis Complete
Mitigation Distribution
Calendar FY
State FY
Apr. – Jun., ‘05 Aug. 20, ‘05 Sept. 20, ‘05 Sept. 30, ‘05 ‘05 ’05-06 July – Sept. ‘05 Nov. 20, ‘05 Dec. 20, ‘05 Dec. 31, ‘05 ‘05 ’05-06 Oct. – Dec. ‘05 Feb. 20, ‘06 Mar. 20, ‘06 Mar. 31, ‘06 ‘06 ’05-06 Jan. – Mar. ‘06 May 20, ‘06 June 20, ‘06 June 30, ‘06 ‘06 ’05-06 Apr. – Jun. ‘06 Aug. 20, ‘06 Sept. 20, ‘06 Sept. 30, ‘06 ‘06 ’06-07 July – Sept. ‘06 Nov. 20, ‘06 Dec. 20, ‘06 Dec. 31, ‘06 ‘06 ’06-07 Oct. – Dec. ‘06 Feb. 20, ‘07 Mar. 20, ‘07 Mar. 31, ‘07 ‘07 ’06-07 Jan. – Mar. ‘07 May 20, ‘07 June 20, ‘07 June 30, ‘07 ‘07 ’06-07 Apr. – Jun. ‘07 Aug. 20, ‘07 Sept. 20, ‘07 Sept. 30, ‘07 ‘07 ’07-08 July – Sept. ‘07 Nov. 20, ‘07 Dec. 20, ‘07 Dec. 31, ‘07 ‘07 ’07-08 Oct. – Dec. ‘07 Feb. 20, ‘08 Mar. 20, ‘08 Mar. 31, ‘08 ‘08 ’07-08 Jan. – Mar. ‘08 May 20, ‘08 June 20, ‘08 June 30, ‘08 ‘08 ’07-08
At the end of seven quarters, the Department of Revenue would perform a comprehensive assessment of losses due to sourcing to determine on-going impact to local jurisdictions. Included in the assessment would be the development of options to provide on-going mitigation for jurisdictions with limited unused taxing capacity.

Department of Revenue SSTA Sourcing Study
- 14 -
Duration of Mitigation Temporary for most jurisdictions. Mitigation would be limited to three years or less. Small jurisdictions with limited unused capacity could receive permanent mitigation. Amount of Mitigation Amount of initial mitigation would not exceed 90 percent of loss in first 12-month period. Thereafter, mitigation would be reduced to 67 percent of loss experienced in second year, and reduced again to 45 percent in the third year. Source of Funds State revenue. Sponsors’ Statements of Advantages and Disadvantages • Allows Washington to be a member of the SSTA governing board. • Local jurisdictions that gain revenue from SSTA sourcing can retain revenue. • No administrative burdens place on business community. • Will result in some local jurisdictions losing revenue. • Requires state funding. Department of Revenue Comments The Department will not have the best data available from taxpayer returns within a two-month period. However, we can make adjustments in the next quarter. The Department would require minimal additional resources for our Research Division, Information Services Division, and Taxpayer Account Administration Division to implement this option. There would be one-time initial costs to establish the mitigation model and internal processes to obtain data to run the model. Ongoing costs would be associated with quarterly analysis, adjustments, and distributions. Committee Comments George Walk, Pierce County – Proposes a reasonable method to provide transition mitigation for jurisdictions that are adversely impacted. Recognizes need for permanent mitigation for jurisdictions with limited local capacity. Not sure that three years is the right number. Mike Martin, City of Kent – The proposal relies on the availability of state moneys which may not be available or appropriated for mitigation. The three-year mitigation period would likely not give severely impacted jurisdictions adequate time to make budgetary adjustments without significant adverse effects to their communities. It is likely that the manufacturing, wholesaling and warehousing sector would see diminished opportunities for expansion resulting in adverse
Department of Revenue SSTA Sourcing Study
- 15 -
effects on the state and local economies. Kent opposes temporary and declining mitigation. Kent supports mitigation based on actual losses. Doug Cochran, Yakima County – Like the Federal Way and WSAC proposals, this is a straightforward proposal to deal with the bottom line problem we face in implementing sourcing. It recognizes that some communities have almost no capacity to deal with losses that might result from sourcing. It makes it possible for cities to grow in a more rational fashion, annexing residential areas as well as commercial property. Vicki Kirkpatrick, WSAC – This is a variation of the proposals submitted by the counties as a group, Federal Way, and Seattle. All of these proposals deal with the problem at hand. They recognize that no amount of modeling will capture our dynamic economy’s impact on hundreds of jurisdictions large and small. It places as safety net under communities that would be hurt, while allowing previously revenue starved communities to improve their situation. The core services provided by counties are provided to all citizens of the state whether they live in cities or counties. This proposal helps sustain those services citizens need. Maureen Morris, WSAC – Similar to WSAC and Federal Way proposals. This sort of approach is supported by all county and some city members of the group. Recognizes problems of some small, low income jurisdictions. Method is straightforward. No reverse Robin Hood. Provides some additional sales tax revenue to jurisdictions that have been hard hit by the shift to remote sales, big box retailers, annexations that cherry picked commercial areas, and growth management policies on business location. Encourages cities to annex residential areas within their urban growth areas by making them economically viable. Jon Ingram, Clark County – This proposal also has less than 100 percent mitigation on a sliding scale over time. The proposal also will place high growth jurisdictions in the position of losing revenues that come from growth, and not from allocation methodology changes. The proposal does look easy to administer and is for a limited duration (three years). The reference to considering small jurisdictions with limited resources as a special case is welcome, although there is no mechanism proposed to manage that process.
Department of Revenue SSTA Sourcing Study
- 16 -
OPTION 2 Sponsor Washington State Association of Counties Description Sourcing is implemented on schedule to retain Washington’s seat on the national governing board. Businesses are not asked to complete extra paperwork or recordkeeping. Mitigation mechanism is described below. Mechanism for Mitigation Quarterly look-back to same quarter of base year (2004) Despite good efforts by the Department of Revenue, it is impossible to accurately predict the impact on most jurisdictions. In addition, when sourcing is implemented, there may be unpredictable changes in behavior by consumers, retailers, and others. The Legislature would create a new “revenue for distribution.” Each quarter, a committee would meet and review actual sales tax collection experience by jurisdiction. The Department of Revenue would provide information comparing the current quarter to the baseline quarter, adjusted for inflation. If necessary, the committee could take into account major business closures or boundary adjustments. This option contains a simple look-back proposal because most jurisdictions do not have the resources to analyze their sales tax receipts for sourcing impact. Accelerated payments may be necessary for jurisdictions with large, identifiable losses that result in an inability to provide cash for daily operations. In addition, at the time this report was written, the impact on special purpose districts which may have pledged sales tax revenue to support bonds was unknown. If the mitigation pool is not sufficient to fund all jurisdictions in need, the committee shall take into account local per capita revenue (total general fund revenue divided by total population within the jurisdiction), unused non-voted general fund tax capacity and other factors. In addition, some higher income jurisdictions that might need to redirect their economic development approach as a result of sourcing might be granted one time capital funding from the state to begin that adjustment. Duration of Mitigation Temporary for most jurisdictions, long-term for low income jurisdictions with large losses.

Department of Revenue SSTA Sourcing Study
- 17 -
It appears that some low-income jurisdictions are adversely affected because of their mix of businesses and industries (examples include Hoquiam and Grays Harbor County). These communities also tend to have low-income populations that will not generate much sales tax as a result of any new remote sales tax powers granted by Congress. Unless these communities experience significant success in their economic development efforts, they will be unable to sustain basic public services without long term mitigation. Amount of Mitigation Goal would be “adequate” mitigation. Source of Funds State funds (including increased revenue from voluntary compliance). Sponsors’ Statements of Advantages and Disadvantages • Some variant of this proposal is supported by a majority of the appointees to the policy
advisory group. • Sourcing moves forward on a timeframe needed to maintain Washington’s seat on the
governing board. • Imposes no additional reporting requirements on business. • Deals with uncertainty of impact on individual jurisdictions by using look-back mechanism. • Includes all affected jurisdictions, not just cities or counties or jurisdictions with warehouses. • Eliminates current practice (apparently unique among the states) that shifts sales tax from
jurisdictions where purchases occur to remote warehouse sites. • Mitigation process provides mechanism to deal with any unexpected results of sourcing
(which in this case should be anticipated). • Does not divert revenue from relatively poor jurisdictions to mitigate relatively wealthy
jurisdictions. • Does not require additional studies by consultants. • Includes mitigation for jurisdictions that are not wealthy enough to employ expert staff or
lobbyists to represent them on this issue. • Would consider all general purpose revenue, not just sales tax, if it is necessary to prioritize
mitigation. • Requires state funding. • Might result in some relatively wealthy jurisdictions receiving less than full mitigation. • Requires creation of a committee. Department of Revenue Comments The Department would require minimal additional resources for our Research Division, Information Services Division, and Taxpayer Account Administration Division to implement this option. There would be one-time initial costs to establish the mitigation model and internal

Department of Revenue SSTA Sourcing Study
- 18 -
processes to obtain data to run the model. Ongoing costs would be associated with quarterly analysis, adjustments, and distributions. Committee Comments George Walk, Pierce County – Allows state to meet goal of sourcing. Proposes a reasonable method to provide transition mitigation for jurisdictions that are adversely impacted. Provides method to address unique situations. Recognizes need for permanent mitigation for jurisdictions with limited local capacity. Mike Martin, City of Kent – The proposal relies on the availability of state moneys which may not be available or appropriated for mitigation. The proposal does not address how the mitigation committee is formed or the mitigation measurement criteria used. The proposal limits mitigation to jurisdictions losing a significant percentage of sales tax revenues, and excludes a significant number of adversely impacted jurisdictions. The temporary duration period would likely not give severely impacted jurisdictions adequate time to make budgetary adjustments without significant adverse effects to their communities. Finally, it is likely that the manufacturing, wholesaling and warehousing sector would see diminished opportunities for expansion resulting in adverse effects on the state and local economies. Doug Cochran, Yakima County – The counties, Seattle, and Federal Way have presented variations of this proposal. This is a straightforward proposal to deal with the bottom line problem we face in implementing sourcing. It recognizes that some communities have almost no capacity to deal with losses that might result from sourcing. It makes it possible for cities to grow in a more rational fashion, annexing residential areas as well as commercial property. Vicki Kirkpatrick, WSAC – This is a variation of the proposals submitted by the counties as a group, Federal Way, and Seattle. All of these proposals deal with the problem at hand. They recognize that no amount of modeling will capture our dynamic economy’s impact on hundreds of jurisdictions large and small. It places a safety net under communities that would be hurt, while allowing previously revenue-starved communities to improve their situation. The core services provided by counties are provided to all citizens of the state whether they live in cities or counties. This proposal helps sustain those services citizens need. Maureen Morris, WSAC – Similar to Seattle and Federal Way proposals. A majority of group members support (all counties and some cities). Simple to administer. Does not use revenue from distressed jurisdictions to mitigate relatively high income jurisdictions. Accepts the reality of sourcing and moves forward to solve the problems that require mitigation. Recognizes that some jurisdictions may have cash flow problems. Begins to provide some additional sales tax revenue to jurisdictions that have been hard hit by the shift to remote sales, big box retailers, annexations that cherry picked commercial areas, and growth management policies on business siting. Alan Doerschel, City of Tukwila – Basic premise is flawed! It assumes that “winners” are ultimately entitled to the change of reporting sales as well as the new taxing ability from

Department of Revenue SSTA Sourcing Study
- 19 -
interstate sales. The sourcing change is only being made to accommodate the rules from other states. Disadvantages understated. Would affect cities’ bond ratings and ability to pay current bond obligations. Most entities have exhausted the practical taxing alternatives. Could take many years, if at all, to have taxing authority from federal government. Meanwhile, cities would have permanently lost revenue and businesses would have to change their register systems. Jon Ingram, Clark County – There are several factors that make this the most constructive option proposed. My comments focus on just one of these, namely the need to distinguish those jurisdictions that are both significantly impacted and have little current and potentially future resources to adjust to the impacts of the new allocation rules. This is reflected in the concept of “means testing” and proposing short term relief for most jurisdictions and longer term relief or other support for those most in need. This is the only proposal to recognize this need and also provide a mechanism to match the worst hit jurisdictions to the amount of resources available from the State for this purpose.

Department of Revenue SSTA Sourcing Study
- 20 -
OPTION 3 Sponsor City of Kent Description Sales tax from the sale of goods is sourced to the retail outlet at or from which delivery is made. Under Streamlined Sales and Use Tax Agreement sourcing rules, if the good is not received at the location of the seller, the sales tax is sourced to the location where receipt occurs. The local portion of the sales tax collections is remitted to local governments based on the existing sales tax distribution system (i.e. point of sale). The implementation date would be linked to the effective date of the state of Washington Streamlined Sales Tax conforming legislation (i.e. adoption of SST Agreement sourcing provisions). Mechanism for Mitigation Existing business location information, with limited supplemental information provided by certain businesses The Department of Licensing uses the Master Licensing System (MLS) for business licensing. The Department of Revenue uses the Excise Tax System (ETS) for processing the Combined Excise Tax returns and allocating of sales tax collections between state and local government. Taxpayer information such as business location is provided by the DOL to the DOR electronically and, to a lesser extent, by other means. Businesses are tracked by the Uniform Business Identifier (UBI) number. Businesses currently record sales tax collections by Location Code on the Combined Excise Tax Return. The ETS could be enhanced to track total sales tax collections by business location for sales tax distribution purposes. Businesses with more than one office would have to submit additional information to determine the location of the storefront, and, as applicable, warehouse, the volume of sales delivered from those locations, and the volume of sales delivered into each jurisdiction. The additional information could be provided through biannual or less frequent supplemental reporting. Businesses that engage predominantly in taxable retail services could be excluded from supplemental reporting. Using this information, the Department could establish future distributions to local governments until the next supplemental reporting period. The state of Washington could establish a system providing an incentive for businesses to properly and timely report new or changes in existing operations. As an example, a number of other states such as Utah offer businesses credits applied against tax obligations. The Department of Revenue already has a penalty for delinquent returns. Legislation could extend

Department of Revenue SSTA Sourcing Study
- 21 -
penalties to other types of errors or omissions. These tools could ultimately reduce the currently significant error rate and consequently decrease the Department of Revenue’s workload. Duration of Mitigation Long-term or Permanent. By using the state of Washington’s existing systems, and supplemental reporting where necessary, the distribution formula elements could be updated periodically and continued indefinitely. Amount of Mitigation Near 100 percent. This option should provide total mitigation because the existing sales tax distribution system is retained. Source of Funds Distribution of local sales taxes collected. Sponsors’ Statements of Advantages and Disadvantages • It conforms to the spirit, intent and requirements of the Streamlined Sales Tax Agreement.
All benefit from the expected gains from taxation of remote sales (i.e. Internet and Catalog). • It is simple. • It remedies the unintended dislocation of sales tax revenues. • It continues to provide a financial incentive for local communities to locate or accommodate
the warehouse, manufacturing and distribution type uses. • No additional funding necessary for the ongoing mitigation revenues (i.e. no state or existing
local moneys). • The effect of business office openings and closings would not be immediate due to
prospective application of distribution ratios. • Certain businesses would have to provide supplemental information. The number of affected
businesses would be limited to those primarily engaged in retail sale delivery type operations (i.e. furniture). Further, supplemental information could be limited to taxable retail sales by location (i.e. goods and services combined).
Department of Revenue Comments The Business Registration System (BRMS) currently has screens that hold business location data. For each account, information for 999 separate business locations can be stored. The information that is stored on these screens is:
• Location address • Assigned location code for that address • SIC Code for that location • Phone number

Department of Revenue SSTA Sourcing Study
- 22 -
• Open, close, and first open dates for that location • An area for an activity description.
The information for these screens is originally obtained from information that is transmitted from DOL through the Master Licensing System when an account is initially set up. If the DOL information does not include business location information, the first business location screen is automatically set up with the mailing address on the application. In maintaining the business location information, it can be updated when such information is received; however, currently there is no formal process in place that facilitates an ongoing effort to keep this information updated and current. Because of this, the business location data generally has not been used for analysis purposes. The Excise Tax System (ETS) does not track specific business location and has no interface with BRMS business location data. The address that is used for the ETS is the mailing address for the account which may or may not be a business location address. If an account has multiple business locations, they can report the sales of all of their business locations on one return by coding the sales to the appropriate local tax jurisdiction code. Therefore, to track retail sales at the location level as described in this model, it may be advisable to require retailers to submit returns on a location basis. In the absence of retailers submitting returns by each location, the Department would have to develop distribution tables for each account based on historical coding of their local taxes. Those tables would determine how we would distribute the taxes when the new sourcing rules went into effect. The Kent model does not address the segregation of the retail services and some remote sales that, under current law, are sourced to the point of delivery. Some of these retailers could be excluded by NAICS code. However, retailers who engage in both activities would need to segregate their sales in their supplemental returns. To be most accurate, the Department would need to review each account to determine if there was a potential impact due to retail services being performed. In addition to the substantial programming time involved in creating the account level redistribution tables, the Kent model would require administration of the supplemental reporting of information needed to maintain current and up-to-date redistribution tables for each account. The Department’s survey identified approximately 20,000 retailers who may engage in delivered sales. These retailers would need to provide the Department with location information and detail of the type and quantity of sales being conducted in each location. This information can be collected on an annual or biannual basis, but at that frequency, there is a greater risk that supplemental return data to actual return activity will not reconcile. Depending on what incentives (credits) or enforcement (penalties or fees) that would be put in place (if any), there would be variable impacts. If reporting were required, we would have a new level of compliance to set up including follow-up with retailers that do not send in their reports. This is an expensive option to administer.
Department of Revenue SSTA Sourcing Study
- 23 -
Committee Comments George Walk, Pierce County – Does not follow the spirit of the sourcing goal. Tries to simply find a loophole to mirror the current system. It would “lock-in” prosperity for a few jurisdictions at the expense of many others. Ignores changing economies among jurisdictions. Mike Martin, City of Kent – This proposal is very similar to the mitigation strategy adopted by Utah. The proposal preserves the current local sales tax distribution system. Local governments are free to choose whether or not to seek growth in certain economic development sectors without the concern for available funding, a critical component for bondholders. Additional reporting requirements for businesses could be limited through diminishing the number of businesses affected. Mixed retail goods and services businesses could be characterized based on predominant type of businesses for purposes of sourcing. Doug Cochran, Yakima County – These proposals appear to create a vast artificial economy in some computer in Olympia. The goal of the streamlining process is simplification, not additional complexity. I think citizens would think we in government had finally lost our minds completely. We need to stick to moving forward and caring for the communities that need help. This proposal also uses the reverse Robin Hood approach. Vicki Kirkpatrick, WSAC – These proposals seem to fall under the heading of “let’s pretend it didn’t happen.” Unfortunately, creating the virtual world where sometimes it did happen and other times it didn’t would be prone to error and waste significant resources. It would be better to adopt a relatively simple method and concentrate our resources on helping the communities that need help. Maureen Morris, WSAC – DOR must attempt to create a virtual sales tax reality where sourcing has not been implemented, while in the real world sourcing is a fact. Administrative costs imposed on the state in this proposal would be better spent on mitigation. By using revenue from relatively low income jurisdictions to fund mitigation for relatively high income jurisdictions, this proposal violates principles adopted by AWC and WSAC. The complexity is in stark contrast to other proposals. A majority of members seem to support some variant of the Seattle, WSAC, or Federal Way proposals, not this approach. Jon Ingram, Clark County – There are two related proposals from Kent, but both suffer from the same defects, the primary being that the proposals combine permanent relief and relief for all impacted jurisdictions. In effect, these proposals attempt to freeze the allocation of sales tax at a moment in time. I don’t believe that this is realistic. If we are to respond to the impacts of technology and business practices (Internet and catalogue sales), then we will inevitably be required to accept changes in how we administer these areas. The proposals also require significant additional administration costs, both of the State and the private sector.
Department of Revenue SSTA Sourcing Study
- 24 -
OPTION 4 Sponsor City of Kent – Simplified Description Sales tax from the sale of goods is sourced to the retail outlet at or from which delivery is made. Under Streamlined Sales and Use Tax Agreement sourcing rules, if the good is not received at the location of the seller, the sales tax is sourced to the location where receipt occurs. The local portion of the sales tax collections is remitted to local governments based on the baseline of existing sales tax distributions at the individual business level (i.e. point of sale). The implementation date would be linked to the effective date of the state of Washington Streamlined Sales Tax conforming legislation (i.e. adoption of SST Agreement sourcing provisions). Mechanism for Mitigation Existing business location and local sales tax distribution information. The Department of Licensing uses the Master Licensing System (MLS) for business licensing. The Department of Revenue uses the Excise Tax System (ETS) for processing the Combined Excise Tax returns and allocating sales tax collections between state and local government. Taxpayer information such as business location is provided by the DOL to the DOR electronically and, to a lesser extent, by other means. Businesses are tracked by the Uniform Business Identifier (UBI) number. Businesses currently record sales tax collections by Location Code on the Combined Excise Tax Return. The ETS could be enhanced to track total sales tax collections by business location for sales tax distribution purposes. The Department of Revenue would use the ETS to determine the percentage of the taxable sales or services for the most recent twelve-month period (or some other duration) by location for each business. Businesses would not be required to submit additional information. Using this information, the Department could establish future distributions to local governments. The State of Washington could establish a system providing an incentive for businesses to properly and timely report new operations or changes in existing operations. As an example, a number of other states such as Utah offer businesses credits applied against tax obligations. The Department of Revenue already has a penalty for delinquent returns. Legislation could extend penalties to other types of errors or omissions. These tools could ultimately reduce the currently significant error rate and consequently decrease the Department of Revenue’s workload.
Department of Revenue SSTA Sourcing Study
- 25 -
Duration of Mitigation Long-term or Permanent. Absent supplemental reporting for multiple-office businesses, eventually this information would become less reliable due to individual store openings and closures of multiple branch sellers. Over time distribution will become increasingly based on point of delivery rather than point of sale. Amount of Mitigation Near 100 percent. This option should provide significant mitigation because the existing sales tax distribution information is retained for existing taxpayers. Source of Funds Distribution of local sales taxes collected. Sponsors’ Statements of Advantages and Disadvantages • It conforms to the spirit, intent and requirements of the Streamlined Sales Tax Agreement.
All benefit from the expected gains from taxation of remote sales (i.e. Internet and Catalog) • It is simple, even simpler than the regular version of this proposal. • It remedies the unintended dislocation of sales tax revenues. • It continues to provide a financial incentive for local communities to maintain existing
warehouse, manufacturing and distribution type uses. However, over time as current businesses close and new ones take their place, the incentives for maintaining warehousing and manufacturing facilities will decrease, because there are no updates to the distribution formula.
• Use of state moneys limited to relatively minor increased Department of Revenue administrative costs.
• No additional funding necessary for the ongoing mitigation revenues (i.e. no state or existing local moneys).
• The effect of business office openings and closings would not be immediate due to prospective application of distribution ratios based solely on historical data.
Department of Revenue Comments It appears that this option would freeze sales tax distributions to the location codes contained in the last return, or a set of returns, submitted by retailers prior to SSTA sourcing. In addition to not recognizing business openings and closures, this option will not reflect changes in individual retailer operations or retailing markets. Since this option will not be updated, the Department assumes a one-time expenditure to implement this model.

Department of Revenue SSTA Sourcing Study
- 26 -
Committee Comments George Walk, Pierce County – Does not follow the spirit of the sourcing goal. Tries to simply find a loophole to mirror the current system. It would “lock-in” prosperity for a few jurisdictions at the expense of many others. Ignores changing economies among jurisdictions. Mike Martin, City of Kent – This proposal is very similar to the mitigation proposal advanced by Redmond, except it is long-term in duration. The proposal preserves the current local sales tax distribution system for existing taxpayers. Local governments are free to choose whether or not to seek growth in certain economic development sectors without the concern for available funding, a critical component for bondholders. There are no additional reporting requirements for businesses; however, this would limit the reliability of the mitigation determinations. Doug Cochran, Yakima County – These proposals appear to create a vast artificial economy in some computer in Olympia. The goal of the streamlining process is simplification, not additional complexity. I think citizens would think we in government had finally lost our minds completely. We need to stick to moving forward and caring for the communities that need help. This proposal also uses the reverse Robin Hood approach. Vicki Kirkpatrick, WSAC – These proposals seem to fall under the heading of “let’s pretend it didn’t happen.” Unfortunately, creating the virtual world where sometimes it did happen and other times it didn’t would be prone to error and waste significant resources. It would be better to adopt a relatively simple method and concentrate our resources on helping the communities that need help. Maureen Morris, WSAC – DOR must attempt to create a virtual sales tax reality where sourcing has not been implemented, while in the real world sourcing is a fact. Administrative costs imposed on the state in this proposal would be better spent on mitigation. By using revenue from relatively low income jurisdictions to fund mitigation for relatively high income jurisdictions, this proposal violates principles adopted by AWC and WSAC. The complexity is in stark contrast to other proposals. A majority of members seem to support some variant of the Seattle, WSAC or Federal Way proposals not this approach. Jon Ingram, Clark County – There are two related proposals from Kent, but both suffer from the same defects, the primary being that the proposals combine permanent relief and relief for all impacted jurisdictions. In effect, these proposals attempt to freeze the allocation of sales tax at a moment in time. I don’t believe that this is realistic. If we are to respond to the impacts of technology and business practices (Internet and catalogue sales), then we will inevitably be required to accept changes in how we administer these areas. The proposals also require significant additional administration costs, both of the State and the private sector.

Department of Revenue SSTA Sourcing Study
- 27 -
OPTION 5 Sponsor Department of Revenue Description Sales tax from the sale of goods is sourced to the retail outlet at or from which delivery is made. Under Streamlined Sales and Use Tax Agreement sourcing rules, if the good is not received at the location of the seller, the sales tax is sourced to the location where receipt occurs. It appears from the survey data that a small number of large retailers will generate the majority of the tax base shifts once SSTA sourcing is implemented. These retailers are concentrated within a few classifications. These include furniture, electronic and appliance stores, and catalog/internet sellers with distribution facilities within the state. This proposal attempts to reallocate the sales taxes from sales of goods by a sample of retailers that are being delivered from warehouses and other delivery facilities to the local jurisdiction in which the warehouse or facility is located. Mechanism for Mitigation Formula driven. A sample of the retailers would have to submit additional information to determine the location of their warehouses, the volume of sales delivered from those locations, and the volume of sales delivered into each jurisdiction. The additional information could be provided on annual or bi-annual supplemental reporting. If it is desired to have a reallocation on a firm level basis, the number of firms would need to be very small for the Department to administer such a system. A small sample would also allow the Department to use existing return data to verify the information in supplemental reports. Using that information, the Department could reallocate an individual firm’s revenues based on that firm’s historical patterns and supplemental reporting information. If it is desired that the Department reallocate revenue from a larger number of firms, supplemental reporting of a representative sample could be used to develop a formula for reallocation for retail sales made by retailers within select NAICS codes associated with warehouse deliveries. A single formula would be developed based on the entire sample’s delivery activity and applied to all retailers that share the characteristics of the sample.

Department of Revenue SSTA Sourcing Study
- 28 -
Duration of Mitigation Temporary. This proposal would limit the size and duration of mitigation to the firms in the initial sample. Therefore, mitigation will be reduced over time as firms close or change location. Additionally, the option will not mitigate for firms that enter jurisdictions after SSTA sourcing. It is conceivable that this option could be extended for a longer period. However, the administrative burdens would increase because the Department and retailers would need to collect additional information in order to exclude other economic activity that may affect sales tax revenues. For example, a retailer may add or move its warehouses. This information can only be obtained directly from the retailer. Additionally, as businesses close or new businesses open, the sample would need to be updated through additional information from retailer returns or supplemental surveys. Amount of Mitigation Less than 100 percent. This option will not provide total mitigation. By focusing on a small group of large retailers, this option assumes that local jurisdictions would not be mitigated for shifts that occur outside of this sample. Source of Funds Reallocating local sales taxes from on jurisdiction to another. Sponsors’ Statements of Advantages and Disadvantages • By limiting the number of firms impacted by the option to the largest retailers, the amount
and detail of additional reporting necessary to reallocate funds is reduced. • The largest retailers currently have the lowest return error rates. Therefore, the additional
information would be more reliable and the amount of mitigation would be more accurate. • These retailers may have inventory data or other means to track the volume of sales through
warehouses or other facilities by location. • If these retailers need resources to collect and submit additional information, compensation is
an option since the number of firms would be small. • It is also a manageable number of firms for the Department to communicate with and to
administer differently. • The majority of small business is excluded from any additional reporting. • Allocation using a single, more aggregate formula is less expensive and easier to administer. • Direct reallocation will provide less than full mitigation. • Allocation at the individual firm level will be complicated and expensive to administer, even
if limited to a very small group of retailers. • Would not reduce administrative burdens on the retailers who anticipated administrative
gains from SSTA.

Department of Revenue SSTA Sourcing Study
- 29 -
Committee Comments George Walk, Pierce County – Seems to use revenue that would otherwise flow to low revenue jurisdictions to mitigate impacts on higher revenue communities. Would choose a few business firms upon which to derive a formula. This seems arbitrary and depends totally on the cooperation of those firms willing to participate. Mike Martin, City of Kent – This proposal is very similar to the distribution proposal (regular) advanced by the City of Kent except that it is short-term in duration. Therefore, it is not likely that severely impacted jurisdictions would have adequate time to make budgetary adjustments without significant adverse effects to their communities. The reliability of this information is dependent on the sample size of businesses selected and information provided by the businesses. Finally, it is likely that the manufacturing, wholesaling and warehousing sector would see diminished opportunities for expansion and growth resulting in adverse effects on the state and local economies. If the formula supported mitigation at a level of at least 90 percent, it could be supported. Doug Cochran, Yakima County – At the time of comments, the results of this proposal were not clear. Sourcing results in a complex set of gains and losses in each community. By focusing on one type of industry, this proposal would tend to favor the communities with concentrations of warehouses. Most consumers who buy furniture at the local Bon furniture store would think they are shopping in their community. This proposal would have some community remote from their home receive the benefit of their shopping dollars. Vicki Kirkpatrick, WSAC – Many of the communities losing revenue do not have warehouse facilities. This proposal does not help them. Maureen Morris, WSAC – Does not provide long term relief to small relatively distressed jurisdictions. By intervening in a single narrow segment of the sourcing issue, it will reduce the gains that currently offset losses in some communities. It attempts to use the revenue that would otherwise flow to low revenue communities to mitigate sourcing impacts in relatively high income communities. This violates the principles adopted by AWC and WSAC on this topic. Both organizations support state-funded mitigation. Rather that prioritizing mitigation based on severity of loss, jurisdictions are mitigated based on their mix of industries. Jon Ingram, Clark County – This proposal attempts to shift sales tax increases in some jurisdiction to compensate losses in others. It has the advantage that the goal is based on specific data and therefore has the best chance of these proposals of separating the impact of allocation methodology changes from general growth impacts. However to do this on a large scale will be complicated and difficult to administer. On a smaller scale, the proposal may do little to address the hardship of badly hit smaller jurisdictions. The complications and expense of administering this proposal will be significant and will increase rapidly over time as it becomes increasingly difficult to isolate the “sourcing” impacts from other economic realities (opening and closing distribution points; changes in business practices and record keeping within businesses etc.).

Department of Revenue SSTA Sourcing Study
- 30 -
OPTION 6 Sponsor City of Redmond Description While the City of Redmond supports the principles of SST and believes it is in the best long-term interests of the state of Washington, it does not support implementing SST until the federal government takes action to lift the Internet sales tax moratorium and the state of Washington takes action to ensure cities are not adversely impacted. However, should the state move ahead prior to these actions, the City of Redmond has developed the following proposal. This option temporarily pools statewide sales taxes and distributes them based upon the proportion each jurisdiction or agency currently receives during a pre-selected (baseline) period. This baseline period can be either one year (such as 2002), or a period of years (average of the last four years, for example). To illustrate this proposal, if in 2002 Redmond received 2.8 percent of statewide taxable retail sales and 2002 was used as the baseline period, under the temporary mitigation effort Redmond would continue receiving this share. The City of Redmond envisions this proposal to be in effect for a short period (two to three years). During this period, a more detailed evaluation of the actual intrastate shift in revenues could be made and a long-term, permanent mitigation solution could be developed. While the duration of this mitigation option can be extended, it is not recommended. Changes in the economy, openings and closures of retail establishments, annexations, and incorporations will begin to mask the actual effects of intrastate revenue shifts due to SSTA sourcing. These factors will make it difficult to isolate the effects of sourcing, and to mitigate for that purpose. Mechanism for Mitigation Formula-driven based upon the selected baseline period. Duration of Mitigation Temporary, no more than two to three years. More permanent solution developed during this period. Amount of Mitigation One hundred percent. Source of Funds Reallocating local sales taxes based upon each jurisdiction’s historical proportionate share.

Department of Revenue SSTA Sourcing Study
- 31 -
Sponsors’ Statements of Advantages and Disadvantages • No net loss to baseline sales tax receipts for the state, local jurisdictions, PTBAs and PFDs. • The state can implement the SSTA. • Provides additional time to evaluate the actual intrastate sales tax revenue shifts and to
develop a mitigation solution that is structured around actual losses rather than estimates. • Provides additional time for all jurisdictions and other agencies that receive sales taxes to
review the actual fiscal impacts to their respective organizations and be able to revise their business plans accordingly.
• Treats all jurisdictions and entities currently receiving sales taxes fairly and equitably as each will continue receiving a proportionate share of statewide sales taxes.
• Easy to implement and to understand. • Jurisdictions that grow faster than the statewide average will subsidize those jurisdictions that
grow slower than the statewide average for the duration until such time the temporary mitigation ends.
• Requires additional resources for further study and analysis of post-SST fiscal impacts and mitigation options.
Department of Revenue Comments There are other possible allocation formulae that could be used. They can account for changes in population and or business activity that would affect a jurisdiction’s expenditures. For example, the distribution formula could be based on the statewide average growth rate of TRS per capita, or on the average statewide growth of TRS per employee, or a combination of per capita and per employee. Calculation of any of these allocation formulae or the Redmond proposed formula would require only minimal additional resources for the Department to implement. However, additional resources would be necessary to reevaluate the impacts of SSTA sourcing for future mitigation options. Committee Comments George Walk, Pierce County – Does not follow the spirit of the sourcing goal. Tries to simply find a loophole to mirror the current system. It would lock-in” prosperity for a few jurisdictions at the expense of many others. Ignores changing economies among jurisdictions. Mike Martin, City of Kent – Under this proposal, each jurisdiction retains its existing share of state-wide local sales tax revenues. However, the two or three year duration period would likely not give severely impacted jurisdictions adequate time to make budgetary adjustments without significant adverse effects to their communities. Finally, it is likely that the manufacturing, wholesaling and warehousing sector would see diminished opportunities for expansion and growth resulting in adverse effects on the state and local economies.

Department of Revenue SSTA Sourcing Study
- 32 -
Doug Cochran, Yakima County – This proposal freezes a jurisdiction’s revenue picture at a point in time. It presents a further hurdle for revenue deprived communities when they try to improve the economic welfare of their citizens and fund basic service. Proposals like this are the reverse Robin Hood approach. They tend to take from the poor and give to the relatively rich. Vicki Kirkpatrick, WSAC – This approach will penalize communities trying to work their way out of recession or long term distress. Many of these communities are unable to sustain basic services. Washington’s economy and its local governments are constantly changing. We need to use a method that deals with the jurisdictions that need help and move forward to press our case for collection of taxes on remote sales. This will benefit all levels of government in Washington, our main street businesses, and our citizens. Maureen Morris, WSAC – Freezes local government’s share of statewide local sales tax. Fails to recognize that some jurisdictions are still experiencing severe local economic conditions. As they and their businesses fight to recover, they would not enjoy any benefit from there efforts. Conversely, communities that did not fall victim to the recession will lock in their good fortune. Seems to eliminate sales tax as a fund source for Tax Increment Financing. Neither AWC nor WSAC support a process where relatively revenue-rich jurisdictions are mitigated by relatively poor jurisdictions. This proposal, in fact, has that mechanism as its basis. John Ingram, Clark County – This proposal has the advantage of being fairly simple to administer, but suffers from the disadvantage that all of the mitigation is derived by shifting sales tax between jurisdictions. This means that areas of significant sales tax growth independent of “sourcing” impacts will see sales tax from this growth diverted to other jurisdictions. This is recognized in the short term nature of the initial shift (two to three years), but even this can have a very significant impact on high growth jurisdictions.

Department of Revenue SSTA Sourcing Study
- 33 -
OPTION 7 Sponsor City of Puyallup Description Implement the new sourcing rules concurrently with the grant of federal authority to states to compel the collection of sales and use tax on remote sales. Mechanism for Mitigation Distribute gains in state sales tax from remote sales to adversely affected jurisdictions. Alternatively, distribute gains received by local jurisdictions that benefited from the new sourcing rules. Duration of Mitigation Unstated. Amount of Mitigation Unstated. Source of Funds State sales tax gains or local sales tax gains. Sponsors’ Statements of Advantages and Disadvantages • Reduces the impact on local jurisdictions by offsetting it with gains from remote sales. • Allows time for retailers to prepare for the change. • Allows local jurisdictions time to prepare for the change. • If federal authorization to require collection of tax on remote sales never comes, nothing is
lost. • The Department will not be a member of the Streamlined Sales and Use Tax Agreement
governing board and will not receive the benefits of membership. Department of Revenue Comments The Department of Revenue wants to implement the sourcing because it is necessary to be a member of the governing board. If Washington is not on the governing board, it will not have a voice as the new sales tax system is developed. As a member of the governing board, Washington and local governments in Washington will benefit by having a number of remote
Department of Revenue SSTA Sourcing Study
- 34 -
sellers voluntarily agree to begin collecting and remitting sales and use taxes even before federal authority is granted. Draft legislation has a built-in delay in implementing the sourcing provisions in order to allow retailers time to be educated in the changes and to make the necessary adjustments in their systems. There will be problems with making sourcing effective immediately when Congress acts because retailers will not be educated on the new sourcing scheme. Committee Comments (As Summarized by DOR) Glen Lee, City of Seattle – Agreed, but indicated if it came down to a choice between being a member of Streamlined Sales Tax Agreement governing board and not implementing sourcing, we should participate in the Agreement. We need to move ahead with streamlining. Mike Martin, City of Kent – Supported this concept. Jon Ingram, Clark County, George Walk, Pierce County, and Vicki Kirkpatrick, WSAC – All agreed with the City of Seattle’s comments. Maureen Morris, WSAC – Expressed that her organization took no official position on this proposal.

Department of Revenue SSTA Sourcing Study
- 35 -
APPENDICES

Department of Revenue SSTA Sourcing Study
A-1
APPENDIX A
ALPHABETICAL LISTING OF COUNTIES AND CITIES Calendar Year 2002 – Changes from Sourcing
(Prepared by DOR)
The following numbers are estimates. As with all estimates, there is a margin of error. For some very small cities and counties, the margin of error may be large enough to produce inconsistent results. Taxes for cities located in more than one county are not combined.
Location
Basic & Optional
Local Sales Tax on Gain or
Loss
Correctional Facility
Sales Tax on Gain or
Loss
Criminal Justice
Sales Tax on Gain or Loss
Combined Sales Tax on Gain or
Loss
Total Combined
Sales Tax on CY02 TRS
Gain or Loss as a Percent of Combined Sales Tax on CY02
TRS ADAMS COUNTY 43,487 4,260 47,747 489,091 9.76% ASOTIN COUNTY (127) (127) 199,229 -0.06% BENTON COUNTY 41,479 (85,422) (26,569) (70,513) 5,919,916 -1.19% CHELAN COUNTY (149,606) (17,646) (167,252) 4,362,040 -3.83% CLALLAM COUNTY 58,260 14,924 73,184 3,896,073 1.88% CLARK COUNTY 289,802 35,179 324,981 14,293,209 2.27% COLUMBIA COUNTY 6,498 6,498 76,750 8.47% COWLITZ COUNTY 275,848 275,848 2,714,043 10.16% DOUGLAS COUNTY 159,497 4,717 164,214 1,610,663 10.20% FERRY COUNTY 39,735 3,702 43,437 209,397 20.74% FRANKLIN COUNTY 92,410 (7,956) (2,598) 81,857 2,321,654 3.53% GARFIELD COUNTY 19,788 19,788 37,883 52.23% GRANT COUNTY 68,756 (9,116) 59,641 2,497,249 2.39% GRAYS HARBOR COUNTY (389,529) (29,286) (418,816) 3,350,081 -12.50% ISLAND COUNTY 71,822 18,739 13,524 104,085 4,131,575 2.52% JEFFERSON COUNTY 137,485 13,241 150,726 1,699,794 8.87% KING COUNTY 643,289 (103,415) 539,874 72,383,775 0.75% KITSAP COUNTY 670,302 102,413 73,605 846,321 18,861,471 4.49% KITTITAS COUNTY 40,676 6,648 3,161 50,484 1,921,214 2.63% KLICKITAT COUNTY 8,187 8,187 783,261 1.05% LEWIS COUNTY (271,254) (5,405) (3,445) (280,104) 7,091,190 -3.95% LINCOLN COUNTY 68,178 7,762 75,940 238,665 31.82% MASON COUNTY 114,921 23,893 20,225 159,038 2,856,660 5.57% OKANOGAN COUNTY 48,556 (4,780) 43,777 1,251,552 3.50% PACIFIC COUNTY 168,451 168,451 704,706 23.90% PEND OREILLE COUNTY 110,275 110,275 221,375 49.81% PIERCE COUNTY 3,152,227 182,576 92,853 3,427,656 38,211,828 8.97%

Department of Revenue SSTA Sourcing Study
A-2
SAN JUAN COUNTY 86,339 11,589 10,128 108,055 2,642,878 4.09% SKAGIT COUNTY 620,755 10,770 631,524 5,789,692 10.91% SKAMANIA COUNTY 6,008 6,008 130,263 4.61% SNOHOMISH COUNTY 3,079,692 121,344 3,201,036 27,976,665 11.44% SPOKANE COUNTY (57,897) (95,012) (33,411) (186,320) 23,716,362 -0.79% STEVENS COUNTY 25,913 (8,829) 17,084 1,183,291 1.44% THURSTON COUNTY 1,037,897 (42,508) (25,503) 969,887 12,723,814 7.62% WAHKIAKUM 13,621 13,621 101,232 13.46% WALLA WALLA COUNTY 65,900 (11,567) (4,218) 50,115 2,127,085 2.36% WHATCOM COUNTY 1,866,417 80,293 1,946,710 7,070,649 27.53% WHITMAN COUNTY 8,448 (1,444) 7,004 802,206 0.87% YAKIMA COUNTY 114,834 (23,396) 91,438 6,002,168 1.52% ABERDEEN (99,915) (13,744) (113,659) 3,093,431 -3.67% AIRWAY HEIGHTS (7,062) (916) (7,978) 417,201 -1.91% ALBION (436) (81) (517) 9,090 -5.69% ALGONA 43,882 (476) 43,406 232,154 18.70% ALMIRA 2,714 402 3,116 16,491 18.90% ANACORTES (203,888) 2,823 (201,065) 2,519,986 -7.98% ARLINGTON 181,377 4,352 185,730 2,960,087 6.27% ASOTIN CITY 31 31 23,175 0.13% AUBURN/KING (1,236,543) (8,293) (1,244,837) 12,439,530 -10.01% AUBURN/PIERCE (880) 236 (645) 225,681 -0.29% BAINBRIDGE ISLAND 210,853 8,216 219,068 2,121,829 10.32% BATTLE GROUND 76,834 1,809 78,643 998,924 7.87% BEAUX ARTS VILLAGE 16,965 (56) 16,910 28,169 60.03% BELLEVUE (1,420,137) (22,068) (1,442,205) 36,331,021 -3.97% BELLINGHAM (278,997) 58,018 (220,980) 13,835,929 -1.60% BENTON CITY 741 (1,419) (679) 168,073 -0.40% BINGEN (1,180) (1,180) 41,476 -2.84% BLACK DIAMOND (372) (757) (1,129) 247,269 -0.46% BLAINE 72,793 3,330 76,123 731,489 10.41% BONNEY LAKE 76,262 2,801 79,063 1,540,976 5.13% BOTHELL/KING (480,788) (3,068) (483,856) 4,661,575 -10.38% BOTHELL/SNOHOMISH 59,365 4,749 64,114 2,843,734 2.25% BREMERTON 126,465 14,739 141,204 5,735,045 2.46% BREWSTER 2,432 (371) 2,061 177,622 1.16% BRIDGEPORT 2,406 402 2,808 46,000 6.11% BRIER 95,474 2,112 97,587 167,607 58.22% BUCKLEY 22,749 1,000 23,748 402,546 5.90% BUCODA 105 (115) (10) 17,638 -0.06% BURIEN 340,060 (6,000) 334,061 4,207,598 7.94% BURLINGTON (682,727) 1,361 (681,366) 5,250,719 -12.98%

Department of Revenue SSTA Sourcing Study
A-3
CAMAS 44,244 2,204 46,448 1,044,848 4.45% CARBONADO 514 147 661 16,022 4.13% CARNATION (5,172) (359) (5,531) 257,462 -2.15% CASHMERE 9,267 (1,445) 7,822 218,579 3.58% CASTLE ROCK 29,438 29,438 217,824 13.51% CATHLAMET 4,411 4,411 62,914 7.01% CENTRALIA 303,942 (1,042) 302,900 2,151,169 14.08% CHEHALIS (93,460) (489) (93,949) 2,543,512 -3.69% CHELAN CITY 22,271 (1,678) 20,593 628,382 3.28% CHENEY 23,786 (1,889) 21,896 678,240 3.23% CHEWELAH (27,798) (553) (28,351) 220,041 -12.88% CLARKSTON (55,953) (55,953) 467,785 -11.96% CLE ELUM 28,686 305 28,991 434,352 6.67% CLYDE HILL 128,231 (546) 127,685 175,100 72.92% COLFAX 8,422 (375) 8,047 275,537 2.92% COLLEGE PLACE (62,804) (1,510) (64,314) 423,521 -15.19% COLTON 53 (51) 2 12,163 0.01% COLVILLE (111,619) (1,237) (112,856) 1,156,841 -9.76% CONCONULLY 41 (33) 8 10,426 0.08% CONCRETE 5,766 150 5,915 65,921 8.97% CONNELL 6,219 (433) 5,787 155,459 3.72% COSMOPOLIS 5,933 (1,324) 4,610 112,745 4.09% COULEE CITY 612 (119) 493 48,917 1.01% COULEE DAM 579 (144) 435 51,176 0.85% COUPEVILLE 13,494 399 13,893 254,700 5.45% COVINGTON 186,719 (2,715) 184,003 1,289,294 14.27% CRESTON 2,798 331 3,129 10,200 30.67% CUSICK 3,783 3,783 11,658 32.45% DARRINGTON (1,138) 438 (701) 112,563 -0.62% DAVENPORT 53,602 2,344 55,945 182,603 30.64% DAYTON 2,553 2,553 163,173 1.56% DEER PARK (7,834) (610) (8,444) 473,863 -1.78% DES MOINES 739,852 (5,566) 734,286 1,829,673 40.13% DU PONT 24,543 747 25,290 368,409 6.86% DUVALL 12,876 (979) 11,897 519,898 2.29% EAST WENATCHEE (93,525) 1,551 (91,974) 1,597,766 -5.76% EATONVILLE (3,026) 469 (2,557) 304,372 -0.84% EDGEWOOD 273,448 2,112 275,560 431,909 63.80% EDMONDS 554,167 12,933 567,100 4,358,285 13.01% ELECTRIC CITY 291 (192) 99 26,569 0.37% ELLENSBURG (7,668) 2,722 (4,946) 2,411,081 -0.21% ELMA (5,615) (2,685) (8,301) 396,322 -2.09% ELMER CITY 27 (45) (17) 4,374 -0.40%

Department of Revenue SSTA Sourcing Study
A-4
ENDICOTT (48) (47) (95) 13,088 -0.72% ENTIAT (2,378) (470) (2,848) 46,047 -6.18% ENUMCLAW (273,981) (2,112) (276,093) 1,909,170 -14.46% EPHRATA (60,896) (1,387) (62,283) 937,239 -6.65% EVERETT (1,664,614) 31,487 (1,633,128) 18,379,064 -8.89% EVERSON 4,200 1,688 5,888 145,638 4.04% FAIRFIELD (1,556) (117) (1,673) 36,665 -4.56% FARMINGTON (71) (20) (91) 3,955 -2.30% FEDERAL WAY 609,727 (15,815) 593,911 11,554,039 5.14% FERNDALE 8,432 7,476 15,909 931,513 1.71% FIFE (1,063,602) 1,091 (1,062,511) 4,955,458 -21.44% FIRCREST 104,345 1,343 105,687 236,459 44.70% FORKS 20,824 1,012 21,835 280,367 7.79% FRIDAY HARBOR 29,549 1,461 31,010 685,250 4.53% GARFIELD 91 (83) 8 20,993 0.04% GEORGE 299 (109) 190 40,338 0.47% GIG HARBOR (85,360) 1,482 (83,878) 3,360,947 -2.50% GOLD BAR 9,603 674 10,276 95,614 10.75% GOLDENDALE (6,650) (6,650) 252,678 -2.63% GRAND COULEE (15,285) (184) (15,469) 166,096 -9.31% GRANDVIEW (35,230) (1,747) (36,978) 645,055 -5.73% GRANGER 3,534 (549) 2,985 82,528 3.62% GRANITE FALLS (53,174) 905 (52,269) 343,332 -15.22% HAMILTON 1,170 64 1,234 12,750 9.68% HARRAH 250 (129) 121 27,488 0.44% HARRINGTON 1,636 585 2,220 21,084 10.53% HARTLINE 95 (26) 69 4,655 1.48% HATTON 362 45 407 3,170 12.85% HOQUIAM (211,343) (7,566) (218,908) 599,360 -36.52% HUNTS POINT 279 (86) 193 113,210 0.17% ILWACO 5,754 5,754 99,742 5.77% INDEX 1,088 52 1,141 11,612 9.82% IONE 2,788 2,788 25,555 10.91% ISSAQUAH (241,411) (2,601) (244,012) 8,539,538 -2.86% KAHLOTUS 233 (30) 203 6,311 3.21% KALAMA 9,882 9,882 178,127 5.55% KELSO 253,229 253,229 1,720,211 14.72% KENMORE 327,657 (3,618) 324,039 1,339,144 24.20% KENNEWICK (777,171) (29,314) (806,485) 10,350,165 -7.79% KENT (2,252,276) (15,896) (2,268,172) 19,140,260 -11.85% KETTLE FALLS 1,865 (378) 1,487 114,738 1.30%
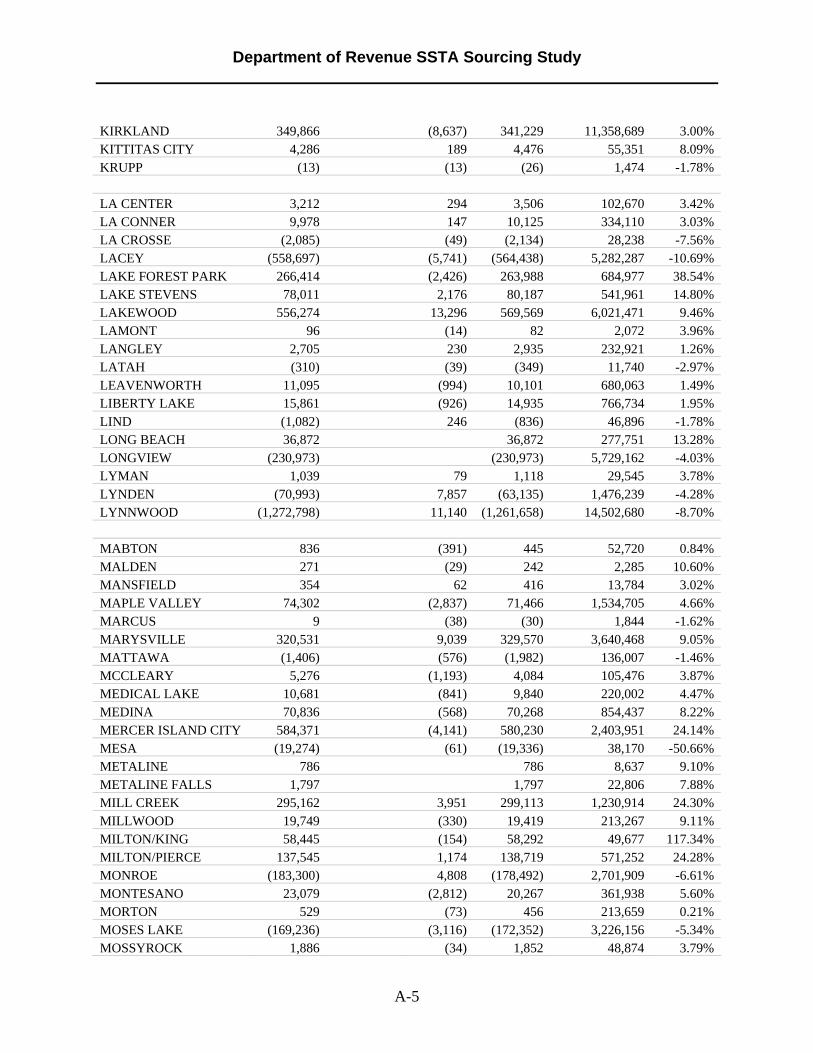
Department of Revenue SSTA Sourcing Study
A-5
KIRKLAND 349,866 (8,637) 341,229 11,358,689 3.00% KITTITAS CITY 4,286 189 4,476 55,351 8.09% KRUPP (13) (13) (26) 1,474 -1.78% LA CENTER 3,212 294 3,506 102,670 3.42% LA CONNER 9,978 147 10,125 334,110 3.03% LA CROSSE (2,085) (49) (2,134) 28,238 -7.56% LACEY (558,697) (5,741) (564,438) 5,282,287 -10.69% LAKE FOREST PARK 266,414 (2,426) 263,988 684,977 38.54% LAKE STEVENS 78,011 2,176 80,187 541,961 14.80% LAKEWOOD 556,274 13,296 569,569 6,021,471 9.46% LAMONT 96 (14) 82 2,072 3.96% LANGLEY 2,705 230 2,935 232,921 1.26% LATAH (310) (39) (349) 11,740 -2.97% LEAVENWORTH 11,095 (994) 10,101 680,063 1.49% LIBERTY LAKE 15,861 (926) 14,935 766,734 1.95% LIND (1,082) 246 (836) 46,896 -1.78% LONG BEACH 36,872 36,872 277,751 13.28% LONGVIEW (230,973) (230,973) 5,729,162 -4.03% LYMAN 1,039 79 1,118 29,545 3.78% LYNDEN (70,993) 7,857 (63,135) 1,476,239 -4.28% LYNNWOOD (1,272,798) 11,140 (1,261,658) 14,502,680 -8.70% MABTON 836 (391) 445 52,720 0.84% MALDEN 271 (29) 242 2,285 10.60% MANSFIELD 354 62 416 13,784 3.02% MAPLE VALLEY 74,302 (2,837) 71,466 1,534,705 4.66% MARCUS 9 (38) (30) 1,844 -1.62% MARYSVILLE 320,531 9,039 329,570 3,640,468 9.05% MATTAWA (1,406) (576) (1,982) 136,007 -1.46% MCCLEARY 5,276 (1,193) 4,084 105,476 3.87% MEDICAL LAKE 10,681 (841) 9,840 220,002 4.47% MEDINA 70,836 (568) 70,268 854,437 8.22% MERCER ISLAND CITY 584,371 (4,141) 580,230 2,403,951 24.14% MESA (19,274) (61) (19,336) 38,170 -50.66% METALINE 786 786 8,637 9.10% METALINE FALLS 1,797 1,797 22,806 7.88% MILL CREEK 295,162 3,951 299,113 1,230,914 24.30% MILLWOOD 19,749 (330) 19,419 213,267 9.11% MILTON/KING 58,445 (154) 58,292 49,677 117.34% MILTON/PIERCE 137,545 1,174 138,719 571,252 24.28% MONROE (183,300) 4,808 (178,492) 2,701,909 -6.61% MONTESANO 23,079 (2,812) 20,267 361,938 5.60% MORTON 529 (73) 456 213,659 0.21% MOSES LAKE (169,236) (3,116) (172,352) 3,226,156 -5.34% MOSSYROCK 1,886 (34) 1,852 48,874 3.79%

Department of Revenue SSTA Sourcing Study
A-6
MOUNT VERNON 509,144 5,049 514,194 4,360,086 11.79% MOUNTLAKE TERRACE 395,852 6,709 402,561 1,316,797 30.57% MOXEE CITY 1,778 (173) 1,604 60,804 2.64% MUKILTEO 369,497 6,070 375,567 1,565,475 23.99% NACHES 2,362 (146) 2,215 112,544 1.97% NAPAVINE 495 (94) 401 142,907 0.28% NESPELEM 3,494 (35) 3,459 7,332 47.18% NEWCASTLE 207,985 (1,548) 206,437 816,595 25.28% NEWPORT 53,683 53,683 220,935 24.30% NOOKSACK (744) 771 27 48,709 0.05% NORMANDY PARK 226,551 (1,206) 225,345 361,443 62.35% NORTH BEND (30,599) (893) (31,492) 1,258,910 -2.50% NORTH BONNEVILLE 195 195 15,561 1.25% NORTHPORT (20) (68) (88) 13,803 -0.64% OAK HARBOR 99,374 4,587 103,960 2,387,051 4.36% OAKESDALE (1,732) (56) (1,788) 17,434 -10.26% OAKVILLE (577) (567) (1,144) 33,489 -3.42% OCEAN SHORES 22,982 (3,324) 19,658 544,141 3.61% ODESSA 10,413 1,295 11,708 82,891 14.12% OKANOGAN CITY (383) (414) (797) 322,791 -0.25% OLYMPIA (989,088) (7,693) (996,780) 13,055,395 -7.64% OMAK (127,741) (799) (128,540) 909,818 -14.13% OROVILLE 2,331 (281) 2,051 170,335 1.20% ORTING 31,361 920 32,281 319,467 10.10% OTHELLO 31,607 2,544 34,151 813,691 4.20% PACIFIC/KING 88,268 (1,019) 87,249 366,924 23.78% PACIFIC/PIERCE (74,337) 33 (74,304) 202,127 -36.76% PALOUSE (248) (134) (382) 41,730 -0.92% PASCO (159,144) (4,833) (163,977) 5,608,512 -2.92% PATEROS (593) (108) (701) 35,212 -1.99% PE ELL 135 (46) 89 37,445 0.24% POMEROY 1,432 1,432 97,773 1.46% PORT ANGELES 59,970 5,956 65,926 2,365,927 2.79% PORT ORCHARD 100,898 3,103 104,001 2,110,665 4.93% PORT TOWNSEND 47,986 5,306 53,291 1,250,031 4.26% POULSBO (84,384) 2,751 (81,633) 2,076,355 -3.93% PRESCOTT 76 (59) 17 23,745 0.07% PROSSER (26,576) (2,555) (29,131) 649,986 -4.48% PULLMAN (60,327) (3,313) (63,640) 2,063,063 -3.08% PUYALLUP (1,117,345) 7,915 (1,109,430) 12,231,735 -9.07% QUINCY 2,733 (1,039) 1,695 512,808 0.33%

Department of Revenue SSTA Sourcing Study
A-7
RAINIER 2,632 (269) 2,363 86,263 2.74% RAYMOND 29,411 29,411 234,496 12.54% REARDAN 1,803 824 2,627 28,109 9.35% REDMOND (563,648) (8,684) (572,332) 14,228,175 -4.02% RENTON (894,074) (10,155) (904,229) 15,059,531 -6.00% REPUBLIC 2,344 506 2,849 102,543 2.78% RICHLAND (108,993) (20,913) (129,906) 5,335,881 -2.43% RIDGEFIELD (15,787) 349 (15,437) 248,076 -6.22% RITZVILLE 5,079 743 5,822 218,470 2.66% RIVERSIDE 43 (55) (11) 13,591 -0.08% ROCK ISLAND 251 168 419 32,467 1.29% ROCKFORD 233 (106) 127 42,149 0.30% ROSALIA (10,467) (86) (10,552) 30,995 -34.05% ROSLYN 424 175 600 53,380 1.12% ROY (445) 196 (249) 113,899 -0.22% ROYAL CITY (515) (364) (879) 115,082 -0.76% RUSTON 25,512 168 25,679 28,645 89.65% SAMMAMISH 615,095 (6,537) 608,558 2,403,501 25.32% SEATAC 1,008,994 (4,776) 1,004,219 7,825,499 12.83% SEATTLE (2,260,508) (107,663) (2,368,171) 116,643,607 -2.03% SEDRO WOOLLEY (40,139) 1,667 (38,472) 1,062,966 -3.62% SELAH 19,028 (1,323) 17,705 555,067 3.19% SEQUIM 93,988 1,412 95,400 1,118,246 8.53% SHELTON 124,006 3,668 127,674 1,499,430 8.51% SHORELINE 141,671 (10,044) 131,627 5,803,782 2.27% SKYKOMISH 278 (41) 237 34,798 0.68% SNOHOMISH CITY (26,404) 2,810 (23,593) 1,717,877 -1.37% SNOQUALMIE 3,977 (794) 3,183 835,526 0.38% SOAP LAKE 1,770 (348) 1,423 65,101 2.19% SOUTH BEND 14,191 14,191 96,089 14.77% SOUTH CLE ELUM 73 95 168 13,665 1.23% SOUTH PRAIRIE 1,274 100 1,374 25,288 5.43% SPANGLE (155) (55) (210) 39,648 -0.53% SPOKANE CITY (1,050,554) (39,384) (1,089,938) 28,317,033 -3.85% SPOKANE VALLEY 106,113 (16,361) 89,752 11,194,853 0.80% SPRAGUE 746 668 1,414 26,727 5.29% SPRINGDALE (89) (71) (160) 22,925 -0.70% ST. JOHN (1,194) (66) (1,260) 54,976 -2.29% STANWOOD 15,668 1,339 17,007 795,746 2.14% STARBUCK 314 314 2,302 13.65% STEILACOOM 64,858 1,381 66,240 220,388 30.06% STEVENSON (33) (33) 165,100 -0.02% SULTAN 13,299 1,281 14,581 267,421 5.45% SUMAS 1,658 844 2,502 91,854 2.72%
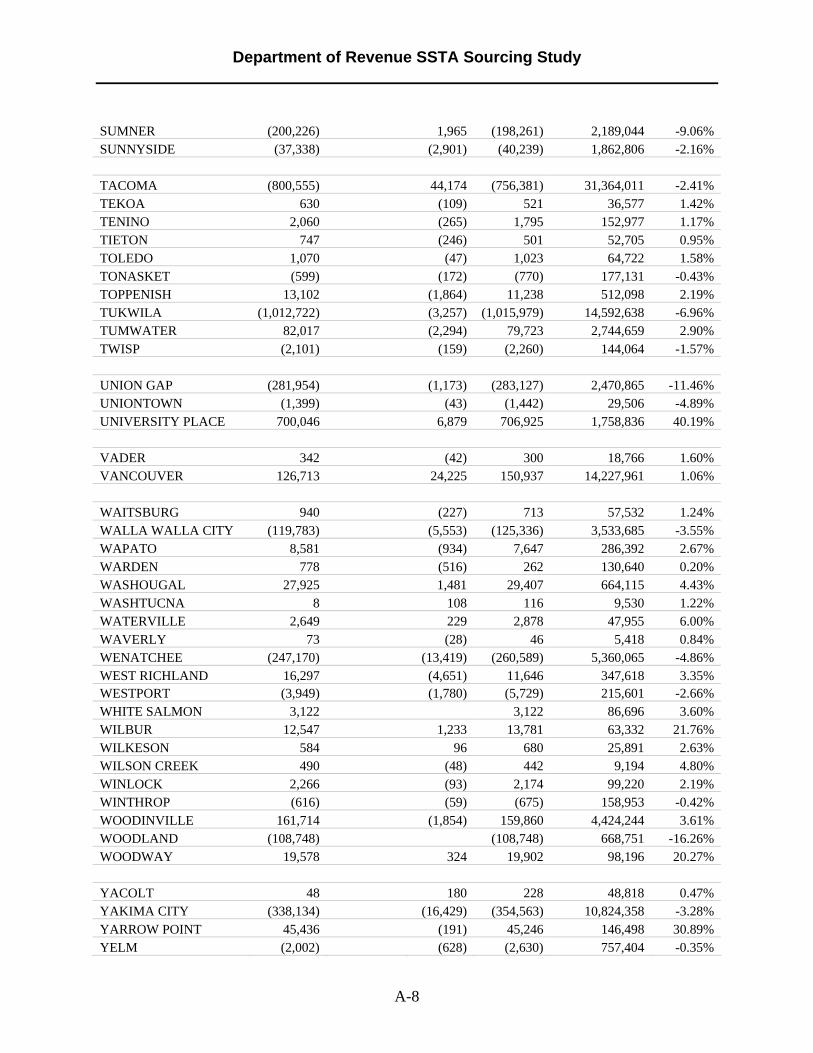
Department of Revenue SSTA Sourcing Study
A-8
SUMNER (200,226) 1,965 (198,261) 2,189,044 -9.06% SUNNYSIDE (37,338) (2,901) (40,239) 1,862,806 -2.16% TACOMA (800,555) 44,174 (756,381) 31,364,011 -2.41% TEKOA 630 (109) 521 36,577 1.42% TENINO 2,060 (265) 1,795 152,977 1.17% TIETON 747 (246) 501 52,705 0.95% TOLEDO 1,070 (47) 1,023 64,722 1.58% TONASKET (599) (172) (770) 177,131 -0.43% TOPPENISH 13,102 (1,864) 11,238 512,098 2.19% TUKWILA (1,012,722) (3,257) (1,015,979) 14,592,638 -6.96% TUMWATER 82,017 (2,294) 79,723 2,744,659 2.90% TWISP (2,101) (159) (2,260) 144,064 -1.57% UNION GAP (281,954) (1,173) (283,127) 2,470,865 -11.46% UNIONTOWN (1,399) (43) (1,442) 29,506 -4.89% UNIVERSITY PLACE 700,046 6,879 706,925 1,758,836 40.19% VADER 342 (42) 300 18,766 1.60% VANCOUVER 126,713 24,225 150,937 14,227,961 1.06% WAITSBURG 940 (227) 713 57,532 1.24% WALLA WALLA CITY (119,783) (5,553) (125,336) 3,533,685 -3.55% WAPATO 8,581 (934) 7,647 286,392 2.67% WARDEN 778 (516) 262 130,640 0.20% WASHOUGAL 27,925 1,481 29,407 664,115 4.43% WASHTUCNA 8 108 116 9,530 1.22% WATERVILLE 2,649 229 2,878 47,955 6.00% WAVERLY 73 (28) 46 5,418 0.84% WENATCHEE (247,170) (13,419) (260,589) 5,360,065 -4.86% WEST RICHLAND 16,297 (4,651) 11,646 347,618 3.35% WESTPORT (3,949) (1,780) (5,729) 215,601 -2.66% WHITE SALMON 3,122 3,122 86,696 3.60% WILBUR 12,547 1,233 13,781 63,332 21.76% WILKESON 584 96 680 25,891 2.63% WILSON CREEK 490 (48) 442 9,194 4.80% WINLOCK 2,266 (93) 2,174 99,220 2.19% WINTHROP (616) (59) (675) 158,953 -0.42% WOODINVILLE 161,714 (1,854) 159,860 4,424,244 3.61% WOODLAND (108,748) (108,748) 668,751 -16.26% WOODWAY 19,578 324 19,902 98,196 20.27% YACOLT 48 180 228 48,818 0.47% YAKIMA CITY (338,134) (16,429) (354,563) 10,824,358 -3.28% YARROW POINT 45,436 (191) 45,246 146,498 30.89% YELM (2,002) (628) (2,630) 757,404 -0.35%

Department of Revenue SSTA Sourcing Study
A-9
ZILLAH 8,500 (509) 7,992 180,851 4.42%
BASIC AND OPTIONAL LOCAL TAX Calendar Year 2002 – Changes from Sourcing
Clark, Klickitat, and Skamania Counties have a total regular local tax rate of less that 0.01. The 15 percent county allocation from each city is at the county rate, not the higher city tax rate. One percent administration fee deducted prior to calculating the 15 percent county allocation. The following numbers are estimates. As with all estimates, there is a margin of error. For some very small cities and counties, the margin of error may be large enough to produce inconsistent results.
Location Code Location
Total Regular Local Tax Rate
Regular Local Tax with 15% Adjustment on
CY02 TRS
Regular Local Tax with 15% Adjustment on Gain or Loss
Gain/Loss as a Percent of CY02
Regular Local Tax
100 ADAMS COUNTY 0.01 412,036 43,487 10.55% 101 HATTON 0.01 2,352 362 15.39% 102 LIND 0.01 42,454 (1,082) -2.55% 103 OTHELLO 0.01 767,681 31,607 4.12% 104 RITZVILLE 0.01 205,029 5,079 2.48% 105 WASHTUCNA 0.01 7,583 8 0.11%
200 ASOTIN COUNTY 0.005 199,229 (127) -0.06% 201 ASOTIN CITY 0.005 23,175 31 0.13% 202 CLARKSTON 0.005 467,785 (55,953) -11.96%
300 BENTON COUNTY 0.01 3,432,045 41,479 1.21% 301 BENTON CITY 0.01 136,543 741 0.54% 302 KENNEWICK 0.01 9,698,951 (777,171) -8.01% 303 PROSSER 0.01 593,230 (26,576) -4.48% 304 RICHLAND 0.01 4,871,307 (108,993) -2.24% 305 WEST RICHLAND 0.01 244,290 16,297 6.67%
400 CHELAN COUNTY 0.01 3,853,810 (149,606) -3.88% 401 CASHMERE 0.01 176,951 9,267 5.24% 402 CHELAN CITY 0.01 580,056 22,271 3.84% 403 ENTIAT 0.01 32,513 (2,378) -7.31% 404 LEAVENWORTH 0.01 651,423 11,095 1.70%

Department of Revenue SSTA Sourcing Study
A-10
405 WENATCHEE 0.01 4,973,590 (247,170) -4.97%
500 CLALLAM COUNTY 0.01 3,450,075 58,260 1.69% 501 FORKS 0.01 250,139 20,824 8.32% 502 PORT ANGELES 0.01 2,187,938 59,970 2.74% 503 SEQUIM 0.01 1,076,042 93,988 8.73%
600 CLARK COUNTY 0.008 12,444,043 289,802 2.33% 601 BATTLE GROUND 0.01 903,850 76,834 8.50% 602 CAMAS 0.008 928,980 44,244 4.76% 603 LA CENTER 0.01 87,223 3,212 3.68% 604 RIDGEFIELD 0.01 229,720 (15,787) -6.87% 605 VANCOUVER 0.008 12,954,609 126,713 0.98% 606 WASHOUGAL 0.01 586,242 27,925 4.76% 607 YACOLT 0.008 39,362 48 0.12%
700 COLUMBIA COUNTY 0.01 76,750 6,498 8.47% 701 DAYTON 0.01 163,173 2,553 1.56% 702 STARBUCK 0.01 2,302 314 13.65%
800 COWLITZ COUNTY 0.01 2,714,043 275,848 10.16% 801 CASTLE ROCK 0.01 217,824 29,438 13.51% 802 KALAMA 0.01 178,127 9,882 5.55% 803 KELSO 0.01 1,720,211 253,229 14.72% 804 LONGVIEW 0.01 5,729,162 (230,973) -4.03% 805 WOODLAND 0.01 668,751 (108,748) -16.26%
900 DOUGLAS COUNTY 0.01 1,410,125 159,497 11.31% 901 BRIDGEPORT 0.01 28,900 2,406 8.33% 902 EAST WENATCHEE 0.01 1,531,809 (93,525) -6.11% 903 MANSFIELD 0.01 11,134 354 3.18% 904 ROCK ISLAND 0.01 25,345 251 0.99% 905 WATERVILLE 0.01 38,225 2,649 6.93%
1000 FERRY COUNTY 0.01 184,447 39,735 21.54% 1001 REPUBLIC 0.01 99,134 2,344 2.36%
1100 FRANKLIN COUNTY 0.01 1,422,885 92,410 6.49% 1101 CONNELL 0.01 118,612 6,219 5.24% 1102 KAHLOTUS 0.01 3,755 233 6.20% 1103 MESA 0.01 32,940 (19,274) -58.51% 1104 PASCO 0.01 5,196,895 (159,144) -3.06%
1200 GARFIELD COUNTY 0.01 37,883 19,788 52.23% 1201 POMEROY 0.01 97,773 1,432 1.46%

Department of Revenue SSTA Sourcing Study
A-11
1300 GRANT COUNTY 0.01 2,114,728 68,756 3.25% 1301 COULEE CITY 0.01 43,914 612 1.39% 1302 ELECTRIC CITY 0.01 18,514 291 1.57% 1303 EPHRATA 0.01 879,030 (60,896) -6.93% 1304 GEORGE 0.01 35,759 299 0.84% 1305 GRAND COULEE 0.01 158,380 (15,285) -9.65% 1306 HARTLINE 0.01 3,553 95 2.68% 1307 KRUPP 0.01 923 (13) -1.42% 1308 MATTAWA 0.01 111,842 (1,406) -1.26% 1309 MOSES LAKE 0.01 3,095,410 (169,236) -5.47% 1310 QUINCY 0.01 469,226 2,733 0.58% 1311 ROYAL CITY 0.01 99,819 (515) -0.52% 1312 SOAP LAKE 0.01 50,517 1,770 3.50% 1313 WARDEN 0.01 108,976 778 0.71% 1315 WILSON CREEK 0.01 7,159 490 6.85%
1400 GRAYS HARBOR COUNTY 0.01 2,985,086 (389,529) -13.05%
1401 ABERDEEN 0.01 2,922,134 (99,915) -3.42% 1402 COSMOPOLIS 0.01 96,248 5,933 6.16% 1403 ELMA 0.01 362,853 (5,615) -1.55% 1404 HOQUIAM 0.01 505,068 (211,343) -41.84% 1405 MCCLEARY 0.01 90,612 5,276 5.82% 1406 MONTESANO 0.01 326,888 23,079 7.06% 1407 OAKVILLE 0.01 26,426 (577) -2.18% 1408 WESTPORT 0.01 193,412 (3,949) -2.04% 1409 OCEAN SHORES 0.01 502,713 22,982 4.57%
1500 ISLAND COUNTY 0.01 3,126,367 71,822 2.30% 1501 COUPEVILLE 0.01 242,264 13,494 5.57% 1502 LANGLEY 0.01 225,762 2,705 1.20% 1503 OAK HARBOR 0.01 2,244,147 99,374 4.43%
1600 JEFFERSON COUNTY 0.01 1,508,343 137,485 9.11% 1601 PORT TOWNSEND 0.01 1,173,317 47,986 4.09%
1700 KING COUNTY 0.01 62,804,778 643,289 1.02% 1701 ALGONA 0.01 188,040 43,882 23.34% 1702 AUBURN 0.01 11,885,703 (1,237,424) -10.41% 1703 BEAUX ARTS VILLAGE 0.01 23,015 16,965 73.71% 1704 BELLEVUE 0.01 34,286,922 (1,420,137) -4.14% 1705 BLACK DIAMOND 0.01 177,123 (372) -0.21% 1706 BOTHELL 0.01 7,059,512 (421,423) -5.97% 1707 CARNATION 0.01 224,180 (5,172) -2.31% 1708 CLYDE HILL 0.01 124,522 128,231 102.98% 1709 DES MOINES 0.01 1,314,106 739,852 56.30%
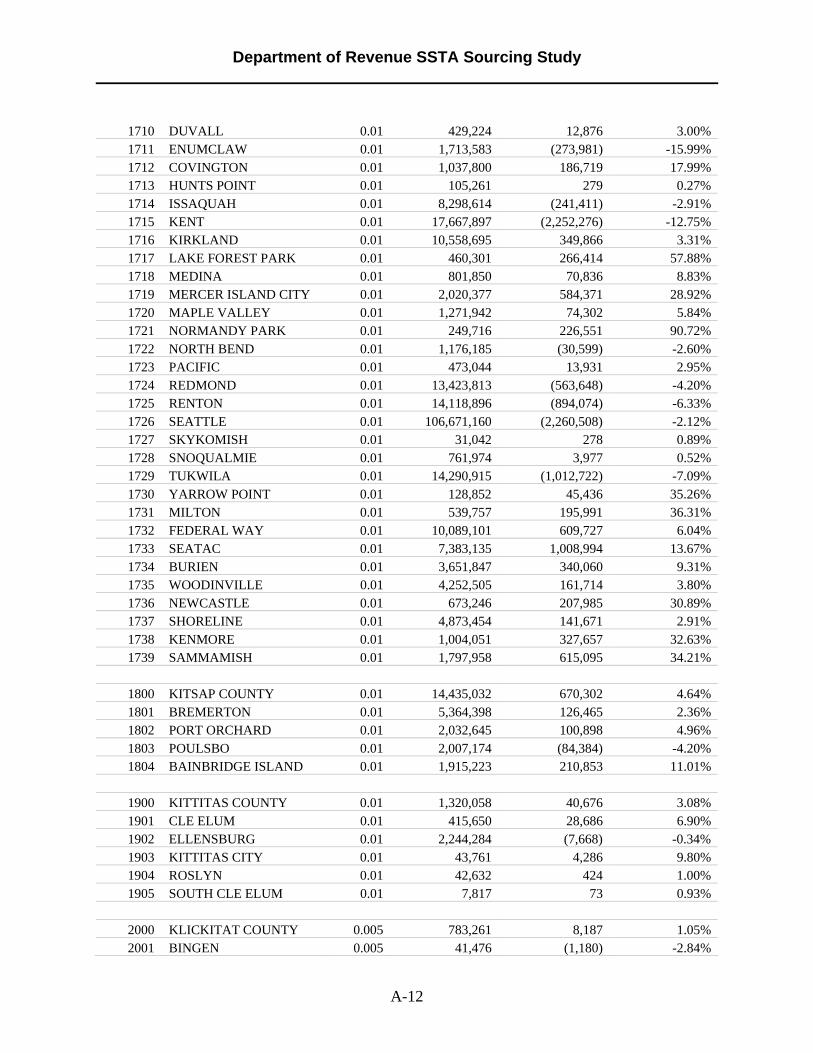
Department of Revenue SSTA Sourcing Study
A-12
1710 DUVALL 0.01 429,224 12,876 3.00% 1711 ENUMCLAW 0.01 1,713,583 (273,981) -15.99% 1712 COVINGTON 0.01 1,037,800 186,719 17.99% 1713 HUNTS POINT 0.01 105,261 279 0.27% 1714 ISSAQUAH 0.01 8,298,614 (241,411) -2.91% 1715 KENT 0.01 17,667,897 (2,252,276) -12.75% 1716 KIRKLAND 0.01 10,558,695 349,866 3.31% 1717 LAKE FOREST PARK 0.01 460,301 266,414 57.88% 1718 MEDINA 0.01 801,850 70,836 8.83% 1719 MERCER ISLAND CITY 0.01 2,020,377 584,371 28.92% 1720 MAPLE VALLEY 0.01 1,271,942 74,302 5.84% 1721 NORMANDY PARK 0.01 249,716 226,551 90.72% 1722 NORTH BEND 0.01 1,176,185 (30,599) -2.60% 1723 PACIFIC 0.01 473,044 13,931 2.95% 1724 REDMOND 0.01 13,423,813 (563,648) -4.20% 1725 RENTON 0.01 14,118,896 (894,074) -6.33% 1726 SEATTLE 0.01 106,671,160 (2,260,508) -2.12% 1727 SKYKOMISH 0.01 31,042 278 0.89% 1728 SNOQUALMIE 0.01 761,974 3,977 0.52% 1729 TUKWILA 0.01 14,290,915 (1,012,722) -7.09% 1730 YARROW POINT 0.01 128,852 45,436 35.26% 1731 MILTON 0.01 539,757 195,991 36.31% 1732 FEDERAL WAY 0.01 10,089,101 609,727 6.04% 1733 SEATAC 0.01 7,383,135 1,008,994 13.67% 1734 BURIEN 0.01 3,651,847 340,060 9.31% 1735 WOODINVILLE 0.01 4,252,505 161,714 3.80% 1736 NEWCASTLE 0.01 673,246 207,985 30.89% 1737 SHORELINE 0.01 4,873,454 141,671 2.91% 1738 KENMORE 0.01 1,004,051 327,657 32.63% 1739 SAMMAMISH 0.01 1,797,958 615,095 34.21%
1800 KITSAP COUNTY 0.01 14,435,032 670,302 4.64% 1801 BREMERTON 0.01 5,364,398 126,465 2.36% 1802 PORT ORCHARD 0.01 2,032,645 100,898 4.96% 1803 POULSBO 0.01 2,007,174 (84,384) -4.20% 1804 BAINBRIDGE ISLAND 0.01 1,915,223 210,853 11.01%
1900 KITTITAS COUNTY 0.01 1,320,058 40,676 3.08% 1901 CLE ELUM 0.01 415,650 28,686 6.90% 1902 ELLENSBURG 0.01 2,244,284 (7,668) -0.34% 1903 KITTITAS CITY 0.01 43,761 4,286 9.80% 1904 ROSLYN 0.01 42,632 424 1.00% 1905 SOUTH CLE ELUM 0.01 7,817 73 0.93%
2000 KLICKITAT COUNTY 0.005 783,261 8,187 1.05% 2001 BINGEN 0.005 41,476 (1,180) -2.84%

Department of Revenue SSTA Sourcing Study
A-13
2002 GOLDENDALE 0.01 252,678 (6,650) -2.63% 2003 WHITE SALMON 0.01 86,696 3,122 3.60%
2100 LEWIS COUNTY 0.01 5,397,609 (271,254) -5.03% 2101 CENTRALIA 0.01 1,951,736 303,942 15.57% 2102 CHEHALIS 0.01 2,449,962 (93,460) -3.81% 2103 MORTON 0.01 199,735 529 0.26% 2104 MOSSYROCK 0.01 42,377 1,886 4.45% 2105 NAPAVINE 0.01 124,873 495 0.40% 2106 PE ELL 0.01 28,693 135 0.47% 2107 TOLEDO 0.01 55,639 1,070 1.92% 2108 VADER 0.01 10,744 342 3.18% 2109 WINLOCK 0.01 81,518 2,266 2.78%
2200 LINCOLN COUNTY 0.01 208,046 68,178 32.77% 2201 ALMIRA 0.01 14,906 2,714 18.21% 2202 CRESTON 0.01 8,894 2,798 31.45% 2203 DAVENPORT 0.01 173,358 53,602 30.92% 2204 HARRINGTON 0.01 18,778 1,636 8.71% 2205 ODESSA 0.01 77,784 10,413 13.39% 2206 REARDAN 0.01 24,857 1,803 7.25% 2207 SPRAGUE 0.01 24,093 746 3.10% 2208 WILBUR 0.01 58,467 12,547 21.46% 2210 CRESTON-GEN-ST 0 - - 0.00%
2300 MASON COUNTY 0.01 2,186,375 114,921 5.26% 2301 SHELTON 0.01 1,443,700 124,006 8.59%
2400 OKANOGAN COUNTY 0.01 1,051,324 48,556 4.62% 2401 BREWSTER 0.01 162,090 2,432 1.50% 2402 CONCONULLY 0.01 9,063 41 0.45% 2403 COULEE DAM 0.01 45,147 579 1.28% 2404 ELMER CITY 0.01 2,503 27 1.09% 2405 NESPELEM 0.01 5,849 3,494 59.74% 2406 OKANOGAN CITY 0.01 305,458 (383) -0.13% 2407 OMAK 0.01 876,353 (127,741) -14.58% 2408 OROVILLE 0.01 158,579 2,331 1.47% 2409 PATEROS 0.01 30,693 (593) -1.93% 2410 RIVERSIDE 0.01 11,296 43 0.38% 2411 TONASKET 0.01 169,930 (599) -0.35% 2412 TWISP 0.01 137,392 (2,101) -1.53% 2413 WINTHROP 0.01 156,482 (616) -0.39%
2500 PACIFIC COUNTY 0.01 704,706 168,451 23.90% 2501 ILWACO 0.01 99,742 5,754 5.77% 2502 LONG BEACH 0.01 277,751 36,872 13.28%

Department of Revenue SSTA Sourcing Study
A-14
2503 RAYMOND 0.01 234,496 29,411 12.54% 2504 SOUTH BEND 0.01 96,089 14,191 14.77%
2600 PEND OREILLE COUNTY 0.01 221,375 110,275 49.81% 2601 CUSICK 0.01 11,658 3,783 32.45% 2602 IONE 0.01 25,555 2,788 10.91% 2603 METALINE 0.01 8,637 786 9.10% 2604 METALINE FALLS 0.01 22,806 1,797 7.88% 2605 NEWPORT 0.01 220,935 53,683 24.30%
2700 PIERCE COUNTY 0.01 24,995,927 3,152,227 12.61% 2701 BONNEY LAKE 0.01 1,406,559 76,262 5.42% 2702 BUCKLEY 0.01 354,586 22,749 6.42% 2703 CARBONADO 0.01 8,986 514 5.72% 2704 DU PONT 0.01 332,575 24,543 7.38% 2705 EATONVILLE 0.01 281,860 (3,026) -1.07% 2706 FIFE 0.01 4,903,093 (1,063,602) -21.69% 2707 FIRCREST 0.01 172,023 104,345 60.66% 2708 GIG HARBOR 0.01 3,289,823 (85,360) -2.59% 2710 ORTING 0.01 275,314 31,361 11.39% 2711 PUYALLUP 0.01 11,851,973 (1,117,345) -9.43% 2712 ROY 0.01 104,492 (445) -0.43% 2713 RUSTON 0.01 20,597 25,512 123.86% 2714 SOUTH PRAIRIE 0.01 20,503 1,274 6.22% 2715 STEILACOOM 0.01 154,103 64,858 42.09% 2716 SUMNER 0.01 2,094,756 (200,226) -9.56% 2717 TACOMA 0.01 29,244,434 (800,555) -2.74% 2718 WILKESON 0.01 21,269 584 2.74% 2719 UNIVERSITY PLACE 0.01 1,428,773 700,046 49.00% 2720 EDGEWOOD 0.01 330,552 273,448 82.72% 2721 LAKEWOOD 0.01 5,383,510 556,274 10.33%
2800 SAN JUAN COUNTY 0.01 2,123,152 86,339 4.07% 2801 FRIDAY HARBOR 0.01 650,288 29,549 4.54%
2900 SKAGIT COUNTY 0.01 4,929,478 620,755 12.59% 2901 ANACORTES 0.01 2,294,508 (203,888) -8.89% 2902 BURLINGTON 0.01 5,141,988 (682,727) -13.28% 2903 CONCRETE 0.01 53,974 5,766 10.68% 2904 HAMILTON 0.01 7,609 1,170 15.37% 2905 LA CONNER 0.01 322,390 9,978 3.09% 2906 LYMAN 0.01 23,269 1,039 4.47% 2907 MOUNT VERNON 0.01 3,956,767 509,144 12.87% 2908 SEDRO WOOLLEY 0.01 929,812 (40,139) -4.32%
3000 SKAMANIA COUNTY 0.005 130,263 6,008 4.61%

Department of Revenue SSTA Sourcing Study
A-15
3001 NORTH BONNEVILLE 0.01 15,561 195 1.25% 3002 STEVENSON 0.005 165,100 (33) -0.02%
3100 SNOHOMISH COUNTY 0.01 23,846,316 3,079,692 12.91% 3101 ARLINGTON 0.01 2,811,936 181,377 6.45% 3102 BRIER 0.01 95,707 95,474 99.76% 3103 DARRINGTON 0.01 97,670 (1,138) -1.17% 3104 EDMONDS 0.01 3,918,071 554,167 14.14% 3105 EVERETT 0.01 17,307,313 (1,664,614) -9.62% 3106 GOLD BAR 0.01 72,688 9,603 13.21% 3107 GRANITE FALLS 0.01 312,541 (53,174) -17.01% 3108 INDEX 0.01 9,827 1,088 11.08% 3109 LAKE STEVENS 0.01 467,886 78,011 16.67% 3110 LYNNWOOD 0.01 14,123,490 (1,272,798) -9.01% 3111 MARYSVILLE 0.01 3,332,787 320,531 9.62% 3112 MONROE 0.01 2,538,251 (183,300) -7.22% 3113 MOUNTLAKE TERRACE 0.01 1,088,435 395,852 36.37% 3114 MUKILTEO 0.01 1,358,867 369,497 27.19% 3115 SNOHOMISH CITY 0.01 1,622,215 (26,404) -1.63% 3116 STANWOOD 0.01 750,174 15,668 2.09% 3117 SULTAN 0.01 223,801 13,299 5.94% 3118 WOODWAY 0.01 87,151 19,578 22.46% 3119 MILL CREEK 0.01 1,096,429 295,162 26.92%
3200 SPOKANE COUNTY 0.01 16,260,020 (57,897) -0.36% 3201 AIRWAY HEIGHTS 0.01 364,031 (7,062) -1.94% 3202 CHENEY 0.01 568,541 23,786 4.18% 3203 DEER PARK 0.01 438,474 (7,834) -1.79% 3204 FAIRFIELD 0.01 29,877 (1,556) -5.21% 3205 LATAH 0.01 9,492 (310) -3.27% 3206 MEDICAL LAKE 0.01 171,176 10,681 6.24% 3207 MILLWOOD 0.01 194,096 19,749 10.17% 3208 ROCKFORD 0.01 35,975 233 0.65% 3209 SPANGLE 0.01 36,462 (155) -0.42% 3210 SPOKANE CITY 0.01 26,030,396 (1,050,554) -4.04% 3211 WAVERLY 0.01 3,819 73 1.92% 3212 LIBERTY LAKE 0.01 712,985 15,861 2.22% 3213 SPOKANE VALLEY 0.01 10,244,925 106,113 1.04%
3300 STEVENS COUNTY 0.01 988,388 25,913 2.62% 3301 CHEWELAH 0.01 207,842 (27,798) -13.37% 3302 COLVILLE 0.01 1,129,529 (111,619) -9.88% 3303 KETTLE FALLS 0.01 106,385 1,865 1.75% 3304 MARCUS 0.01 997 9 0.85% 3305 NORTHPORT 0.01 12,302 (20) -0.16% 3306 SPRINGDALE 0.01 21,358 (89) -0.42%
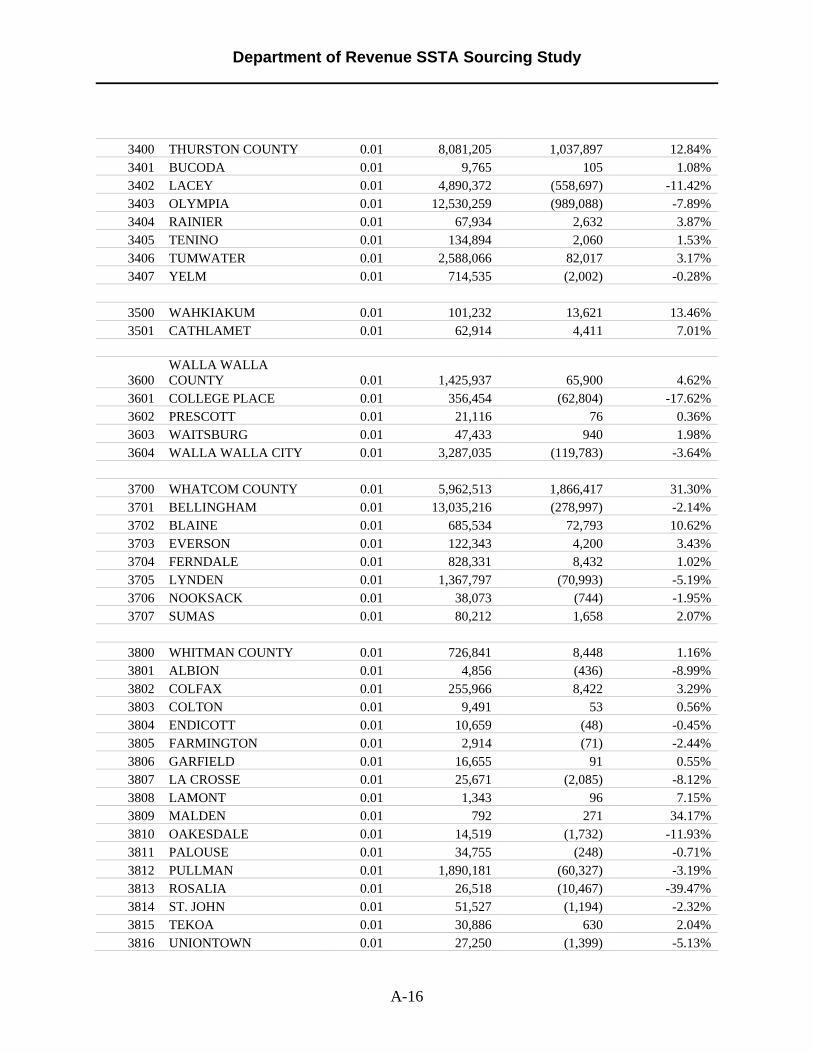
Department of Revenue SSTA Sourcing Study
A-16
3400 THURSTON COUNTY 0.01 8,081,205 1,037,897 12.84% 3401 BUCODA 0.01 9,765 105 1.08% 3402 LACEY 0.01 4,890,372 (558,697) -11.42% 3403 OLYMPIA 0.01 12,530,259 (989,088) -7.89% 3404 RAINIER 0.01 67,934 2,632 3.87% 3405 TENINO 0.01 134,894 2,060 1.53% 3406 TUMWATER 0.01 2,588,066 82,017 3.17% 3407 YELM 0.01 714,535 (2,002) -0.28%
3500 WAHKIAKUM 0.01 101,232 13,621 13.46% 3501 CATHLAMET 0.01 62,914 4,411 7.01%
3600 WALLA WALLA COUNTY 0.01 1,425,937 65,900 4.62%
3601 COLLEGE PLACE 0.01 356,454 (62,804) -17.62% 3602 PRESCOTT 0.01 21,116 76 0.36% 3603 WAITSBURG 0.01 47,433 940 1.98% 3604 WALLA WALLA CITY 0.01 3,287,035 (119,783) -3.64%
3700 WHATCOM COUNTY 0.01 5,962,513 1,866,417 31.30% 3701 BELLINGHAM 0.01 13,035,216 (278,997) -2.14% 3702 BLAINE 0.01 685,534 72,793 10.62% 3703 EVERSON 0.01 122,343 4,200 3.43% 3704 FERNDALE 0.01 828,331 8,432 1.02% 3705 LYNDEN 0.01 1,367,797 (70,993) -5.19% 3706 NOOKSACK 0.01 38,073 (744) -1.95% 3707 SUMAS 0.01 80,212 1,658 2.07%
3800 WHITMAN COUNTY 0.01 726,841 8,448 1.16% 3801 ALBION 0.01 4,856 (436) -8.99% 3802 COLFAX 0.01 255,966 8,422 3.29% 3803 COLTON 0.01 9,491 53 0.56% 3804 ENDICOTT 0.01 10,659 (48) -0.45% 3805 FARMINGTON 0.01 2,914 (71) -2.44% 3806 GARFIELD 0.01 16,655 91 0.55% 3807 LA CROSSE 0.01 25,671 (2,085) -8.12% 3808 LAMONT 0.01 1,343 96 7.15% 3809 MALDEN 0.01 792 271 34.17% 3810 OAKESDALE 0.01 14,519 (1,732) -11.93% 3811 PALOUSE 0.01 34,755 (248) -0.71% 3812 PULLMAN 0.01 1,890,181 (60,327) -3.19% 3813 ROSALIA 0.01 26,518 (10,467) -39.47% 3814 ST. JOHN 0.01 51,527 (1,194) -2.32% 3815 TEKOA 0.01 30,886 630 2.04% 3816 UNIONTOWN 0.01 27,250 (1,399) -5.13%

Department of Revenue SSTA Sourcing Study
A-17
3900 YAKIMA COUNTY 0.01 5,029,958 114,834 2.28% 3901 GRANDVIEW 0.01 572,445 (35,230) -6.15% 3902 GRANGER 0.01 59,705 3,534 5.92% 3903 HARRAH 0.01 22,129 250 1.13% 3904 MABTON 0.01 36,455 836 2.29% 3905 MOXEE CITY 0.01 53,599 1,778 3.32% 3906 NACHES 0.01 106,461 2,362 2.22% 3907 SELAH 0.01 500,103 19,028 3.80% 3908 SUNNYSIDE 0.01 1,742,265 (37,338) -2.14% 3909 TIETON 0.01 42,480 747 1.76% 3910 TOPPENISH 0.01 434,657 13,102 3.01% 3911 UNION GAP 0.01 2,422,113 (281,954) -11.64% 3912 WAPATO 0.01 247,564 8,581 3.47% 3913 YAKIMA CITY 0.01 10,141,669 (338,134) -3.33% 3914 ZILLAH 0.01 159,712 8,500 5.32%
CRIMINAL JUSTICE LOCAL SALES TAX Calendar Year 2002 – Changes from Sourcing
Tax is levied by the county and is imposed countywide, but the receipts are shared with the cities. The Department’s 1 percent administration fee is deducted in the calculation. Of the remaining tax, 10 percent is distributed to the county, and 90 percent is distributed to the county and all cities within the county on a per capita basis.
Location Code Location
2002 Population
(except Spokane County is 2003 Pop)
Criminal Justice
Tax Rate
Total Allocation of
Criminal Justice Tax on
CY02 TRS
Total Allocation of Criminal
Justice Tax Gain or Loss
Gain/Loss as a Percent
of CY02 Regular
Local Tax 100 ADAMS COUNTY 8045 0.001 77,056 4,260 5.53% 101 HATTON 105 0.001 818 45 5.53% 102 LIND 570 0.001 4,441 246 5.53% 103 OTHELLO 5905 0.001 46,010 2,544 5.53% 104 RITZVILLE 1725 0.001 13,441 743 5.53% 105 WASHTUCNA 250 0.001 1,948 108 5.53%
Total Criminal Justice Tax 16,600 143,713 7,946
300 BENTON COUNTY 34610 0.001 590,234 (26,569) -4.50% 301 BENTON CITY 2725 0.001 31,531 (1,419) -4.50% 302 KENNEWICK 56280 0.001 651,213 (29,314) -4.50% 303 PROSSER 4905 0.001 56,756 (2,555) -4.50% 304 RICHLAND 40150 0.001 464,574 (20,913) -4.50%

Department of Revenue SSTA Sourcing Study
A-18
305 WEST RICHLAND 8930 0.001 103,329 (4,651) -4.50% Total Criminal Justice Tax 147,600 1,897,637 (85,422)
400 CHELAN COUNTY 29665 0.001 508,230 (17,646) -3.47% 401 CASHMERE 3045 0.001 41,628 (1,445) -3.47% 402 CHELAN CITY 3535 0.001 48,327 (1,678) -3.47% 403 ENTIAT 990 0.001 13,534 (470) -3.47% 404 LEAVENWORTH 2095 0.001 28,640 (994) -3.47% 405 WENATCHEE 28270 0.001 386,475 (13,419) -3.47%
Total Criminal Justice Tax 67,600 1,026,834 (35,652)
500 CLALLAM COUNTY 38970 0.001 445,998 14,924 3.35% 501 FORKS 3130 0.001 30,228 1,012 3.35% 502 PORT ANGELES 18430 0.001 177,989 5,956 3.35% 503 SEQUIM 4370 0.001 42,204 1,412 3.35%
Total Criminal Justice Tax 64,900 696,419 23,304
600 CLARK COUNTY 175710 0.001 1,849,166 35,179 1.90% 601 BATTLE GROUND 11110 0.001 95,074 1,809 1.90% 602 CAMAS 13540 0.001 115,868 2,204 1.90% 603 LA CENTER 1805 0.001 15,446 294 1.90% 604 RIDGEFIELD 2145 0.001 18,356 349 1.90% 605 VANCOUVER 148800 0.001 1,273,352 24,225 1.90% 606 WASHOUGAL 9100 0.001 77,873 1,481 1.90% 607 YACOLT 1105 0.001 9,456 180 1.90%
WOODLAND 85 0.001 727 14 1.90% Total Criminal Justice Tax 363,400 3,455,319 65,735
900 DOUGLAS COUNTY 20539 0.001 200,537 4,717 2.35% 901 BRIDGEPORT 2065 0.001 17,100 402 2.35% 902 EAST WENATCHEE 7965 0.001 65,958 1,551 2.35% 903 MANSFIELD 320 0.001 2,650 62 2.35% 904 ROCK ISLAND 860 0.001 7,122 168 2.35% 905 WATERVILLE 1175 0.001 9,730 229 2.35%
COULEE DAM 176 0.001 1,457 34 2.35% Total Criminal Justice Tax 33,100 304,554 7,163
1000 FERRY COUNTY 6325 0.001 24,949 3,702 14.84% 1001 REPUBLIC 975 0.001 3,409 506 14.84%
Total Criminal Justice Tax 7,300 28,358 4,208
1100 FRANKLIN COUNTY 12915 0.001 221,260 (2,598) -1.17% 1101 CONNELL 3100 0.001 36,847 (433) -1.17% 1102 KAHLOTUS 215 0.001 2,556 (30) -1.17% 1103 MESA 440 0.001 5,230 (61) -1.17% 1104 PASCO 34630 0.001 411,616 (4,833) -1.17%
Total Criminal Justice Tax 51,300 677,509 (7,956)

Department of Revenue SSTA Sourcing Study
A-19
1300 GRANT COUNTY 36625 0.001 382,522 (9,116) -2.38% 1301 COULEE CITY 590 0.001 5,003 (119) -2.38% 1302 ELECTRIC CITY 950 0.001 8,055 (192) -2.38% 1303 EPHRATA 6865 0.001 58,209 (1,387) -2.38% 1304 GEORGE 540 0.001 4,579 (109) -2.38% 1305 GRAND COULEE 910 0.001 7,716 (184) -2.38% 1306 HARTLINE 130 0.001 1,102 (26) -2.38% 1307 KRUPP 65 0.001 551 (13) -2.38% 1308 MATTAWA 2850 0.001 24,165 (576) -2.38% 1309 MOSES LAKE 15420 0.001 130,747 (3,116) -2.38% 1310 QUINCY 5140 0.001 43,582 (1,039) -2.38% 1311 ROYAL CITY 1800 0.001 15,262 (364) -2.38% 1312 SOAP LAKE 1720 0.001 14,584 (348) -2.38% 1313 WARDEN 2555 0.001 21,664 (516) -2.38% 1315 WILSON CREEK 240 0.001 2,035 (48) -2.38%
COULEE DAM 0 0.001 - - 0.00% Total Criminal Justice Tax 76,400 719,775 (17,153)
1400 GRAYS HARBOR COUNTY 27025 0.001 364,995 (29,286) -8.02%
1401 ABERDEEN 16250 0.001 171,297 (13,744) -8.02% 1402 COSMOPOLIS 1565 0.001 16,497 (1,324) -8.02% 1403 ELMA 3175 0.001 33,469 (2,685) -8.02% 1404 HOQUIAM 8945 0.001 94,293 (7,566) -8.02% 1405 MCCLEARY 1410 0.001 14,863 (1,193) -8.02% 1406 MONTESANO 3325 0.001 35,050 (2,812) -8.02% 1407 OAKVILLE 670 0.001 7,063 (567) -8.02% 1408 WESTPORT 2105 0.001 22,190 (1,780) -8.02% 1409 OCEAN SHORES 3930 0.001 41,428 (3,324) -8.02%
Total Criminal Justice Tax 68,400 801,144 (64,282)
1500 ISLAND COUNTY 50494 0.001 421,354 13,524 3.21% 1501 COUPEVILLE 1730 0.001 12,436 399 3.21% 1502 LANGLEY 996 0.001 7,160 230 3.21% 1503 OAK HARBOR 19880 0.001 142,904 4,587 3.21%
Total Criminal Justice Tax 73,100 583,854 18,739
1600 JEFFERSON COUNTY 18145 0.001 191,451 13,241 6.92%
1601 PORT TOWNSEND 8455 0.001
76,715
5,306 6.92%
Total Criminal Justice Tax
26,600
268,166
18,547
1700 KING COUNTY 351136 0.001 9,578,997 (103,415) -1.08% 1701 ALGONA 2525 0.001 44,114 (476) -1.08% 1702 AUBURN/KING 43970 0.001 768,197 (8,293) -1.08% 1703 BEAUX ARTS VILLAGE 295 0.001 5,154 (56) -1.08%

Department of Revenue SSTA Sourcing Study
A-20
1704 BELLEVUE 117000 0.001 2,044,100 (22,068) -1.08% 1705 BLACK DIAMOND 4015 0.001 70,146 (757) -1.08% 1706 BOTHELL/KING 16264 0.001 284,147 (3,068) -1.08% 1707 CARNATION 1905 0.001 33,282 (359) -1.08% 1708 CLYDE HILL 2895 0.001 50,578 (546) -1.08% 1709 DES MOINES 29510 0.001 515,567 (5,566) -1.08% 1710 DUVALL 5190 0.001 90,674 (979) -1.08% 1711 ENUMCLAW 11195 0.001 195,587 (2,112) -1.08% 1712 COVINGTON 14395 0.001 251,494 (2,715) -1.08% 1713 HUNTS POINT 455 0.001 7,949 (86) -1.08% 1714 ISSAQUAH 13790 0.001 240,924 (2,601) -1.08% 1715 KENT 84275 0.001 1,472,363 (15,896) -1.08% 1716 KIRKLAND 45790 0.001 799,994 (8,637) -1.08% 1717 LAKE FOREST PARK 12860 0.001 224,676 (2,426) -1.08% 1718 MEDINA 3010 0.001 52,588 (568) -1.08% 1719 MERCER ISLAND CITY 21955 0.001 383,574 (4,141) -1.08% 1720 MAPLE VALLEY 15040 0.001 262,763 (2,837) -1.08% 1721 NORMANDY PARK 6395 0.001 111,727 (1,206) -1.08% 1722 NORTH BEND 4735 0.001 82,725 (893) -1.08% 1723 PACIFIC/KING 5405 0.001 94,430 (1,019) -1.08% 1724 REDMOND 46040 0.001 804,362 (8,684) -1.08% 1725 RENTON 53840 0.001 940,635 (10,155) -1.08% 1726 SEATTLE 570802 0.001 9,972,446 (107,663) -1.08% 1727 SKYKOMISH 215 0.001 3,756 (41) -1.08% 1728 SNOQUALMIE 4210 0.001 73,553 (794) -1.08% 1729 TUKWILA 17270 0.001 301,723 (3,257) -1.08% 1730 YARROW POINT 1010 0.001 17,646 (191) -1.08% 1731 MILTON/KING 815 0.001 14,239 (154) 0.00% 1732 FEDERAL WAY 83850 0.001 1,464,938 (15,815) -1.08% 1733 SEATAC 25320 0.001 442,364 (4,776) -1.08% 1734 BURIEN 31810 0.001 555,751 (6,000) -1.08% 1735 WOODINVILLE 9830 0.001 171,739 (1,854) -1.08% 1736 NEWCASTLE 8205 0.001 143,349 (1,548) -1.08% 1737 SHORELINE 53250 0.001 930,327 (10,044) -1.08% 1738 KENMORE 19180 0.001 335,093 (3,618) -1.08% 1739 SAMMAMISH 34660 0.001 605,543 (6,537) -1.08%
Total Criminal Justice Tax 1,774,312 34,443,217 (371,849)
1800 KITSAP COUNTY 161345 0.001 1,850,992 73,605 3.98% 1801 BREMERTON 37530 0.001 370,647 14,739 3.98% 1802 PORT ORCHARD 7900 0.001 78,021 3,103 3.98% 1803 POULSBO 7005 0.001 69,182 2,751 3.98% 1804 BAINBRIDGE ISLAND 20920 0.001 206,606 8,216 3.98%
Total Criminal Justice Tax 234,700 2,575,447 102,413
1900 KITTITAS COUNTY 14520 0.001 193,735 3,161 1.63% 1901 CLE ELUM 1775 0.001 18,703 305 1.63%

Department of Revenue SSTA Sourcing Study
A-21
1902 ELLENSBURG 15830 0.001 166,796 2,722 1.63% 1903 KITTITAS CITY 1100 0.001 11,590 189 1.63% 1904 ROSLYN 1020 0.001 10,747 175 1.63% 1905 SOUTH CLE ELUM 555 0.001 5,848 95 1.63%
Total Criminal Justice Tax 34,800 407,420 6,648
2100 LEWIS COUNTY 41920 0.001 659,293 (3,445) -0.52% 2101 CENTRALIA 15040 0.001 199,432 (1,042) -0.52% 2102 CHEHALIS 7055 0.001 93,550 (489) -0.52% 2103 MORTON 1050 0.001 13,923 (73) -0.52% 2104 MOSSYROCK 490 0.001 6,497 (34) -0.52% 2105 NAPAVINE 1360 0.001 18,034 (94) -0.52% 2106 PE ELL 660 0.001 8,752 (46) -0.52% 2107 TOLEDO 685 0.001 9,083 (47) -0.52% 2108 VADER 605 0.001 8,022 (42) -0.52% 2109 WINLOCK 1335 0.001 17,702 (93) -0.52%
Total Criminal Justice Tax 70,200 1,034,289 (5,405)
2200 LINCOLN COUNTY 4563 0.001 30,619 7,762 25.35% 2201 ALMIRA 295 0.001 1,586 402 25.35% 2202 CRESTON 243 0.001 1,306 331 25.35% 2203 DAVENPORT 1720 0.001 9,245 2,344 25.35% 2204 HARRINGTON 429 0.001 2,306 585 25.35% 2205 ODESSA 950 0.001 5,106 1,295 25.35% 2206 REARDAN 605 0.001 3,252 824 25.35% 2207 SPRAGUE 490 0.001 2,634 668 25.35% 2208 WILBUR 905 0.001 4,865 1,233 25.35%
Total Criminal Justice Tax 10,200 60,918 15,444
2300 MASON COUNTY 41305 0.001 307,277 20,225 6.58% 2301 SHELTON 8495 0.001 55,730 3,668 6.58%
Total Criminal Justice Tax 49,800 363,008 23,893
2400 OKANOGAN COUNTY 23938 0.001 200,228 (4,780) -2.39% 2401 BREWSTER 2200 0.001 15,532 (371) -2.39% 2402 CONCONULLY 193 0.001 1,363 (33) -2.39% 2403 COULEE DAM 854 0.001 6,029 (144) -2.39% 2404 ELMER CITY 265 0.001 1,871 (45) -2.39% 2405 NESPELEM 210 0.001 1,483 (35) -2.39% 2406 OKANOGAN CITY 2455 0.001 17,333 (414) -2.39% 2407 OMAK 4740 0.001 33,465 (799) -2.39% 2408 OROVILLE 1665 0.001 11,755 (281) -2.39% 2409 PATEROS 640 0.001 4,519 (108) -2.39% 2410 RIVERSIDE 325 0.001 2,295 (55) -2.39% 2411 TONASKET 1020 0.001 7,201 (172) -2.39% 2412 TWISP 945 0.001 6,672 (159) -2.39% 2413 WINTHROP 350 0.001 2,471 (59) -2.39%

Department of Revenue SSTA Sourcing Study
A-22
Total Criminal Justice Tax 39,800 312,216 (7,453)
2700 PIERCE COUNTY 329124 0.001 4,455,345 92,853 2.08% 2701 BONNEY LAKE 12360 0.001 134,417 2,801 2.08% 2702 BUCKLEY 4410 0.001 47,960 1,000 2.08% 2703 CARBONADO 647 0.001 7,036 147 2.08% 2704 DU PONT 3295 0.001 35,834 747 2.08% 2705 EATONVILLE 2070 0.001 22,512 469 2.08% 2706 FIFE 4815 0.001 52,364 1,091 2.08% 2707 FIRCREST 5925 0.001 64,436 1,343 2.08% 2708 GIG HARBOR 6540 0.001 71,124 1,482 2.08% 2709 MILTON/PIERCE 5180 0.001 56,334 1,174 2.08% 2710 ORTING 4060 0.001 44,153 920 2.08% 2711 PUYALLUP 34920 0.001 379,762 7,915 2.08% 2712 ROY 865 0.001 9,407 196 2.08% 2713 RUSTON 740 0.001 8,048 168 2.08% 2714 SOUTH PRAIRIE 440 0.001 4,785 100 2.08% 2715 STEILACOOM 6095 0.001 66,284 1,381 2.08% 2716 SUMNER 8670 0.001 94,288 1,965 2.08% 2717 TACOMA 194900 0.001 2,119,577 44,174 2.08% 2718 WILKESON 425 0.001 4,622 96 2.08% 2719 UNIVERSITY PLACE 30350 0.001 330,062 6,879 2.08% 2720 EDGEWOOD 9320 0.001 101,357 2,112 2.08% 2721 LAKEWOOD 58662 0.001 637,961 13,296 2.08% 2723 PACIFIC/PIERCE 145 0.001 1,577 33 0.00% 2724 AUBURN/PIERCE 1040 0.001 11,310 236 0.00%
Total Criminal Justice Tax 724,998 8,760,555 182,576
2800 SAN JUAN COUNTY 12555 0.001 242,382 10,128 4.18% 2801 FRIDAY HARBOR 2045 0.001 34,962 1,461 4.18%
Total Criminal Justice Tax 14,600 277,344 11,589
2900 SKAGIT COUNTY 45205 0.001 860,213 10,770 1.25% 2901 ANACORTES 14910 0.001 225,477 2,823 1.25% 2902 BURLINGTON 7190 0.001 108,731 1,361 1.25% 2903 CONCRETE 790 0.001 11,947 150 1.25% 2904 HAMILTON 340 0.001 5,142 64 1.25% 2905 LA CONNER 775 0.001 11,720 147 1.25% 2906 LYMAN 415 0.001 6,276 79 1.25% 2907 MOUNT VERNON 26670 0.001 403,319 5,049 1.25% 2908 SEDRO WOOLLEY 8805 0.001 133,154 1,667 1.25%
Total Criminal Justice Tax 105,100 1,765,980 22,110
3100 SNOHOMISH COUNTY 300460 0.001 4,130,349 121,344 2.94% 3101 ARLINGTON 13280 0.001 148,151 4,352 2.94% 3102 BRIER 6445 0.001 71,900 2,112 2.94% 3103 DARRINGTON 1335 0.001 14,893 438 2.94%

Department of Revenue SSTA Sourcing Study
A-23
3104 EDMONDS 39460 0.001 440,213 12,933 2.94% 3105 EVERETT 96070 0.001 1,071,751 31,487 2.94% 3106 GOLD BAR 2055 0.001 22,925 674 2.94% 3107 GRANITE FALLS 2760 0.001 30,790 905 2.94% 3108 INDEX 160 0.001 1,785 52 2.94% 3109 LAKE STEVENS 6640 0.001 74,075 2,176 2.94% 3110 LYNNWOOD 33990 0.001 379,190 11,140 2.94% 3111 MARYSVILLE 27580 0.001 307,681 9,039 2.94% 3112 MONROE 14670 0.001 163,658 4,808 2.94%
3113 MOUNTLAKE TERRACE 20470 0.001 228,362 6,709 2.94%
3114 MUKILTEO 18520 0.001 206,608 6,070 2.94% 3115 SNOHOMISH CITY 8575 0.001 95,662 2,810 2.94% 3116 STANWOOD 4085 0.001 45,572 1,339 2.94% 3117 SULTAN 3910 0.001 43,620 1,281 2.94% 3118 WOODWAY 990 0.001 11,044 324 2.94% 3119 MILL CREEK 12055 0.001 134,485 3,951 2.94% 3120 BOTHELL/SNOHOMISH 14490 0.001 161,650 4,749 0.00%
Total Criminal Justice Tax 628,000 7,784,364 228,694
3200 SPOKANE COUNTY 119,844 0.001 1,939,891 (33,411) -1.72% 3201 AIRWAY HEIGHTS 4,590 0.001 53,170 (916) -1.72% 3202 CHENEY 9,470 0.001 109,698 (1,889) -1.72% 3203 DEER PARK 3,055 0.001 35,388 (610) -1.72% 3204 FAIRFIELD 586 0.001 6,788 (117) -1.72% 3205 LATAH 194 0.001 2,247 (39) -1.72% 3206 MEDICAL LAKE 4,215 0.001 48,826 (841) -1.72% 3207 MILLWOOD 1,655 0.001 19,171 (330) -1.72% 3208 ROCKFORD 533 0.001 6,174 (106) -1.72% 3209 SPANGLE 275 0.001 3,186 (55) -1.72% 3210 SPOKANE CITY 197,400 0.001 2,286,637 (39,384) -1.72% 3211 WAVERLY 138 0.001 1,599 (28) -1.72% 3212 LIBERTY LAKE 4,640 0.001 53,749 (926) -1.72% 3213 SPOKANE VALLEY 82,005 0.001 949,927 (16,361) 0.00%
Total Criminal Justice Tax 428,600 5,516,451 (95,012)
3300 STEVENS COUNTY 30978 0.001 194,903 (8,829) -4.53% 3301 CHEWELAH 2220 0.001 12,200 (553) -4.53% 3302 COLVILLE 4970 0.001 27,312 (1,237) -4.53% 3303 KETTLE FALLS 1520 0.001 8,353 (378) -4.53% 3304 MARCUS 154 0.001 846 (38) -4.53% 3305 NORTHPORT 273 0.001 1,500 (68) -4.53% 3306 SPRINGDALE 285 0.001 1,566 (71) -4.53%
Total Criminal Justice Tax 40,400 246,680 (11,174)
3400 THURSTON COUNTY 117935 0.001 1,740,906 (25,503) -1.46% 3401 BUCODA 640 0.001 7,873 (115) -1.46%

Department of Revenue SSTA Sourcing Study
A-24
3402 LACEY 31860 0.001 391,914 (5,741) -1.46% 3403 OLYMPIA 42690 0.001 525,136 (7,693) -1.46% 3404 RAINIER 1490 0.001 18,329 (269) -1.46% 3405 TENINO 1470 0.001 18,083 (265) -1.46% 3406 TUMWATER 12730 0.001 156,594 (2,294) -1.46% 3407 YELM 3485 0.001 42,869 (628) -1.46%
Total Criminal Justice Tax 212,300 2,901,703 (42,508)
3600 WALLA WALLA COUNTY 16290 0.001 187,351 (4,218) -2.25%
3601 COLLEGE PLACE 8035 0.001 67,067 (1,510) -2.25% 3602 PRESCOTT 315 0.001 2,629 (59) -2.25% 3603 WAITSBURG 1210 0.001 10,100 (227) -2.25% 3604 WALLA WALLA CITY 29550 0.001 246,651 (5,553) -2.25%
Total Criminal Justice Tax 55,400 513,797 (11,567)
3700 WHATCOM COUNTY 76718 0.001 1,108,136 80,293 7.25% 3701 BELLINGHAM 69260 0.001 800,714 58,018 7.25% 3702 BLAINE 3975 0.001 45,955 3,330 7.25% 3703 EVERSON 2015 0.001 23,295 1,688 7.25% 3704 FERNDALE 8925 0.001 103,182 7,476 7.25% 3705 LYNDEN 9380 0.001 108,442 7,857 7.25% 3706 NOOKSACK 920 0.001 10,636 771 7.25% 3707 SUMAS 1007 0.001 11,642 844 7.25%
Total Criminal Justice Tax 172,200 2,212,002 160,277
3800 WHITMAN COUNTY 6348 0.001 75,365 (1,444) -1.92% 3801 ALBION 610 0.001 4,234 (81) -1.92% 3802 COLFAX 2820 0.001 19,572 (375) -1.92% 3803 COLTON 385 0.001 2,672 (51) -1.92% 3804 ENDICOTT 350 0.001 2,429 (47) -1.92% 3805 FARMINGTON 150 0.001 1,041 (20) -1.92% 3806 GARFIELD 625 0.001 4,338 (83) -1.92% 3807 LA CROSSE 370 0.001 2,568 (49) -1.92% 3808 LAMONT 105 0.001 729 (14) -1.92% 3809 MALDEN 215 0.001 1,492 (29) -1.92% 3810 OAKESDALE 420 0.001 2,915 (56) -1.92% 3811 PALOUSE 1005 0.001 6,975 (134) -1.92% 3812 PULLMAN 24910 0.001 172,882 (3,313) -1.92% 3813 ROSALIA 645 0.001 4,476 (86) -1.92% 3814 ST. JOHN 497 0.001 3,449 (66) -1.92% 3815 TEKOA 820 0.001 5,691 (109) -1.92% 3816 UNIONTOWN 325 0.001 2,256 (43) -1.92%
Total Criminal Justice Tax 40,600 313,083 (6,000)
3900 YAKIMA COUNTY 87674 0.001 972,211 (23,396) -2.41% 3901 GRANDVIEW 8415 0.001 72,609 (1,747) -2.41%
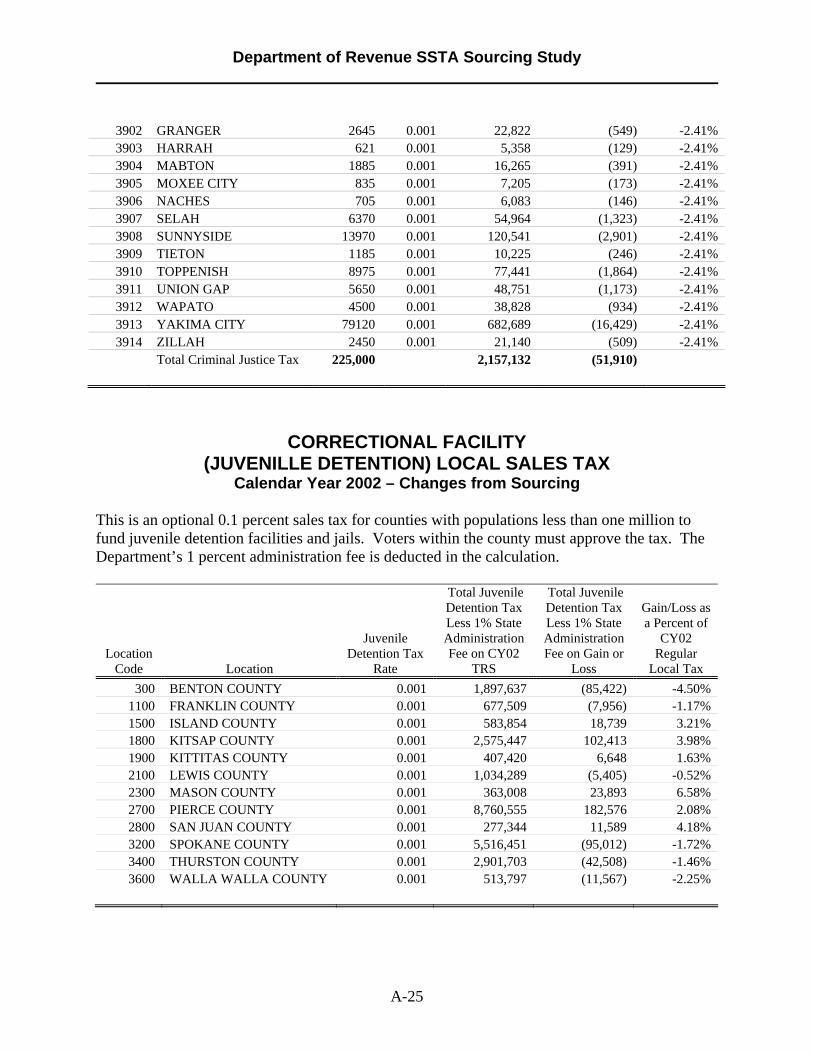
Department of Revenue SSTA Sourcing Study
A-25
3902 GRANGER 2645 0.001 22,822 (549) -2.41% 3903 HARRAH 621 0.001 5,358 (129) -2.41% 3904 MABTON 1885 0.001 16,265 (391) -2.41% 3905 MOXEE CITY 835 0.001 7,205 (173) -2.41% 3906 NACHES 705 0.001 6,083 (146) -2.41% 3907 SELAH 6370 0.001 54,964 (1,323) -2.41% 3908 SUNNYSIDE 13970 0.001 120,541 (2,901) -2.41% 3909 TIETON 1185 0.001 10,225 (246) -2.41% 3910 TOPPENISH 8975 0.001 77,441 (1,864) -2.41% 3911 UNION GAP 5650 0.001 48,751 (1,173) -2.41% 3912 WAPATO 4500 0.001 38,828 (934) -2.41% 3913 YAKIMA CITY 79120 0.001 682,689 (16,429) -2.41% 3914 ZILLAH 2450 0.001 21,140 (509) -2.41%
Total Criminal Justice Tax 225,000 2,157,132 (51,910)
CORRECTIONAL FACILITY (JUVENILLE DETENTION) LOCAL SALES TAX
Calendar Year 2002 – Changes from Sourcing This is an optional 0.1 percent sales tax for counties with populations less than one million to fund juvenile detention facilities and jails. Voters within the county must approve the tax. The Department’s 1 percent administration fee is deducted in the calculation.
Location Code Location
Juvenile Detention Tax
Rate
Total Juvenile Detention Tax Less 1% State Administration Fee on CY02
TRS
Total Juvenile Detention Tax Less 1% State Administration Fee on Gain or
Loss
Gain/Loss as a Percent of
CY02 Regular
Local Tax 300 BENTON COUNTY 0.001 1,897,637 (85,422) -4.50%
1100 FRANKLIN COUNTY 0.001 677,509 (7,956) -1.17% 1500 ISLAND COUNTY 0.001 583,854 18,739 3.21% 1800 KITSAP COUNTY 0.001 2,575,447 102,413 3.98% 1900 KITTITAS COUNTY 0.001 407,420 6,648 1.63% 2100 LEWIS COUNTY 0.001 1,034,289 (5,405) -0.52% 2300 MASON COUNTY 0.001 363,008 23,893 6.58% 2700 PIERCE COUNTY 0.001 8,760,555 182,576 2.08% 2800 SAN JUAN COUNTY 0.001 277,344 11,589 4.18% 3200 SPOKANE COUNTY 0.001 5,516,451 (95,012) -1.72% 3400 THURSTON COUNTY 0.001 2,901,703 (42,508) -1.46% 3600 WALLA WALLA COUNTY 0.001 513,797 (11,567) -2.25%

Department of Revenue SSTA Sourcing Study
A-26
PUBLIC TRANSPORTATION BENEFIT AREAS (TRANSIT) LOCAL SALES TAX Calendar Year 2002 – Changes from Sourcing
The Department’s 1 percent administration fee is deducted in the calculation.
Location Transit
Tax Rate
Transit Tax Less 1% State Administration Fee on CY02 TRS
Transit Tax Less 1% State Administration Fee on Gain or Loss
Gain/Loss as a Percent of CY02
Transit Tax Benton-Franklin PTBA 0.006 14,897,428 (583,012) -3.91% Chelan-Douglas PTBA 0.004 5,267,915 (119,123) -2.26% Clallam County PTBA 0.006 4,178,516 139,825 3.35% Clark County PTBA 0.003 10,365,956 197,205 1.90% Cowlitz County PTBA 0.001 876,397 2,618 0.30% Everett PTBA 0.003 6,108,463 (587,511) -9.62% Grant County PTBA 0.002 1,439,550 (34,305) -2.38% Grays Harbor County 0.006 4,806,864 (385,691) -8.02% Island County PTBA 0.006 3,503,124 112,437 3.21% Jefferson County PTBA 0.006 1,608,996 111,282 6.92% King County 0.008 275,545,736 (2,974,793) -1.08% Kitsap County PTBA 0.008 20,603,577 819,307 3.98% Lewis County PTBA 0.001 517,847 24,763 4.78% Mason County PTBA 0.006 2,178,045 143,356 6.58% Pacific County PTBA 0.003 423,835 76,403 18.03% Pierce County PTBA 0.006 50,687,516 881,655 1.74% Skagit PTBA 0.002 3,326,239 28,698 0.86% Snohomish County PTBA 0.009 48,440,648 3,355,729 6.93% Spokane County PTBA 0.003 15,898,518 (292,130) -1.84% Thurston County PTBA 0.006 14,893,868 (432,015) -2.90% Walla Walla County PTBA 0.003 1,370,040 (41,809) -3.05% Whatcom County PTBA 0.006 13,095,637 962,167 7.35% Yakima (City) 0.003 3,579,413 (119,341) -3.33%
REGIONAL TRANSIT AUTHORITY LOCAL SALES TAX Calendar Year 2002 – Changes from Sourcing
Pursuant to statute, the Department administers this tax at no charge.
Location RTA Rate RTA Tax on CY02
TRS
RTA Tax on Gains or Losses in RTA
Area
Gain/Loss as a Percent of CY02
Regular Local Tax
Snohomish County 0.004 6,360,110 898,599 King Total 0.004 38,029,067 (1,446,665)

Department of Revenue SSTA Sourcing Study
A-27
Pierce County 0.004 9,175,883 719,289 Total RTA 53,565,059 171,223 0.32%
PUBLIC FACILITY DISTRICTS & REGIONAL CENTERS Calendar Year 2002 – Changes from Sourcing
RCW 82.14 provides for an additional 0.2 percent local sales tax to be used for acquisition, construction, and operation of public facilities. The Department’s 1percent administrative fee is deducted in the calculation. This tax has been imposed only in Spokane County to finance the Spokane arena.
PFD
PFD Tax Rate
PFD Tax Less 1% State
Administration Fee on CY02 TRS
PFD Tax Less 1% State
Administration Fee on Gain or Loss
Gain/Loss as a Percent
of CY02 PFD Tax
Spokane Co. (sports & entertainment arena) 0.001 5,516,451 (95,012) -1.72%
RCW 82.14.390 established a new local sales/use tax of up to 0.033 percent to finance regional centers. This tax is not an additional tax for consumers, and does not change the overall retail sales/use tax rate. Receipts are credited against the state 6.5 percent tax.
Regional Center
Regional Centers
Tax Rate
Regional Center Tax on CY02
TRS
Regional Center Tax on Gain or
Loss
Gain/Loss as a Percent of
CY02 Regional
Center Tax
Benton County (Regional Center) 0.00033 37,899 7,320 19.31% Capital Area Regional Center 0.00033 930,876 (14,279) -1.53% Clark County (regional center) 0.00033 516,743 15,700 3.04% Cowlitz County (conf./spc. events center ) 0.00033 374,271 7,623 2.04% Edmonds (regional center) 0.00033 153,650 21,732 14.14% Everett (regional center) 0.00033 678,718 (65,279) -9.62% Grays Harbor County (Convention Center) 0.00033 267,048 (21,427) -8.02% Kennewick (regional center) 0.00033 380,351 (30,477) -8.01% Kitsap County (Conference/Special Event Center) 0.00033 858,482 34,138 3.98% Pasco (Regional Center) 0.00033 203,800 (6,241) -3.06% Prosser (convention/conf./spc. event center) 0.00033 23,264 (1,042) -4.48% Richland (Regional Center) 0.00033 191,032 (4,274) -2.24% Skagit County (perf. arts/conference center) 0.00033 588,660 7,370 1.25% Snohomish County (regional center) 0.00033 1,208,558 169,692 14.04%

Department of Revenue SSTA Sourcing Study
A-28
South Snohomish (Lynnwood convention center) 0.00033 553,862 (49,914) -9.01% Spokane County (convention center) 0.00033 1,838,817 (31,671) -1.72% Tacoma Regional (convention center) 0.00033 1,606,267 (23,837) -1.48% Vancouver (Conference Center) 0.00033 635,030 6,211 0.98% Whatcom County (regional center ) 0.00033 737,334 53,426 7.25% Yakima Regional (regional center) 0.00033 512,309 (23,571) -4.60%
Total 51,199
METRO PARKS FACILITIES Calendar Year 2002 – Changes from Sourcing
Pursuant to statute, the Department’s 1 percent administrative fee is provided to the Department of Community, Trade and Economic Development.
Jurisdiction Tax Rate
Pierce County Metro Park Tax on CY02 TRS Less 1% Administration Fee Distributed to CTED
Pierce County Metro Park Tax on Gains or Losses Less 1% Administration Fee Distributed to CTED
Gain/Loss as a Percent of CY02
Pierce County Metro Park Tax
Total 0.001 8,760,555 182,576 2.08%
KING COUNTY BASEBALL STADIUM Calendar Year 2002 – Changes from Sourcing
Jurisdiction Tax Rate
King County Baseball Stadium Tax on CY02
TRS
King County Baseball Stadium Tax on Gains or
Losses
Gain/Loss as a Percent of CY02 Baseball Stadium
Tax Total 0.00017 5,914,492 (63,853) -1.08%
KING COUNTY FOOTBALL STADIUM Calendar Year 2002 – Changes from Sourcing
Jurisdiction Tax Rate
King County Football Stadium Tax on CY02
TRS
King County Football Stadium Tax on Gains or
Losses
Gain/Loss as a Percent of CY02 Football Stadium
Tax Total 0.00016 5,566,581 (60,097) -1.08%
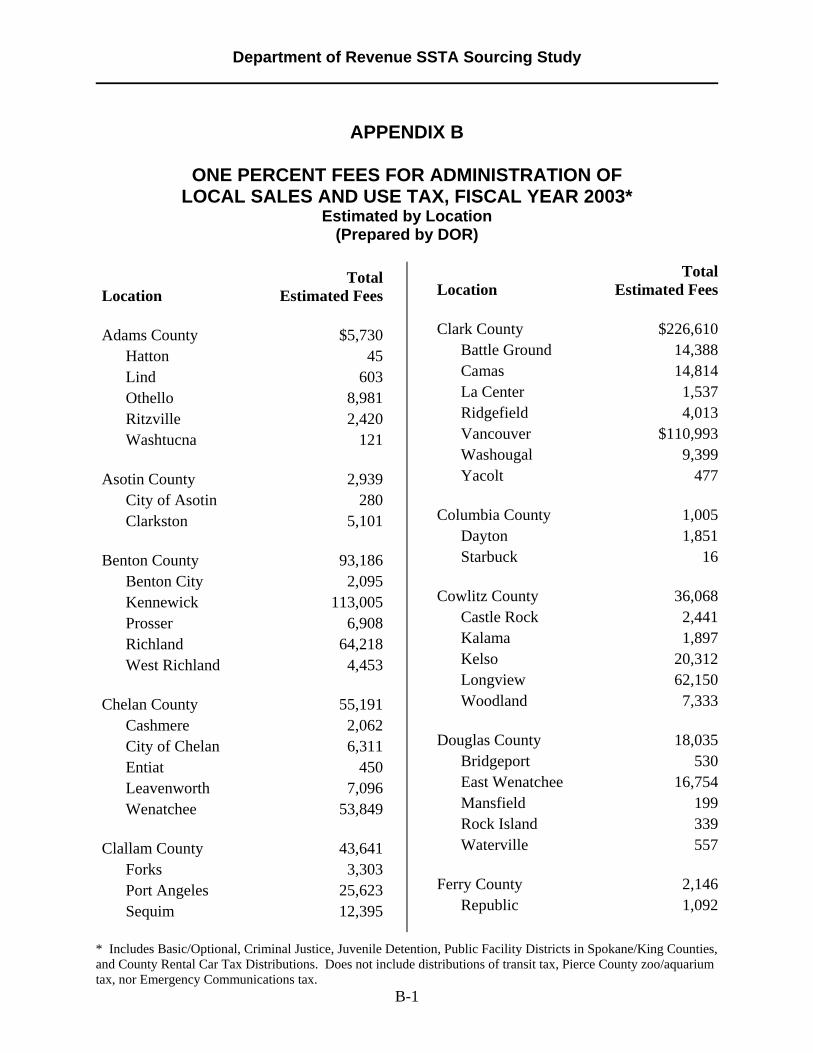
Department of Revenue SSTA Sourcing Study
* Includes Basic/Optional, Criminal Justice, Juvenile Detention, Public Facility Districts in Spokane/King Counties, and County Rental Car Tax Distributions. Does not include distributions of transit tax, Pierce County zoo/aquarium tax, nor Emergency Communications tax.
B-1
APPENDIX B
ONE PERCENT FEES FOR ADMINISTRATION OF LOCAL SALES AND USE TAX, FISCAL YEAR 2003*
Estimated by Location (Prepared by DOR)
Location Total
Estimated Fees Adams County $5,730
Hatton 45Lind 603Othello 8,981Ritzville 2,420Washtucna 121
Asotin County 2,939
City of Asotin 280Clarkston 5,101
Benton County 93,186
Benton City 2,095Kennewick 113,005Prosser 6,908Richland 64,218West Richland 4,453
Chelan County 55,191
Cashmere 2,062City of Chelan 6,311Entiat 450Leavenworth 7,096Wenatchee 53,849
Clallam County 43,641
Forks 3,303Port Angeles 25,623Sequim 12,395
Location Total
Estimated Fees Clark County $226,610
Battle Ground 14,388Camas 14,814La Center 1,537Ridgefield 4,013Vancouver $110,993Washougal 9,399Yacolt 477
Columbia County 1,005
Dayton 1,851Starbuck 16
Cowlitz County 36,068
Castle Rock 2,441Kalama 1,897Kelso 20,312Longview 62,150Woodland 7,333
Douglas County 18,035
Bridgeport 530East Wenatchee 16,754Mansfield 199Rock Island 339Waterville 557
Ferry County 2,146
Republic 1,092
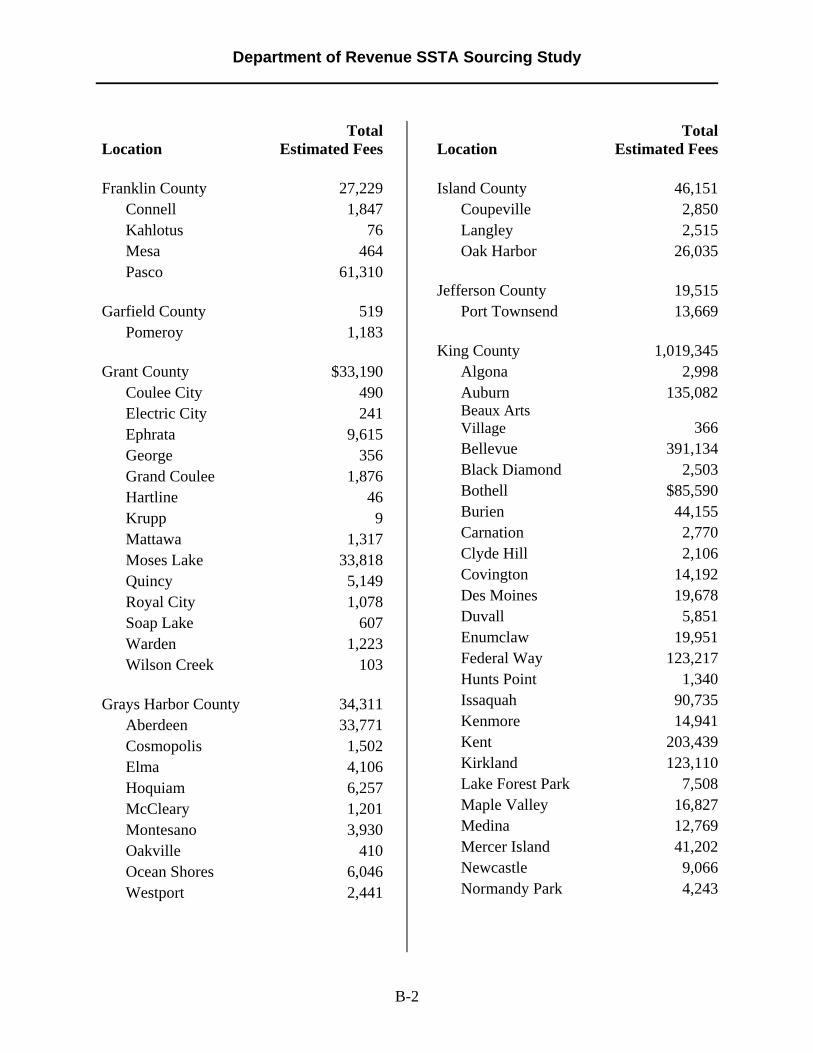
Department of Revenue SSTA Sourcing Study
B-2
Location Total
Estimated Fees Franklin County 27,229
Connell 1,847Kahlotus 76Mesa 464Pasco 61,310
Garfield County 519
Pomeroy 1,183 Grant County $33,190
Coulee City 490Electric City 241Ephrata 9,615George 356Grand Coulee 1,876Hartline 46Krupp 9Mattawa 1,317Moses Lake 33,818Quincy 5,149Royal City 1,078Soap Lake 607Warden 1,223Wilson Creek 103
Grays Harbor County 34,311
Aberdeen 33,771Cosmopolis 1,502Elma 4,106Hoquiam 6,257McCleary 1,201Montesano 3,930Oakville 410Ocean Shores 6,046Westport 2,441
Location Total
Estimated Fees Island County 46,151
Coupeville 2,850Langley 2,515Oak Harbor 26,035
Jefferson County 19,515
Port Townsend 13,669 King County 1,019,345
Algona 2,998Auburn 135,082Beaux Arts Village 366Bellevue 391,134Black Diamond 2,503Bothell $85,590Burien 44,155Carnation 2,770Clyde Hill 2,106Covington 14,192Des Moines 19,678Duvall 5,851Enumclaw 19,951Federal Way 123,217Hunts Point 1,340Issaquah 90,735Kenmore 14,941Kent 203,439Kirkland 123,110Lake Forest Park 7,508Maple Valley 16,827Medina 12,769Mercer Island 41,202Newcastle 9,066Normandy Park 4,243

Department of Revenue SSTA Sourcing Study
B-3
Location Total
Estimated Fees King County (cont.)
North Bend 13,485City of Pacific 6,365Redmond 159,077Renton 162,401Sammamish 27,446SeaTac 95,128Seattle 1,253,765Shoreline 62,798Skykomish 399Snoqualmie 9,643Tukwila 156,115Woodinville 48,347Yarrow Point 1,311
Kitsap County 207,257
Bainbridge Island 23,671Bremerton 61,536Port Orchard 21,991Poulsbo 22,380
Kittitas County 22,051
Cle Elum 4,966Ellensburg 26,173City of Kittitas 575Roslyn 632South Cle Elum 146
Klickitat County 5,307
Bingen 597Goldendale 4,684White Salmon 1,142
Lewis County 64,827
Centralia 21,843Chehalis 27,271Morton 2,428
Location Total
Estimated Fees Lewis County (cont.)
Mossyrock 549Napavine 1,505Pe Ell 514Toledo 685Vader 213Winlock 1,113
Lincoln County 2,648
Almira 215Creston 154Davenport 2,156Harrington 254Odessa 966Reardan 322Sprague 348Wilbur 750
Mason County 33,165
Shelton 16,116 Okanogan County 13,970
Brewster 2,209Conconully 108Coulee Dam 589Elmer City 52Nespelem 50City of Okanogan 3,382Omak 9,537Oroville 1,995Pateros 390Riverside 153Tonasket 1,923Twisp 1,681Winthrop 1,799

Department of Revenue SSTA Sourcing Study
B-4
Location Total
Estimated Fees Pacific County 9,269
Ilwaco 1,394Long Beach 3,051Raymond 2,517South Bend 1,030
Pend Oreille County 3,791
Cusick 142Ione 303Metaline 84Metaline Falls 261Newport 2,591
Pierce County 429,310
Bonney Lake 17,778Buckley 4,355Carbonado 212Du Pont 4,565Eatonville 3,500Edgewood 4,974Fife 51,144Fircrest 2,753Gig Harbor 37,035Lakewood 64,650Milton 6,838Orting 3,679Puyallup 129,050Roy 1,341Ruston 337South Prairie 379Steilacoom 2,528Sumner 24,041Tacoma 340,178University Place 18,757Wilkeson 278
Location Total
Estimated Fees San Juan County 30,542
Friday Harbor 7,864 Skagit County $67,357
Anacortes 26,371Burlington 56,184Concrete 717Hamilton 152La Conner 3,737Lyman 307Mount Vernon 46,955Sedro Woolley 11,315
Skamania County 2,001
North Bonneville 813Stevenson 1,677
Snohomish County 308,969
Arlington 32,345Brier 1,973Darrington 1,108Edmonds 47,422Everett 198,046Gold Bar 1,023Granite Falls 3,735Index 127Lake Stevens 6,388Lynnwood 151,679Marysville 38,466Mill Creek 14,053Monroe 28,629Mountlake Terrace 14,474Mukilteo 20,760City of Snohomish 19,011Stanwood 8,728

Department of Revenue SSTA Sourcing Study
B-5
Location Total
Estimated Fees Snohomish County (cont.)
Sultan 3,014Woodway 1,123
Spokane County $439,740
Airway Heights 4,580Cheney 7,946Deer Park 5,034Fairfield 413Latah 148Liberty Lake 11,365Medical Lake 2,295Millwood 2,365Rockford 427Spangle 461City of Spokane 308,421Spokane Valley 7,243Waverly 64
Stevens County 14,469
Chewelah 2,487Colville 12,514Kettle Falls 1,455Marcus 26Northport 190Springdale 253
Thurston County 143,715
Bucoda 213Lacey 55,997Olympia 142,998Rainier 971Tenino 1,434Tumwater 32,463Yelm 8,279
Location Total
Estimated Fees Wahkiakum County 1,437
Cathlamet 714 Walla Walla County $26,700
College Place 5,049Prescott 270Waitsburg 642City of Walla Walla 38,337
Whatcom County 83,707
Bellingham 150,677Blaine 8,266Everson 1,592Ferndale 10,579Lynden 15,996Nooksack 532Sumas 1,002
Whitman County 9,511
Albion 140Colfax 3,286Colton 151Endicott 150Farmington 54City of Garfield 253La Crosse 309Lamont 29Malden 27Oakesdale 210Palouse 506Pullman 23,805Rosalia 382St. John 599Tekoa 431Uniontown 319

Department of Revenue SSTA Sourcing Study
B-6
Location Total
Estimated Fees Yakima County $68,937
Grandview 6,955Granger 907Harrah 291Mabton 594Moxee City 686Naches 1,231Selah 6,186Sunnyside $19,582Tieton 529Toppenish 5,488Union Gap 26,768Wapato 3,323City of Yakima 116,620Zillah 2,013
Total $10,653,714

Department of Revenue SSTA Sourcing Study
C-1
APPENDIX C
STREAMLINED SALES TAX SIMPLIFICATION SURVEY Washington State University Social and Economic Sciences Research Center Wilson Hall 133
PO Box 644014 Pullman, WA 99164-4014
509-335-1511 Fax 509-335-0116
August 12, 2003 «NAME» «ADDRESS1» «CITY», «STATE» «ZIP» The Washington State Legislature recently passed legislation to adopt some provisions of the national Streamlined Sales and Use Tax Agreement, which provides for a simpler and more uniform sales and use tax structure among states. The legislature has asked the Department of Revenue to contact business and collect information on the fiscal impacts of one part of the agreement that governs how local government sales taxes are collected (also referred to as “sourced”). This information will help the legislature to make an informed decision on this issue. We ask that the person or persons most knowledgeable about sales and delivery issues complete and return this questionnaire. For some businesses, this may be several individuals. The attached questionnaire contains several questions about business sales that are delivered to Washington customers, from storefronts, from warehouses, and from other sources of delivery. Your business was selected in a scientific sample of several targeted industries. Only a few businesses within each industry will be receiving a survey. Because each business represents many similar Washington businesses, it is important to the accuracy of the survey findings that you return your completed questionnaire. We very much appreciate and need your input on this issue so that the results will accurately reflect the views of all businesses in Washington State. The questionnaires will be returned to and processed by Washington State University. All of the information you provide will be kept strictly confidential. No data will be disclosed that identifies any individual company. A code number is printed on the back page; this is used to check your company off the mailing list when it is returned. We ask that you do not write your name or provide any other identifying information anywhere on the questionnaire. If you have any questions about the study or your participation, feel free to call Kent Miller at Washington State University at (800) 833-0867 and ask for the Streamlined Sales Tax Simplification Survey or send a fax message to him at (509) 335-4688 or an email at [email protected]. If you prefer, you may complete the survey via the Internet at http://sesrc.wsu.edu/SALESTAX/and enter the ID number («ID») and password («PSWD») to access the questionnaire. Passwords are case sensitive so please enter it exactly as it appears here. Sincerely,
Executive Director Executive Director Executive Director Washington Retail Association Association of Washington Cities Washington State Association of Counties

Department of Revenue SSTA Sourcing Study
C-2
Executive Director President Chief Executive Officer Washington Association of County Officials Association of Washington Business WSA P.S. This survey has been reviewed and approved by the Washington State University Institutional Review
Board. If you have any questions concerning your rights about participating in this project, please contact 509-335-9661 and ask for the IRB Coordinator.
Summer 2003 (8-7-04)

Department of Revenue SSTA Sourcing Study
C-3
WASHINGTON STATE STREAMLINED SALES TAX
WWWAAASSSHHHIIINNNGGGTTTOOONNN SSSTTTAAATTTEEE DDDEEEPPPAAARRRTTTMMMEEENNNTTT OOOFFF RRREEEVVVEEENNNUUUEEE
ENDORSED BY: WWSSAA AASSSSOOCCIIAATTIIOONN OOFF WWAASSHHIINNGGTTOONN BBUUSSIINNEESSSS
WWAASSHHIINNGGTTOONN RREETTAAIILL AASSSSOOCCIIAATTIIOONN
Association of Washington Cities WWAASSHHIINNGGTTOONN SSTTAATTEE AASSSSOOCCIIAATTIIOONN OOFF CCOOUUNNTTIIEESS WWAASSHHIINNGGTTOONN AASSSSOOCCIIAATTIIOONN OOFF CCOOUUNNTTYY OOFFFFIICCIIAALLSS
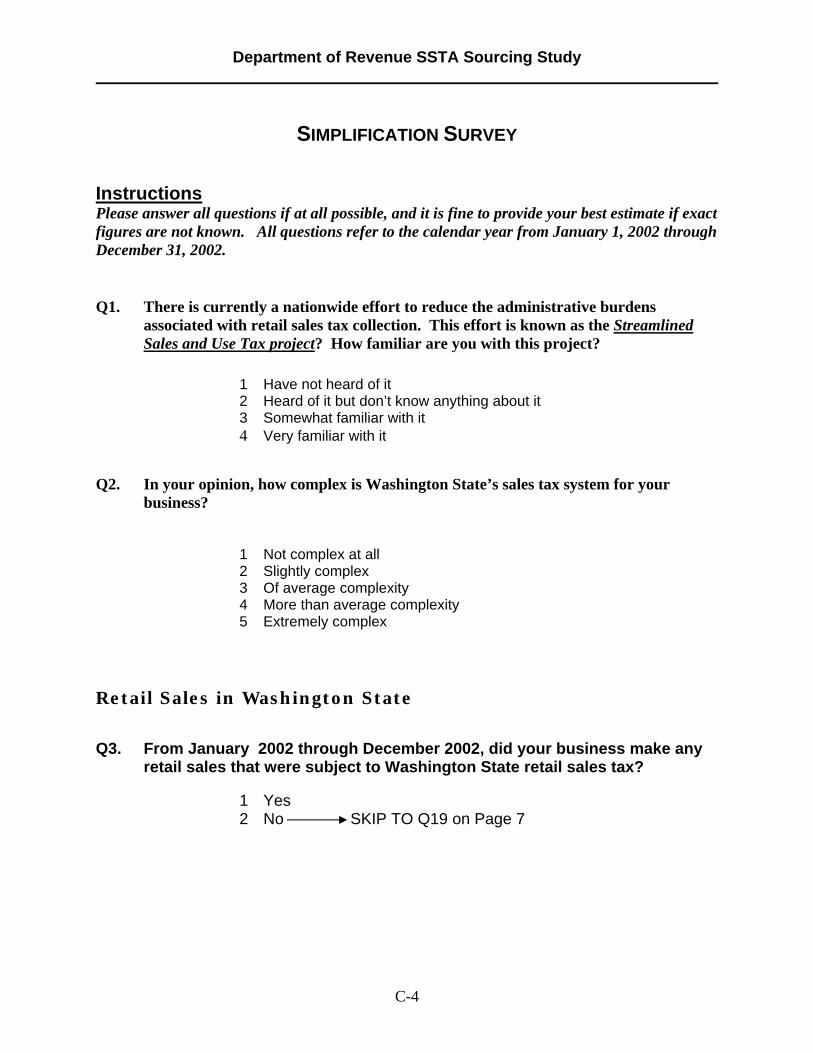
Department of Revenue SSTA Sourcing Study
C-4
SIMPLIFICATION SURVEY
Instructions Please answer all questions if at all possible, and it is fine to provide your best estimate if exact figures are not known. All questions refer to the calendar year from January 1, 2002 through December 31, 2002. Q1. There is currently a nationwide effort to reduce the administrative burdens
associated with retail sales tax collection. This effort is known as the Streamlined Sales and Use Tax project? How familiar are you with this project?
1 Have not heard of it 2 Heard of it but don’t know anything about it 3 Somewhat familiar with it 4 Very familiar with it
Q2. In your opinion, how complex is Washington State’s sales tax system for your
business?
1 Not complex at all 2 Slightly complex 3 Of average complexity 4 More than average complexity 5 Extremely complex
Retail Sales in Washington State Q3. From January 2002 through December 2002, did your business make any
retail sales that were subject to Washington State retail sales tax?
1 Yes 2 No SKIP TO Q19 on Page 7

Department of Revenue SSTA Sourcing Study
C-5
These questions refer to the calendar year from January 1, 2002 through December 31, 2002. Q4. What PERCENT of the value of your business’ total retail sales were made
in Washington State, and what percent were Non-Washington sales?
______% Washington State retail sales ______% Non-Washington retail sales 100 % TOTAL RETAIL SALES
Q5. What PERCENT of the value of your business’ Washington State retail
sales were taxable (that is, subject to retail sales tax) and what percent were exempt from state sales tax?
______% Taxable sales in Washington State ______% Exempt sales in Washington State 100 % TOTAL SALES IN WASHINGTON STATE
Q6. What PERCENT of the value of your business’ taxable Washington State
retail sales originated in-store, and what percent were made by remote sales, including sales made electronically, by internet, by catalog, or by telephone?
______% In-Store Taxable Sales ______% Remote Taxable Sales
100 % TAXABLE SALES IN WASHINGTON STATE For the next few questions, the term “in-store” and “storefront” refer to any retail outlet including businesses that operate from a home. The term “delivered” refers to sales that are not physically picked up by customers at a storefront.

Department of Revenue SSTA Sourcing Study
C-6
Q7. Did your business make any taxable, IN-STORE sales in Washington State from January through December 2002?
1 Yes 2 No SKIP TO Q13 on Page 5
Q8. From January through December 2002, what PERCENT of your business’
taxable, in-store (located in Washington State) retail sales were DELIVERED, and what percent were not-DELIVERED?
______% Delivered in-store sales ______% Not-delivered in-store sales
100 % TAXABLE SALES MADE IN-STORE Q9. Approximately what percent of the value of your business’ taxable, in-
store, delivered retail sales were delivered within:
______% The jurisdiction (either the city limits or unincorporated county) of the storefront
______% A 5-mile radius surrounding the jurisdiction (either the city
limits or unincorporated county) of the storefront ______% A 10-mile radius surrounding the jurisdiction (either the
city limits or unincorporated county) of the storefront ______% The remainder of the county in which the storefront is
located ______% The remainder of the state of Washington
100 % DELIVERED SALES MADE IN-STORE

Department of Revenue SSTA Sourcing Study
C-7
Q10. Of the delivered, in-store sales, approximately what percent of the value of these sales were delivered from . . .
______% Warehouses ______% Storefronts located in Washington State ______% Other Locations (e.g. direct from a factory)
100 % DELIVERED SALES MADE IN-STORE IF YOUR BUSINESS DOES NOT HAVE A WAREHOUSE, OR IF NONE OF YOUR SALES WERE DELIVERED FROM A WAREHOUSE, THEN -> SKIP TO Q13 Q11. Of the in-store sales that were delivered FROM A WAREHOUSE,
approximately what percent of the value of these sales were delivered from . . .
______% Your own warehouse located in Washington State ______% A leased warehouse located in Washington State ______% A warehouse located outside of Washington State
100 % SALES DELIVERED FROM A WAREHOUSE Q12. Of the in-store sales that were delivered FROM ANY IN-STATE
WAREHOUSE (owned or leased), approximately what percent of the value of these sales were delivered within the city limits of the location of the warehouse, and what percent were delivered outside those city limits?
______% Delivered within the city limits of any warehouse located
in Washington State ______% Delivered outside the city limits of any warehouse located
in Washington State 100 % SALES DELIVERED FROM A WAREHOUSE LOCATED
IN WASHINGTON STATE

Department of Revenue SSTA Sourcing Study
C-8
The next few questions are only about the taxable retail sales that your business made REMOTELY, INCLUDING SALES ORIGINATED ELECTRONICALLY, by INTERNET, by TELEPHONE, or by CATALOG (in Washington State) from January through December 2002. For each question, please provide your best estimate. Q13. Did your business make any REMOTE sales to Washington State
residences from January through December 2002?
1 Yes 2 No SKIP TO Q17 on Page 6
Q14. Approximately what percent of your business’ total remote taxable retail
sales were made to each of the 39 counties in the State?
West East ______% Clallum ______% Adams
______% Clark ______% Asotin
______% Cowlitz ______% Benton
______% Grays Harbor ______% Chelan
______% Island ______% Columbia
______% Jefferson ______% Douglas
______% King ______% Ferry
______% Kitsap ______% Franklin
______% Lewis ______% Garfield
______% Mason ______% Grant
______% Pacific ______% Kittitas
______% Pierce ______% Klickitat
______% San Juan ______% Lincoln
______% Skagit ______% Okanogan
______% Skamania ______% Pend Oreille
______% Snohomish ______% Spokane
______% Thurston ______% Stevens
______% Wahkiakum ______% Walla Walla
______% Whatcom ______% Whitman
______% Yakima 100 % Total All Counties

Department of Revenue SSTA Sourcing Study
C-9
Q15. What is the source for the collection of sales taxes on remote sales?
1 Your business headquarters location 2 A warehouse location 3 From each location that a sale is made 4 Some other location (please describe below) ___________________________________________
Q16. Approximately what percent of your business’ total remote Washington
State taxable retail sales were made to households, and what percent were made to businesses?
______% Household remote sales ______% Business remote sales
100 % TOTAL REMOTE TAXABLE RETAIL SALES IN
WASHINGTON STATE The next two questions are only about the taxable retail sales made to other businesses REMOTELY, INCLUDING SALES ORIGINATED ELECTRONICALLY OR BY CATALOG (in Washington State) Q17. Did your business make any REMOTE sales to other BUSINESSES in
Washington State from January through December 2002?
1 Yes 2 No SKIP TO Q19 on Page 7
Q18. Approximately what percent of the value of REMOTE Washington taxable retail sales did your business make and deliver to BUSINESSES from January through December 2002 in each of the following major industry groups:
______% Agriculture / Forestry / Fishing / Mining ______% Construction ______% Manufacturing ______% Utilities / Transportation ______% Wholesale / Retail Trade

Department of Revenue SSTA Sourcing Study
C-10
______% Services (including Government) 100 % REMOTE SALES MADE TO BUSINESSES Q19. Periodically there is a need to collect information from businesses so that
Washington State agencies can provide accurate data to legislative requests. As a business owner or manager, to which ONE of the following survey methods do you MOST prefer to respond:
1 A mailed survey 2 A telephone survey 3 A web survey on the internet 4 A face-to-face interview 5 No preference or none of these
Thank you very much for your participation in this survey of sales tax issues. If you have any further comments about this survey, please write them in the space below.
Please return your questionnaire in the enclosed envelope to:
Social & Economic Sciences Research Center Washington State University
PO Box 1801 Pullman, WA 99164-1801
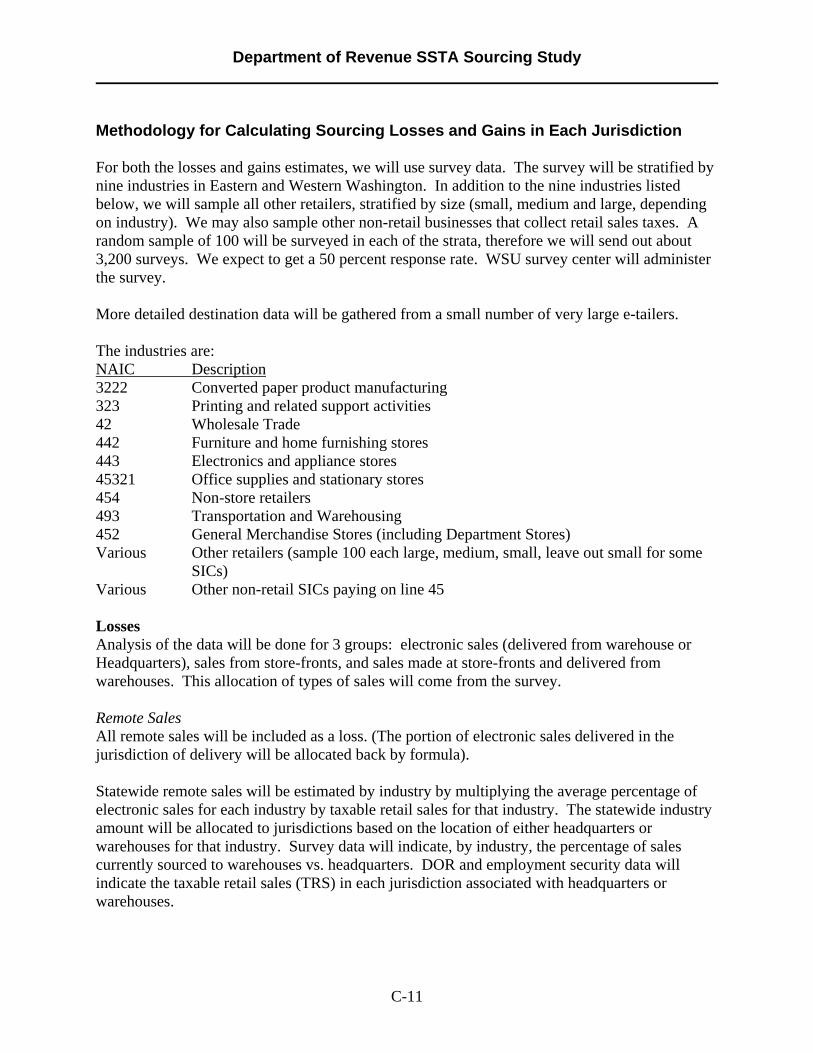
Department of Revenue SSTA Sourcing Study
C-11
Methodology for Calculating Sourcing Losses and Gains in Each Jurisdiction For both the losses and gains estimates, we will use survey data. The survey will be stratified by nine industries in Eastern and Western Washington. In addition to the nine industries listed below, we will sample all other retailers, stratified by size (small, medium and large, depending on industry). We may also sample other non-retail businesses that collect retail sales taxes. A random sample of 100 will be surveyed in each of the strata, therefore we will send out about 3,200 surveys. We expect to get a 50 percent response rate. WSU survey center will administer the survey. More detailed destination data will be gathered from a small number of very large e-tailers. The industries are: NAIC Description 3222 Converted paper product manufacturing 323 Printing and related support activities 42 Wholesale Trade 442 Furniture and home furnishing stores 443 Electronics and appliance stores 45321 Office supplies and stationary stores 454 Non-store retailers 493 Transportation and Warehousing 452 General Merchandise Stores (including Department Stores) Various Other retailers (sample 100 each large, medium, small, leave out small for some
SICs) Various Other non-retail SICs paying on line 45
Losses Analysis of the data will be done for 3 groups: electronic sales (delivered from warehouse or Headquarters), sales from store-fronts, and sales made at store-fronts and delivered from warehouses. This allocation of types of sales will come from the survey. Remote Sales All remote sales will be included as a loss. (The portion of electronic sales delivered in the jurisdiction of delivery will be allocated back by formula). Statewide remote sales will be estimated by industry by multiplying the average percentage of electronic sales for each industry by taxable retail sales for that industry. The statewide industry amount will be allocated to jurisdictions based on the location of either headquarters or warehouses for that industry. Survey data will indicate, by industry, the percentage of sales currently sourced to warehouses vs. headquarters. DOR and employment security data will indicate the taxable retail sales (TRS) in each jurisdiction associated with headquarters or warehouses.

Department of Revenue SSTA Sourcing Study
C-12
Sales Originated In-Store Subtract Remote sales (estimated as described above) from TRS statewide to equal Storefront TRS. Distributed from Warehouse Multiply Storefront TRS for each industry by the percent delivered and the percent delivered from a warehouse (from Survey data). Allocate each industry’s storefront-originated deliveries from warehouses using DOR and Employment Security data describing location of and TRS associated with warehouses. Distributed from Storefront Same methodology as outlined above only using the percent delivered from a storefront and the TRS associated with storefronts. Gains Remote sales Sales to Business Divide the total loss due to remote sales into business and household sales (using survey data). Use survey data to allocate sales to counties. Use survey data on sales to industries and employment data by industry to allocate to jurisdictions within each county. Sales to Households Using survey data we will calculate the amount of sales made to households by industry. The industry sales will be summed for each county to calculate total sales to households. The total sales to households will be allocated to each jurisdiction using jurisdiction level income from the 2000 census. Detailed information on location of customers from a small number of very large remote sellers may be incorporated into the allocation. The location information may assist us in making more precise allocations, for example, to urban vs. rural areas. In-Store Sales Using survey data on destination of sales, we will estimate the probability that sales will be delivered within X miles of each warehouse or storefront and therefore allocate dollars. Census track level income data will also be used to allocate the dollars. We will use GIS to sum the dollars by jurisdiction.
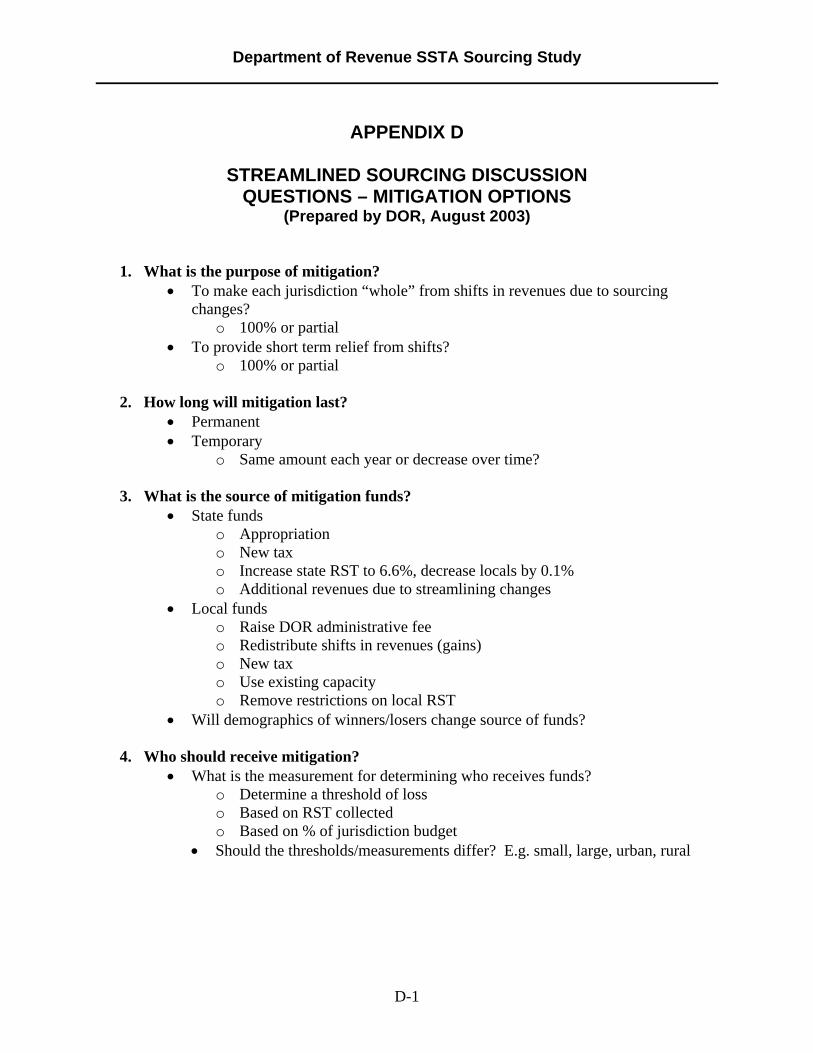
Department of Revenue SSTA Sourcing Study
D-1
APPENDIX D
STREAMLINED SOURCING DISCUSSION QUESTIONS – MITIGATION OPTIONS
(Prepared by DOR, August 2003)
1. What is the purpose of mitigation? • To make each jurisdiction “whole” from shifts in revenues due to sourcing
changes? o 100% or partial
• To provide short term relief from shifts? o 100% or partial
2. How long will mitigation last?
• Permanent • Temporary
o Same amount each year or decrease over time?
3. What is the source of mitigation funds? • State funds
o Appropriation o New tax o Increase state RST to 6.6%, decrease locals by 0.1% o Additional revenues due to streamlining changes
• Local funds o Raise DOR administrative fee o Redistribute shifts in revenues (gains) o New tax o Use existing capacity o Remove restrictions on local RST
• Will demographics of winners/losers change source of funds?
4. Who should receive mitigation? • What is the measurement for determining who receives funds?
o Determine a threshold of loss o Based on RST collected o Based on % of jurisdiction budget
• Should the thresholds/measurements differ? E.g. small, large, urban, rural

Department of Revenue SSTA Sourcing Study
D-2
5. How to distribute funds? • Formula
o Static o Changing over time – population, retail base, annexations, incorporations,
tax capacity • Baseline
o Survey? o Losses?

Department of Revenue SSTA Sourcing Study
E-1
APPENDIX E
STATE LEGISLATIVE STATUS OF STREAMLINED SALES AND USE TAX AGREEMENT (Prepared by SSTP, October 2, 2003)
In early 2000, representatives of state government and the business community formed the Streamlined Sales Tax Project (SSTP) to develop measures to design, test, and implement a sales and use tax system that radically simplifies sales and use taxes. On November 12, 2002, 34 states and the District of Columbia involved in the Streamlined Sales Tax Implementing States (SSTIS) process approved the Streamlined Sales and Use Tax Agreement based upon recommendations put forth by the SSTP. In early 2003, state legislatures began the process of introducing legislation aimed at conforming their state sales and use tax statutes to the Agreement. The Agreement goes into effect when 10 states comprising at least 20 percent of the population of states imposing sales tax have come into compliance. However, collection by sellers of sales and use taxes on remote sales remains voluntary under the Agreement until either Congress or the Supreme Court acts to make this collection mandatory.
State Bill Number(s) and Sponsors Legislative Status Intent of Legislation Effective Date
♦ Alabama HB 694 introduced by Rep. Graham
Legislation brings state into compliance with the SSTIS Agreement
Alaska HB 293 introduced in the House
Legislation establishes a state sales tax and brings the state into compliance with the SSTIS Agreement
♥ Arizona ♣ Arkansas SB 483 introduced by members
of the Senate Finance and Taxation Committee on 02/28/03
SB 483 signed into law by Gov. Huckaby on 04/11/03
Legislation would conform the state’s sales and use tax statutes to the SSTIS Agreement
♣ In compliance with SSTIS ♦ Participated in the negotiations of the SSTIS ♥ Participating state in the SSTP ♠ Does not impose sales tax

Department of Revenue SSTA Sourcing Study
E-2
State Bill Number(s) and Sponsors Legislative Status Intent of Legislation Effective Date
♥ California SB 157 introduced by Sen. Bowen on 02/11/03
SB 157 approved by Senate on 06/05/03; approved by Assembly on 09/08/03; signed into law on 10/09/03
Legislation would make California a participating state in the SSTIS
Colorado ♥ Connecticut SB 328, introduced by Sen.
Crisco on 01/21/03 Legislation referred to Joint Committee on Finance and Revenue
Legislation endorses the SSTIS Agreement
Delaware NO SALES TAX ♦ District of
Columbia The District of Columbia City
Council passed a resolution in 2002 to bring the majority of the city’s sales tax statutes into compliance with the terms of the SSTIS Agreement
♦ Florida S 1776 introduced by Senate Finance and Taxation Committee
S 1776 reported from Senate Finance Committee on 03/27/03; legislature adjourned prior to House taking action on the legislation
Legislation brings the state into compliance with the Agreement
Georgia ♦ Hawaii HB 1226 introduced by Rep.
Say on 01/23/03 and SB 1397 introduced by Sen. Bunda on 01/22/03
Legislation signed into law by Gov. Lingle on 06/16/03
Legislation allows Hawaii to become a member of the SSTIS
06/01/03
♣ In compliance with SSTIS ♦ Participated in the negotiations of the SSTIS ♥ Participating state in the SSTP ♠ Does not impose sales tax
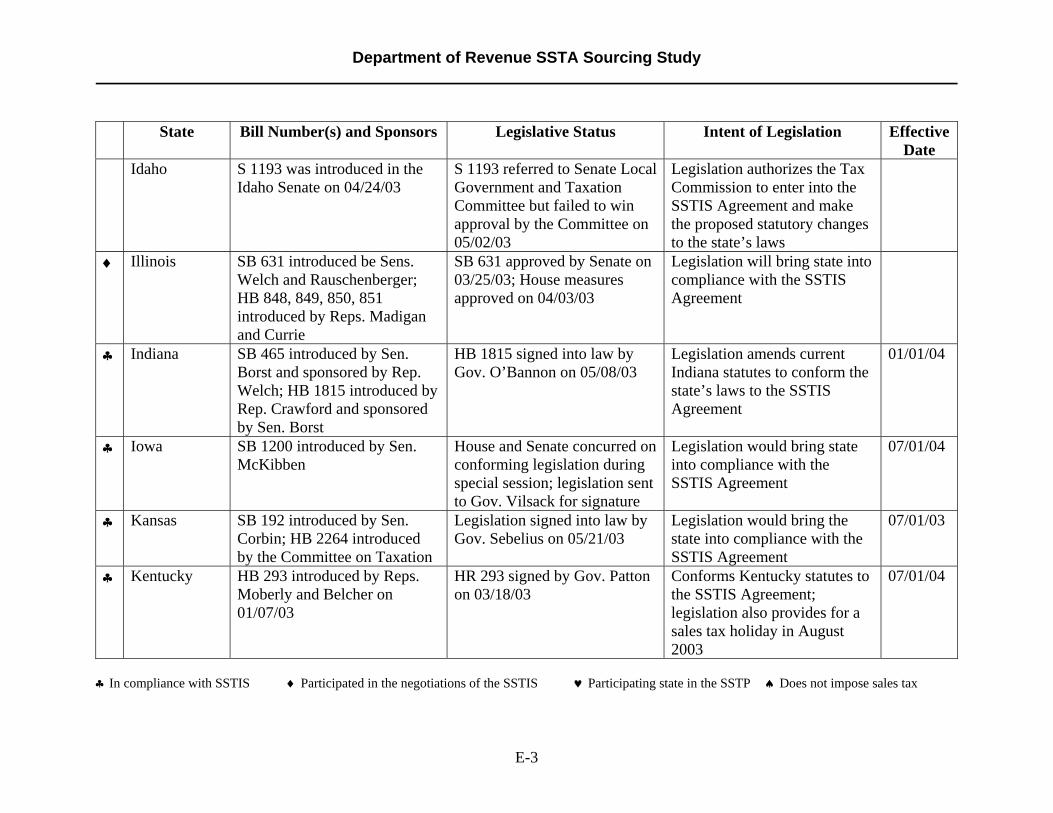
Department of Revenue SSTA Sourcing Study
E-3
State Bill Number(s) and Sponsors Legislative Status Intent of Legislation Effective Date
Idaho S 1193 was introduced in the Idaho Senate on 04/24/03
S 1193 referred to Senate Local Government and Taxation Committee but failed to win approval by the Committee on 05/02/03
Legislation authorizes the Tax Commission to enter into the SSTIS Agreement and make the proposed statutory changes to the state’s laws
♦ Illinois SB 631 introduced be Sens. Welch and Rauschenberger; HB 848, 849, 850, 851 introduced by Reps. Madigan and Currie
SB 631 approved by Senate on 03/25/03; House measures approved on 04/03/03
Legislation will bring state into compliance with the SSTIS Agreement
♣ Indiana SB 465 introduced by Sen. Borst and sponsored by Rep. Welch; HB 1815 introduced by Rep. Crawford and sponsored by Sen. Borst
HB 1815 signed into law by Gov. O’Bannon on 05/08/03
Legislation amends current Indiana statutes to conform the state’s laws to the SSTIS Agreement
01/01/04
♣ Iowa SB 1200 introduced by Sen. McKibben
House and Senate concurred on conforming legislation during special session; legislation sent to Gov. Vilsack for signature
Legislation would bring state into compliance with the SSTIS Agreement
07/01/04
♣ Kansas SB 192 introduced by Sen. Corbin; HB 2264 introduced by the Committee on Taxation
Legislation signed into law by Gov. Sebelius on 05/21/03
Legislation would bring the state into compliance with the SSTIS Agreement
07/01/03
♣ Kentucky HB 293 introduced by Reps. Moberly and Belcher on 01/07/03
HR 293 signed by Gov. Patton on 03/18/03
Conforms Kentucky statutes to the SSTIS Agreement; legislation also provides for a sales tax holiday in August 2003
07/01/04
♣ In compliance with SSTIS ♦ Participated in the negotiations of the SSTIS ♥ Participating state in the SSTP ♠ Does not impose sales tax
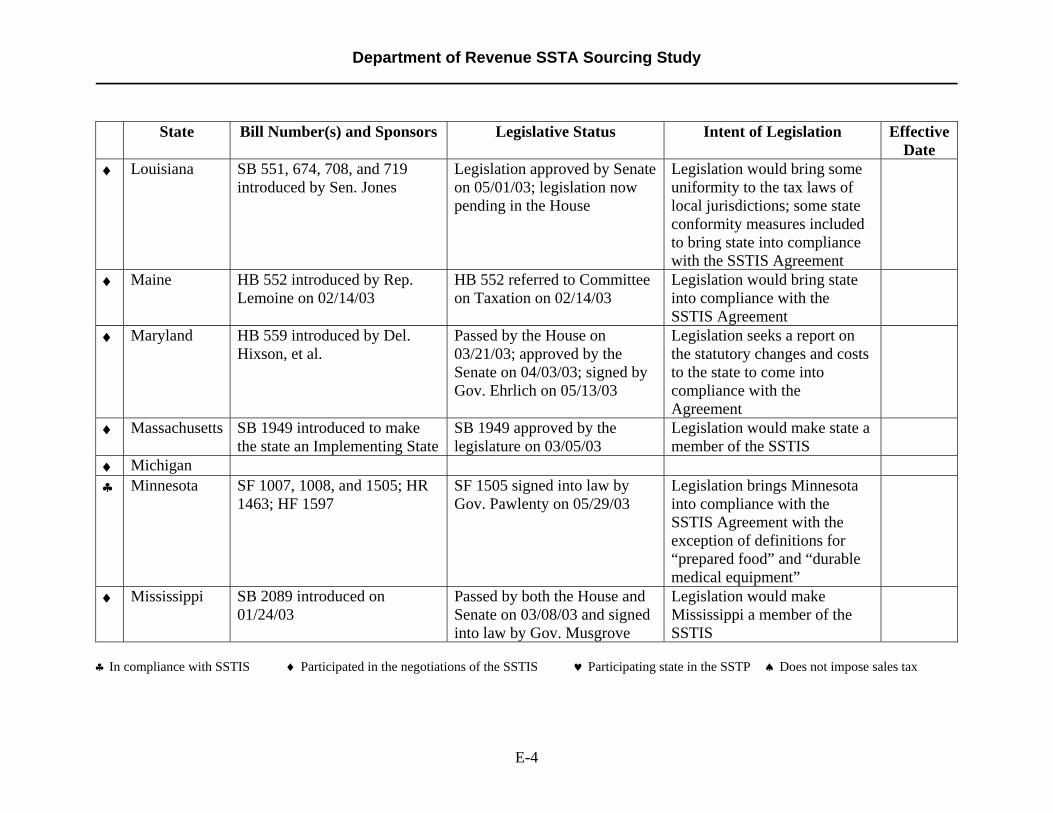
Department of Revenue SSTA Sourcing Study
E-4
State Bill Number(s) and Sponsors Legislative Status Intent of Legislation Effective Date
♦ Louisiana SB 551, 674, 708, and 719 introduced by Sen. Jones
Legislation approved by Senate on 05/01/03; legislation now pending in the House
Legislation would bring some uniformity to the tax laws of local jurisdictions; some state conformity measures included to bring state into compliance with the SSTIS Agreement
♦ Maine HB 552 introduced by Rep. Lemoine on 02/14/03
HB 552 referred to Committee on Taxation on 02/14/03
Legislation would bring state into compliance with the SSTIS Agreement
♦ Maryland HB 559 introduced by Del. Hixson, et al.
Passed by the House on 03/21/03; approved by the Senate on 04/03/03; signed by Gov. Ehrlich on 05/13/03
Legislation seeks a report on the statutory changes and costs to the state to come into compliance with the Agreement
♦ Massachusetts SB 1949 introduced to make the state an Implementing State
SB 1949 approved by the legislature on 03/05/03
Legislation would make state a member of the SSTIS
♦ Michigan ♣ Minnesota SF 1007, 1008, and 1505; HR
1463; HF 1597 SF 1505 signed into law by Gov. Pawlenty on 05/29/03
Legislation brings Minnesota into compliance with the SSTIS Agreement with the exception of definitions for “prepared food” and “durable medical equipment”
♦ Mississippi SB 2089 introduced on 01/24/03
Passed by both the House and Senate on 03/08/03 and signed into law by Gov. Musgrove
Legislation would make Mississippi a member of the SSTIS
♣ In compliance with SSTIS ♦ Participated in the negotiations of the SSTIS ♥ Participating state in the SSTP ♠ Does not impose sales tax
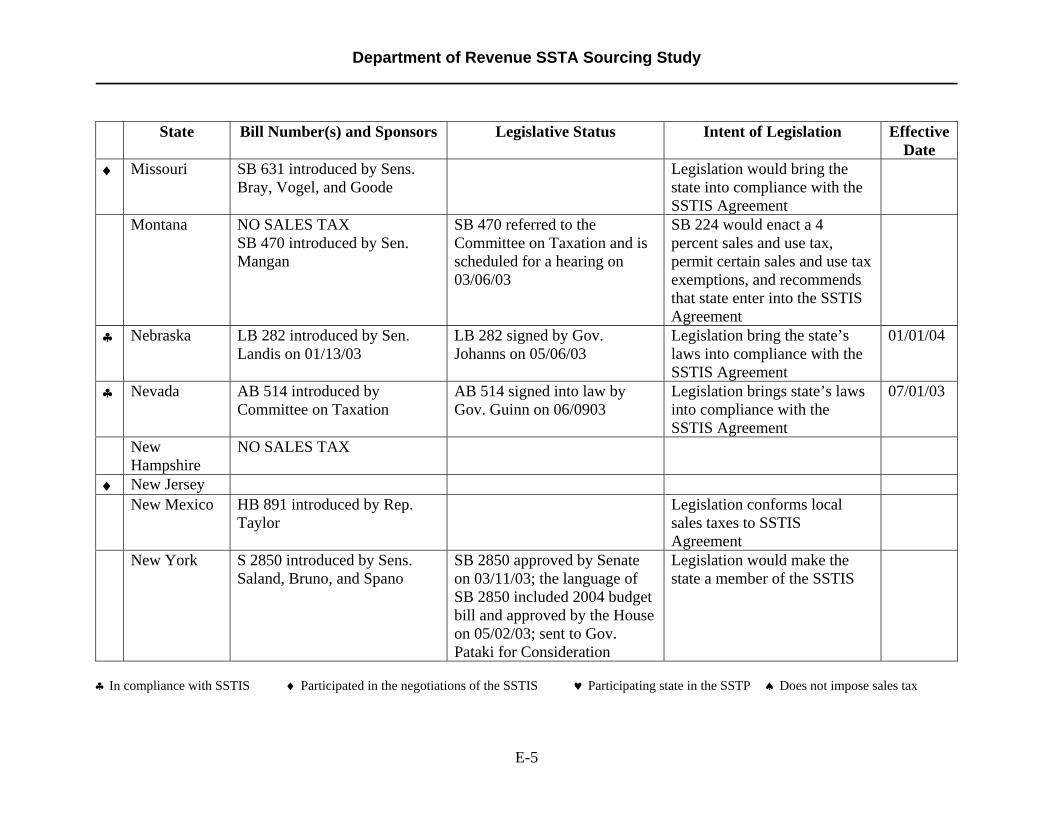
Department of Revenue SSTA Sourcing Study
E-5
State Bill Number(s) and Sponsors Legislative Status Intent of Legislation Effective Date
♦ Missouri SB 631 introduced by Sens. Bray, Vogel, and Goode
Legislation would bring the state into compliance with the SSTIS Agreement
Montana NO SALES TAX SB 470 introduced by Sen. Mangan
SB 470 referred to the Committee on Taxation and is scheduled for a hearing on 03/06/03
SB 224 would enact a 4 percent sales and use tax, permit certain sales and use tax exemptions, and recommends that state enter into the SSTIS Agreement
♣ Nebraska LB 282 introduced by Sen. Landis on 01/13/03
LB 282 signed by Gov. Johanns on 05/06/03
Legislation bring the state’s laws into compliance with the SSTIS Agreement
01/01/04
♣ Nevada AB 514 introduced by Committee on Taxation
AB 514 signed into law by Gov. Guinn on 06/0903
Legislation brings state’s laws into compliance with the SSTIS Agreement
07/01/03
New Hampshire
NO SALES TAX
♦ New Jersey New Mexico HB 891 introduced by Rep.
Taylor Legislation conforms local
sales taxes to SSTIS Agreement
New York S 2850 introduced by Sens. Saland, Bruno, and Spano
SB 2850 approved by Senate on 03/11/03; the language of SB 2850 included 2004 budget bill and approved by the House on 05/02/03; sent to Gov. Pataki for Consideration
Legislation would make the state a member of the SSTIS
♣ In compliance with SSTIS ♦ Participated in the negotiations of the SSTIS ♥ Participating state in the SSTP ♠ Does not impose sales tax

Department of Revenue SSTA Sourcing Study
E-6
State Bill Number(s) and Sponsors Legislative Status Intent of Legislation Effective Date
♣ North Carolina
SB 99 introduced by Sen. Kerr; HB 44 introduced by Rep. Luebke
HB 397 added additional language necessary to bring state into compliance with the SSTIS Agreement; signed into law by Gov. Easley on 06/03/03
Legislation would make changes to state’s statutes into full compliance with the SSTIS Agreement; North Carolina enacted legislation in 2002 to adopt most of the provisions of the SSTIS Agreement
♣ North Dakota SB 2095 and 2096 introduced on 01/07/03 by Sen. Cook
SB 2095 and 2096 signed by Gov. Hoeven on 04/08/03
Legislation would bring state’s laws into compliance with the SSTIS Agreement
12/31/05
♣ Ohio HB 95 HB 95 includes language to bring Ohio into compliance with the SSTIS Agreement; signed into law by Gov. Taft on 06/26/03
♣ Oklahoma HB 1712 introduced on 02/04/03 by Rep. Pope; SB 708 introduced by Sen. Monson on 02/04/03
SB 708 signed into law by Gov. Henry on 06/05/03
Legislation amends statutes and brings Oklahoma into compliance with the SSTIS Agreement
11/01/03
Oregon NO SALES TAX HB 3500 and 3608 introduced by Rep. Hansen and Revenue Committee
Hearing held on HB 3500 on 04/11/03
Legislation would establish a sales tax system and bring the state into compliance with the SSTIS Agreement
♥ Pennsylvania ♦ Rhode Island ♦ South
Carolina
♣ In compliance with SSTIS ♦ Participated in the negotiations of the SSTIS ♥ Participating state in the SSTP ♠ Does not impose sales tax

Department of Revenue SSTA Sourcing Study
E-7
State Bill Number(s) and Sponsors Legislative Status Intent of Legislation Effective Date
♣ South Dakota SB 76 introduced on 01/24/03 by the Committee on State Affairs
SB 76 signed into law by Gov. Rounds on 03/06/03
Legislation brings the state into compliance with the SSTIS Agreement
01/01/04
♣ Tennessee SB 899 introduced by Sen. Clabough; HB 823 introduced by Rep. Head
SB 899 signed by Gov. Bredeson on 06/16/03
Legislation brings the state into compliance with the SSTIS Agreement
♣ Texas SB 823 introduced by Sens. Fraser and VandePutte; HB 3143 introduced by Rep. Wilson
HB 2425 signed by Gov. Perry on 06/20/03; Several provisions effective on 10/01/03; other provisions become effective on 07/0104
Legislation would bring the state into compliance with the SSTIS Agreement
10/01/03 07/01/04
♣ Utah SB 147 introduced on 02/03/03 by Sen. Hillyard
SB 147 signed into law on 03/24/03 by Gov. Leavitt
Legislation would bring the state into compliance with the SSTIS Agreement
01/01/04
♣ Vermont HB 480 introduced and referred to Appropriations Committee
HB 480 signed by Gov. Douglas on 06/18/03
Legislation would bring the state into compliance with the SSTIS Agreement
♦ Virginia SJR 347 introduced on 01/08/03 by Sen. Hanger and HJR 657 introduced on 01/08/03 by Rep. Watts
SJR 347 referred to Senate Rules Committee; JFR 657 approved by the House Rules Committee on 01/28/03
SJR 347 and HJR 657 would create a joint study committee to review the impact of the SSTIS Agreement on the state and make recommendations regarding whether the state should conform its laws to the Agreement
♣ In compliance with SSTIS ♦ Participated in the negotiations of the SSTIS ♥ Participating state in the SSTP ♠ Does not impose sales tax

Department of Revenue SSTA Sourcing Study
E-8
State Bill Number(s) and Sponsors Legislative Status Intent of Legislation Effective Date
♣ Washington SB 5783 introduced by Sen. Finkbeiner on 02/12/03; HB 1863 introduced by Rep. Gombosky on 02/12/03
Legislation signed into law by Gov. Locke on 05/12/03
Legislation brings majority of state’s statutes into compliance with the SSTIS Agreement
♣ West Virginia HB 3014 HB 3014 signed into law by Gov. Wise on 03/14/03
Legislation authorizes the Revenue Commissioner to enter the state into the Agreement and make any changes to the state’s statutes to conform to the Agreement
01/01/04
♦ Wisconsin AB 547 introduced by Rep. Lehman and SB 267 introduced by Sen. R. Brown on 10/02/03
Hearing scheduled for 10/06/03 Legislation would bring the state into compliance with the SSTIS Agreement
07/01/04
♣ Wyoming Wyoming enacted legislation in 2002 to bring the state into compliance with the SSTIS
♣ In compliance with SSTIS ♦ Participated in the negotiations of the SSTIS ♥ Participating state in the SSTP ♠ Does not impose sales tax

Department of Revenue SSTA Sourcing Study
F-1
APPENDIX F
OTHER STATES DESTINATION-BASED SOURCING STATUS STATE SALES TAX SOURCING STATUS
(Prepared by Kansas State DOR)
State Sales Tax Sourcing Status Alabama already a destination-based sourcing state. However, sales tax in Alabama is
locally administered, which is not in compliance with the Streamlined Sales Tax Agreement, so they have no Streamlined Sales Tax Agreement-conforming legislation yet.
Arizona is an origin-based sourcing state. They do have several local taxing jurisdictions. They do not have any Streamlined Sales Tax Agreement-conforming legislation yet.
Arkansas currently an origin-based sourcing state (except labor services are sourced to the place where the services are performed). They passed Streamlined Sales Tax Agreement-conforming legislation, effective 1/1/04, including destination sourcing. They have 332 local taxing jurisdictions (including cities and counties). They do not tax newspaper and magazine subscriptions. Their revenue department is gearing up for implementation of destination sourcing, and they anticipate a lot of complaints.
California is an origin-based sourcing state. They do have several local taxing jurisdictions. They do not have any Streamlined Sales Tax Agreement-conforming legislation and have only recently become involved in the Project.
Colorado Not participating in the Streamlined Sales Tax Project. Colorado is already a destination-based sourcing state. Colorado also has locally administered local sales taxes, which would not be in compliance with the Agreement, were it to attempt to join.
Connecticut is a destination-based sourcing state. They have no local sales tax. They have not passed Streamlined Sales Tax-conforming legislation yet.
Florida has been a destination sourcing state since the 1980’s, when local option sales taxes were first introduced. Florida has not enacted Streamlined Sales Tax Agreement-conforming legislation yet.
Georgia a destination sourcing state for many years. However, they only have local county sales taxes, with 159 counties and mandate only 1 of 3 different rates can be used. They have not adopted Streamlined Sales Tax Agreement-conforming legislation.
Illinois currently an origin-based sourcing state, except for purchase orders, for which destination sourcing is used. They have not yet adopted Streamlined Sales Tax Agreement-conforming legislation.
Indiana has no local sales tax. They adopted Streamlined Sales Tax-conforming legislation effective 1/1/04.

Department of Revenue SSTA Sourcing Study
F-2
Other States Destination-Based Sourcing Status
State Sales Tax Sourcing Status Iowa currently an origin-based state. Iowa has only 50 local county sales taxes.
Iowa has adopted Streamlined Sales Tax Agreement-conforming legislation, including destination sourcing, effective 7/1/04.
Kentucky is a destination-based sourcing state. However, they have no local sales tax. Louisiana has been a destination sourcing state for many years. They have not yet
adopted Streamlined Sales Tax Agreement-conforming legislation. Massachusetts has no local sales tax. They have not passed Streamlined Sales Tax
Agreement-conforming legislation yet. Michigan is a destination sourcing state already. However, they have no local sales tax.
Minnesota has been a destination sourcing state for a number of years. They only have 10 cities and 1 county with local sales tax. They have partially adopted Streamlined Sales Tax Agreement-conforming legislation.
Missouri currently applies destination sourcing only for local use tax; origin sourcing still applies for sales tax. Missouri has not enacted Streamlined Sales Tax Agreement-conforming legislation yet. They will have to adopt destination sourcing to conform with and join the Streamlined Sales Tax Agreement. Missouri also has a large number of local option sales taxes and taxing jurisdictions (over 450), which complicates implementation of destination sourcing.
Nebraska has been a destination sourcing state since 1967. However, Nebraska has only 129 local city sales taxes and no county sales taxes. Nebraska has adopted Streamlined Sales Tax Agreement-conforming legislation, effective 1/1/04.
Nevada adopted Streamlined Sales Tax Agreement-conforming legislation effective 7/1/03 (including destination sourcing). Nevada only has about 17 local taxing jurisdictions.
New Jersey no local sales tax. No Streamlined Sales Tax Agreement-conforming legislation yet.
New York has used destination sourcing since 1965. They have not adopted Streamlined Sales Tax Agreement-conforming legislation.
North Carolina adopted destination sourcing in 1/2002. They experienced a large volume of complaints for the first six months, particularly from furniture and appliance dealers and building supply stores, but it has quieted down now. However, North Carolina has only county sales tax, 100 counties, and they all have the same rate – no city sales taxes. Thus, the only issue for them is allocation of the sales tax, not billing problems.
North Dakota has had destination sourcing for many years, but they have only 1 county local sales tax and 100 city local sales taxes. They adopted Streamlined Sales Tax Agreement-conforming legislation effective 12/31/05.
Ohio already a destination sourcing state. They passed Streamlined Sales Tax Agreement-conforming legislation effective 1/1/04.

Department of Revenue SSTA Sourcing Study
F-3
Other States Destination-Based Sourcing Status
State Sales Tax Sourcing Status Oklahoma since the 1980’s, Oklahoma has used destination sourcing only for mail, phone
and Internet purchases. Origin sourcing is used for merchandise purchased in brick and mortar stores – whether delivered or picked up at the store. However, Oklahoma has adopted Streamlined Sales Tax Agreement-conforming legislation effective 11/1/03, which includes full destination sourcing for all transactions. Oklahoma has hundreds of local sales tax jurisdictions and local option sales taxes, complicating implementation of destination sourcing.
Pennsylvania currently an origin-based sourcing state. They will have to adopt destination sourcing, if they wish to join the Agreement.
Rhode Island is an origin-based sourcing state. They did not have any local sales taxes until this year, when one was enacted. However, it is to be implemented as a destination-based sourcing sales tax. There are 40 cities.
South Dakota has had destination sourcing for the past 30 years. They adopted Streamlined Sales Tax Agreement-conforming legislation, effective 1/1/04.
Tennessee currently an origin-based sourcing state. They adopted Streamlined Sales Tax Agreement-conforming legislation (effective Jan. 04), including destination sourcing. They also have several local taxing jurisdictions and anticipate complaints.
Texas currently an origin-based state. They passed Streamlined Sales Tax Agreement-conforming legislation that includes only partial destination sourcing, effective 7/1/04. Destination sourcing will apply only to services – not sales of tangible personal property. Texas will not be in compliance until it passes full destination sourcing. Texas has 100 county local sales taxes, 200 city local sales taxes, and 8 special purpose local sales taxes.
Utah currently an origin-based sourcing state, passed Streamlined Sales Tax Agreement-conforming legislation, which goes into effect on 7/1/04, including destination sourcing. Prior to that legislation, Utah applied destination sourcing only to interstate sales, but origin-based sourcing to intrastate sales. They have 293 local taxing jurisdictions, many of them very small, close together, with Salt Lake City having at least 5 within its borders. They are already experiencing outcry from small businesses and cities/counties concerned about revenue shifts. The legislature is considering origin-based sourcing for a portion of the local sales tax and destination-based sourcing for the rest, in order to accommodate concerns. This would obviously violate the Agreement, were that to occur.
Vermont is an origin-based sourcing state. However, they have only 2 local sales taxes and no local use tax.
Virginia is an origin-based sourcing state now. They have 145 taxing jurisdictions. However, the local sales tax rate is the same. They have not passed Streamlined Sales Tax Agreement-conforming legislation yet.

Department of Revenue SSTA Sourcing Study
F-4
Other States Destination-Based Sourcing Status
State Sales Tax Sourcing Status Washington currently an origin-based sourcing state. They partially adopted Streamlined
Sales Tax Agreement-conforming legislation but did not include destination sourcing.
Wisconsin has been a destination-based sourcing state for some time. However, they also apply nexus at the local taxing jurisdiction level. This may be changed with their Streamlined Sales Tax Agreement legislation.
Wyoming
was the first state to adopt Streamlined Sales Tax Agreement-conforming legislation in 2002, including destination sourcing.

Department of Revenue SSTA Sourcing Study
G-1
APPENDIX G
ESTIMATE OF REMOTE SALES LOSSES (Prepared by DOR)
Remote sales are sales made by catalog and Internet sellers who have no nexus with Washington State (no legal obligation to collect and remit sales and use taxes to Washington). Washington estimates in 2002 that $3.1 billion in remote sales are untaxed, which means a loss of approximately $59 million in tax for all local taxing jurisdictions. These estimated gains would not be realized immediately or in total due to potential de minimus thresholds and/or behavior changes. For the last few years remote sales have been growing by 25 percent, but should taper off. Taxable retail sales have grown at a rate of 4.63 percent per year from 1992 through 2002. The local taxes have been adjusted for the State’s 1 percent administrative fee, and for the 15 percent county allocation. This display represents the basic and optional portion only. The remote sales are allocated to each jurisdiction based on census block level household income data. However, Spokane County’s allocation is based on population because census block level data would not reflect the 2003 incorporation of Spokane Valley.
Location
Total Regular Local Tax
Rate
Regular Local Tax with 15% Adjustment on Gain or Loss
Regular Local Tax with 15% Adjustment on
$3.1 Billion Local Remote Sales
ADAMS COUNTY 0.01 43,487 28,584 ASOTIN COUNTY 0.005 (127) 29,632 BENTON COUNTY 0.01 41,479 228,165 CHELAN COUNTY 0.01 (149,606) 156,700 CLALLAM COUNTY 0.01 58,260 222,440 CLARK COUNTY 0.008 289,802 803,952 COLUMBIA COUNTY 0.01 6,498 7,743 COWLITZ COUNTY 0.01 275,848 208,710 DOUGLAS COUNTY 0.01 159,497 95,899 FERRY COUNTY 0.01 39,735 22,030 FRANKLIN COUNTY 0.01 92,410 82,248 GARFIELD COUNTY 0.01 19,788 4,698 GRANT COUNTY 0.01 68,756 145,090 GRAYS HARBOR COUNTY 0.01 (378,690) 126,519 ISLAND COUNTY 0.01 71,822 273,447 JEFFERSON COUNTY 0.01 137,485 108,381 KING COUNTY 0.01 643,289 3,722,522 KITSAP COUNTY 0.01 670,302 803,069 KITTITAS COUNTY 0.01 40,676 89,638 KLICKITAT COUNTY 0.005 8,187 36,630

Department of Revenue SSTA Sourcing Study
G-2
LEWIS COUNTY 0.01 (271,254) 183,271 LINCOLN COUNTY 0.01 68,178 22,096 MASON COUNTY 0.01 114,921 173,965 OKANOGAN COUNTY 0.01 48,556 92,014 PACIFIC COUNTY 0.01 168,451 61,774 PEND OREILLE COUNTY 0.01 110,275 34,936 PIERCE COUNTY 0.01 3,152,227 1,777,030 SAN JUAN COUNTY 0.01 86,339 92,444 SKAGIT COUNTY 0.01 620,755 291,585 SKAMANIA COUNTY 0.005 6,008 18,677 SNOHOMISH COUNTY 0.01 3,079,692 1,855,796 SPOKANE COUNTY 0.01 (57,897) 702,878 STEVENS COUNTY 0.01 25,913 116,610 THURSTON COUNTY 0.01 1,037,897 673,765 WAHKIAKUM COUNTY 0.01 13,621 14,970 WALLA WALLA COUNTY 0.01 65,900 88,964 WHATCOM COUNTY 0.01 1,866,417 422,750 WHITMAN COUNTY 0.01 8,448 33,092 YAKIMA COUNTY 0.01 114,834 448,544
ABERDEEN 0.01 (99,915) 51,567 AIRWAY HEIGHTS 0.01 (7,062) 16,573 ALBION 0.01 (436) 2,174 ALGONA 0.01 43,882 9,331 ALMIRA 0.01 2,714 997 ANACORTES 0.01 (203,888) 64,012 ARLINGTON 0.01 181,377 44,130 ASOTIN CITY 0.005 31 1,680 AUBURN 0.01 (1,237,424) 152,327 BAINBRIDGE ISLAND 0.01 210,853 148,711 BATTLE GROUND 0.01 76,834 24,139 BEAUX ARTS VILLAGE 0.01 16,965 3,256 BELLEVUE 0.01 (1,420,137) 782,094 BELLINGHAM 0.01 (278,997) 247,914 BENTON CITY 0.01 741 6,856 BINGEN 0.005 (1,180) 767 BLACK DIAMOND 0.01 (372) 20,713 BLAINE 0.01 72,793 14,575 BONNEY LAKE 0.01 76,262 39,214 BOTHELL 0.01 (421,423) 154,469 BREMERTON 0.01 126,465 112,789 BREWSTER 0.01 2,432 3,917 BRIDGEPORT 0.01 2,406 4,208 BRIER 0.01 95,474 34,166 BUCKLEY 0.01 22,749 13,910

Department of Revenue SSTA Sourcing Study
G-3
BUCODA 0.01 105 2,145 BURIEN 0.01 340,060 144,664 BURLINGTON 0.01 (682,727) 21,608 CAMAS 0.008 44,244 52,983 CARBONADO 0.01 514 2,440 CARNATION 0.01 (5,172) 8,045 CASHMERE 0.01 9,267 9,903 CASTLE ROCK 0.01 29,438 6,465 CATHLAMET 0.01 4,411 1,883 CENTRALIA 0.01 303,942 45,421 CHEHALIS 0.01 (93,460) 20,998 CHELAN CITY 0.01 22,271 11,569 CHENEY 0.01 23,786 34,193 CHEWELAH 0.01 (27,798) 5,790 CLARKSTON 0.005 (55,953) 10,316 CLE ELUM 0.01 28,686 5,715 CLYDE HILL 0.01 128,231 45,050 COLFAX 0.01 8,422 10,169 COLLEGE PLACE 0.01 (62,804) 20,916 COLTON 0.01 53 1,700 COLVILLE 0.01 (111,619) 18,005 CONCONULLY 0.01 41 637 CONCRETE 0.01 5,766 1,989 CONNELL 0.01 6,219 6,437 COSMOPOLIS 0.01 5,933 5,675 COULEE CITY 0.01 612 1,777 COULEE DAM 0.01 579 3,865 COUPEVILLE 0.01 13,494 6,043 COVINGTON 0.01 186,719 59,188 CRESTON 0.01 2,798 633 CRESTON-GEN-ST 0 - - CUSICK 0.01 3,783 472 DARRINGTON 0.01 (1,138) 3,882 DAVENPORT 0.01 53,602 6,696 DAYTON 0.01 2,553 8,224 DEER PARK 0.01 (7,834) 11,030 DES MOINES 0.01 739,852 131,459 DU PONT 0.01 24,543 10,801 DUVALL 0.01 12,876 25,350 EAST WENATCHEE 0.01 (93,525) 20,058 EATONVILLE 0.01 (3,026) 7,486 EDGEWOOD 0.01 273,448 44,607 EDMONDS 0.01 554,167 231,258

Department of Revenue SSTA Sourcing Study
G-4
ELECTRIC CITY 0.01 291 3,408 ELLENSBURG 0.01 (7,668) 38,431 ELMA 0.01 (5,615) 7,924 ELMER CITY 0.01 27 927 ENDICOTT 0.01 (48) 862 ENTIAT 0.01 (2,378) 2,535 ENUMCLAW 0.01 (273,981) 44,275 EPHRATA 0.01 (60,896) 23,077 EVERETT 0.01 (1,664,614) 356,073 EVERSON 0.01 4,200 5,405 FAIRFIELD 0.01 (1,556) 2,116 FARMINGTON 0.01 (71) 305 FEDERAL WAY 0.01 609,727 361,549 FERNDALE 0.01 8,432 27,765 FIFE 0.01 (1,063,602) 15,487 FIRCREST 0.01 104,345 30,566 FORKS 0.01 20,824 8,240 FRIDAY HARBOR 0.01 29,549 7,818 GARFIELD 0.01 91 2,152 GEORGE 0.01 299 772 GIG HARBOR 0.01 (85,360) 36,053 GOLD BAR 0.01 9,603 7,130 GOLDENDALE 0.01 (6,650) 4,762 GRAND COULEE 0.01 (15,285) 2,366 GRANDVIEW 0.01 (35,230) 19,926 GRANGER 0.01 3,534 3,982 GRANITE FALLS 0.01 (53,174) 8,057 HAMILTON 0.01 1,170 854 HARRAH 0.01 250 1,349 HARRINGTON 0.01 1,636 1,336 HARTLINE 0.01 95 391 HATTON 0.01 362 246 HOQUIAM 0.01 (211,343) 27,570 HUNTS POINT 0.01 279 9,760 ILWACO 0.01 5,754 3,098 INDEX 0.01 1,088 653 IONE 0.01 2,788 1,198 ISSAQUAH 0.01 (241,411) 73,498 KAHLOTUS 0.01 233 870 KALAMA 0.01 9,882 6,904 KELSO 0.01 253,229 35,178

Department of Revenue SSTA Sourcing Study
G-5
KENMORE 0.01 327,657 115,867 KENNEWICK 0.01 (777,171) 214,514 KENT 0.01 (2,252,276) 329,432 KETTLE FALLS 0.01 1,865 4,194 KIRKLAND 0.01 349,866 338,919 KITTITAS CITY 0.01 4,286 2,567 KRUPP 0.01 (13) 144 LA CENTER 0.01 3,212 5,373 LA CONNER 0.01 9,978 3,641 LA CROSSE 0.01 (2,085) 1,189 LACEY 0.01 (558,697) 121,316 LAKE FOREST PARK 0.01 266,414 86,481 LAKE STEVENS 0.01 78,011 29,079 LAKEWOOD 0.01 556,274 231,073 LAMONT 0.01 96 165 LANGLEY 0.01 2,705 4,594 LATAH 0.01 (310) 700 LEAVENWORTH 0.01 11,095 7,421 LIBERTY LAKE 0.01 15,861 16,753 LIND 0.01 (1,082) 1,925 LONG BEACH 0.01 36,872 5,246 LONGVIEW 0.01 (230,973) 122,974 LYMAN 0.01 1,039 1,283 LYNDEN 0.01 (70,993) 36,578 LYNNWOOD 0.01 (1,272,798) 130,494 MABTON 0.01 836 2,835 MALDEN 0.01 271 505 MANSFIELD 0.01 354 1,030 MAPLE VALLEY 0.01 74,302 70,010 MARCUS 0.01 9 308 MARYSVILLE 0.01 320,531 99,789 MATTAWA 0.01 (1,406) 3,673 MCCLEARY 0.01 5,276 3,835 MEDICAL LAKE 0.01 10,681 15,219 MEDINA 0.01 70,836 48,272 MERCER ISLAND CITY 0.01 584,371 230,263 MESA 0.01 (19,274) 1,736 METALINE 0.01 786 391 METALINE FALLS 0.01 1,797 621 MILL CREEK 0.01 295,162 80,694 MILLWOOD 0.01 19,749 5,976 MILTON 0.01 195,991 5,719 MONROE 0.01 (183,300) 46,449 MONTESANO 0.01 23,079 12,685

Department of Revenue SSTA Sourcing Study
G-6
MORTON 0.01 529 3,385 MOSES LAKE 0.01 (169,236) 48,518 MOSSYROCK 0.01 1,886 1,106 MOUNT VERNON 0.01 509,144 85,770 MOUNTLAKE TERRACE 0.01 395,852 84,693 MOXEE CITY 0.01 1,778 2,082 MUKILTEO 0.01 369,497 102,842 NACHES 0.01 2,362 1,929 NAPAVINE 0.01 495 4,214 NESPELEM 0.01 3,494 467 NEWCASTLE 0.01 207,985 54,583 NEWPORT 0.01 53,683 5,084 NOOKSACK 0.01 (744) 2,563 NORMANDY PARK 0.01 226,551 42,503 NORTH BEND 0.01 (30,599) 27,011 NORTH BONNEVILLE 0.01 195 1,074 NORTHPORT 0.01 (20) 809 OAK HARBOR 0.01 99,374 65,183 OAKESDALE 0.01 (1,732) 1,376 OAKVILLE 0.01 (577) 1,699 OCEAN SHORES 0.01 22,982 13,959 ODESSA 0.01 10,413 3,158 OKANOGAN CITY 0.01 (383) 6,139 OLYMPIA 0.01 (989,088) 182,797 OMAK 0.01 (127,741) 11,806 OROVILLE 0.01 2,331 3,922 ORTING 0.01 31,361 14,171 OTHELLO 0.01 31,607 12,748 PACIFIC 0.01 13,931 19,663 PALOUSE 0.01 (248) 3,130 PASCO 0.01 (159,144) 84,105 PATEROS 0.01 (593) 1,722 PE ELL 0.01 135 1,606 POMEROY 0.01 1,432 4,621 PORT ANGELES 0.01 59,970 36,382 PORT ORCHARD 0.01 100,898 63,692 PORT TOWNSEND 0.01 47,986 23,496 POULSBO 0.01 (84,384) 25,414 PRESCOTT 0.01 76 963 PROSSER 0.01 (26,576) 14,446 PULLMAN 0.01 (60,327) 61,119 PUYALLUP 0.01 (1,117,345) 143,108
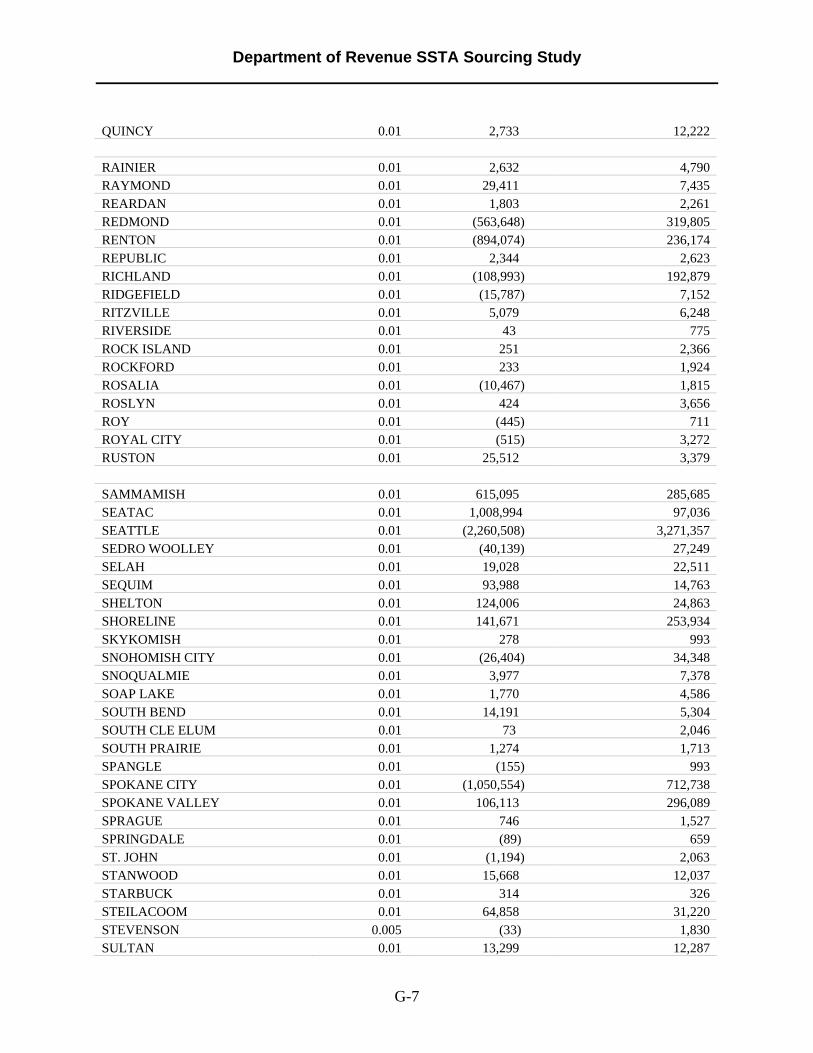
Department of Revenue SSTA Sourcing Study
G-7
QUINCY 0.01 2,733 12,222 RAINIER 0.01 2,632 4,790 RAYMOND 0.01 29,411 7,435 REARDAN 0.01 1,803 2,261 REDMOND 0.01 (563,648) 319,805 RENTON 0.01 (894,074) 236,174 REPUBLIC 0.01 2,344 2,623 RICHLAND 0.01 (108,993) 192,879 RIDGEFIELD 0.01 (15,787) 7,152 RITZVILLE 0.01 5,079 6,248 RIVERSIDE 0.01 43 775 ROCK ISLAND 0.01 251 2,366 ROCKFORD 0.01 233 1,924 ROSALIA 0.01 (10,467) 1,815 ROSLYN 0.01 424 3,656 ROY 0.01 (445) 711 ROYAL CITY 0.01 (515) 3,272 RUSTON 0.01 25,512 3,379 SAMMAMISH 0.01 615,095 285,685 SEATAC 0.01 1,008,994 97,036 SEATTLE 0.01 (2,260,508) 3,271,357 SEDRO WOOLLEY 0.01 (40,139) 27,249 SELAH 0.01 19,028 22,511 SEQUIM 0.01 93,988 14,763 SHELTON 0.01 124,006 24,863 SHORELINE 0.01 141,671 253,934 SKYKOMISH 0.01 278 993 SNOHOMISH CITY 0.01 (26,404) 34,348 SNOQUALMIE 0.01 3,977 7,378 SOAP LAKE 0.01 1,770 4,586 SOUTH BEND 0.01 14,191 5,304 SOUTH CLE ELUM 0.01 73 2,046 SOUTH PRAIRIE 0.01 1,274 1,713 SPANGLE 0.01 (155) 993 SPOKANE CITY 0.01 (1,050,554) 712,738 SPOKANE VALLEY 0.01 106,113 296,089 SPRAGUE 0.01 746 1,527 SPRINGDALE 0.01 (89) 659 ST. JOHN 0.01 (1,194) 2,063 STANWOOD 0.01 15,668 12,037 STARBUCK 0.01 314 326 STEILACOOM 0.01 64,858 31,220 STEVENSON 0.005 (33) 1,830 SULTAN 0.01 13,299 12,287
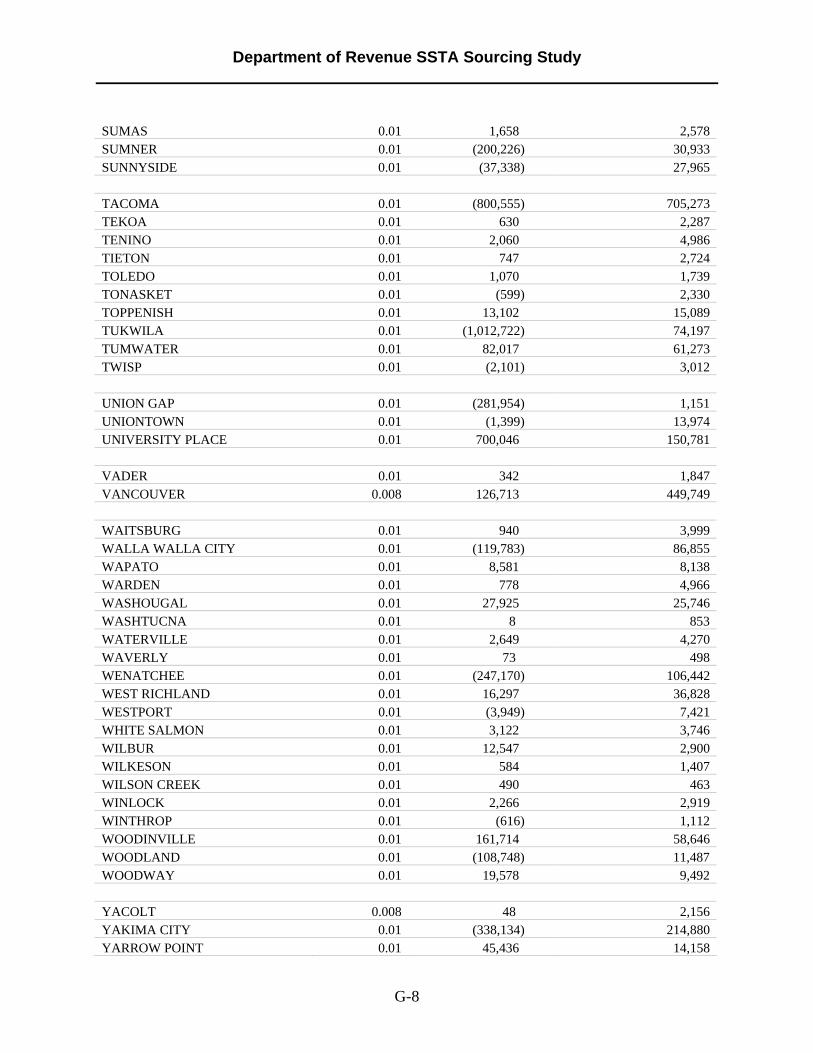
Department of Revenue SSTA Sourcing Study
G-8
SUMAS 0.01 1,658 2,578 SUMNER 0.01 (200,226) 30,933 SUNNYSIDE 0.01 (37,338) 27,965 TACOMA 0.01 (800,555) 705,273 TEKOA 0.01 630 2,287 TENINO 0.01 2,060 4,986 TIETON 0.01 747 2,724 TOLEDO 0.01 1,070 1,739 TONASKET 0.01 (599) 2,330 TOPPENISH 0.01 13,102 15,089 TUKWILA 0.01 (1,012,722) 74,197 TUMWATER 0.01 82,017 61,273 TWISP 0.01 (2,101) 3,012 UNION GAP 0.01 (281,954) 1,151 UNIONTOWN 0.01 (1,399) 13,974 UNIVERSITY PLACE 0.01 700,046 150,781 VADER 0.01 342 1,847 VANCOUVER 0.008 126,713 449,749 WAITSBURG 0.01 940 3,999 WALLA WALLA CITY 0.01 (119,783) 86,855 WAPATO 0.01 8,581 8,138 WARDEN 0.01 778 4,966 WASHOUGAL 0.01 27,925 25,746 WASHTUCNA 0.01 8 853 WATERVILLE 0.01 2,649 4,270 WAVERLY 0.01 73 498 WENATCHEE 0.01 (247,170) 106,442 WEST RICHLAND 0.01 16,297 36,828 WESTPORT 0.01 (3,949) 7,421 WHITE SALMON 0.01 3,122 3,746 WILBUR 0.01 12,547 2,900 WILKESON 0.01 584 1,407 WILSON CREEK 0.01 490 463 WINLOCK 0.01 2,266 2,919 WINTHROP 0.01 (616) 1,112 WOODINVILLE 0.01 161,714 58,646 WOODLAND 0.01 (108,748) 11,487 WOODWAY 0.01 19,578 9,492 YACOLT 0.008 48 2,156 YAKIMA CITY 0.01 (338,134) 214,880 YARROW POINT 0.01 45,436 14,158

Department of Revenue SSTA Sourcing Study
G-9
YELM 0.01 (2,002) 10,295 ZILLAH 0.01 8,500 7,008

Department of Revenue SSTA Sourcing Study
H-1
APPENDIX H
MITIGATION PRINCIPLES (Prepared by AWC and WSAC)
Association of Washington Cities Streamlined Sales Tax Principles – December 2003 Operating Principles
1. We support the general objectives of the Streamlined Sales Tax project, primarily the
application of sales tax to internet and catalog sales. 2. Those jurisdictions adversely impacted by State compliance with the SST agreement should
be compensated.
Mitigation Principles 1. The goal is to secure full reimbursement for those jurisdictions negatively impacted. 2. State resources should be used to offset the losses. 3. Implementation date may need to be moved beyond April 05. 4. Documented, not estimated, losses should be reimbursed. 5. Businesses may have to provide supplemental reports for some period of time to document
losses. 6. Maybe we phase in implementation in a fashion that allows us to collect data on actual
losses. 7. DOR needs to continue to study the issue with outside consultants and input from cities and
counties. Preliminary research indicates that 90 percent of the sales tax shift (in destination based sourcing) is a result of “warehousing” (manufacturing and distribution??) activity. If this is confirmed, future research should focus on the warehouse issue and refining this data.

Department of Revenue SSTA Sourcing Study
H-2
Washington State Association of Counties Negotiating Position – Sales Tax Sourcing Topic Position For or Against Support sourcing as long as it is accompanied with
adequate mitigation for local jurisdictions.
Funding for Mitigation Funding for the losers must come from the state, rather than the projected winners.
How to Calculate Mitigation Need Mitigation should be based on actual experience rather than current estimates.
Who Gets Mitigation? Counties, cities, transit districts, special districts (convention centers, etc.)
Mitigation Duration Economically distressed jurisdictions with significant losses need permanent mitigation. Other jurisdictions should be mitigated for a more limited period of time, perhaps tied to federal action on remote sales.
Priorities for Mitigation If necessary, mitigation should include a means test that includes sales, property and other taxes.
City Mitigation Support the efforts of AWC and its members to reach an agreement.
WSAC 12/03/03

Department of Revenue SSTA Sourcing Study
I-1
APPENDIX I
INTRASTATE AND INTERSTATE SOURCING LEGALITY MEMORANDUM
(Prepared by DOR)
One mitigation option offered by the advisory committee was to source intrastate sales according to current law, but source interstate sales according to Streamlined Sales and Use Tax Agreement sourcing rules. Other mitigation options require the redistribution of sales tax from one local jurisdiction to another local jurisdiction. These options raise federal and state constitutional issues that are not dispositive, but should be considered by policy makers. As with any piece of legislation, the Department will presume it is constitutional and implement it accordingly. However, the presumption of constitutionality must be evaluated in light of the limitations discussed in this memorandum. Intrastate and Interstate Sales The United States Constitution contains the Commerce Clause, which provides Congress the authority to “regulate Commerce…among the several States,” Article One, Section 8, clause 3. The Commerce Clause has also been interpreted as a negative command forbidding the states to discriminate against interstate trade. Thus, the United States Supreme Court has characterized the fundamental command of the Clause as being that “a State may not tax a transaction or incident more heavily when it crosses state lines than when it occurs entirely within the State,” Armco Inc. v. Hardesty, 467 U.S. 638, 642 (1984). Sourcing interstate and intrastate sales differently may result in different sales and use tax rates being applied to similar sales. For example, a person who lives in Lacey purchases a sofa from a furniture store in Olympia. The sofa will be delivered from a warehouse in Chehalis to the consumer’s home in Lacey. Under current law, the local sales tax generated from that purchase would be sourced to Chehalis, the location of the retail outlet from which delivery took place, and the combined local sales and use tax rate imposed on the sale would be 7.8 percent. If the same person purchased the item from an on-line furniture retailer, under the SSTA sourcing rules, the local sales and use tax would be sourced to Lacey, the point of delivery, at a combined local sales and use tax rate imposed on the sale would be 8.4 percent. There is concern that such a taxing system might be considered a violation of the Commerce Clause because it could result in different and higher tax rate being imposed on the interstate sales if remote sellers were required to collect sales and use taxes. This issue was considered by the United States Supreme Court in Associated Industries of Missouri v. Lohman, 511 U.S. 641, (1994). The Court found that the state of Missouri’s sales and use tax system violated the Commerce Clause because in some localities the use tax would exceed the sales tax. In striking down the tax scheme, the Court stated that common thread running through the cases upholding compensatory taxes is the equality of treatment between local and interstate commerce. When

Department of Revenue SSTA Sourcing Study
I-2
out-of-state goods brought into a jurisdiction and are subjected to a higher levy than are goods sold locally, the resulting disparity is incompatible with the Commerce Clause. Use of Local Taxes in Redistribution Article 11, section 12 of the state constitution prohibits the Legislature from imposing taxes upon local governments for local purposes, and requires the Legislature to vest in the local governments the power to assess and collect taxes for local purposes. The Legislature has vested in local governments the power to levy and collect sales and use taxes. The Department of Revenue collects local sales and use taxes for local governments pursuant to contract with the local governments. The taxes are distributed monthly by the state treasurer to the local governments imposing the tax. The current distribution is made without appropriation because the moneys are not state moneys in the state treasury but are local moneys held in trust for the local governments raising the tax. Additionally, Article 7, section 9 of the state constitution provides, in relevant part: “For all corporate purposes, all municipal corporations may be vested with authority to assess and collect taxes and such taxes shall be uniform in respect to persons and property within the jurisdiction of the body levying the same.” This constitutional provision requires, among other things, that taxes imposed by counties or other municipal corporations be expended only for corporate purposes. It can be argued that a proposal to divert the distribution of the local tax from the jurisdiction that levied the tax to another jurisdiction would change the nature of the tax from a local tax for a local purpose to a local tax for a state purpose. However, Article 11, section 12 has been held to allow local taxes for a state purpose if there is a special benefit to the local jurisdiction. A similar analysis would likely apply to challenges under Article 7, section 9. For example, Newman v. Schlarb, 184 Wash. 147 (1935) involved a challenge to a state law that required counties to levy taxes sufficient to produce five cents per day for each pupil in attendance in the common schools of the county. The contention was that the tax was a county tax imposed for a county purpose, and therefore, the Legislature had no power to require the imposition of the tax under Article 11, section 12. In upholding the tax, the court said at page 154:
The establishment and maintenance of public schools throughout the state is primarily and essentially a State purpose, from which local and special benefits are expected to, and do, flow to the counties and the various municipalities of the state. …These local subdivisions are created by the sovereign power of the state and under its paramount authority, with the view, not only of having them administer their own local and internal affairs, but also of having them carry out the policies of the state at large and assist in the accomplishment of the general purposes of the state. …Consequently, the state, through the Legislature, may not only require such subdivisions to levy taxes for public purposes, but may also fix the amount to be levied by them, provided that such purposes, though of a

Department of Revenue SSTA Sourcing Study
I-3
general nature and for the benefit of the whole people, result in special benefits to the particular subdivision. (Emphasis added.)
See also Clark v. Seiber, 48 Wn.2d 783 (1956) and Moses Lake Dist. v. Big Bend College, 81 Wn.2d 551 (1972). Conversely, in AGO 1988 No. 19, the Attorney General concluded that a county could not use its real estate excise tax revenues generated under RCW 82.46.010 to fund capital improvements of property owned by a city or other municipal corporation and not the county, absent any additional facts indicating that the improvements would serve a county purpose. The AGO noted that what qualifies as a “county purpose” cannot be defined with precision; however, the taxes should confer a direct benefit of reasonably general character to a significant portion of the county’s inhabitants. See Id. at 4. See also, Intermediate School District v. Yakima County, 81 Wn.2d 443 (1972).