streams & floods - kean university | world class educationkean.edu/~csmart/observing/13. streams...
TRANSCRIPT

Streams & Floods
IntroductionStream ProfileChannel MigrationDrainage NetworksStreamflowFloodsMississippi River FloodFlood ControlSummary
[The Grand Canyon] is, of course, altogether valueless. It can beapproached only from the south, and after entering it there is nothing to dobut leave. Ours has been the first, and will doubtless be the last, to visit thisprofitless locality. It seems intended by nature that the Colorado River,along with the greater portion of this lonely and majestic way, shall beforever unvisited and undisturbed..
Lieutenant Joseph Ives (1861)
One could almost say, then, that the history of the Colorado River contains ametaphor for our time. One could say that the age of great expectations wasinaugurated at Hoover dam - a fifty-year flowering of hopes when all thingsappeared possible. And one could say that amid the salt-encrusted sands ofthe river's dried up delta, we began to founder on the Era of Limits.
Marc Reisner

2
Introduction• A stream is a channel flow of any size.• Streams are responsible for many of our most spectacular
landforms.• The Colorado River is one of the most regulated streams in
the U.S.• Human actions have often caused changes in natural stream
flow.• By understanding stream actions and the factors that affect
stream flow we can make wiser land use decisions andprotect people from flooding.
A stream is a channel flow of any size. Geologists use the termstream to refer to the smallest creek or the largest river.Streams bring water to irrigate crops and to supply ourdomestic needs. We have dammed streams to create reservoirs,polluted waterways with industrial and agricultural wastes, andaltered stream channels to ensure ease of transportation. Inmodifying stream systems we have often discovered belatedlythat the original natural system worked best.
No U.S. stream is as regulated as the Colorado River (Fig. 1),an almost iconic feature of the western landscape. Steepcanyon walls along much of its length created a physicalbarrier for early travelers to whom the river represented atantalizing yet inaccessible water source. The canyon countryof the Southwest was among the last to be mapped in the U.S.The region was explored by Major John Wesley Powell, a one-armed U.S. Civil War veteran, and the first person to lead aparty of men through the treacherous rapids of the GrandCanyon in 1869. The river was increasingly eyed as a potentialwater supply source as population in the Southwest,particularly California, increased.
Rising above 3,000 meters (10,000 feet) in the shadow Long'sPeak, in Rocky Mountain National Park, Colorado, the riverflows west until it is joined by the Green River and turns southto carve a series of deep sinuous canyons in the arid plateaus ofsouthern Utah and northern Arizona (Fig. 1). The rivereventually finds the sea in the Gulf of California, forming abroad delta. The river drops over 3 km (2 miles) in elevationover its 2,320 km length (1,450 miles) with an averagegradient of a little over 1 meter per kilometer. The next sectionexamines the stream profile, how stream characteristicschange from the relatively steep and narrow channels near the

3
stream source to the gentle gradients and broad channels nearthe river's mouth.
Eventually, much of the lower course of the river was corralledbehind massive dams. Structures such as the Hoover Dam(Fig. 1) were among the largest constructed features in theworld at the time they were built. One consequence of dambuilding was the alteration of the physical environmentdownstream from the largest dams. Regulated flows are muchlower than the peak stream flow prior to dam construction.Under pre-dam conditions, spring floods eroded sand bars fromthe channel and formed beaches along the canyon walls. Therapid flows cleared the stream of obstructions created byboulders deposited at the mouths of tributary streams. These
Figure 1. Right:Map of theprincipalhydrologic featuresof the ColoradoRiver basin.Above: HooverDam, blocks theColorado Riveralong theNevada/Arizonaborder. LakeMead, thereservoir behindthe dam, is apopular recreationsite. Image courtesyof Bureau ofReclamation.

4
processes and the ecological environments they createddisappeared following dam construction.
In a spectacular experiment, scientists with the U.S. GeologicalSurvey utilized controlled floods downstream from GlenCanyon Dam to restore some of the pre-dam channelcharacteristics (Fig. 2). The sections on stream profiles andchannel migration investigate the role of stream velocity incontrolling erosion and deposition of sediment within andadjacent to stream channels.
The Colorado River drainage basin (Fig. 1), the area drainedby the river and its tributaries, occupies 626,777 squarekilometers (243,000 square miles) in seven states (Wyoming,Colorado, Utah, New Mexico, Arizona, Nevada, California).The basin has been artificially divided into two halves, theupper and lower Basins. The boundary between the basinscrosses the river at Lee's Ferry, a few miles downstream fromGlen Canyon Dam (Fig. 1). As the only major stream flowingthrough the southwest, the Colorado River represents a rarewater source in an otherwise dry land. Today water diversionstructures siphon off the river's water to ensure a steady supplyof water for cities as far away as San Diego and to providewater to irrigate the winter vegetable crops of the ImperialValley, southern California.
Figure 2. Above:Water pours fromfloodgates of GlenCanyonDam(above) during acontrolled floodingexperiment on theColorado River,1996. Imagecourtesy of USGS.Below: Change inchannel profiledownstream fromGlen Canyon dam(below) followingthe controlledflooding. Note, 2 to3 meters of sandfrom the channelfloor wasredeposited on thestream bank.Modified from anoriginal USGSfigure.

5
Natural variations in streamflow in the Colorado and otherrivers are monitored daily by a nationwide network of streamgaging stations. The section on streamflow examines howscientists measure variations in flow of streams and linksreaders to real-time data from online gaging stations for theCuyahoga River, northern Ohio.
Figure 3.Streamflowhydrographs forthe Colorado Riverat Lee's Ferrybefore (1957, top)and after (1997,bottom)construction ofGlen Canyon dam.Graph of 1983(middle) reflects asurge in flowfollowingexcessivesnowmelt.Data fromUSGS.

6
Variations in streamflow in the lower Colorado River(downstream from Lee's Ferry, Fig. 1) were minimizedfollowing construction of the big dams (Fig. 3). However, eventhe most regulated systems are subject to surprises. Heavierthan normal snowfall in the winter of 1982/1983 melted thefollowing spring causing a rapid filling of reservoirs on thelower Colorado. Discharge from Glen Canyon Dam had to beincreased to maximum capacity to avoid Lake Powell over-topping the dam and causing it to fail (see 1983 graph, Fig. 3).As it was, the increased flow ripped out chunks of bedrockfrom spillway tunnels, threatening the survival of the dam.Rapid snowmelt is one cause of flooding, others are describedin the section on floods and the widespread Mississippi Riverflood, 1993, the most devastating flood in U.S. history, issingled out for special attention in a separate section.
Large dams are effective agents for flood control as long asfloodwaters can be stored in reservoirs to be released slowlywhen the threat of flooding has receded. This plan works aslong as there is sufficient storage capacity to accommodateexcess runoff. Dams and other flood control structures werebuilt along the lower Colorado River to generate hydroelectricpower, provide a stable water supply, create reservoirs forrecreation, and to protect against potential floods.
Flooding wouldn't seem to be a big issue in the desertSouthwest but the entire flow of the Colorado broke through anirrigation canal in 1905 and was redirected into the ImperialValley in southern California. The floods turned the low-lyingSalton sink into the Salton Sea (Fig. 4), forming an inland lakethat evaporation has subsequently rendered saltier than thenearby Gulf of California. The Salton Sea is the largest body ofwater in California. Another major flood in the lower Coloradoin 1916 prompted the initial steps toward construction of theHoover Dam (Fig. 1). Construction of the dam, the first majordam on the river, began in 1933 and was completed in 1935. Figure 4. The
Salton Sea wasformed as a resultof flooding of alow-lying area insouthern Californiaby the ColoradoRiver in 1905.Image from USBRLower ColoradoRegional officephoto library.

Today the water of the Colorado River does not reach its delta.Water is extracted through irrigation canals (Fig. 5) andaqueducts to supply agriculture and cities both within andbeyond the river basin. So much water is removed that themodest remainder evaporates in the desert of northern Mexicoshort of the Gulf of California.
Figure 5. Irrigationcanal, southernArizona. Similarcanals transportwater from theColorado River toirrigate fieldsthroughout Arizonaand southernCalifornia. Imagefrom the Bureau ofReclamation's LowerColorado Regionaloffice photo library.
Think about it . . .Create a concept map that illustrates the potential historyof precipitation falling as snow in a mountainous area inthe watershed (drainage basin) of the Colorado River.
7
Stream Profile• Stream gradient represents the change in elevation of a
stream over a given horizontal distance.• Stream gradient decreases downstream.• High-gradient streams often occupy steep-walled V-shaped
valleys.• Low-gradient streams are characterized by broad curves
called meanders.• Velocity decreases as the length of the wetted perimeter
(channel banks and bed) increases.• A floodplain is a broad, flat plain adjacent to a stream
channel.• Riparian wetlands are located on floodplains alongside
stream channels.• Streams deposit sediment to form a delta when velocity
decreases

8
Stream gradient, the change in elevation over a specifichorizontal distance, gradually decreases along the length of astream channel (Fig. 6). The steepest gradients are found insteep-sided mountain stream valleys that may drop 40 to 60meters per kilometer (210-320 feet/mile). Streams at lowerelevations typically have a sinuous course characterized bynumerous broad curves (meanders). Streams approaching theriver mouth may decrease in elevation by as little as a fewcentimeters over 1 kilometer. The rapids downstream fromLee's Ferry in the lower Colorado River mark a segment of thestream channel with a gradient of 4 meters per kilometer. Incontrast, near the river's mouth the gradient diminishes to agentle 0.1meter per kilometer.
If all other factors were equal, stream velocity would begreatest in streams with the steepest gradients. However, thesestreams are also characterized by boulder-strewn channels thatgenerate turbulence and frictional drag on stream flow,lowering stream velocity. This characteristic is channelroughness (Fig. 7). The irregular flow generated byobstructions in the stream channel is the principal reason thatflow in high-gradient stream channels has lower velocity thanflow in the meandering channel of a stream's lower coursewhere channel roughness is at a minimum.
The channel banks and bed in contact with the stream aretermed the wetted perimeter (Fig. 7). The frictional effects ofdrag from the wetted perimeter reduce stream velocity. If allother factors are equal, the channel with the smallest wettedperimeter will exhibit the highest stream velocity. The wettedperimeter length can vary for streams with similar crosssectional areas. Typically, deep narrow channels will have
Figure 6.Variations ingradient in astream channel.Maximum gradientoccurs inmountainous areaslocated near thesource; minimumgradient at thestream mouth.

9
longer perimeters than broad shallow channels (Fig. 7). Streamvelocity increases downstream even as stream gradientdecreases. Velocity increases because stream size increasesbecause of the addition of water from tributary streams and therelative length of the wetted perimeter decreases.
Broad flat lands alongside the stream channel are termedfloodplains. Floodplains have often been considered primesites for development (Fig. 8) because of their low relief, fertilesoils, and ready access to water. Today floodplains are home tomore people and development than ever before. Modernweather satellites and stream monitoring techniques can helpprotect people's lives but the damage caused by flooding hasincreased in step with population.
All streams transport sediment (Fig. 9); the muddier the streamthe greater the sediment load. Sediments are deposited whenstream velocity drops. Streams with high sediment loads mayform braided channels as sediment is deposited to form sandbars and islands that divide the main channel into multiplesmaller channels (Fig. 9).
The Mississippi delivers 200 million tons of sediment to theGulf of Mexico each year. Rivers dump much of their sedimentwhere they enter the relatively quiet waters of an ocean or lake;
Figure 7. Right:Turbulent flow in asteep gradientmountain stream.Left: Variation inlength of thewetted perimeter(wp) with shape ofchannel. Channelshave the samecross sectionalarea (3,600 squareunits) but differentwp lengths.
Figure 8.Pittsburgh,Pennsylvania,located on thefloodplain at theconfluence of theOhio (foreground),Allegheny (left),and MonongahelaRivers. Imagemodified fromoriginal at U.S. ArmyCorps of EngineersDigital ImagesLibrary.

10
the landform that is created is a delta (Fig. 10). The form of thedelta is largely dependent on the volume of transportedsediment and the actions of coastal currents that mayredistribute the sediment.
Figure 9. View ofthe confluence ofAmazon River andRio Negro inAmazon basinnear Manaus,Brazil. Note thecontrast betweenthe brownsediment-ladenAmazon River andits darkersediment-litetributary. Flow isfrom bottom ofimage toward thetop. Original imagecourtesy of NASA.
Figure 10.Mississippi Riverdelta, Louisiana.Note plume ofsediment (whiteline) dumped bythe distributarychannels that forma "bird's-foot"delta. Constantdredging isrequired foroceangoing shipsto navigate themain channel ofthe river. Click onimage for largerview. Original imagecourtesy of NASA.
11
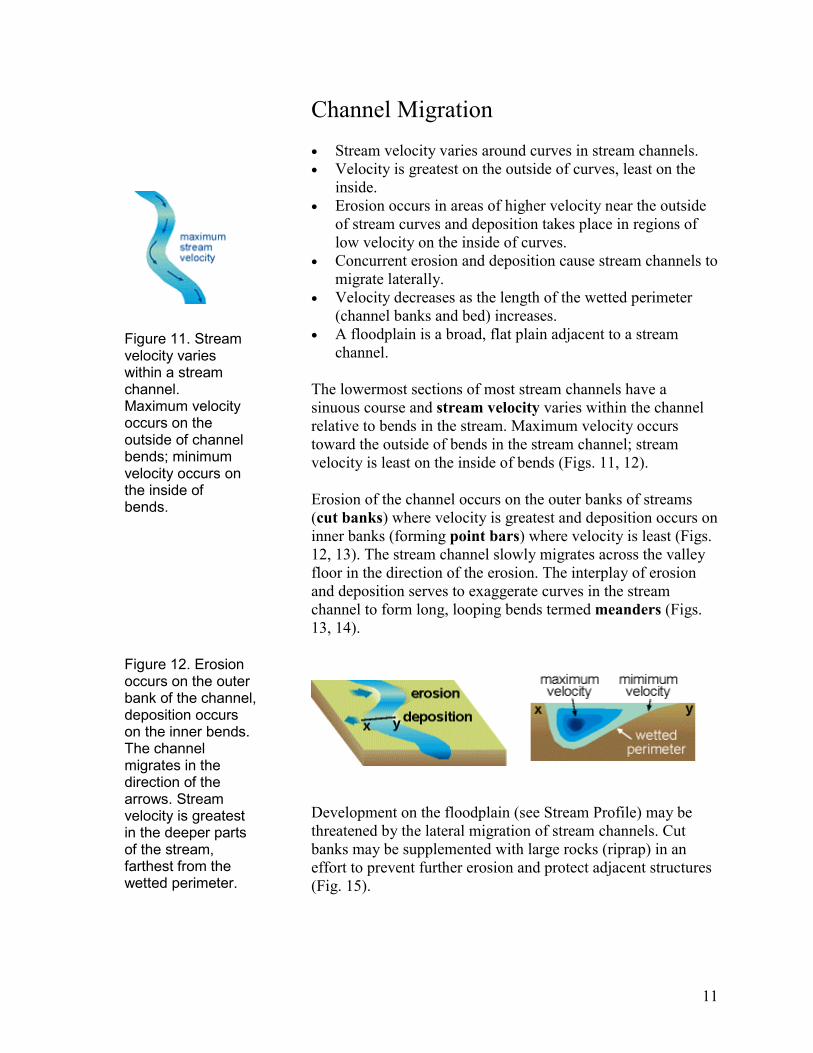
Channel Migration• Stream velocity varies around curves in stream channels.• Velocity is greatest on the outside of curves, least on the
inside.• Erosion occurs in areas of higher velocity near the outside
of stream curves and deposition takes place in regions oflow velocity on the inside of curves.
• Concurrent erosion and deposition cause stream channels tomigrate laterally.
• Velocity decreases as the length of the wetted perimeter(channel banks and bed) increases.
• A floodplain is a broad, flat plain adjacent to a streamchannel.
The lowermost sections of most stream channels have asinuous course and stream velocity varies within the channelrelative to bends in the stream. Maximum velocity occurstoward the outside of bends in the stream channel; streamvelocity is least on the inside of bends (Figs. 11, 12).
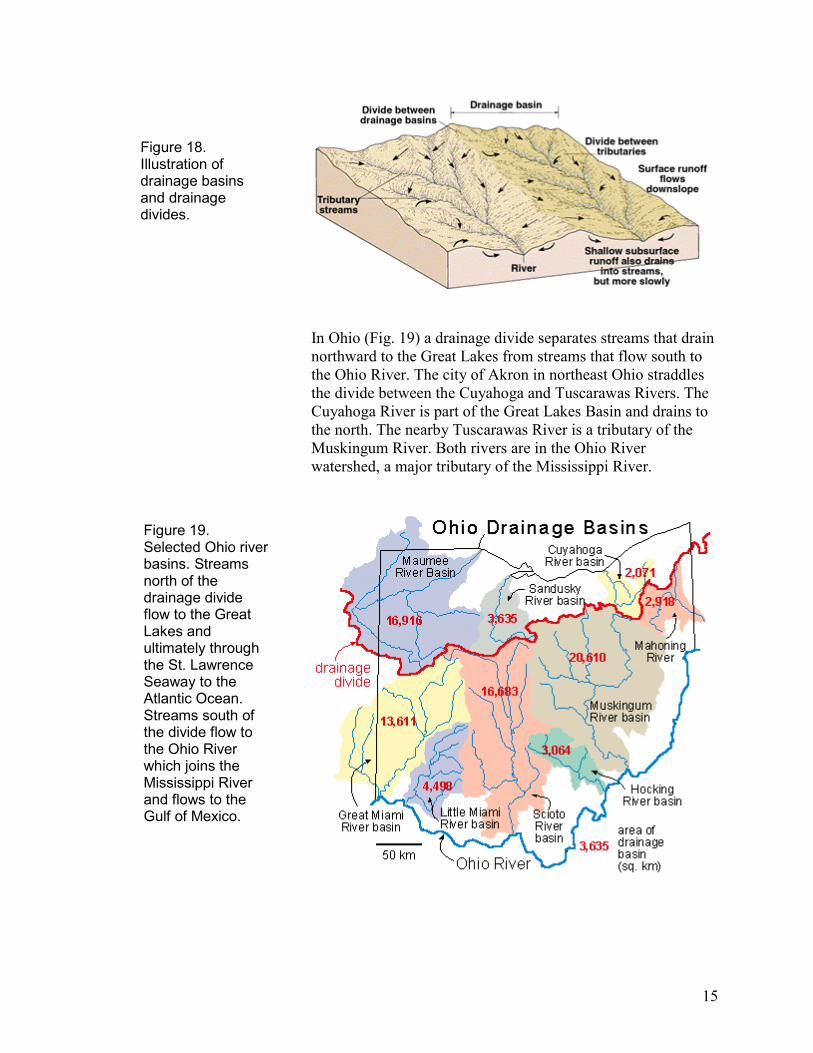
Erosion of the channel occurs on the outer banks of streams(cut banks) where velocity is greatest and deposition occurs oninner banks (forming point bars) where velocity is least (Figs.12, 13). The stream channel slowly migrates across the valleyfloor in the direction of the erosion. The interplay of erosionand deposition serves to exaggerate curves in the streamchannel to form long, looping bends termed meanders (Figs.13, 14).
Development on the floodplain (see Stream Profile) may bethreatened by the lateral migration of stream channels. Cutbanks may be supplemented with large rocks (riprap) in aneffort to prevent further erosion and protect adjacent structures(Fig. 15).
Figure 11. Streamvelocity varieswithin a streamchannel.Maximum velocityoccurs on theoutside of channelbends; minimumvelocity occurs onthe inside ofbends.
Figure 12. Erosionoccurs on the outerbank of the channel,deposition occurson the inner bends.The channelmigrates in thedirection of thearrows. Streamvelocity is greatestin the deeper partsof the stream,farthest from thewetted perimeter.

12
Figure 13.Deposition anderosion around acurve in a smallstream inWyoming, showingrelative positionsof point bars, cutbanks andmaximum streamvelocity (bluearrows) in astream channel.
Figure 14. Fourstages in thelateral migration ofa stream channel.The meander bendgrows relativelyslowly (top left totop right). As theneck between theopposite banksnarrows (bottomleft) the streamcuts across theneck (bottomright), abandoningthe curve as an ox-bow lake.
Figure 15. Riprap(gray rocks) placedalong the outsideof a meander bendin the CuyahogaRiver to preventerosion of thestream bank andundermining of theadjacent road.Photograph takenduring high flow.

Channel migration occurs by a combination of two processes,accretion and avulsion (Fig. 16). Accretion allows the pointbars to grow slowly as the meander bend becomes moreexaggerated. Avulsion results in rapid, dramatic changes whenthe river cuts through the narrow neck of a fully developedmeander.
The law recognizes that it is unrealistic to try to compensateowners for the slow loss of land by erosion on the outer banksof meanders. The lost soil would be transported downstreamand added to someone else's property along a point bar. Itwould be impossible to trace the constituent parts and to layclaim to them once they settled on a channel bank furtherdownstream. This is the rule of accretion and applies asmeander bends progressively migrate across valley floors. Incontrast, the rule of avulsion concedes that ownership of landoriginally encircled by a meander does not change if a suddenshift in the stream channel isolates the property on the oppositebank of the stream.
Figure 16. Accretionand avulsion of theCuyahoga Riverchannel, northeastOhio. The borderbetween CuyahogaCounty and SummitCounty isrepresented in partby the CuyahogaRiver. The originalcounty line waslocated in the centerof the streamchannel. Accretion(ac) has movedsome parts of thechannel over 30 feetto the north (~0.3m/yr) and avulsion(av) has cut off anarrow south-facingmeander loop.
Think about it . . .1. Complete the Venn diagram found at the end of the
chapter to compare and contrast the characteristicsof streams near their origins and near their mouths.
2. Examine the image of the lower course of theMississippi River at the end of the chapter and makesome interpretations and predictions about the pastand future path of the river.
13

14
Drainage Networks• The area drained by a stream and its tributaries is a
drainage basin or watershed.• The Mississippi River drainage basin covers approximately
half of the conterminous U.S.• Drainage basins are separated by high ground termed a
divide.• Drainage patterns are governed by the underlying geology
of a region.
Approximately two-thirds (68%) of Earth's land surfacecontains rivers that drain to the ocean. Land that ispermanently covered by ice (Antarctica) or that is characterizedby hot, dry deserts typically lack stream systems.
A drainage basin or watershed is the area drained by a streamand its tributaries (Fig. 17). The size of the drainage basintypically increases as the size of the stream increases. Thedrainage basin for the Mississippi River occupiesapproximately half the land area of the U.S. The two principaltributaries of the Mississippi are the Missouri and Ohio Rivers.The drainage basins for each of these (and other) rivers areincluded within the larger Mississippi drainage basin (Fig. 17).
The Mississippi River is separated from streams that drain tothe west by a drainage divide represented by the RockyMountains. Streams west of the Rockies flow to the PacificOcean or Gulf of California. Streams in the eastern U.S. flowto the Gulf of Mexico or the Atlantic Ocean. Drainage dividesseparate neighboring drainage basins (Fig. 18).
Figure 17.Diagram ofdrainage basins formajor tributarystreams to theMississippi River.Image modified froma map at theNational WatershedNetwork.
15
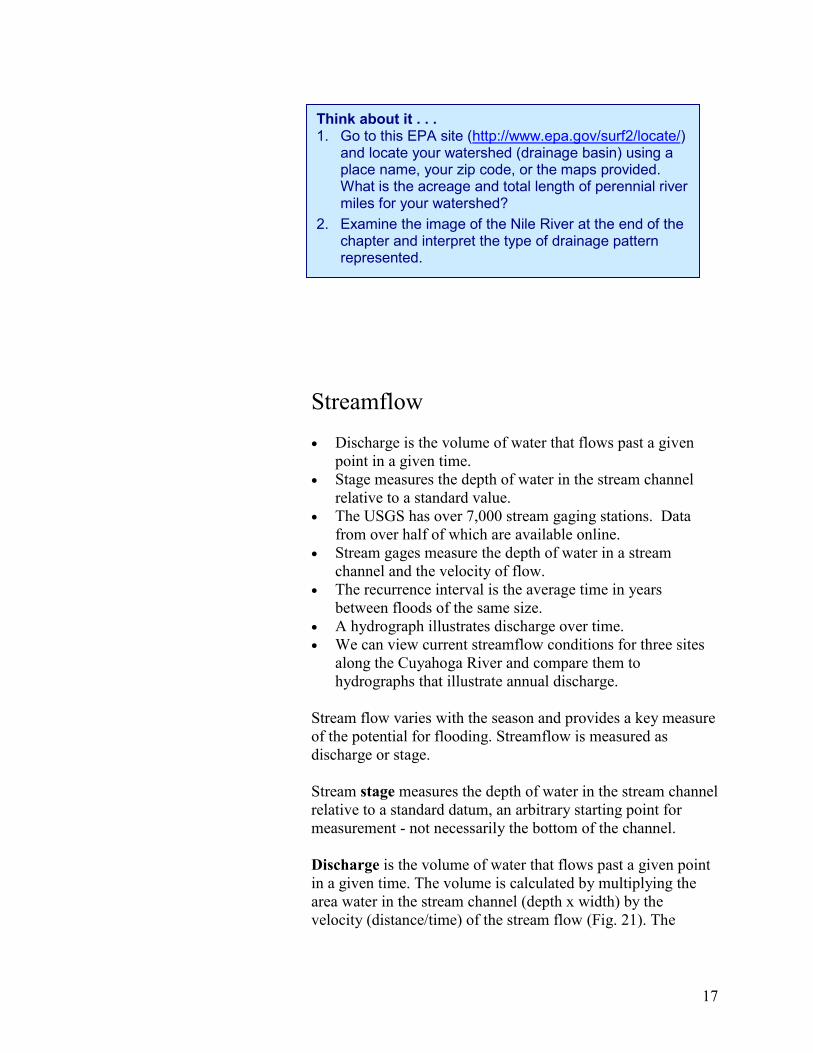
In Ohio (Fig. 19) a drainage divide separates streams that drainnorthward to the Great Lakes from streams that flow south tothe Ohio River. The city of Akron in northeast Ohio straddlesthe divide between the Cuyahoga and Tuscarawas Rivers. TheCuyahoga River is part of the Great Lakes Basin and drains tothe north. The nearby Tuscarawas River is a tributary of theMuskingum River. Both rivers are in the Ohio Riverwatershed, a major tributary of the Mississippi River.
Figure 18.Illustration ofdrainage basinsand drainagedivides.
Figure 19.Selected Ohio riverbasins. Streamsnorth of thedrainage divideflow to the GreatLakes andultimately throughthe St. LawrenceSeaway to theAtlantic Ocean.Streams south ofthe divide flow tothe Ohio Riverwhich joins theMississippi Riverand flows to theGulf of Mexico.

16
Drainage PatternsThe pattern of drainage in a basin is largely determined by theunderlying geology (Fig. 20). Streams typically follow the pathof least resistance, forming valleys where rock is most readilyeroded or following the steepest slope gradient. Consequently,stream patterns often provide clues to the geology of thedrainage basin. Dendritic drainage is characteristic of areaswhere the geology is relatively uniform, for example, whererock layers are horizontal. Dendritic patterns are typical ofOhio streams and of much of the Colorado River basin (Fig. 1).Streams intersect with a characteristic V-pattern in map view indendritic drainage systems. The tip of the V pointsdownstream.
Streams intersect at right angles in both trellis and rectangulardrainage patterns. Trellis drainage is characteristic of areaswith alternating parallel valleys and ridges (e.g., centralPennsylvania). Streams occupy the valleys, flowing parallel tothe ridges but occasionally cutting across the geologic grain atwater gaps. Rectangular patterns distinguish regions where thebedrock exhibits well-developed joints or fractures. Thestreams exploit the fractures as lines of weakness. Finally,radial drainage patterns are typically found on the slopes ofvolcanoes, where streams flow downslope, parallel to the slopegradient.
Figure 20. The fourprincipal types ofdrainage patternare related to theunderlying regionalgeology.
Think about it . . .1. Go to this EPA site (http://www.epa.gov/surf2/locate/)
and locate your watershed (drainage basin) using aplace name, your zip code, or the maps provided.What is the acreage and total length of perennial rivermiles for your watershed?
2. Examine the image of the Nile River at the end of thechapter and interpret the type of drainage patternrepresented.
17
Streamflow• Discharge is the volume of water that flows past a given
point in a given time.• Stage measures the depth of water in the stream channel
relative to a standard value.• The USGS has over 7,000 stream gaging stations. Data
from over half of which are available online.• Stream gages measure the depth of water in a stream
channel and the velocity of flow.• The recurrence interval is the average time in years
between floods of the same size.• A hydrograph illustrates discharge over time.• We can view current streamflow conditions for three sites
along the Cuyahoga River and compare them tohydrographs that illustrate annual discharge.
Stream flow varies with the season and provides a key measureof the potential for flooding. Streamflow is measured asdischarge or stage.
Stream stage measures the depth of water in the stream channelrelative to a standard datum, an arbitrary starting point formeasurement - not necessarily the bottom of the channel.
Discharge is the volume of water that flows past a given pointin a given time. The volume is calculated by multiplying thearea water in the stream channel (depth x width) by thevelocity (distance/time) of the stream flow (Fig. 21). The

18
dimensions of the stream channel are expressed in feet ormeters and velocity is measured in feet or meters per second.Consequently the units of discharge are cubic meters (or feet)per second, i.e., discharge is the volume (cubic meters or cubicfeet) of water that passes a given point in one second.
A record of "normal" stream flow is required to understand thepotential risk from flooding. The United States GeologicalSurvey (USGS) records stream flow conditions from over7,000 gaging stations (Fig. 22) across the country (go here for amap showing locations of U.S. gaging stations). Data fromover 4,000 of these stations is relayed back to the USGS usingsatellites. Stream gages measure the depth of water in a streamchannel and the velocity of flow.
Data on stream stage is relatively straightforward to collect,because it simply requires knowledge of the height (depth) ofwater in the stream channel. Information on discharge isaffected by stream width, a factor that is not measured by thegages. Discharge is typically estimated from establishedstage/discharge relations. Gaging station locations aremeasured periodically to ensure the stream width has remaineduniform.
Figure 21. Right:Discharge can becalculated bymultiplying the areaof the streamchannel (width xdepth) by thedistance traveled ina given time(velocity). Left:Measurements ofstage and dischargecan be used toconstruct a stage-discharge plot.Stage readings arethen converted todischarge valuesusing the graphdata. Graph modifiedfrom original at USGS.
Figure 22. A streamgage installation onthe Cuyahoga River,Akron, Ohio. Viewdownstream fromgage (left). Streamgage instrument(right) updatesstreamflow dataseveral times eachday via satellite.

19
During the massive 1993 Mississippi flood, new maximumvalues were established for discharge at 36% of the gagingstations in the flooded area and for flood stage at 47% of thestations. More stations recorded higher flood stages becausechannels had been altered to protect surrounding areas fromflooding. Many of the alterations created narrower streamchannels resulting in greater depths for similar dischargevalues.
The recurrence interval is the average time in years betweenfloods of the same size (Fig. 23). Knowledge of how frequentlylarge floods will occur provides agencies the opportunity toconstruct structures of sufficient scale to prevent future flooddamage. However, city planners should also realize thatrecurrence intervals are only averages. A 100-year floodhappens on average once every 100 years but from 1800-2000,two "one-hundred year" floods could have occurred in 1899and 1901, or in 1801 and 1999.
Historical stream flow data are available for all gaging stations.Even though the length of the record varies the data can beused to illustrate seasonal or annual variability of discharge. Agraph that illustrates discharge over time is termed ahydrograph (Fig. 24).
Figure 23.Scientists canuse graphs ofmaximum streamdischarge vs.recurrenceinterval toestimate thedischarge of 100-year floods.

20
Cuyahoga River: Current ConditionsCurrent stream flow conditions are measured several times aday at three gaging stations along the Cuyahoga River (Fig. 25;Hiram Rapids, Akron, Independence). Visit each station’swebsite and complete the information requested. Each sitecontains graphs that display streamflow (discharge) and stagefor the last week, and tables of data on historical flow and stagevalues.
Figure 24.Hydrograph ofdischarge atAkron, Ohio,gaging station onthe CuyahogaRiver from January1992 to December1996. Note thatdischarge peaks inlate winter/earlyspring, andminimum flowsoccur during thesummer.Discharge ismeasured in cubicfeet per second(CFS).
Figure 25.Locations of threestream gagingstations on theCuyahoga River,Ohio, that providereal-time onlinedata onstreamflow.

F•
•
•
•
InAa(F
Think about it . . .1. What is the discharge of a stream in a rectangular
channel that is 10 meters wide, 6 meters deep, 40kilometers long, and has a velocity of flow of 5 metersper second?a) 21 cubic meters per secondb) 300 cubic meters per secondc) 1200 cubic meters per second d) 2400 cubic meters per second
2. Go to the USGS real-time water data page located athttp://water.usgs.gov/realtime.html, select the "statemap" option (look left, under map), click on your stateand find the nearest stream gaging station to yourlocation.
3. Try the Virtual River - Discharge exercise(http://vcourseware4.calstatela.edu/VirtualRiver/index.html) that provides a detailed discussion ofstreamflow and guides users through thedetermination of stream discharge. Print thecertificate upon completion of the exercise.
21
loodsDischarge is the volume of water that flows past a givenpoint in a given time.A flood is the temporary overflow of a river onto adjacentlands not normally covered by water.The 1993 Mississippi flood was the worst in U.S. historyand covered 17,000 square miles in nine states.Many factors may contribute to flooding, for example,torrential rains or prolonged steady precipitation, rapidsnowmelt, saturated ground, urbanization, alteration ofnatural systems, collapse of manufactured structures.
troduction riverine flood may be defined as the temporary overflow of river onto adjacent lands not normally covered by waterig. 26). This definition does not take into account coastal

22
flooding resulting from storm surges associated with hurricanesor tropical storms. Floods can happen anywhere. Some of thecounties with the most flood declarations are located in aridsouthwestern states (Fig. 27) where floods are more likely toresult from brief intense storms rather than prolonged rainfall.Flooding is related to the magnitude and timing ofprecipitation, evaporation rates, the characteristics ofsnowmelt, the capability of the ground to absorb water, andmodifications of the physical landscape.
The most devastating flood in U.S. history occurred in thesummer of 1993 when all large midwestern streams (includingthe Mississippi, Missouri, Kansas, Illinois, Des Moines, andWisconsin Rivers) overflowed their banks (Fig. 28). Seventeenthousand square miles of land were covered by floodwaters in aregion covering all or parts of nine states (North Dakota, South
Figure 26. Aerialview of floodingalong the OhioRiver at Cincinnati,Ohio. Imagecourtesy of FEMA.
Figure 27. Map ofU.S. flood disasterdeclarations bycounty. Flooddeclarations arecommon in NorthDakota andMinnesota alongthe Red Rivervalley and alongthe UpperMississippi River inIowa and Illinois.Image courtesy ofFEMA.

23
Dakota, Nebraska, Kansas, Missouri, Iowa, Wisconsin,Minnesota, Illinois).
Causes of FloodingFloods occur where water on the land surface exceeds thevolume of water that can be transported in stream channels andabsorbed by the surrounding soil. The sudden addition of largevolumes of water from heavy storms is the most commoncause of flooding (Fig. 29).
Alternatively, if the long-term precipitation is greater thannormal the streamflow will gradually increase until floodingoccurs. Midwestern states received higher-than-normalprecipitation prior to the 1993 Mississippi flood (Fig. 30).Much of the area received over 150% of normal rainfall andparts of North Dakota, Kansas, and Iowa received more than
Figure 28. Area ofthe Mississippidrainage basinaffected by 1993floods on theMississippi andMissouri Riversand theirtributaries.
Figure 29.Distribution andmagnitude ofprecipitationassociated with asingle storm oversouthern Iowa,July 4 and 5, 1993.

24
double their typical rainfall. The excess precipitation filledstorage reservoirs and saturated the ground throughout theMidwest.
Heavy precipitation in the form of snow and ice may simplydelay the flooding until temperatures rise sufficiently to causerapid snowmelt. An abrupt prolonged rise in temperaturesmay be all that is necessary to cause widespread flooding. Theeffects of flooding are exaggerated when broken ice blocksform ice dams that block the stream channel. This situation isespecially true for north-flowing streams because upstream(southern) meltwaters may rise when blocked by downstream(northern) ice dams. The spring 1997 flood of the Red Riverwas caused by unseasonally high temperatures and submergedtowns in Minnesota and North Dakota before flowing northinto Canada.
Some precipitation will be absorbed by soils and will infiltrateinto the earth to be taken up by plants or to add to thegroundwater system. However, if the ground is saturated theexcess water will be added to stream discharge. During the1993 flood (Fig. 31), much of the midwestern lands werealready saturated because of cooler-than-normal conditionsduring the previous year (less evaporation) so less rainfall wasabsorbed by soils and more ranoff into streams.
Figure 30. Left:Graph of monthlyrainfall for CedarRapids, Iowa. Right:Comparison ofprecipitation withaverage rainfall inmidwestern statesfor January-July1993.
Figure 31. Missourifarm flooded byMississippi River.Image courtesy ofFEMA.

Construction of roads and buildings results in paving over ofnatural surfaces with an artificial impervious cover designedto rapidly transport rainfall through storm sewers to streams.In addition, development may also replace natural wetlandreservoirs with agricultural fields or housing projects. Riverinewetland systems act as storage reservoirs for floodwaters.Wetlands absorb floodwaters and release them slowly after theflood crest has passed. Much of the Mississippi river systemhad been altered over the previous century by the draining ofwetlands. States bordering the Mississippi River have lost two-thirds of their original wetlands; Iowa has lost 89% of itsnatural wetlands, mostly to agriculture.
Finally, the collapse of constructed dams has resulted indisastrous floods around the world. Flooding following thecollapse of a dam in Johnstown, Pennsylvania, on May 31,1889, killed over 2,200 people. Several days of heavy rainscaused a series of dams to burst causing widespread flooding inHenan Province, China in August 1975. Estimates are that asmany as a quarter of a million people were drowned or diedfrom disease or starvation following the floods. The flood waskept secret by the Chinese government for the next 20 years.
/
Think about it . . .Try the on-line Virtual River - Flooding exercise(http://vcourseware4.calstatela.edu/VirtualRiver/Floodingindex.html) that provides a detailed discussion of factorsassociated with flooding. Print the certificate uponcompletion of the exercise.
25
Mississippi River Flood, 1993• The 1993 Mississippi flood was the worst in U.S. history
and covered 17,000 square miles in nine states.• Flooding was caused by abnormal weather patterns
resulting in higher-than-normal rainfall over the Midwestthrough June and July.

26
• Flooding occurred along the Upper Mississippi River basin,between the river's source and the confluence with the OhioRiver south of St. Louis.
• Flooding did not occur in the Lower Mississippi River as itis much wider and was supplied by tributaries from areaswith less rainfall.
• Forty-eight people died because of the effects of theflooding and damages where estimated as $15 to 20 billion.
IntroductionThe most devastating flood in U.S. history occurred in thesummer of 1993 when many of the largest midwestern streamsin the Missouri and Upper Mississippi drainage basinsoverflowed their banks. Damages from the flood event wereestimated at $21 billion. All large midwestern streamsincluding the Mississippi, Missouri, Kansas, Illinois, DesMoines, and Wisconsin Rivers flooded. Over seventeenthousand square miles of land were covered by floodwaters in aregion covering all or parts of nine states (Fig. 28; NorthDakota, South Dakota, Nebraska, Kansas, Missouri, Iowa,Wisconsin, Minnesota, Illinois).
Weather ConditionsThe abnormal rainfall was attributed to a weather systemformed when warm moist air from the Gulf of Mexico collidedwith cold, dry air from Canada over the Midwest. When thewarm Gulf air cooled it lost the moisture it carried as rain.Normally this rainfall would have been distributed throughoutthe northeastern states but a stalled high-pressure system overthe Southeast blocked the flow of the jet stream bringing a
Figure 32.Weatherconditions formidwesternflooding, latespring and earlysummer, 1993.
27
constant stream of storms over the Midwest (Fig. 32). Fornearly two months (June, July) weather patterns in the U.S.were dominated by this stationary high-pressure system.
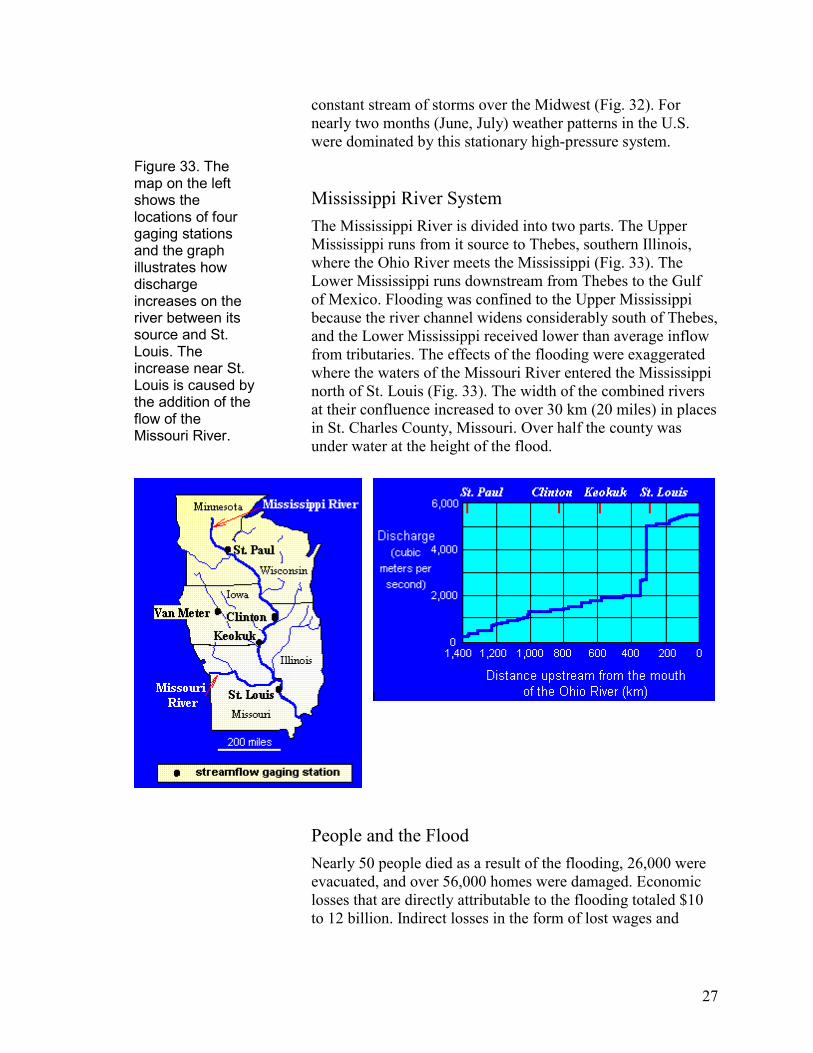
Mississippi River SystemThe Mississippi River is divided into two parts. The UpperMississippi runs from it source to Thebes, southern Illinois,where the Ohio River meets the Mississippi (Fig. 33). TheLower Mississippi runs downstream from Thebes to the Gulfof Mexico. Flooding was confined to the Upper Mississippibecause the river channel widens considerably south of Thebes,and the Lower Mississippi received lower than average inflowfrom tributaries. The effects of the flooding were exaggeratedwhere the waters of the Missouri River entered the Mississippinorth of St. Louis (Fig. 33). The width of the combined riversat their confluence increased to over 30 km (20 miles) in placesin St. Charles County, Missouri. Over half the county wasunder water at the height of the flood.
People and the FloodNearly 50 people died as a result of the flooding, 26,000 wereevacuated, and over 56,000 homes were damaged. Economiclosses that are directly attributable to the flooding totaled $10to 12 billion. Indirect losses in the form of lost wages and
Figure 33. Themap on the leftshows thelocations of fourgaging stationsand the graphillustrates howdischargeincreases on theriver between itssource and St.Louis. Theincrease near St.Louis is caused bythe addition of theflow of theMissouri River.

28
production cannot be accurately calculated. The consequencesof flooding were determined by land use patterns.
• The greatest economic losses occurred in cities on thefloodplain. Des Moines, Iowa, located in the center of theflood region, became the largest U.S. city to lose its watersupply when its water treatment plant flooded. More than250,000 people lost drinking water for 12 hot summer days.Water pipes, contaminated by floodwaters carrying sewageand agricultural chemicals, had to be flushed out before themunicipal water supply was reconnected. Economic lossesin Des Moines totaled approximately $716 million.
• Hundreds of miles of roads built on the flat, widefloodplain were closed (Fig. 34). Flooding is estimated tohave cost $500 million in road damage.
• The flooding submerged eight million acres of farmland(Fig. 35). Production of corn and soybeans were down 5 to9% as a result and corn prices rose by $0.15 per bushel.Floods deposited thick layers of sand in some fields. TheU.S. Soil Conservation Service spent $25 million to buyflood-prone farmlands for conversion to natural conditions(e.g., wetlands). Conversion of natural lands to farmlands
Figure 34.Flooding alongMississippi Riverat Quincy, Illinois,closed two bridgesconnecting Illinoisand Iowa. Imagecourtesy of FEMA.
Figure 35. Corncrop destroyed byflooding, Missouri.Image courtesy ofFEMA.

has resulted in greater runoff and exaggerated the effects offlooding. Modern farming methods leave plant residue onthe surface and reduce runoff.
• The Mississippi River itself is a crucial part of theMidwest’s economic infrastructure. Barge traffic normallymoves goods through a system of 29 locks betweenMinneapolis and St. Louis. Barges carry 20% of thenation’s coal, a third of its petroleum, and half of itsexported grain (Fig. 36). Barge traffic was halted for twomonths because of flooding; carriers lost an estimated $1million per day. Some power plants along the river sawtheir coal stocks dwindle from a two-month supply toenough to last just 20 days.
Figure 36. Bargetraffic on theMississippi River.Image courtesy ofthe U.S. Army Corpsof Engineers DigitalImages Library.
Think about it . . .Use peak flow data for the Mississippi River at Keokuk,Iowa, to estimate the recurrence interval for the 1993flood event. Go to the end of the chapter to complete theexercise.
29
Flood Control• Two strategies for protecting people and property from
flooding are prevention and adjustment.• Prevention is the attempt to stop flooding from taking place
by building structures in the floodplain to controlstreamflow.

30
• Engineers have attempted to control the flow of rivers byconstructing levees or diversion channels, and buildingreservoirs to store floodwaters.
• Adjustment recognizes that flooding is inevitable andchanges human activity to lessen the impact of floods.
• Adjustment measures include purchasing flood insurance orseeking help from the Federal Emergency ManagementAgency (FEMA) following a flood event.
The Mississippi River is one of the most heavily engineerednatural features in the U.S. The character of the floodplain haschanged to accommodate agriculture and urbanization.Approximately 80% of the original wetlands along the riverwere drained since the 1940s. The river channel itself has beenartificially constrained by levees and floodwalls. Thesestructures serve to increase the volume of water that can beheld in the channel and thus increase the size of the floodedarea if the levee breaks.
We can either attempt to stop natural hazards from occurring(prevention) or recognize that they will happen and modifyour life styles to deal with them (adjustment).
PreventionThere are three principal ways that engineers have attempted tocontrol the flow of rivers in the Mississippi River basin andelsewhere:• Build levees or floodwalls to contain rising stream levels.• Construct a floodway channel to divert floodwaters.• Build reservoirs on tributary streams to store floodwaters
for later release.
The U.S. Army Corps of Engineers was given directions toconstruct flood control structures (dams, reservoirs, levees) onthe Mississippi River following disastrous floods in the 1930s.Levees, raised embankments along the stream bank (Fig. 37),may fail because the floodwater rises over the top of thestructure or the levee collapses under the weight of the water.Levees and floodwalls protect people on the floodplain frommost floods. However, they may not protect against the largestfloods with recurrence intervals of more than 100 years.Floodplain residents may experience a false sense of securitythat can lead to more extensive development of flood-pronelands (the "levee effect").

31
Over 9,300 km of levees were damaged following the 1993flood in the Mississippi River basin. Only 17% of federallevees were damaged, but up to 77% of locally constructedlevees failed. Most levee breaks occurred south of St. Louis. St.Louis was protected by a massive floodwall. The walldeveloped a leak but held up over the length of the flood. Over50 propane tanks containing over a million gallons of gas insouth St. Louis presented the threat of a massive explosion. Alevee break south of the city allowed the river level to droparound St. Louis and reduced pressure on the propane tanks.Many of smaller levees in rural areas failed.
An alternative to building up the banks of the river is to build afloodway or diversion channel that will transport floodwatersaway from inhabited areas. Winnipeg, Canada, completed a 47km (29 mile) floodway around the city in 1968 (Fig. 38). Thefloodway takes water from the Red River south of the city andloops around the developed region before dumping the waterback into the river further downstream. Winnipeg wasunaffected by the 1997 Red River flood while cities upstreamin North Dakota (Fargo, Grand Rapids) were severely damagedby flooding.
Figure 37. Top:Artificial levees,raisedembankmentsalong a streamchannelconstructed toprotectneighboring landsfrom risingfloodwaters.Bottom: Levee,Moorefield, WestVirginia (right)protects homes onleft of image.Image modified fromoriginal at U.S.Army Corps ofEngineers DigitalImages Library.

32
The construction of dams for flood control follows the premisethat floodwaters can be stored in reservoirs to be releasedslowly when the threat of flooding has receded (Fig. 39). Thisplan works as long as there is sufficient storage capacity toaccommodate excess runoff. Unfortunately, reservoirs werealready near capacity following higher-than-normalprecipitation in 1993 and were largely ineffective in preventingflooding.
Large dams and reservoirs on the Mississippi River wouldhinder transportation. Therefore, the majority of flood controlstructures in the Upper Mississippi River basin are located inthe Missouri River basin. The Missouri basin can be furthersubdivided and most of the dams are located in a southern sub-basin, the Kansas River basin. Approximately 85% of streamflow in the Kansas basin is controlled, i.e., it flows throughdams (Fig. 40).
Figure 38. Infraredsatellite image ofWinnipeg,Manitoba, Canada.Approximately500,000 peoplelive at theconfluence of theAssiniboine andRed Rivers. Afloodway wasconstructed tocounteract thethreat of springflooding fromsnowmelt in theRed River valley.Images courtesy ofCanada Centre forRemote SensingImages of Canadasite, used withpermission.
Figure 39. U.S.reservoir storagecapacity, 1870-1990.Environmentalconcerns and lackof suitable sitesreduced growth ofstorage capacityby the 1970s.Graph modified fromoriginal at USGS.

33
AdjustmentSteps taken to adjust to flood events include:• Purchase insurance though the National Flood Insurance
Program.• Seek assistance from the Federal Emergency Management
Agency (FEMA) following a flood event.• Move residents and structures from floodplains and/or
restore natural riverine environment.
Typical residential home insurance does not cover lossesassociated with flooding. The National Flood InsuranceProgram was established in 1968 by the federal government toprovide some financial protection for floodplain residents.Approximately 10% of midwestern residents living in flood-prone areas had flood insurance prior to the 1993 floods. Over11 million buildings are located in flood-prone areas in theU.S. but only 19% of owners have purchased flood insurance.
FEMA was created in 1979 to provide financial assistance topeople and areas affected by natural disasters. Not all areasaffected by flooding are declared disaster areas (Fig. 27).Residents who don't buy flood insurance must gamble that theywill receive disaster aid from FEMA to help cover cleanupcosts.
Two recent examples illustrate that the tide in flood controlappears to be turning from prevention measures towardadjustment. Following the 1993 flood the residents ofValmeyer, Illinois, decided to relocate their town to a bluffoverlooking its original location on the floodplain 6 km (4miles) from the river. In Napa, California, voters approved asales tax increase to fund a project that would modify land use
Figure 40.Locations of damson tributarystreams in theKansas Riverbasin, a sub-basinof the Missouridrainage basin.

3
patterns in the floodplain of the tidal Napa River. The plan willremove some levees and restore wetlands along the riverbankwhere it loops through downtown Napa. In addition afloodway will be added to reroute discharge during big floods.
S1Ass
2Sslsval
3Sfli
Think about it . . .1. Examine the map of U.S. flood declarations by county
(Fig.27) and suggest possible explanations for thehigh incidence of floods in different regions of themap. Why do some counties have no flooddeclarations?
2. The National Flood Insurance Program developed arating system that evaluates community efforts tobetter manage the floodplain. Citizens of participatingcommunities receive reductions in their floodinsurance rates. Create your own evaluation rubric forfloodplain management activities. Go to the end ofthe chapter to complete the exercise.
4
ummary. What is a stream? stream is a channel flow of any size. Geologists use the term
tream to refer to the smallest creek or the largest river. Theize and number of streams increase with precipitation.
. What is stream gradient?tream gradient is the change in elevation of a stream over apecific horizontal distance. Gradient decreases along theength of a stream channel from its source to its mouth. Theteepest gradients are found in steep-sided mountain streamalleys that may drop 40 to 60 meters per kilometer. Streamspproaching the river mouth may decrease in elevation by asittle as a few centimeters per kilometer.
. What factors affect stream velocity?tream velocity is determined by stream gradient (steeper =aster), channel roughness (more roughness = less velocity),ength of the wetted perimeter (stream bank and channel floor;n streams of equal cross section area, less wetted perimeter =

35
more velocity). Stream velocity increases downstream becauseof decreasing channel roughness and an increase in streamdischarge.
4. How does stream velocity vary within a stream channel?Stream velocity varies within the channel relative to curves(meanders) in the stream. Maximum velocity occurs toward theoutside of curves in the stream channel; stream velocity is leaston the inside of curves.
5. How does channel migration occur?Channels migrate laterally across a floodplain because of theinterplay of erosion and deposition associated with meanders.Erosion occurs in areas of higher velocity (outside ofmeanders) and deposition is associated with areas of lowervelocity (inside of meanders). The stream channel slowlymigrates across the valley floor in the direction of the erosion.
6. What are avulsion and accretion?Channel migration occurs by a combination of accretion andavulsion. Accretion represents the addition of material to pointbars as the meander bend becomes more exaggerated. Avulsionresults in rapid, dramatic changes when the river cuts throughthe narrow neck of a fully developed meander.
7. What landforms are associated with stream systems?High-gradient streams are often characterized by relativelynarrow V-shaped valleys. Stream channels may have waterfallswhere the stream flows over a resistant rock. Low-gradientstreams exhibit sinuous channels characterized by meanders.Point bars are formed by deposition on the inside of meandersand erosion forms cut banks on the outside of a meander. Flatland adjacent to streams is termed the floodplain. Streams witha high sediment load may have a braided form, with severalsmaller channels flowing around sand bars. Most streams builda delta at their mouth as sediment is deposited when the streamenters the relatively calm waters of a lake or ocean.
8. What is a drainage basin?A drainage basin or watershed is the area drained by a streamand its tributaries. The size of the drainage basin typicallyincreases as the size of the stream increases. For example, thedrainage basin for the Mississippi River occupiesapproximately half the land area of the U.S. Drainage basinsare separated by drainage divides.

36
9. How is the flow of water in a stream measured?Stream flow can be measured as discharge or stream stage.Discharge is the volume of water that flows past a given pointin a given time. The volume is calculated by multiplying thearea of the stream channel (depth x width) by the velocity(distance/time) of the stream flow. Stream stage represents thedepth of water in the stream channel relative to a standarddatum (an arbitrary starting point for measurement - not thebottom of the channel).
10. Where is stream flow measured?Stream flow is measured at over 7,000 stream gage stationsacross the U.S. Data are collected on stream stage bymeasuring the depth of water in the stream channel relative tosome fixed marker. Discharge is typically estimated fromestablished stage/discharge relations.
11. What is the recurrence interval of a flood?The average time in years between floods of the same size.Unfortunately many stream gage records do not extend backbefore the beginning of this century (most don't even comeclose) so the record used to determine the average value isreally too short to estimate the recurrence interval for "100"-year floods.
12. What are the principal causes of flooding?Flooding of streams can be defined as the temporary overflowof a river onto adjacent lands not normally covered by water.Factors that may contribute to flooding include: (a) heavystorms adding large volumes of water over a short timeinterval; (b) above normal long-term precipitation; (c) rapidsnowmelt, especially in north-flowing rivers; (d) Saturatedsoils; (e) natural vegetation replaced by impervious cover(roads, buildings); (f) storm sewers transport run-off morerapidly to streams; (g) loss of wetlands; and, (h) collapse ofconstructed structures (dams).
13. What is the most expensive flood in U.S. history?The 1993 midwestern flood on the Mississippi River and itstributary streams was the most expensive flood in U.S. history.The flood covered 17,000 square miles in nine states. Floodingwas caused by abnormal weather patterns resulting in higher-than-normal rainfall over the Midwest through June and July.Flooding occurred along the Upper Mississippi River basin,between the river's source and the confluence with the OhioRiver south of St. Louis. Flooding did not occur in the Lower

37
Mississippi River because it is much wider and was suppliedby tributaries from areas with less rainfall.
14. What methods can be employed to stop flooding?Prevention measures, methods to control the amount of waterin a stream include; (a) levees or floodwalls (common on theMississippi River); (b) floodway channels to divert floodwaters(e.g. Red River floodway, Winnipeg); (c) dams and reservoirson tributary streams to store water for later release (common onthe Missouri River).
15. Are there any alternatives to construction of massivestructures?
You bet. Adjustment represents an alternative strategy to movepeople or structures out of the path of potential floods or toseek financial assistance to deal with the costs of flooding.Federal programs such as the National Flood InsuranceProgram or agencies like the Federal Emergency ManagementAuthority can provide insurance against flooding or disaster aidto affected home owners. Recently residents in flood-proneareas have either moved their town (Valmeyer, IL) or voted torestore floodplain wetlands (Napa, CA) in an effort to lessenthe effects of later flooding.
38
Venn Diagram: Stream Characteristics
Use the Venn diagram, below, to compare and contrast thesimilarities and differences between streams near their originsand near their mouths. Consider a stream like the Colorado or ariver near where you live and think about how it changescharacter along its length. Print this page and write featuresunique to either group in the larger areas of the left and rightcircles; note features that they share in the overlap area in thecenter of the image.
Stream Near Origin Stream Near Mouth

39
Image Analysis: Mississippi River RadarImage
Examine the image of part of the lower course of theMississippi River on the next page. This picture was taken bythe Spaceborne Imaging Radar aboard the Space Shuttle. Thelong axis of the image is approximately 40 km in length. Northis to the top right. (Image courtesy of NASA's Visible Earthsite). This section of the river represents part of the state borderbetween Arkansas, Louisiana, and Mississippi. Louisiana andArkansas lie above (west of) the river and Mississippi is below(east of) the river. This region is characterized by rich farmland(purple) where a variety of crops are grown. The green regionsbordering the river are undeveloped forested areas. The river isthe black band that curves across the image from the top right-hand corner.
1. Interpret the image and discuss (below) the history of thissection of the river.
2. Identify where erosion and deposition are occurring alongthe stream channel and label those locations E (erosion)and D (deposition) on the blank map on the right.
3. Use the blank map to the right of the image to draw anearlier course of the channel.
4. Describe how velocity and depth changes between points Xand Y on the image and plot how you expect velocity anddepth to vary from X to Y on the graphs below.
5. Predict where the river will be if we were to revisit this area50 years from now.

40

41
Image Analysis: Nile River
Examine the two images, below, of part of the Nile River as itflows through the Sudan. The lower picture was taken by theSpaceborne Imaging Radar aboard the Space Shuttle. The longaxis of the image is approximately 50 km in length. North is tothe top right corner of the images. The river flows from left toright.
The thick, white band in the top right of the radar image is anancient channel of the Nile that is now buried under layers ofsand. This channel cannot be seen in the upper photograph andits existence was not known before this radar image wasprocessed.
1. What drainage pattern is represented by these images?2. Interpret the history of this section of the river.
Image courtesy of NASA's Visible Earth site.

42
Flood Recurrence Interval: Mississippi River,Keokuk
The table below presents peak flow data for the MississippiRiver at Keokuk, Iowa, 1943-1992. This data set ends the yearprior to the 1993 Mississippi River flood. We will use thesedata to estimate the recurrence interval for the 1993 floodevent.
1. Complete the table below by calculating the remainingrecurrence intervals (RI) for the flood events of 1965, 1969,1976, and 1972.
Rank Date Discharge (ft3/sec) RI=(N+1)/rank
1 1973 344,000 502 1965 327,000 ____3 1960 289,500 16.74 1986 268,000 12.55 1951 265,100 106 1974 260,000 8.37 1979 257,000 7.18 1944 256,000 6.29 1952 253,800 5.510 1969 253,000 ____11 1975 252,000 4.512 1947 245,700 4.213 1986 241,000 3.814 1948 233,600 3.615 1982 225,000 3.316 1962 224,100 3.117 1983 224,000 2.918 1946 223,300 2.819 1967 221,200 2.620 1976 214,000 ____
25 1972 192,000 ____30 1954 181,400 1.6740 1970 140,000 1.2549 1977 79,800 1.02
N = number of readings (49)Rank = order of readings

43
2. Plot the discharge vs. RI for at least 10 points on the graphprovided. Draw a straight line through the plotted pointswith RI values of 2 or more and estimate the size of 100-year and 500-year floods for this gaging station.
3. Compare the predicted flood discharge against thedischarge of the 1993 Great Mississippi flood (446,000ft3/sec). How frequently do floods of this magnitude occurat this site?

44
Community Flood Management Evaluation Rubric
Communities must meet some basic requirements for citizensto receive purchase insurance policies from the National FloodInsurance Program (NFIP). The NFIP developed a communityrating system (CRS) to encourage additional communityactivities that would lead to a further reduction in flood losses.One goal of the program is to reduce the money spent by theNFIP to help cities recover from flood events. The CRSevaluates community efforts to better manage activities in thefloodplain. Over 900 communities currently participate in thisprogram. CRS communities fall into 1 of 10 classes. Citizensof highly-rated class 1 communities would receive insurancerate reductions of 45% whereas class 10 communities receiveno reduction in their rates.
Create your own evaluation rubric for floodplain managementactivities that identifies some of the potential steps acommunity could take to increase its status in the CRS.Identify at least one potential activity from each of thefollowing four categories: Public Information, Mapping andData Collection, Flood Damage Reduction, and FloodPreparedness and Regulation. Note: none of these activitiesshould involve building new flood protection structures.
Briefly describe each activity in the table on the next page andassign it a points value. The maximum total score for yourrating system is 100. Some activities will be more useful thanothers so award points accordingly. One activity has beencompleted as an example.

45
Activity Category Description Points
Hazarddisclosure
Publicinformation
Make sure that potential purchasersof flood-prone properties are awareof the hazard.
1
Total Score 100