strengthen your career by effectively marketing your credentials cheyene haase bc management, inc
TRANSCRIPT

Strengthen Your Career by Effectively Marketing Your Credentials
Cheyene Haase
BC Management, Inc.
Topics of Presentation
• Evolution of the Business Continuity Field.• Hiring Trends.• Credentials in Demand by Employers.• Increase Your Marketability.• What is Your Fair Market Value?• When Should You Change Jobs?• Final Tips.

The Evolving Business Continuity Field
• Contingency planning is becoming an enterprise focus.
• Corporations are combining business and information technology under one umbrella.
• Where should the BC program report?

Hiring Trends in Business Continuity
• Budgetary constraints → less jobs and combining jobs within a company.
• Less jobs and a greater candidate pool → selective hiring decisions.
• The hiring process slowed down in 2001 – 2003. Recently the job market has been picking up.
• Companies are shying away from relocating candidates with or without assistance.

What Credentials are in Demand?• Certified professionals (CBCP, CISSP, CEM, PMP, etc.).• Degreed professionals (Bachelor required, prefer Masters).• Strong understanding of both business and technology
issues in contingency planning.• Previous experience developing global contingency
programs.• A wide array of skills from contingency planning,
information security, emergency response and risk management.
• Strong soft skills.

Soft Skills are in Demand• Polished presentation skills to CXO level and executive
board members.• Strong Project Management skills.• Training expertise.• The ability to engage all employees from users to CXO
level.• The ability to make a business case for an enterprise
contingency program.• The ability to understand what type of contingency
program fits the company culture.

Increase Your Marketability• Brand yourself.• Become certified or dual certified.• Earn an advanced degree.• Improve your presentation skills – take a public speaking
class.• Sharpen your business or technology knowledge.• Sharpen your expertise in other tangent fields (information
security, emergency management or risk management).• Be an expert in the BC field – serve on a board, become
published, and take on public speaking.

What Determines Your Salary?• Years of Work & Field Experience• Job Title – Where do you report within an organization?• Geographic Location• Technical Expertise• Certification• Advanced Degree• Industry Specialty• Percentage of Travel• Project Management & People Management Experience• Work History

Average Total Compensation by Years of Field Experience - FTE
$75,952 $81,724$89,991
$98,420$104,243
$98,167 $99,752
$0
$20,000
$40,000
$60,000
$80,000
$100,000
$120,000
1 - 3 4 - 6 7 - 10 11 - 15 16 - 20 21 - 25 26 ormore
Years of Industry Experience

Average Total FTE Compensation by Job Title
$0
$100,000
$200,000
$300,000
$400,000
Job Title
Max $116,000 $160,000 $305,000 $132,000 $150,000 $124,000
Avg $70,574 $90,996 $120,181 $101,750 $111,600 $84,733
Min $28,000 $27,500 $51,000 $70,000 $67,000 $36,000
Planner/
CoordinatorManager/AVP VP/Director Global Manager Sales Other

Average Total Compensation by IT Expertise - FTE
$57,000
$96,196 $97,548
$76,834 $81,760 $84,749
$104,594
$90,859$89,131$74,808
$0
$20,000
$40,000
$60,000
$80,000
$100,000
$120,000
1 2 3 4 5 6 7 8 9 10
IT Expertise (Least to Greatest) - Self Evaluated

$0
$20,000
$40,000
$60,000
$80,000
$100,000
$120,000
$140,000
Certification
2000 $45,128 $45,128 $103,500 $107,412 $74,750 $107,500 $100,060 $77,355
2001 $58,800 $58,800 $108,333 $109,800 $78,750 $110,000 $102,080 $81,199
2002 $71,911 $88,948 $109,371 $85,700 $118,083 $90,615 $65,906 $107,894 $84,000 $89,079 $100,000 $132,430 $80,780
2003 $70,330 $93,205 $123,998 $107,450 $131,879 $118,350 $90,336 $105,101 $106,200 $80,897 $96,050 $108,681 $84,092
ABCP CBCP MBCP CRP FBCI MBCI CEM PMP ARM ACP CISSP CISA No Cert.
Average Total Compensation by Certification

Average Total Compensation by Degree - FTE
$79,815 $80,363$90,735 $95,129
$136,000
$116,208
$0
$20,000
$40,000
$60,000
$80,000
$100,000
$120,000
$140,000
$160,000
High SchoolDiploma
AssociateDegree
Bachelor'sDegree
Master'sDegree
Doctorate PhD
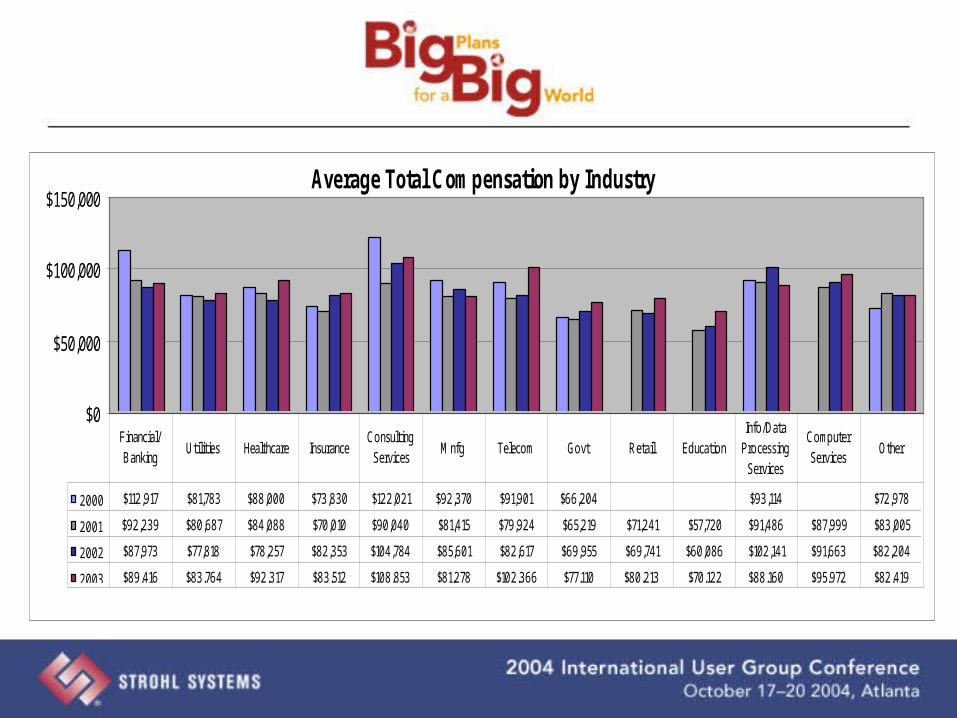
Average Total Compensation by Industry
$0
$50,000
$100,000
$150,000
2000 $112,917 $81,783 $88,000 $73,830 $122,021 $92,370 $91,901 $66,204 $93,114 $72,978
2001 $92,239 $80,687 $84,088 $70,010 $90,040 $81,415 $79,924 $65,219 $71,241 $57,720 $91,486 $87,999 $83,005
2002 $87,973 $77,818 $78,257 $82,353 $104,784 $85,601 $82,617 $69,955 $69,741 $60,086 $102,141 $91,663 $82,204
2003 $89,416 $83,764 $92,317 $83,512 $108,853 $81,278 $102,366 $77,110 $80,213 $70,122 $88,160 $95,972 $82,419
Financial/ Banking
Utilities Healthcare InsuranceConsulting Services
Mnfg Telecom Govt Retail EducationInfo/Data
Processing Services
Computer Services
Other

Indicators for a Job Change
• Lack of Challenge
• Lack of Career Growth
• Direction of Company is Questionable
• Lack of Support
• Salary

Final Tips to Strengthen Your Career
• Always strengthen your skills.• Always be networking with colleagues.• Brand Yourself.• Do not wait until a job search to increase
your marketability.• Changing jobs may not help your career in
the long run.