stressful social interaction reduces telencephalic cell
TRANSCRIPT

Stressful social interaction reduces
telencephalic cell proliferation in
rainbow trout
Master Thesis by Christina Sørensen
Christina Sørensen
Master Thesis
Physiology Programme
Department of Molecular Biosciences
University of Oslo
2005

2
Acknowledgments
I would like to thank Øyvind Øverli for being an infinite source of advice, support and
knowledge. Not many masters can claim to have spent most of their time as a student in
their supervisor’s office (A special thanks to Erik Höglund for being overbearing with us
there). I do, however, wonder how you are going to hold up without anyone to do your
dirty work (i.e. lab work), so I guess I’ll have to stick around for a while longer.
Thank you, Professor Göran Nilsson, for the loose leash, for great advice when most
needed, and most of all for recruiting me to a very interesting master project. Loads of
thanks as well to the rest of the group; Stian, Jørund, Guro, Dag Are, Aina, Marit, Kåre
Olav, Helene and Kristine, whose party morale is unparalleled. That goes for the rest of
the department as well; the Physiology Programme is a great place to spend one’s days
(and nights)!
To Kim, thank you for your hospitality when we were in Lancaster. I know it was a very
stressful time for you, and appreciate very much that you took the time to entertain
Øyvind and me. Thank you also for being overbearing with snoring and body odors while
sharing a hotel room in Portugal. I wish you all the best and good luck with your PhD.
My family and friends, thanks for keeping straight faces when I have been going on and
on and on about how fish behave when they eat. And also for accepting my total absence
from the world during these last weeks of writing the thesis. I love you all!
Oslo, July 2005
Christina Sørensen
3
Table of contents
Abbreviations 5
Abstract 7
1 Introduction 8
1.1 Stress and stress responses 8
1.1.1 Definition of stress 8
1.1.2 Physiological and behavioural stress responses 8
1.1.3 Limbic-dependent stress 11
1.1.4 Social stress in fishes 12
1.2 Stress and adult neurogenesis 13
1.2.1 Mammalian hippocampal neurogenesis 13
1.2.2 Teleost neurogenesis and the teleost forebrain 15
1.3 Aims of the study 20
2 Materials and methods 21
2.1 Experimental animals 21
2.2 Experimental set-up and design 21
2.2.1 Observation aquaria 21
2.2.2 The feeding test for adaptation to a new environment 22
2.2.3 Social interaction 24
2.2.4 BrdU administration and sampling 25
2.3 The principle of BrdU immunohistochemistry 26
2.3.1 Immunohistochemical visualization of BrdU 27
2.3.2 Quantification of BrdU-positive cells 28
2.4 Radioimmunoassay (RIA) quantification of plasma cortisol 29
2.5 Statistical analyses 31
3 Results 32
3.1 Effects of social status on behaviour and cortisol 32
3.2 BrdU immunohistochemistry 35
3.3 Effects of social status on telencephalic cell proliferation 38

4
3.4 Cortisol and telencephalic cell proliferation 39
3.5 General growth rate and telencephalic cell proliferation 39
4 Discussion 41
4.1 Methodological considerations 41
4.2 Effects of social status on brain cell proliferation 43
4.3 Possible mechanisms for reduction of telencephalic brain cell
proliferation 46
4.4 Conclusions 48
References 49
Appendix 1 – Telencephalic organization in rainbow trout 58
Appendix 2 – Protocol for BrdU staining 61
Appendix 3 – RIA for cortisol 64
Appendix 4 – Post-hoc statistics 68
5
Abbreviations
5-HT 5-hydroxytryptamine, serotonin ACTH adrenocorticotropic hormone BDNF brain derived neurotrophic factor BrdU 5-bromodeoxyuridine BSA bovine serum albumin CNS central nervous system CRH corticotropin-releasing hormone (=CRF, corticotropin-releasing factor) D area dorsalis telencephali DA dopamine DAB 3,3’-diaminobenzidine Dc central zone of D Dl lateral zone of D Dld dorsal part of lateral zone of D Dlp posterior part of lateral zone of D Dlv ventral part of lateral zone of D Dm medial zone of D Dp posterior zone of D dpm disintegrations per minute E nucleus entopeduncularis ECL external cellular layer of the olfactory bulb EDTA ethylenediaminetetraacetic acid GC glucocorticoid GL glomerular layer of the olfactory bulb GR glucocorticoid receptor HPA hypothalamic-pituitary-adrenal HPI hypothalamic-pituitary-interrenal HR high responder (rainbow trout strain) HRP horse radish peroxidase ICL internal cellular layer of the olfactory bulb IgG Immunoglobulin G Ki-67 nuclear antigen present in proliferating cells LAL long attack latency (mouse strain) LR low responder (rainbow trout strain) MR mineralocorticoid receptor NE norepinephrine, noradrenaline PAP peroxidase anti-peroxidase PBS phosphate buffered saline PBT phosphate buffered saline with Triton X-100 and BSA PCNA proliferating cell nuclear antigen PP nucleus preopticus parvocellularis PZ proliferation zone RIA radioimmunoassay S.E.M. standard error of mean

6
SAL short attack latency (mouse strain) SD standard deviation SSRI selective serotonin reuptake inhibitor V area ventralis telencephali VBS visual burrow system Vc central nucleus of V Vd dorsal nucleus of V Vl lateral nucleus of V Vs supracommissural nucleus of V Vv ventral nucleus of V

7
Abstract
When housed together, juvenile rainbow trout (Oncorhynchus mykiss) form social
hierarchies in which subordinate animals show stress-related changes in behaviour,
endocrine function and neurochemistry. Similar changes are observed in the subordinate
animals when social hierarchies are studied in mammalian species. These animals also
show a marked reduction in hippocampal cell proliferation. To determine whether this
effect of stressful social interaction on cell proliferation exists in rainbow trout as well,
the bromodeoxyuridine (BrdU) method of investigating proliferation was adapted for
utilization in rainbow trout.
Pairs of fish were allowed to fight for dominance, and were then left to interact
for 4 days. 24h before the end of the experiment, the deoxythymidine analogue BrdU was
administred intraperitonally to all fish. BrdU is incorporated into the DNA of cells going
through S-phase and is thus a marker of proliferation. Proliferating cells were visualized
immunohistochemically and quantified in transverse sections of the telencephalon, which
is suggested to contain structures embryologically and functionally homologous to the
hippocampus. Even though the method appeared to be stressful to the animals, a
reduction in telencephalic cell proliferation of almost 40% was found in the subordinates
compared to isolated controls. The proliferation in dominant animals did not differ
significantly from any of the other groups, but there was a strong tendency of reduced
proliferation in these animals as well.
These results confirm that stressful social interaction reduces brain cell
proliferation in rainbow trout in a similar manner as in mammals. This change is
suggested to be caused by the increased plasma cortisol levels that were found in the
subordinate animals, and may be a component of the adaptive stress response.

8
1 Introduction
1.1 Stress and stress responses
1.1.1 Definition of stress
Although stress is a widely used term and an important concept in our daily lives,
there is still considerable ambiguity regarding its definition. Here stress will be defined as
the state when an intrinsic or extrinsic factor, a stressor, poses a real or imagined
challenge to an animal’s homeostasis, where homeostasis refers to the maintenance of a
narrow range of vital physiological parameters necessary for survival (McEwen and
Stellar, 1993; Chrousos, 1998). The homeostasis is attempted re-established through the
animal’s stress response; a complex repertoire of physiological and behavioural adaptive
responses.
1.1.2 Physiological and behavioural stress responses
The organism’s response to stress is mediated by the stress system, located both in
the central nervous system (CNS) and in the periphery (Chrousos and Gold, 1992;
Chrousos, 1998). The stress system receives and integrates a number of neurosensory and
blood-borne signals, and when activated, leads to a set of time-limited behavioural and
physiological changes. These changes are remarkably consistent over a vide range of
stressors, and are normally adaptive, improving the individual’s chances for survival
(Chrousos and Gold, 1992).
Heart rate, respiration, blood pressure and blood glucose concentrations are
among the physiological parameters that change during the stress response (Cannon,
1929; Seyle, 1950). These responses are at least in part mediated by the endocrinological
stress response, which involves two major endocrine systems; the hypothalamic-pituitary-
adrenal (HPA) system, and the sympathico-adrenomedullary system.
The sympathico-adrenomedullary system consists in mammals of preganglionic
cholinergic nerves from the spinal cord triggering the release of catecholamines
(adrenaline and noradrenaline) from chromaffin cells in the adrenal medulla into the

9
blood stream, and the neurons of the sympathetic system signalling to internal organs
with noradrenaline. Since the adrenal response involves neurally stimulated release of
pre-stored hormones, its activation results in an immediate increase in release of these
catecholamines into the circulation (Mason, 1968). The catecholamines exercise their
effect by binding to adrenergic receptors, which are distributed throughout the body.
As in mammals, stress in teleost fish is accompanied by a rapid increase in the
plasma concentration of cathecolamines, which are released by chromaffin cells. In fish,
however, these cells are scattered throughout the kidney and the walls of the posterior
cardinal vein (Sumpter, 1997). In all vertebrates, the catecholamines initiate a range of
physiological effects that serve to optimise cardiovascular and respiratory functions,
including the mobilisation of energy stores to meet increased metabolic requirements
during stress (Chrousos, 1998; Fabbri et al., 1998; Perry and Bernier, 1999).
The mammalian HPA system, or HPA axis, as it is commonly referred to, is
activated by the release of corticotropin-releasing hormone (CRH) from the
hypothalamus, reaching the pituitary through the hypothalamic-hypophyseal portal
system. CRH promotes release of adrenocorticotropic hormone (ACTH) by the anterior
pituitary into the circulation. ACTH in turn stimulates release of glucocorticoid hormones
(GCs, mainly cortisol in humans and corticosterone in rodents) from the adrenal cortex.
The endocrine character of this system leads to a slight delay (minutes) in the release of
glucocorticosteroids into the circulation after the initiation of a stressful stimuli.
The main glucocorticoid effects are mediated by glucocorticoid receptors, which,
like the adrenergic receptors, are found throughout the body. There are two kinds of
glucocorticoid receptors, the Type I, or mineralocorticoid receptor (MR) and the Type II,
or glucocorticoid receptor (GR). These receptors are often colocalized and they are
functionally complementary. The MR receptor has a 10-fold higher affinity for
corticosteroids than the GR, and therefore this receptor generally mediates the tonic
effects on arousal caused by daily variation in glucocorticoid concentrations. The GR is
thus only extensively occupied during times of high concentrations of circulating
glucocorticoids, and seems to be the receptor mediating both the adaptive stress response,
and the negative feedback effect of glucocorticoids on ACTH and CRH release. (Dekloet
and Reul, 1987; DeKloet, 1996; De Kloet et al., 1998; Fuchs and Flugge, 2003).

10
The HPA-axis in mammals is paralleled in teleosts by the hypothalamo-pituitary-
interrenal (HPI) axis, which also cumulates with the release of glucocorticoids, mainly
cortisol, into the bloodstream (Sumpter, 1997). Unlike mammals and other higher
vertebrates, fishes do not have a hypothalamic-hypophyseal portal system, and CRH
reaches the ACTH producing pituitary cells via direct neuronal innervation. Fishes do not
have a discrete adrenal gland, and the adrenal cortical tissue is represented by the
interrenal cells which release GCs upon ACTH stimulation (Mommsen et al., 1999). Both
kinds of glucocorticoid receptors have also been identified in teleosts, and they have been
located to the telencephalon and other brain structures. Significantly less is, however,
known about their distribution and function compared to what is known in mammals
(Colombe et al., 2000; Bury et al., 2003; Greenwood et al., 2003).
The acute behavioural response to stress in mammals includes increased arousal,
alertness and vigilance, improved cognition and focused attention. It also includes
inhibition of vegetative functions, such as appetite, feeding and reproductive behaviour
(Fuchs and Flugge, 2003). Chronic stress, on the other hand leads to a general down-
regulation of behaviour, including reduction in aggression, movement and exploration
(Albonetti and Farabollini, 1992; Chrousos and Gold, 1992; Chrousos, 1998;
Bartolomucci et al., 2004).
In fish, similar behavioural stress responses have been identified. Chronically
stressed fish show reduced aggression, activity and food intake (Winberg et al., 1991;
Winberg and Nilsson, 1993a; Iwama et al., 1997; Øverli et al., 1998).
In summary, the main endocrine and behavioural components of the stress
response are essentially similar in teleosts and mammals, indicating a strong conservation
of these responses throughout vertebrate evolution.

11
1.1.3 Limbic-dependent stress
Activation of brain monoaminergic systems is an important component of the
central stress response. In mammals, stressful stimuli have been reported to raise the
brain concentrations of noradrenaline (norepinephrine, NE), dopamine (DA) and
serotonin (5-hydroxytryptamine, 5-HT) as well as their respective metabolites, indicating
increased activity in these neuronal systems (Bliss et al., 1968; Puglisiallegra et al., 1991;
Stanford, 1995). Interestingly the limbic structures of the brain, which are particularly
involved in emotional and behavioural relations to stress (Maclean, 1955; Habib, 1998),
receive strong monoaminergic input. These structures, and the hippocampus in particular,
also have a particularly high density of both kinds of glucocorticoid receptors (Sapolsky
et al., 1986). It appears that limbic circuits are activated by stressors such as restraint, fear
and exposure to novel environments. Under normal circumstances limbic structures
inhibit CRH release form the hypothalamus (Fuchs and Flugge, 2003), but suppression of
this activity leads to activation of the HPA axis. Prior to an eventual activation of the
HPA axis, integration of signals from the monoaminergic systems and information from
different sensory organs takes place to determine if and to what degree the endocrinal
stress response will be activated.
Although the physiological and behavioural stress responses are the same for all
types of stressors, not all stressors initiate limbic processing prior to activation of the
endocrinal stress response (Lopez et al., 1999; Fuchs and Flugge, 2003). Physiological
stressors, such as noxious stimuli and hypothermia activate efferent pathways directly
relayed to the hypothalamus, and there is no limbic integration involved in the response
while responses to stressors such as predator exposure and restraint are mediated through
limbic structures. Herman and Cullinan (1997) explain this dualism of the central stress
system as an adaptation to the different demands on the stress response from qualitatively
different stimuli. Physiological stressors require immediate reactions for survival, but no
further interpretation from higher-order brain systems. Psychological challenges, on the
other hand, need cortical processing and integration of previous experiences and current
sensory information before an adequate response can be launched (Herman and Cullinan,
1997).

12
Interestingly, the neuroendocrinology of limbic-dependent chronic stress in
mammals bears remarkable similarities to that of depressive disorders in humans (Yadid
et al., 2000), and several animal models of this kind of stress have been developed to
study biological parameters that are implicated in depression (See Yadid et al. 2000 for
list). Social stress is common in many animal species and typically results from
competition for resources such as space, access to reproductive partners or access to food.
Some of the animal models of limbic-dependant stress utilize this tendency of different
species to form social hierarchies when housed in groups, including the VBS in rats
(Tamashiro et al., 2005), and the chronic psychosocial stress paradigm in tree shrews
(Fuchs et al., 2004a). A key observation in this research is that socially subordinate
animals are subject to chronic and unpredictable stress, which leads to characteristic
changes in behaviour, physiology and neuroendocrinological parameters.
1.1.4 Social stress in fishes
Several fish species also display territorial behaviour when housed together
(Andries and Nelissen, 1990; Winberg et al., 1991; Winberg et al., 1993; Oliveira and
Almada, 1996; Winberg et al., 1996; Winberg et al., 1997), and both neuroendocrinology
and behaviour during social stress has been investigated in these models. One species in
particular has undergone very thorough investigation; the rainbow trout (Oncorhynchus
mykiss) (Winberg et al., 1993; Winberg and Lepage, 1998; Øverli et al., 1999; Øverli et
al., 2004b; Øverli et al., 2004a). Juvenile salmonids including rainbow trout show a
particularly high degree of social aggression and hierarchy formation. In nature they are
territorial and defend small territories consisting of patches of river-bed. A territory is a
prerequisite for access to food, as they feed on drifting invertebrates, and individuals that
fail to acquire a territory have reduced chances of survival (Kalleberg, 1958; Bachman,
1984; Nakano, 1995; Adams et al., 1998). In laboratory experiments, juvenile rainbow
trout are kept in isolated areas with abundant access to food, in order to induce territorial
behaviour. Introduction of an intruder or removing of barriers between adjoining
territories will inevitably lead to a fight for social dominance, resulting in formation of a
hierarchy with one dominant and one subordinate individual (Winberg and Nilsson, 1992;
Øverli et al., 1999; Øverli et al., 2004b; Øverli et al., 2004a).
13
The social stress response has been thoroughly investigated in this system with
particular regard to brain monoaminergic activity (Winberg and Nilsson, 1993a; Winberg
and Nilsson, 1993b; Winberg and Lepage, 1998; Øverli et al., 1999), and so far, several
similarities with the response in mammals have been described. For instance, a general
elevation of 5-HT activity in stress has been found, while DA and NE activity is regional
and context dependant (Bliss et al., 1968). This adds to the previous mentioned
similarities within vertebrate groups in the stress response, and increases the evidence for
a strong conservation in the limbic dependent stress responses throughout vertebrate
evolution.
As fishes do not have a neocortex (Rose, 2002), studying psychosocial stress in
these animals may give insights into the basic, cortex-independent mechanisms of this
kind of stress that appear to be common among all vertebrates.
1.2 Stress and adult neurogenesis
1.2.1 Mammalian neurogenesis – Role for limbic processes
After being disregarded and forgotten for several decades after its original
discovery (Hamilton, 1901), the process of adult neurogenesis in mammals, addition of
new neurons to the adult CNS, was relatively recently re-discovered (Kuhn et al., 1996;
Kempermann et al., 1997), following which the interest in the subject exploded. This
revolution in research on neurogenesis was brought about by the introduction of the BrdU
method for visualizing cell proliferation (Gratzner et al., 1975; Gratzner, 1982). 5-
Bromodeoxyuridine (BrdU) is a synthetic deoxythymidine analogue with a bromine atom
substituting the methyl group in the 5 position of the pyrimidine ring. When BrdU is
present in a cell, it will compete with the cell’s deoxythymidine for incorporation into
DNA during the S-phase. BrdU will then remain in the cell’s DNA throughout the cell’s
life (except in cells undergoing subsequent divisions whereupon the BrdU becomes
diluted), and be passed on to any daughter cells. After injection of a single dose of BrdU
into an animal, all the animal’s cells going through S-phase during the time it is available
are assumed to have BrdU incorporated into its DNA, and its presence in a cell will hence

14
be a marker of cell proliferation. The DNA-incorporated BrdU is then visualized
immunohistochemically. This method does not give any indication of the type of the new
cells. This has, however, also been investigated immunohistochemically utilizing cell-
specific markers for glia and neurons in double staining experiments with BrdU, where
co-localization reveals the type of the newly generated cells. It has thus been shown that
generally a large part of the newly generated cells in the adult mammalian CNS are
indeed neurons (Cameron et al., 1993; Kuhn et al., 1996).
The adult neuronal proliferative zones of mammals are located to discrete
structures; the olfactory bulb, the subventricular zone lining the walls of the lateral
ventricles and most notably the subgranular zone of the hippocampal dentate gyrus
(Prickaerts et al., 2004).
The rate of neurogenesis, and particularly that of the dentate gyrus, varies with
several factors. It is for instance increased by voluntary exercise (van Praag et al., 1999)
and enhanced environmental complexity (Kempermann et al., 1997; Nilsson et al., 1999).
Increased adult neurogenesis has been found to correlate with improved performance in
hippocampal-dependent learning and memory tasks (Gould et al., 1999a; Nilsson et al.,
1999; van Praag et al., 1999). This is perhaps not surprising as the hippocampus has
traditionally been known for its importance for memory formation, mood regulation and
neuroendocrine control (Jacobson and Sapolsky, 1991; Eichenbaum et al., 1992; Squire,
1992; Eichenbaum, 1999). The hippocampus is also important in the limbic component of
the central stress system. Thus hippocampal neurogenesis has been intensively studied in
regard to stress during recent years.
Several studies have found that stress reduces hippocampal neurogenesis (Fuchs
and Flugge, 1998; Gould et al., 2000; McEwen, 2000; Joels et al., 2004). This effect has
been suggested to be mediated directly or indirectly by increased levels of
glucocorticoids, since administration of glucocorticoids inhibits neurogenesis (Gould and
Tanapat, 1999), and since there are especially high densities of glucocorticoid receptors
in the hippocampus (Sapolsky et al., 1986). The stress-induced reduction in hippocampal
neurogenesis is counteracted by selective serotonin reuptake inhibitor (SSRI) treatment
(Fuchs et al., 2004b). SSRI anti depressants seems to produce their effects partly by
stimulating hippocampal neurogenesis via the 5-HT1A receptor, as 5-HT1A-receptor null
15
knock out mice are insensitive to both the neurogenic and anti-depressant effects of
SSRIs (Santarelli et al., 2003). X-ray irradiation of the hippocampus also blocks the
behavioural responses to these antidepressants, indicating that the behavioural effects of
chronic antidepressant treatment are mediated by the stimulation of hippocampal
neurogenesis. Thus, reduction in rate of hippocampal neurogenesis appears to be an
element of the central stress response, and might be the mechanism behind some of the
behavioural stress responses.
The hippocampus is as mentioned essential for memory and learning, and these
functions are impaired by reduced rate of neurogenesis. Recently it has become evident
that memory and learning are important for the integrative control of the stress response
(Rodrigues et al., 2001; Blair et al., 2005). It is generally assumed that the more
unpredictable a situation is, the more stressful it is to the individual. Consequently,
individuals with impaired memory function or learning abilities may assess a given
situation as more unpredictable than individuals with better memory or learning abilities.
Thus, reduced rate of neurogenesis caused by a stressful stimuli may cause the animal to
interpret the environment as unpredictable, and respond by down-regulating behaviours
that otherwise could have resulted in danger to the animal’s health of life.
Since psychosocial stress and reduced neurogenesis in animals mimic depressive
disorders in humans, study of these phenomena comparatively may increase our
understanding of the adaptive (or maladaptive) properties of depression and mood
disorders.
1.2.2 Teleost neurogenesis and the teleost telencephalon
Compared to mammals, teleost fish, and all other non-mammalian vertebrates
have a much higher degree of adult neurogenesis (Zupanc, 2001). The size of a teleost
brain increases with age, body weight and body length throughout life, and adult
proliferation has been observed within all major teleost brain structures (Birse et al.,
1980; Leyhausen et al., 1987; Brandstatter and Kotrschal, 1990; Zupanc and Horschke,
1995). Adult proliferation zones have been mapped in detail in the brains of the adult
stickleback (Gasterosteus aculeatus) (Ekstrom et al., 2001), the brown ghost knife fish

16
(Apteronotus leptorhynchus) (Zupanc and Horschke, 1995)and the gilthead sea bream
(Sparus aurata) (Zikopoulos et al., 2000).
A comparison across vertebrate taxa suggests that continuous generation of new
neurons in a large number of discrete regions in the CNS is likely to have occurred in the
ancestors of today’s chordates. In the course of evolution, this ability has been conserved
to varying degrees in the branches leading to today’s non-mammalian vertebrates but has
been greatly reduced in extant mammals (Zupanc, 2001). To obtain a thorough biological
understanding of adult neurogenesis it would seem essential to clarify by what
mechanisms this reduction has occurred. However, very little is known about the
functional regulation of neurogenesis in teleost fish.
For comparison with mammalian hippocampal neurogenesis, it would be of
particular interest to investigate the proliferative zones found in proximity to structures
responsible for teleostean hippocampal function. Embryological and behavioural
evidence indicates that the hippocampal function of teleosts is harboured in the
telencephalon (Butler and Hodos, 1996). Telencephalic ablation in goldfish has for
instance produced learning deficits in the solution of spatial tasks (Salas et al., 1996;
Lopez et al., 2000) in a way that is similar to the spatial deficits observed following
hippocampal damage in birds and mammals (Morris et al., 1982; Bingman and Mench,
1990). Further pinpointing of the teleost hippocampal analogues can, however, be
difficult, since in ray-finned fishes, and most prominently in teleosts, the topology of the
telencephalon is highly distorted compared to that of all other vertebrates (Nieuwenhuys
and Meek, 1990). During CNS development in ray-finned fishes, the roof plate of the
embryonic telencephalon extends laterally with the effect that the paired alar plates
forming the hemispheric walls roll out lateroventrally; a process called eversion
(Nieuwenhuys, 1962). This results in the formation of two solid telencephalic
hemispheres separated by a ventricle. The telencephalon of all other vertebrate groups are
developed by paired evagination and thickening of the most rostral embryonic neural
tube, and each hemisphere contains a lateral diverticulum of the ventricle centrally
(Wullimann et al., 1996) (Figure 1.1).
Thus, the adult topology of the teleostean telencephalon can not alone give any
immediate indication of homology with structures in other vertebrates, but the differences

17
between the evagination and eversion processes suggests a reversal of the medial-to-
lateral topography in teleost telencephalon compared to other vertebrates (Figure 1.1),
and a growing amount of connectional, immunohistochemical and behavioural data
supports this idea (Reiner and Northcutt, 1992; Bradford, 1995; Butler, 2000; Rodriguez
et al., 2002).
Figure 1.1 Schematic representation of the process of eversion that occurs in the telencephalon of ray-
finned fishes compared with that of evagination in all other vertebrate groups. P1, P2 and P3 represent the
pallia of the telencephalon, where P1 is the lateral pallium, P2 the dorsomedial pallium and P3 the medial
pallium in mammals. A reversal of the medial-to-lateral topography is indicated in ray-finned fishes.
Adapted from Rodríguez et al. 2002.
The hippocampus is located in the medial pallium in most vertebrate groups,
which, according to the reversed topology principle is suggested to be anatomically
homologous with the lateral pallium of the teleost telencephalon (Nieuwenhuys and
Meek, 1990; Bradford, 1995), more precisely the posterior and lateral zones of the dorsal
telencephalon (Dp and Dl) according to the terminology of Nieuwnhuys (1962) as
modified by Northcutt and Davis (1983) (see list for abbreviations, and Appendix 1 for
telencephalic map). Rodriguez et al. have shown that lesioning of the teleostean lateral
pallium produces the same deficits in spatial tasks as ablating the whole teleostean
telencephalon or lesioning of the medial pallium in other vertebrates, indicating a
functional homology as well (Rodriguez et al., 2002). Thus, the focus of this thesis on the

18
rainbow trout telencephalon is motivated by the presence of structures both
embryologically and functionally homologous to the mammalian hippocampus in the
teleostean telencephalon.
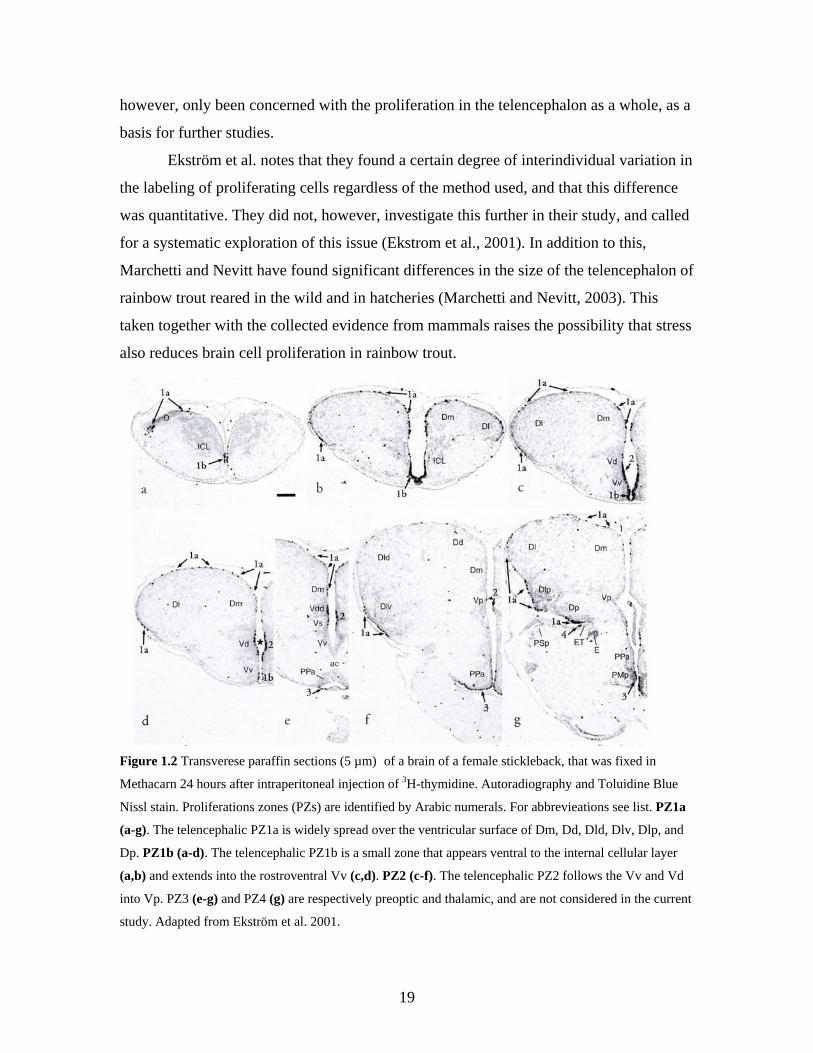
All three qualitative mapping studies of the proliferation in the teleost brain has
led to the identification of two distinct telencephalic proliferation zones, denoted PZ1 and
PZ2 by Ekström et al. (Zupanc and Horschke, 1995; Zikopoulos et al., 2000; Ekstrom et
al., 2001). PZ1 is divided into two sub-zones, PZ1a and PZ1b. PZ1a is located along the
ependyma of the rostromedial aspect of the medial zone of the dorsal telencephalon
(Dm), with stained cells scattered along the ventricular surface of the dorsal
telencephalon (D), spreading laterally and caudally over the lateral zone of D (Dl).
Aggregations of cells are found in the rostromedial pole of Dm and in the caudoventeral
pole of the posterior zone of D (Dp), the first within the medial pallium, and the latter
within the lateral pallium, which is suggested to have hippocampal functions (Figure
1.2a-g). PZ1a is continuous with PZ1b rostrally, and this zone continues ventrally over
the ependyma of the intracellular layer of the olfactory bulbs (ICL) to the ventricular
midline, and further caudally into the most rostral part of the ventral nucleus of the
ventral telencephalon (Vv) (Figure 1.2a-d). At this level, the most rostral level of PZ2
appears in the dorsal part of V (Vd), stretching caudally approximately to the anterior
commissure (Figure 1.2c-f) (Zupanc and Horschke, 1995; Zikopoulos et al., 2000;
Ekstrom et al., 2001).
The question of whether newly generated cells are neurons, and if they migrate
and become functionally incorporated into the existing neuronal networks arises
naturally. Studies in the zebrafish olfactory bulb and cerebellum have revealed that a
portion of the newly formed cells express neuron specific proteins (Zupanc and Ott,
1999; Byrd and Brunjes, 2001). Migrational patterns of the newly born cells have also
been studied in the zebrafish cerebellum (Zupanc et al., 1996; Zupanc and Clint, 2003),
but little is known about these factors in the telencephalon. It will therefore be of interest
to investigate not only the total proliferation in the whole telencephalon in response to
stress, but also the dynamics within distinct proliferation zones, the migration patterns of
new cells and the identity of newly formed cells. Due to time limitations, this study has,
19
however, only been concerned with the proliferation in the telencephalon as a whole, as a
basis for further studies.
Ekström et al. notes that they found a certain degree of interindividual variation in
the labeling of proliferating cells regardless of the method used, and that this difference
was quantitative. They did not, however, investigate this further in their study, and called
for a systematic exploration of this issue (Ekstrom et al., 2001). In addition to this,
Marchetti and Nevitt have found significant differences in the size of the telencephalon of
rainbow trout reared in the wild and in hatcheries (Marchetti and Nevitt, 2003). This
taken together with the collected evidence from mammals raises the possibility that stress
also reduces brain cell proliferation in rainbow trout.
Figure 1.2 Transverese paraffin sections (5 µm) of a brain of a female stickleback, that was fixed in
Methacarn 24 hours after intraperitoneal injection of 3H-thymidine. Autoradiography and Toluidine Blue
Nissl stain. Proliferations zones (PZs) are identified by Arabic numerals. For abbrevieations see list. PZ1a
(a-g). The telencephalic PZ1a is widely spread over the ventricular surface of Dm, Dd, Dld, Dlv, Dlp, and
Dp. PZ1b (a-d). The telencephalic PZ1b is a small zone that appears ventral to the internal cellular layer
(a,b) and extends into the rostroventral Vv (c,d). PZ2 (c-f). The telencephalic PZ2 follows the Vv and Vd
into Vp. PZ3 (e-g) and PZ4 (g) are respectively preoptic and thalamic, and are not considered in the current
study. Adapted from Ekström et al. 2001.

20
1.3 Aims of the study
This study aims to develop and test a method for quantification of cell
proliferation in the rainbow trout telencephalon, utilizing BrdU incorporation and
immunohistochemistry. Further, the method developed will be used to investigate
whether social status in a dominance hierarchy system affects the rate of telencephalic
brain cell proliferation.

21
2 Materials and methods
2.1 Experimental animals
The experimental animals used were juvenile rainbow trout (Oncorhynchus mykiss)
obtained from Valdres Ørretoppdrett in Valdres, Norway, March 2003. After transport to
the research facilities at the University of Oslo, the fish (n = 32) were maintained for at
least 6 weeks in a 750 liter holding tank that was aerated and continuously supplied with
dechlorinated Oslo tap water at 7-9°C (100 L/h). Artificial lighting followed a 12h
ligh/12 hour darkness cycle with light from 8am to 8pm, and the fish were fed daily
approximately 1% of their mass with commercial pelleted food (Ewos). At the start of the
experiment, the animals weighed between 84.0g and 184.5g (126.0g ± 5.63g; mean ±
S.E.M.).
2.2 Experimental set-up and design
2.2.1 Observation aquaria
The experimental set-up included glass observation aquaria (50x50x100 cm =
250L) that were aerated and continuously supplied with dechlorinated Oslo tap water (2
L/h per fish). The water was held at 7-9 °C throughout the experiment. The aquaria were
divided in four 50L compartments by removable opaque PVC walls and the back, sides
and bottom were covered with black plastic film. The compartments were lidded with
plastic mesh to keep the fish from escaping. The set-up is illustrated in Figure 2.1.

22
Figure 2.1 Experimental set-up consisting of a glass aquarium with three removable opaque walls.
2.2.2 The feeding test for adaptation to a new environment
Transferring a fish to a new environment involves two sources of stress; the
physical handling of the fish and the uncertainty of possible dangers in the new
environment. Once introduced to the new environment, a salmonid fish will typically be
in a state of anorexia and immobility, which are two well characterized parameters of
stress in teleost fish (Winberg et al., 1993; Winberg and Nilsson, 1993a; Øverli et al.,
1998; Øverli et al., 2001). Both parameters have earlier been quantified to characterize
and rate the state of stress (Winberg et al., 1993; Øverli et al., 1998; Øverli et al., 2002),
the former by recording the amount of food taken by the fish when hand fed pelleted
food, the latter by registering the time the fish spends moving within a fixed time
interval.
In a pilot study, a test for feeding behaviour in a new environment was developed.
Fish were netted and transferred to the observation aquaria. Starting 24 h after transfer,
fish were hand fed daily (1% of body weight, Ewos pelleted trout food) by dropping the
food items one by one or a few at a time into the aquaria. The fish were carefully
observed throughout the time it took to feed them, typically 5 minutes. For all the fish,
feed intake increased progressively over several days after transfer to the new
environment. At first most fish took no food at all, even if the pellets were made to fall

23
directly (< 1 cm) in front of them, clearly within the sensory field of the fish. Some of the
fish would, however, take a few of the pellets, preferably those that fell directly in front
of them or they would move a short distance (less than one body length) to take falling
pellets. Later, most fish would move longer distances (more than one body length) and
take the majority of the pellets presented to them. They would, however, take only one
pellet at a time and always return to their original location in the aquarium between each
food item. Some, but not all fish would progress to appearing completely confident in the
new environment, moving continuously between food items and consuming all available
food. The fish would move through these stages with varying speed of progress. Relapse
to an ‘earlier’ stage was rarely seen and when it occurred the relapse was only temporary.
Based on these observations we determined that feeding behaviour could be rated
on a 4 step feeding/boldness scale (Table 2.1). There was individual variation in how
quickly feed intake progressed, and the sum of the feeding points obtained by one animal
throughout the period was taken as a measure of tendency to feed, or boldness, in a new
environment.
Score Behaviour
0 Fish does not respond to food
1 Fish eats only pellets falling in its immediate vicinity and does not move
more than a body length to take food
2 Fish moves more than one body length to take food but returns to
original position in aquarium between each food item.
3 Fish moves continuously between food item and consumes all available
food
Table 2.1 Criteria for rating the feeding behaviour of individual fish held in isolation in the feeding test.

24
In the main experiment, a total of 32 fish were paired and matched by weight
(weight difference within pair less than 5%) and put separately in neighbouring
compartments in the aquaria. Starting 24h after transfer, fish were hand fed daily (1% of
body weight, Ewos pelleted trout food) and observed and rated for feeding behaviour
according to the described feeding test. Excess food was removed approximately 2 hours
after feeding daily. All fish had resumed feeding by day 9.
2.2.3 Stressful social interaction
The main purpose of this project was to examine the effect of social subordination
on brain cell proliferatin in the rainbow trout telencephalon. The social stress experiment
was conducted according to earlier experiments performed by Winberg et al. and Øverli
et al. (Winberg and Nilsson, 1992; Øverli et al., 1998; Øverli et al., 2004b).
After feeding on day 9, the walls between 10 randomly chosen neighbouring
compartments were removed, whereupon the pairs of fish were allowed to fight to
establish social hierarchies. After removal of walls between adjoining compartments in
the aquaria, pairs of fish would after a latency of a few minutes begin to perform
aggressive behaviour consisting of violent attacks, biting and circling. These fights for
dominance would last for a variable period (0.1-14 minutes), and inevitably end with one
fish retiring from further aggression, and thus becoming the subordinate animal. The
subordinate fish would seek a position out of the visual field of the dominant animal,
typically along the walls of the aquarium. The dominant would continually circle in most
of the available space of the aquarium, and with variable time intervals attack, bite and
chase the subordinate fish. The social status of all the paired animals was recorded.
Fishes were recognized by individual characteristics such as skin pattern, colouring or fin
shape. All times were recorded using a stop watch.
After initial establishment of the social hierarchy with one dominant and one
subordinate animal the fish were left together for 4 days continuing the daily feeding and
rating of feeding behaviour. 12 control fish were left in isolation in separate aquaria
throughout the period of the experiment, fed daily and observed for feeding behaviour.

25
2.2.4. BrdU administration and sampling
24 hours before the end of the experiment (on day 12, 4h before feeding), all fish
(controls, dominant and subordinate animals) were rapidly netted from the aquaria,
lightly anaesthetized in a bath of 25 mg/L benzocaine and injected with a solution
containing 15 mg/mL BrdU in 0.01M PBS to a dose of 100 mg/kg body mass of BrdU.
Volume of injected BrdU solution was 6.62 mL/kg body mass, and ranged from 0.56 to
1.23 mL.
On day 13, 1h after feeding, all fish were rapidly netted and quickly anaesthetized
in 1 g/L benzocaine. The fish were weighed and approximately 1 mL blood was removed
from the caudal vein using a syringe containing EDTA (1.5 mg/mL blood). The blood
was centrifuged at 3000 rpm for 3 min, and the plasma was stored at –80 °C until
quantification of cortisol. The fish were decapitated and the brains were rapidly dissected
from the skull, then drop-fixed in 4% paraformaldehyde in 0.01M PBS. The gonads of all
fish were investigated for sex determination and to control that the animals were juvenile.
An overview and time-line of the experiment is given in Figure 2.2
Figure 2.2 Time-line of the experiment.
26
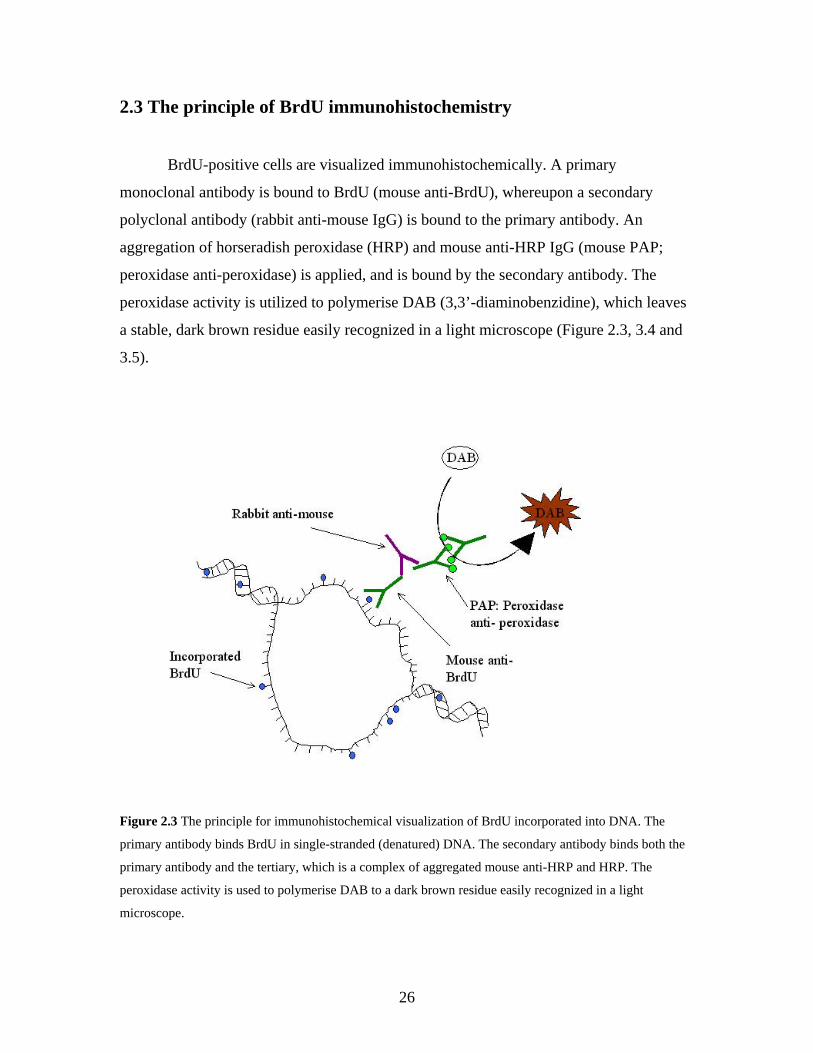
2.3 The principle of BrdU immunohistochemistry
BrdU-positive cells are visualized immunohistochemically. A primary
monoclonal antibody is bound to BrdU (mouse anti-BrdU), whereupon a secondary
polyclonal antibody (rabbit anti-mouse IgG) is bound to the primary antibody. An
aggregation of horseradish peroxidase (HRP) and mouse anti-HRP IgG (mouse PAP;
peroxidase anti-peroxidase) is applied, and is bound by the secondary antibody. The
peroxidase activity is utilized to polymerise DAB (3,3’-diaminobenzidine), which leaves
a stable, dark brown residue easily recognized in a light microscope (Figure 2.3, 3.4 and
3.5).
Figure 2.3 The principle for immunohistochemical visualization of BrdU incorporated into DNA. The
primary antibody binds BrdU in single-stranded (denatured) DNA. The secondary antibody binds both the
primary antibody and the tertiary, which is a complex of aggregated mouse anti-HRP and HRP. The
peroxidase activity is used to polymerise DAB to a dark brown residue easily recognized in a light
microscope.

27
2.3.1 Immunohistochemical visualization of BrdU
Before the experiment, a pilot study was conducted to test and optimise the
method. It was found that intraperitoneal injection of 100 mg BrdU per kg body weight
was sufficient to get a clear staining. The staining protocol given in the following was
developed running bioassays to find the optimal conditions for antigen binding. For
detailed protocol see Appendix 2.
48h following fixation in 4% paraformaldehyde, the brains were transferred to
30% sucrose in 0.01M PBS for cryoprotection. After another 48h, brains were immersed
in Tissue Tek optimal cutting temperature (OCT) coumpund, and frozen by immersion in
isopentane kept at its freezing point (-160 °C) by immersion in liquid nitrogen. The
olfactory bulbs and telencephali of frozen brains were sectioned in a cryostat in the
transverse plane to a thickness of 35 µm and mounted on SuperFrost Plus slides (Menzel-
Gläser). Sections were dried for 12-18h at room temperature and stored at -80°C until
use.
Frozen sections were thawed for 20 min at room temperature and incubated in
2.0M HCl for 60 minutes at 37 °C to denature DNA and make the incorporated BrdU
more available for antibody binding. They were then incubated in 6% PBT (PBS with
BSA and Triton X-100) at room temperature for 60 min. Bovine serum albumin binds to
the cellular carbohydrates and blocks interference with antibodies and reduces
background binding of antibodies in general. Triton X-100 is a non-denaturing, non-ionic
detergent used to solubilize proteins, and thus permeabilizes membranes for easy
antibody passage. Sections were then incubated with mouse anti- BrdU IgG (1:400) at 4
°C in a humidified chamber overnight. After incubation with primary antibody, sections
were rinsed in PBS and treated with 1.4% H2O2 for 15 min to quench endogenous
peroxidase activity. The sections were incubated with secondary antibody; polyclonal
rabbit anti-mouse IgG (1:50) for 60 min at room temperature whereupon they were rinsed
in PBS and incubated with a mouse peroxidase anti- peroxidase (PAP) complex (1:100)
at room temperature for 45 min. After rinsing in PBS, a DAB solution was applied and
left to work for 5-10 min (optimal staining was determined by watching the staining
process in a light microscope). Sections were counterstained in haematoxylin for 45s,
dried and coverslipped with DAKO permanent mounting medium.

28
The time limitations of the master project allowed only for investigation of half of
the animals from each group (n = 15). Sections from the gastrointestinal tract were used
as positive controls for BrdU incorporation. These were positive in all investigated
animals. Two method controls were run; brain sections from fish not injected with BrdU,
and sections containing BrdU that were incubated with 0.6% PBT instead of anti-BrdU.
Both tests were negative.
2.3.2 Quantification of BrdU-positive cells
Every 9th 35 µm section throughout the telencephalon was investigated using a
light microscope (Zeiss Axioplan 2 imaging) and photographed with an Axiocam HR
camera (resolution 2600x2060 pixels). The area of each telencephalic section was
calculated using Adobe Photoshop 7.0 software. Telencephalic areas were identified
according to the rainbow trout telencephalic atlas by Northcutt and Davis (1983)
(Appendix 1), and all the BrdU-positive cells within these areas were counted in each
analyzed section. To estimate each animal’s rate of brain cell proliferation, the total
number of BrdU-positive cells counted in all sections from one telencephalon was
divided by the total volume of the same sections, giving a relative cell count reflecting
the telencephalon’s total amount of BrdU-positive cells. This is a good approximation for
finding the exact ratio of stained to unstained cells, as the total number of cells in the fish
brain in juvenile animals correlates with the absolute volume of the brain (Zupanc and
Horschke, 1995). The total number of BrdU-positive cells was also plotted against
growth rate to investigate the relationship between whole body growth rate and
telencephalic growth rate.

29
2.4 Radioimmunoassay (RIA) quantification of plasma cortisol
The principle for the competitive RIA is competitive binding of a known amount
of a labelled antigen and an unknown amount of unmarked antigen to a fixed amount of
antibody (Figure 2.4). The known amount of a labelled antigen, in this case tritiated
cortisol, is mixed with a sample containing an unknown amount of the unlabelled antigen
(e.g. an endogenous hormone). The fixed amount of a specific antibody with less binding
sites than there are corresponding antigen molecules in the solution is added to the mix.
The mix is incubated, allowing the labelled and unlabelled antigens to compete for
binding with the antibody. After chemical equilibrium is reached, the proportions of
labelled to unlabelled antigen both bound to antibody and free in solution will be the
same as the original proportion between the two. The free antigens are then removed by
binding to dextran coated charcoal, which is spun down in a centrifuge, while the
antibody-antigen-complex remains in solution. The amount of labelled antigen in the
solution can be measured in a scintillation counter. The count of disintegrations per min
(dpm) is inversely proportional to the original concentration of unlabelled antigen in the
sample, and the numerical values can be determined running standard solutions with
known amounts of unlabelled antigens.
Figure 2.4 The principle of competitive RIA. A fixed amount of marked antigen is added to an unknown
sample containing unmarked antigen. These are let to compete for binding to antibodies, whereupon all free
antigens are removed from the solution. The amount of marked antigen bound to antibodies can be
quantified and is inversely proportional to the initial amount of unmarked antibody in the sample.

30
Levels of cortisol in plasma were analyzed using a RIA protocol previously
validated by Pickering et al. (Pickering et al., 1987). A detailed protocol for the RIA
procedure is provided in Appendix 3. Frozen plasma samples were thawed slowly at 4°C
to avoid clotting. For steroid extraction, ethyl acetate amounting to five times the volume
of plasma was added, tubes were vortexed and centrifuged briefly. Extracted samples
were stored at –20 °C until use.
Ethyl acetate containing extracted steroids was pipetted into tubes; if the unknown
sample was expected to contain much cortisol (stressed fish), 20 µL was used, in the
opposite case (unstressed fish), 150 µL was used. 50 µL of tritiated cortisol in ethyl
acetate (previously determined to a count of approximately 20000 dpm per 50 µL) was
added to each sample, and to control samples containing known amounts of
hydrocortisone in ethyl acetate. Samples were dried in a vacuum exsiccator coupled to a
water jet pump. Residues were dissolved in 100 µL assay buffer (0.1% BSA in PBS) and
100 µL rabbit anti-cortisol (1:10) was added. Tubes were vortexed and incubated for 1 h
at room temperature, 2 h at 4 °C and finally for 15 min on ice. 100 µL of dextran coated
charcoal (0.5% charcoal and 0.1% dextran in PBS) was added to all tubes before
vortexing and incubation on ice for 5 min. Charcoal was spun down (3500 rpm, 4 °C, 10
min) and 200 µL of supernatant was pipetted into scintillation cocktail, mixed by
inversion and analyzed in a Packard Tri-Carb Liquid Scintillation Analyzer under
standard tritium conditions.

31
2.5 Statistical analyses
All statistical analyses were performed in STATISTICA for Windows (StatSoft,
Inc., Tulsa, Oklahoma). Data on weight, plasma cortisol, and BrdU immunostaining
fulfilled the criteria for parametric statistics, and were compared between groups by one-
way ANOVA followed by the Tukey post-hoc test. Correlations between BrdU
immunostaining and two variables, growth rate and plasma cortisol, were analysed by
Pearsson statistics. Homogeneity of variance and Gaussian distribution were confirmed
by Levene's test and the Kolmogorov-Smirnov method, respectively.
For feeding score data, parametric ANOVA was used to compare sums of scores
on day 1-9 and 10-13 between groups. To confirm the effect of the injection procedure on
feeding behavior within each group, scores on the day of injection were compared to
those on the previous day by non-parametric Kruskall-Wallis ANOVA followed by
repeated Mann-Whitney U-tests, with Bonferroni adjustment for multiple corrections.
This procedure was chosen since scores on a single day amounted to a discrete variable
with only 4 possible outcomes (0, 1, 2, or 3), which renders parametric statistics
inappropriate even if homogeneity of variance or normality criteria are not violated (Zar,
1999).

32
3 Results
3.1 Effects of social status on behaviour and cortisol
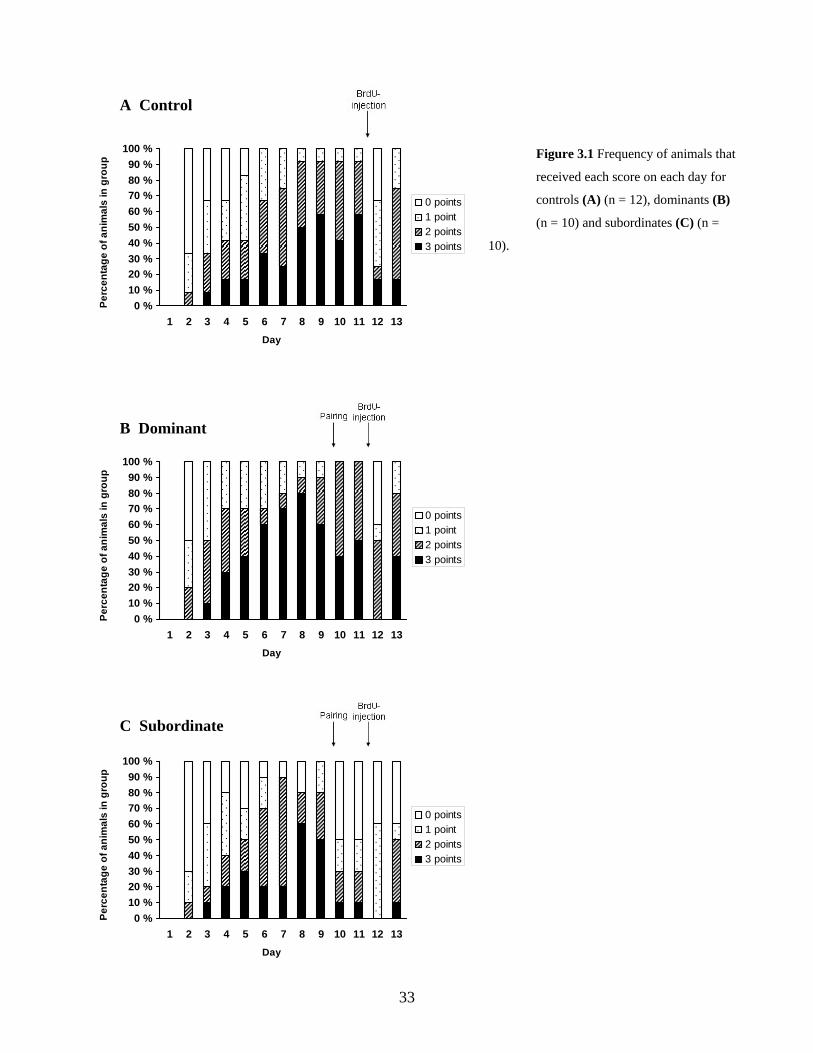
The daily frequency of fish receiving each feeding score in all of the groups is
given in Figure 3.1. Total feeding score obtained on day 1-9 (isolated period) and 10-13
(interaction in pairs) were compared statistically. During the first 9 days, there was no
significant difference in the mean feeding scores between the fish that were to become
dominant, subordinate and controls (ANOVA; F(2,29) = 1.50, P=0.14) (Figure 3.2A) There
was, however, a tendency of future subordinates scoring less than future dominants, with
the controls being intermediate between the other two groups.
Upon removal of walls between adjoining compartments on day 9, clear
dominance-subordination relationships were observed in all pairs and in no instance did
the relationship change during the experiment. In 7 out of 10 pairs, one of the fish had
started feeding at an earlier point than its partner, and in all of these 7 instances, the fish
that had started feeding first also became the dominant animal.
During day 10-13, when the fish were paired, subordinate fish scored significantly
lower on the feeding test than both dominants and controls (ANOVA; F(2,29) = 10.57,
P<0.001, See Table 1, Appendix 4 for Tukey Post-hoc statistics). There was no difference
between the control group and the dominant fish (Figure 3.2B).
A drop in feeding scores was observed after the BrdU-injection on day 12 (Figure
3.1).This was analyzed using Kruskal-Wallis ANOVA by ranks followed by repeated
Mann-Whitney U-tests directly comparing the score on day 11 and day 12 within each
group. The drop was significant (Kruskal-Wallis ANOVA; P < 0.001) in both the control
group (P = 0.003), and in the dominant group (P = 0.002). It was not significant in the
subordinate group (P = 0.74), though this is not surprising, since the feeding scores in this
group were already rather low. For this test a Bonferroni adjustment for multiple
comparisons was made, giving an adjusted alpha of 0.009).
33
0 %10 %20 %30 %40 %50 %60 %70 %80 %90 %
100 %
1 2 3 4 5 6 7 8 9 10 11 12 13Day
Perc
enta
ge o
f ani
mal
s in
gro
up
0 points1 point2 points3 points
0 %10 %20 %30 %40 %50 %60 %70 %80 %90 %
100 %
1 2 3 4 5 6 7 8 9 10 11 12 13Day
Perc
enta
ge o
f ani
mal
s in
gro
up
0 points1 point2 points3 points
0 %10 %20 %30 %40 %50 %60 %70 %80 %90 %
100 %
1 2 3 4 5 6 7 8 9 10 11 12 13Day
Perc
enta
ge o
f ani
mal
s in
gro
up
0 points1 point2 points3 points
A Control
Figure 3.1 Frequency of animals that
received each score on each day for
controls (A) (n = 12), dominants (B)
(n = 10) and subordinates (C) (n =
10).
B Dominant
C Subordinate

34
0
200
400
600
Plas
ma
cort
isol
(ng/
ml)
Control
Dominant
Subordinate
aa
b
0
200
400
600
Plas
ma
cort
isol
(ng/
ml)
Control
Dominant
Subordinate
aa
b
0
4
8
12
Feed
ing
scor
e Control
Dominant
Subordinate
a a
b
0
4
8
12
Feed
ing
scor
e Control
Dominant
Subordinate
a a
b
0
5
10
15
20
Feed
ing
scor
e
0
5
10
15
20
Feed
ing
scor
e A Feeding day 1-9 B Feeding day 10-13
Figure 3.2 Total feeding scores (Mean + S.E.M.) (A) Feeding scores of isolated rainbow trout obtained
during day 1-9 of the experiment. Bars are grouped according to later social status. ANOVA revealed no
significant difference between groups (P = 0.14). (B) Feeding scores of socially interacting rainbow trout
and isolated controls obtained during day 10-13 of the experiment. Different letters indicate a statistically
significant difference between groups (P < 0.05, ANOVA followed by Tukey post-hoc tests). See text for
ANOVA statistics and significance levels.
Mean plasma cortisol levels for all groups are shown in Figure 3.3. Subordinate
animals shows a marked elevation in plasma cortisol compared to both controls and
dominants (ANOVA: F(2,29) = 6.00, P = 0.007, See Table 2, Appendix 4 for Tukey Post-
hoc statistics).
Figure 3.3 Social modulation of plasma cortisol
levels in juvenile rainbow trout. Group means +
S.E.M. are graphed. Different letters indicate a
statistically significant difference between
groups (p<0.05, ANOVA followed by Tukey
post-hoc tests). See text for ANOVA statistics
and significance levels.

35
3.2 BrdU immunohistochemistry
In 15 fish, 5 from each group (control,
subordinate and dominant) sections of the
telencephalon were stained for BrdU immuno-
histochemistry. BrdU-positive cells were easily
recognized and identified by dense homogenous
staining of their nuclei (Figure 3.4). Immuno-
positive cells were found sparsely scattered
in all subdivisions of the telencephalon, but with Figure 3.4 BrdU-positive cells
aggregations in distinct proliferative zones. The
most rostral proliferation zone, PZ1b is located in the ependyma of the internal cellular
layer (ICL) of the most caudal part of the olfactory bulbs. This zone extends caudally into
the most rostral part of the ventral telencephalon (Vd and Vv) (Figure 3.5A,a). At this
point, the most rostral part of PZ2 is located in the dorsal nuclei of V (Vd). PZ2 extends
caudally through Vd approximately to the anterior commissure (Figure 3.5B-C,c,e and
3.6D,g), and to a lesser degree further caudally (3.6E,j). PZ1a extends over the whole
surface of D and in the lateral V, with aggregations in lateral and medial D (Dl and Dm)
(Figure 3.5A-C,b,d,f and 3.6D-F,h,i,l).

36
Figure 3.5 Transverse sections of the anterior part of the telencephalon of a subordinate rainbow trout,
every 9th 35 µm section. BrdU stained cells are visible in magnified sections. Proliferation zones are
identified by Arabic numerals. For abbreviations see list. PZ1a (A,B,C,b,d,f) extends over the whole
surface of D and in the lateral V, with aggregations in Dl and Dm. PZ1b (A,a) is located in the ependyma
of the ICL of the most caudal part of the olfactory bulbs. This zone extends caudally into the most rostral
part of the ventral telencephalon (Vd and Vv). PZ2 (B,C,c,e) is located in the dorsal nuclei of V (Vd),
extending caudally through Vd. Scale bar = 500 µm.

37
Figure 3.6 Transverse sections of the anterior part of the telencephalon of a subordinate rainbow trout.
Proliferation zones are identified by Arabic numerals. For abbreviations see list. PZ1a (D,E,F,h,i,l) extends
over the whole surface of D and in the lateral V, with aggregations in Dl and Dm. PZ2 (D,E,g,j) is located
in the dorsal nuclei of V (Vd), extending caudally through Vd approximately to the anterior commissure,
and to a lesser degree further caudally. Scale bar = 500 µm. ---------------------------------------------------------------------------------------------------------------------------- Abbreviations for Figures 3.4 and 3.5
D area dorsalis telencephali ECL external cellular layer of olfactory bulb Dc central zone of D GL glomerular layer of olfactory bulb Dd dorsal zone of D ICL internal cellular layer of olfactory bulb Dl lateral zone of D PP periventricular preoptic nucleus Dld dorsal part of Dl V area ventralsi telencephali Dlv ventral part of Dl Vc commissural nucleus of V Dm medial zone of D Vd dorsal nucleus of V Dp posterior zone of D Vl lateral nucleus of V E nucleus entopeduncularis Vv ventral nucleus of V

38
3.3 Effect of social status on telencephalic cell proliferation
Quantification of BrdU immunostaining confirmed that social status affected the
number of BrdU-positive cells in the telencephalon. Specifically, there was a significant
difference in telencephalic cell proliferation between the subordinate fish and the control
group. The dominant group was not significantly different from any other group
(ANOVA: F(2,12) = 5.78, P = 0.017, See Table 3, Appendix 4 for Tukey post-hoc
statistics) (Figure 3.7).
Figure 3.7 Social modulation of brain cell
proliferation in juvenile rainbow trout. Values are
means + S.E.M. Different letters indicate a
statistically significant difference between groups
(P < 0.05, ANOVA followed by Tukey post-hoc
tests, see text for results).
Control
Dominant
Subordinate
0
500
1000
1500
2000
2500
Brd
U p
ositi
ve c
ells
/ m
m3
a
ab
b
Control
Dominant
Subordinate
0
500
1000
1500
2000
2500
Brd
U p
ositi
ve c
ells
/ m
m3
a
ab
b

39
3.4 Cortisol and telencephalic cell proliferation
Telencephalic brain cell counts were plotted against plasma cortisol values to
elucidate an eventual effect of cortisol levels on proliferative rate. There was no
significant correlation found in any of the groups (Control: Pearsson R2 = 0.002, P =
0.94; Dominant: Pearsson: R2 = 0.002, P = 0.94; Subordinate: Pearsson: R2 = 0.002, P =
0.94).
3.5 General growth rate and telencephalic cell proliferation
To investigate whether the reduction of proliferation in subordinates was due to a
whole body down-regulation of cell proliferation and not a specific effect on
neurogenesis, growth rate was investigated in all the groups (Table 3.1). There was no
significant difference between the groups in either start weight, end weight or growth rate
(ANOVA: Start weight; F(2,29) = 0.78, P = 0.47; End weight; F(2,29) = 1.22, P = 0.31;
Growth rate; F(2,29) = 0.52, P = 0.60)
Group Start weight End weight Gr. rate Control 116.9 ± 7.7 133.1 ± 7.9 1.13 ± 0.22
Dominant 132.3 ± 11.3 155.4 ± 12.9 1.38 ± 0.28 Subordinate 130.8 ± 10.8 146.7 ± 10.4 1.03 ± 0.24
Table 3.1 Weight and growth rate given as mean ± S.E.M. See text for ANOVA statistics.

40
Growth rate was also plotted against cell counts in all groups. There was no
significant correlation found in either group (Control: Pearsson R2 = 0.45, P = 0.21;
Dominant: Pearsson: R2 = 0.003, P = 0.93; Subordinate: Pearsson: R2 = 0.003, P = 0.93).
Among those controls that showed a positive growth rate, however, there seemed to be a
linear relationship between growth rate and brain cell proliferation (Figure 3.8, note that
the correlation was only significant if one animal with negative growth rate was left out).
The low n (4), presides that firm conclusions should not be drawn about whether
variation in brain cell proliferation is a reflection of whole body growth rate in isolated
fish.
0
1000
2000
3000
-1 -0.5 0 0.5 1 1.5 2 2.5
R2 = 0.94P = 0.03
Brd
U p
ositi
ve c
ells
/ m
m3
Growth rate % / day
0
1000
2000
3000
-1 -0.5 0 0.5 1 1.5 2 2.5
R2 = 0.94P = 0.03
0
1000
2000
3000
-1 -0.5 0 0.5 1 1.5 2 2.5
R2 = 0.94P = 0.03
Brd
U p
ositi
ve c
ells
/ m
m3
Growth rate % / day Figure 3.8 Relationship between growth rate and brain cell proliferation in those isolated controls that
showed positive growth rates during the experiment. Cell count in one control fish with negative growth is
shown for comparison. Pearsson correlation statistics are shown.

41
4 Discussion
4.1 Methodological considerations
The BrdU method was chosen for its widespread use in studies of neurogenesis in
mammals (Gould et al., 1999b; Fuchs and Gould, 2000), and because it has been used in
most recent studies of brain cell proliferation in teleosts (Zupanc and Horschke, 1995;
Zikopoulos et al., 2000; Ekstrom et al., 2001; Mueller and Wullimann, 2002).
It did appear that the intraperitoneal injection of BrdU was stressful to the
animals, since a significant drop in the feeding scores of dominant and control animals
was seen after the injection. The introduction of an additional stressor may have upset the
behaviour and physiology of the experimental animals in a number of different ways.
Since the injection affected the feeding score of both dominants and subordinates (Figure
3.1) it is very likely that it also, at least acutely, affected the levels of circulating cortisol.
This taken together with the finding that acute stress influences neurogenesis in mammals
(Heine et al., 2004), indicates that it is not unlikely that the injection may have had an
effect on the rate of brain cell proliferation. Though mammals might be trained to tolerate
injections of this kind without eliciting a stress response, this can probably not be done
with teleosts. It is interesting to note that the stressor used by Veenema et al. to
demonstrate differential effects on neurogenesis in different strains of rats was 3 daily
intraperitoneal BrdU-injections. This stress regime resulted in a 50% reduction in
neurogenesis as demonstrated by Ki-67 immunoreactivity in one of the strains (Veenema
et al., 2004).
To circumvent the stressfulness of the BrdU-injection in fish, alternative methods
of administration should be utilized. Cortisol (Øverli et al., 2002) has successfully been
administered to fish through the food, and this could probably also be done with BrdU.
Stress-induced anorexia could, however, be a problem with administering BrdU to
stressed fish. A few studies have been performed by immersion of fish in baths of BrdU-
solution (Brennan et al., 2001; Byrd and Brunjes, 2001). This is very suitable for small
fish, but the amounts of BrdU solution needed for larger fish and the fact that BrdU is

42
carcinogenic and should not be released into the environment renders it an unsuitable
method in most cases. BrdU-administration through intraperitoneal catheters or dorsal
aorta cannulas (Sunde et al., 2003) is also an option, but this can not be performed in
studies including social interaction as fighting would upset or tangle the catheters.
There are also other objections to the BrdU method. BrdU is not an internal
marker, and very little is known about its uptake and movement within the body. The
possibility thus exists that exposure of the animal to different treatments not only will
affect the rate of proliferation, but also the availability of BrdU to different brain
structures (Gould and Gross, 2002; Rakic, 2002). It is a well-known fact that blood flow
in general and cerebral blood flow in particular is tightly regulated and very variable in
mammals. For instantce, the adrenergic response in stress causes both vasodilation and
vasoconstriction in different parts of the body, and the haemodynamic response, which
involves mechamisms for increased blood flow to areas of increased activity, is well
documented (Attwell and Iadecola, 2002). Less is known about this phenomenon in fish,
but it has been shown that the rate of cerebral blood flow is influenced by several
physiological and paracrine factors including anoxia, hypercapnia, adenosine, nitric oxide
and endothelin (Nilsson et al., 1994; Nilsson and Soderstrom, 1997; Soderstrom and
Nilsson, 2000; Rodland and Nilsson, 2002). What is completely unknown, however, is
the mechanisms of BrdU-uptake into the blood flow and further into the brain. There is
thus a possibility that the treatment of experimental animals may affect factors governing
the distribution of BrdU in the body, such as blood flow and blood-brain barrier
permeability, resulting in changes in number of BrdU-stained cells on the basis of other
factors than cell proliferation (Gould and Gross, 2002).
Another problem is that since BrdU stays in the cell permanently, the number of
stained cells will, depending on the survival time after BrdU administration, reflect both
rate of cell proliferation at the time of administration, subsequent rate of cell proliferation
(as stem cells will continue to give rise to new cells with a diminishing amount of BrdU
in their DNA for a limited time period after administration), and cell survival. This can be
an advantage when investigating cell fate, but for studies focusing on proliferation, this
should be taken into consideration both when determining survival time after
administration, and when interpreting data.

43
To circumvent the problems regarding the BrdU method, it is advisable to utilize
endogenous markers of cell proliferation either alone or together with BrdU to validate
the use of BrdU. Proteins that are upregulated during mitosis, such as PCNA or Ki-67,
are good candidates for this method, and are common in use (Wullimann and Puelles,
1999; Ekstrom et al., 2001; Mueller and Wullimann, 2003).
4.2 Effects of social status on brain cell proliferation
Though proliferation in the teleost brain has previously been mapped (Zupanc and
Horschke, 1995; Zikopoulos et al., 2000; Ekstrom et al., 2001) and quantified (Zupanc
and Horschke, 1995), this is the first study to document effects by external stimuli on the
rate of brain cell proliferation in fish. Despite the earlier discussed methodological
problems, it was found that socially subordinate rainbow trout had almost 40 % fewer
BrdU-positive cells in the same analyzed volume from the telencephalon than isolated
controls. This finding is as expected, and in accordance with previous studies of social
stress in mammals, where the number of BrdU-stained hippocampal cells are
significantly reduced after acute or chronic psychosocial stress (Gould et al., 1997; Gould
et al., 1998; Kozorovitskiy and Gould, 2004). The dominant fish, however, were not
found to have significant differences in numbers of BrdU-positive cells from neither
subordinates nor controls.
It is therefore clear that there is an effect of social subordination on the number of
telencephalic BrdU-positive cells. The question thus arises whether this is an effect of
being in the social hierarchy, or whether it is an innate quality of individuals that end up
becoming socially dominant or subordinate. Individual variations in stress coping styles,
the strategy of coping with stressful situations (Koolhaas et al., 1999), seem to be
predictive of whether an animal becomes subordinate or dominant in social hierarchies.
Øverli et al. showed that fish with higher speed of reversal of stress-induced anorexia in 9
out of 10 cases became dominant in social hierarchies (Øverli et al., 2004b). In the
current study, in all cases where one of the fishes in a pair started feeding before the other
(7 out of 10), this individual later became the dominant of the pair. Furthermore, in a

44
rainbow trout breeding program where two lines of fish with divergent cortisol
responsiveness (high responding, HR, showing high cortisol levels and low responding,
LR, showing low cortisol levels when subjected to a standardized stressor) (Pottinger and
Carrick, 1999), the LR fish showed a strong tendency of becoming dominant over HR
individuals in staged fights for social dominance between pairs (Pottinger and Carrick,
2001). This indicates that social status is highly dependent on innate traits, and hence
there is a possibility that the lower BrdU-staining in subordinate animals might be due to
an original difference between dominant and subordinate animals. The feeding and
cortisol data do, however, show that the subordinate animals are stressed, something the
dominant animals do not appear to be, so the reduced amount of BrdU-positive cells in
the subordinate animals could be due to stress, to innate traits or to a combination of both.
The innate trait hypothesis predicts that later dominant animals should have
higher feeding scores than later subordinate animals during the first 9 days. It also
predicts that the feeding scores of the controls should be intermediate between the
dominants’ and the subordinates’. There are, however, no significant differences between
the groups, but the mean score of the dominant group is in absolutes numbers higher than
the mean score of subordinates with controls intermediate (Figure 3.2A). It should also be
mentioned that when comparing only the dominant and subordinate groups, a one-tailed
t-test shows a significant difference between them, indicating that there could be innate
differences between dominant and subordinate fish.
If differences in cell proliferation preceded social interaction in pairs, control
animals should therefore be intermediate between dominants and subordinates in BrdU-
positive cell counts. This is not the case, as the controls have significantly higher counts
than the subordinates and show a strong tendency towards having higher counts than
dominants (Figure 3.7). This suggests a reducing effect of the social interaction on the
amount of BrdU-positive cell, particularly in subordinate animals. The subordinate
animals also show behavioural and hormonal stress responses, something the other
groups do not, and as their cell counts are lower than both the other groups, it is
reasonable to conclude that despite the possibility of innate differences between groups,
social subordination seems to be the main factor involved in reducing the amount of
telencephalic BrdU-positive cells.

45
Very few studies have focused on the cell proliferation of the dominant animals in
social hierarchies, but Kozorvitskiy and Gould (2004) found dominant rats in a visual
burrow system (VBS) to have higher numbers of hippocampal BrdU-positive cells than
both control and subordinate animals. This was, however, after a survival time of 14 days
compared to this experiment’s 24 h, and the socially interacting animals were housed in
enriched environments compared to the controls, which is known to increase
neurogenesis (Kempermann et al., 1997). Therefore it is inconvenient to compare these
data with the current experiment. Possible reasons for the tendency of reduced
proliferation in dominant animals will be discussed in section 4.3.
To study the possibility of individual differences in cell proliferation further, it
would be of interest to investigate the basal count of telencephalic BrdU-positive cells in
a larger group of unstressed animals, and look for correlations with hormonal and
behavioural data. It would also be of interest to do the same kind of investigation in both
unstressed and stressed animals of the LR and HR lines of the fish selected for cortisol
responsiveness. In mice similarly selected for different stress coping styles (short attack
latency, SAL, corresponding with LR fish, and long attack latency, LAL, corresponding
with HR fish), the LAL mice had a slightly, but significantly lower basal hippocampal
cell proliferation rate than the SAL mice, and a reduction of almost 50% under stressful
conditions (Veenema et al., 2004).

46
4.3 Possible mechanisms for reduction of telencephalic brain cell
proliferation
Stress and elevated cortisol levels have been found to reduce food intake and
growth rate in fish (McCormick et al., 1998; Gregory and Wood, 1999; Bernier and Peter,
2001). There is a possibility that the reduced amount of BrdU-positive cells in the
subordinate animals can be a result of a whole body down-regulation of growth rate and
not a specific effect on brain cell proliferation. Even though in this experiment
subordinates did not stop eating altogether (Figure 3.2B), they showed a drastic reduction
in feeding. There is still no significant difference in growth rate between the groups
(Table 3.1), and there is no significant correlation between growth rate and BrdU-positive
cell count. In our control group there appears to be a correlation between growth rate and
cell counts of animals with positive growth rates (Figure 3.8), but there are too few
observations to draw any conclusions about the relationship between basal levels of
BrdU-staining and whole body growth rate.
Øverli et al. showed that subordinate fish had a higher growth rate than dominant
fish when reared in isolation prior to social interaction in pairs, despite that they had
lower food intake than dominants (Øverli et al., 2004b). In addition it has been found that
subordinate animals have a lower growth rate than dominants while interacting socially
(Abbott and Dill, 1989; Winberg et al., 1992). In this experiment the fishes were not
weighted at the day of pairing, to avoid stressful disturbances of the animals. Thus, there
can have been opposing differences in growth rate of the subordinate animals before and
after the pairing that have cancelled each other out. Hence the reduction in brain cell
proliferation found in the subordinate animals can be a reflection of a whole body down-
regulation in growth rate. It is, however, of little importance for the possible cognitive
consequences of the reduction in telencephalic cell proliferation whether the change was
brought about by a whole body down-regulation of cell proliferation, or a specific effect
on the brain.
Concerning the mechanisms of reduction in adult mammalian neurogenesis, the
HPA axis is central. As mentioned earlier, increased levels of glucocorticoids reduce the
rate of hippocampal neurogenesis (Gould et al., 2000), and the hippocampus has a

47
particularly high density of glucocorticoid receptors (Sapolsky et al., 1986). The neuronal
stem cells do not appear to express these receptors, though (Gould et al., 2000),
indicating that the glucocorticoid regulation of neurogenesis occurs via messengers from
other hippocampal, glucocorticoid sensitive cells. A candidate for this kind of messenger
is brain-derived neurotrophic factor (BDNF). BDNF mRNA levels of the hippocampus
(and other brain structures) are indeed reduced in response to chronic stress and increased
glucocorticoid levels (Smith et al., 1995; Tapia-Arancibia et al., 2004). There is also a
close correlation between other factors that alter BDNF mRNA and those modifying
neurogenesis (Falkenberg et al., 1992; Ickes et al., 2000; Marmigere et al., 2003).
Chronic SSRI treatment, for instance, increases BDNF mRNA levels as well as
neurogenesis (Tapia-Arancibia et al., 2004), indicating that BDNF may be one of the
main mediators of neurogenesis regulation. A teleost BDNF analogue has been identified
(Hashimoto and Heinrich, 1997), and the reduction of brain cell proliferation in the
subordinates of the current study may thus be due to a cortisol-induced reduction in
BDNF levels in the telencephalon.
The measured cortisol levels can not explain the tendency of reduction in
telencephalic cell proliferation in the dominant animals. BDNF levels are, however,
regulated by other factors besides glucocorticoids, including glutamate, acetylcholine,
serotonin and GABA (Tapia-Arancibia et al., 2004), though it is not evident which of
these may be involved in dominant animals. The measured cortisol levels are also only
instantaneous values from the moment the fishes were sacrificed, and a low cortisol level
at the moment of sampling does not rule out the possibility that the dominant animals can
have had elevated cortisol levels at earlier times during the experiment. In particular, the
BrdU injection can have been more stressful to the dominant animals than the controls
due to their being in a social hierarchy. These considerations are, however, only
speculations and the apparent reduction was not significant, so it may be a random effect
related to low n. Further studies should therefore be carried out shed light over the
findings of this study.

48
4.4 Conclusions
In conclusion, this study indicates that the BrdU method applying intraperitoneal
administration is stressful to the animals and thus inappropriate for studying effects of
social status on brain cell proliferation in fish. The use of alternative methods for
administration or endogenous markers for proliferation is suggested for future
experiments.
Further, social subordination in rainbow trout causes a significant reduction of
cell proliferation in the telencephalon. This reduced proliferation may in part be a result
of innate differences between animals that become dominant and subordinate in social
hierarchies. The increased stress of the subordination is, however, likely to be the main
cause of the drop in proliferation, and the increased plasma cortisol levels found in these
animals is suggested to mediate the effect of the stress on proliferation.
The dominant position of social hierarchies is not associated with a significant
reduction in telencephalic cell proliferation, but there was a clear tendency for this. As
the dominants did not have increased plasma cortisol levels at the time of sampling, other
mechanisms could be involved in causing this tendency. Further studies are, however
needed to confirm and elucidate these relationships as well as details regarding the drop
in proliferation seen in subordinates.

49
References
Abbott JC, Dill LM (1989) The Relative Growth of Dominant and Subordinate Juvenile Steelhead Trout (Salmo-Gairdneri) Fed Equal Rations. Behaviour 108:104-113.
Adams CE, Huntingford FA, Turnbull JF, Beattie C (1998) Alternative competitive strategies and the cost of food acquisition in juvenile Atlantic salmon (Salmo salar). Aquaculture 167:17-26.
Albonetti ME, Farabollini F (1992) Behavioral-Responses to Single and Repeated Restraint in Male and Female Rats. Behavioural Processes 28:97-110.
Andries S, Nelissen MHJ (1990) A Study of the Dominance Hierarchy in 4 Mbuna-Species - Melanochromis-Johanni, M-Auratus, Pseudotropheus-Ornatus and P-Lombardoi (Teleostei, Cichlidae). Belgian Journal of Zoology 120:165-193.
Attwell D, Iadecola C (2002) The neural basis of functional brain imaging signals. Trends in Neurosciences 25:621-625.
Bachman RA (1984) Foraging Behavior of Free-Ranging Wild and Hatchery Brown Trout in a Stream. Transactions of the American Fisheries Society 113:1-32.
Bartolomucci A, Pederzani T, Sacerdote P, Panerai AE, Parmigiani S, Palanza P (2004) Behavioral and physiological characterization of mate mice under chronic psychosocial stress. Psychoneuroendocrinology 29:899-910.
Bernier NJ, Peter RE (2001) The hypothalamic-pituitary-interrenal axis and the control of food intake in teleost fish. Comparative Biochemistry and Physiology B-Biochemistry & Molecular Biology 129:639-644.
Bingman VP, Mench JA (1990) Homing Behavior of Hippocampus and Para-Hippocampus Lesioned Pigeons Following Short-Distance Releases. Behavioural Brain Research 40:227-238.
Birse SC, Leonard RB, Coggeshall RE (1980) Neuronal Increase in Various Areas of the Nervous-System of the Guppy, Lebistes. Journal of Comparative Neurology 194:291-301.
Blair HT, Sotres-Bayon F, Moita MAP, Ledoux JE (2005) The lateral amygdala processes the value of conditioned and unconditioned aversive stimuli. Neuroscience 133:561-569.
Bliss EL, Ailion J, Zwanzige.J (1968) Metabolism of Norepinephrine Serotonin and Dopamine in Rat Brain with Stress. Journal of Pharmacology and Experimental Therapeutics 164:122-&.
Bradford MR (1995) Comparative Aspects of Forebrain Organization in the Ray-Finned Fishes - Touchstones or Not. Brain Behavior and Evolution 46:259-274.
Brandstatter R, Kotrschal K (1990) Brain Growth-Patterns in 4 European Cyprinid Fish Species (Cyprinidae, Teleostei) - Roach (Rutilus-Rutilus), Bream (Abramis-Brama), Common Carp (Cyprinus-Carpio) and Sabre Carp (Pelecus-Cultratus). Brain Behavior and Evolution 35:195-211.
Brennan LM, Boncavage-Hennessey EM, Wolfe MJ, Toussaint MW, Dennis WE, Rosencrance AB, Gardner HS (2001) An in vivo method for using 5-bromo-2 '-deoxyuridine (BrdU) as a marker of chemically-induced hepatocellular
50
proliferation in the Japanese medaka (Oryzias latipes). Toxicologic Pathology 29:387-397.
Bury NR, Sturm A, Le Rouzic P, Lethimonier C, Ducouret B, Guiguen Y, Robinson-Rechavi M, Laudet V, Rafestin-Oblin ME, Prunet P (2003) Evidence for two distinct functional glucocorticoid receptors in teleost fish. Journal of Molecular Endocrinology 31:141-156.
Butler AB (2000) Topography and topology of the teleost telencephalon: a paradox resolved. Neuroscience Letters 293:95-98.
Butler AB, Hodos W (1996) Comparative vertebrate neuroanatomy. Wiley-Liss Inc, New York.
Byrd CA, Brunjes PC (2001) Neurogenesis in the olfactory bulb of adult zebrafish. Neuroscience 105:793-801.
Cameron HA, Woolley CS, McEwen BS, Gould E (1993) Differentiation of Newly Born Neurons and Glia in the Dentate Gyrus of the Adult-Rat. Neuroscience 56:337-344.
Cannon WB (1929) Bodily changes in Pain, Hunger, Fear and Rage. Branford, Boston. Chrousos GP (1998) Stressors, stress, and neuroendocrine integration of the adaptive
response - The 1997 Hans Selye Memorial Lecture. In: Stress of Life, pp 311-335. Chrousos GP, Gold PW (1992) The Concepts of Stress and Stress System Disorders -
Overview of Physical and Behavioral Homeostasis. Jama-Journal of the American Medical Association 267:1244-1252.
Colombe L, Fostier A, Bury N, Pakdel F, Guiguen Y (2000) A mineralocorticoid-like receptor in the rainbow trout, Oncorhynchus mykiss: cloning and characterization of its steroid binding domain. Steroids 65:319-328.
De Kloet ER, Vreugdenhil E, Oitzl MS, Joels M (1998) Brain corticosteroid receptor balance in health and disease. Endocrine Reviews 19:269-301.
DeKloet ER (1996) Functional implications of brain corticosteroid receptor diversity. Medicina-Buenos Aires 56:633-633.
Dekloet ER, Reul J (1987) Feedback Action and Tonic Influence of Corticosteroids on Brain-Function - a Concept Arising from the Heterogeneity of Brain Receptor Systems. Psychoneuroendocrinology 12:83-105.
Eichenbaum H (1999) The hippocampus and mechanisms of declarative memory. Behavioural Brain Research 103:123-133.
Eichenbaum H, Otto T, Cohen NJ (1992) The Hippocampus - What Does It Do. Behavioral and Neural Biology 57:2-36.
Ekström P, Johnsson CM, Ohlin LM (2001) Ventricular proliferation zones in the brain of an adult teleost fish and their relation to neuromeres and migration (secondary matrix) zones. Journal of Comparative Neurology 436:92-110.
Fabbri E, Capuzzo A, Moon TW (1998) The role of circulating catecholamines in the regulation of fish metabolism: An overview. Comparative Biochemistry and Physiology C-Toxicology & Pharmacology 120:177-192.
Falkenberg T, Mohammed AK, Henriksson B, Persson H, Winblad B, Lindefors N (1992) Increased Expression of Brain-Derived Neurotrophic Factor Messenger-Rna in Rat Hippocampus Is Associated with Improved Spatial Memory and Enriched Environment. Neuroscience Letters 138:153-156.

51
Fuchs E, Flugge G (1998) Stress, glucocorticoids and structural plasticity of the hippocampus. Neuroscience and Biobehavioral Reviews 23:295-300.
Fuchs E, Gould E (2000) In vivo neurogenesis in the adult brain: regulation and functional implications. European Journal of Neuroscience 12:2211-2214.
Fuchs E, Flugge G (2003) Chronic social stress: effects on limbic brain structures. Physiology & Behavior 79:417-427.
Fuchs E, Czeh B, Flugge G (2004a) Examining novel concepts of the pathophysiology of depression in the chronic psychosocial stress paradigm in tree shrews. Behavioural Pharmacology 15:315-325.
Fuchs E, Czeh B, Kole MHP, Michaelis T, Lucassen PJ (2004b) Alterations of neuroplasticity in depression: the hippocampus and beyond. European Neuropsychopharmacology 14:S481-S490.
Gould E, Tanapat P (1999) Stress and hippocampal neurogenesis. Biological Psychiatry 46:1472-1479.
Gould E, Gross CG (2002) Neurogenesis in adult mammals: Some progress and problems. Journal of Neuroscience 22:619-623.
Gould E, Tanapat P, Rydel T, Hastings N (2000) Regulation of hippocampal neurogenesis in adulthood. Biological Psychiatry 48:715-720.
Gould E, McEwen BS, Tanapat P, Galea LA, Fuchs E (1997) Neurogenesis in the dentate gyrus of the adult tree shrew is regulated by psychosocial stress and NMDA receptor activation. J Neurosci 17:2492-2498.
Gould E, Tanapat P, McEwen BS, Flugge G, Fuchs E (1998) Proliferation of granule cell precursors in the dentate gyrus of adult monkeys is diminished by stress. Proceedings of the National Academy of Sciences of the United States of America 95:3168-3171.
Gould E, Beylin A, Tanapat P, Reeves A, Shors TJ (1999a) Learning enhances adult neurogenesis in the hippocampal formation. Nature Neuroscience 2:260-265.
Gould E, Reeves AJ, Fallah M, Tanapat P, Gross CG, Fuchs E (1999b) Hippocampal neurogenesis in adult Old World primates. Proceedings of the National Academy of Sciences of the United States of America 96:5263-5267.
Gratzner HG (1982) Monoclonal-Antibody to 5-Bromodeoxyuridine and 5-Iododeoxyuridine - a New Reagent for Detection of DNA-Replication. Science 218:474-475.
Gratzner HG, Leif RC, Ingram DJ, Castro A (1975) Use of Antibody Specific for Bromodeoxyuridine for Immunofluorescent Determination of DNA-Replication in Single Cells and Chromosomes. Experimental Cell Research 95:88-94.
Greenwood AK, Butler PC, White RB, DeMarco U, Pearce D, Fernald RD (2003) Multiple corticosteroid receptors in a teleost fish: Distinct sequences, expression patterns, and transcriptional activities. Endocrinology 144:4226-4236.
Gregory TR, Wood CM (1999) The effects of chronic plasma cortisol elevation on the feeding behaviour, growth, competitive ability, and swimming performance of juvenile rainbow trout. Physiological and Biochemical Zoology 72:286-295.
Habib M (1998) Neurology of emotions: An overview of experimental and clinical evidence. Revue De Neuropsychologie 8:471-535.
Hamilton A (1901) The division of differentiated cells in the central nervous system of the white rat. Journal of Comparative Neurology 11:297-320.

52
Hashimoto M, Heinrich G (1997) Brain-derived neurotrophic factor gene expression in the developing zebrafish. International Journal of Developmental Neuroscience 15:983-997.
Heine VM, Maslam S, Zareno J, Joels M, Lucassen PJ (2004) Suppressed proliferation and apoptotic changes in the rat dentate gyrus after acute and chronic stress are reversible. European Journal of Neuroscience 19:131-144.
Herman JP, Cullinan WE (1997) Neurocircuitry of stress: Central control of the hypothalamo-pituitary-adrenocortical axis. Trends in Neurosciences 20:78-84.
Ickes BR, Pham TM, Sanders LA, Albeck DS, Mohammed AH, Granholm AC (2000) Long-term environmental enrichment leads to regional increases in neurotrophin levels in rat brain. Experimental Neurology 164:45-52.
Iwama GK, Pickering AD, Sumpter JP, Schreck CBe (1997) Fish stress and health in aquaculture, Cambridge University Press, Cambridge.
Jacobson L, Sapolsky R (1991) The Role of the Hippocampus in Feedback-Regulation of the Hypothalamic-Pituitary-Adrenocortical Axis. Endocrine Reviews 12:118-134.
Joels M, Karst H, Alfarez D, Heine VM, Qin YJ, Van Riel E, Verkuyl M, Lucassen PJ, Krugers HJ (2004) Effects of chronic stress on structure and cell function in rat hippocampus and hypothalamus. Stress-the International Journal on the Biology of Stress 7:221-231.
Kalleberg H (1958) Observations in a stream tank of territoriality and competition in juvenile salmon and trout. Report of the Institute of Freshwater Research, Drottningholm 39:55-98.
Kempermann G, Kuhn HG, Gage FH (1997) More hippocampal neurons in adult mice living in an enriched environment. Nature 386:493-495.
Koolhaas JM, Korte SM, De Boer SF, Van Der Vegt BJ, Van Reenen CG, Hopster H, De Jong IC, Ruis MAW, Blokhuis HJ (1999) Coping styles in animals: current status in behavior and stress-physiology. Neuroscience and Biobehavioral Reviews 23:925-935.
Kozorovitskiy Y, Gould E (2004) Dominance hierarchy influences adult neurogenesis in the dentate gyrus. J Neurosci 24:6755-6759.
Kuhn HG, DickinsonAnson H, Gage FH (1996) Neurogenesis in the dentate gyrus of the adult rat: Age-related decrease of neuronal progenitor proliferation. Journal of Neuroscience 16:2027-2033.
Leyhausen C, Kirschbaum F, Szabo T, Erdelen M (1987) Differential Growth in the Brain of the Weakly Electric Fish, Apteronotus-Leptorhynchus (Gymnotiformes), During Ontogeny. Brain Behavior and Evolution 30:230-248.
Lopez JC, Broglio C, Rodriguez F, Thinus-Blanc C, Salas C (2000) Reversal learning deficit in a spatial task but not in a cued one after telencephalic ablation in goldfish. Behavioural Brain Research 109:91-98.
Lopez JF, Akil H, Watson SJ (1999) Neural circuits mediating stress. Biological Psychiatry 46:1461-1471.
Maclean PD (1955) The Limbic System (Visceral Brain) and Emotional Behavior. Archives of Neurology and Psychiatry 73:130-134.
Marchetti MP, Nevitt GA (2003) Effects of hatchery rearing on brain structures of rainbow trout, Oncorhynchus mykiss. Environmental Biology of Fishes 66:9-14.

53
Marmigere F, Givalois L, Rage F, Arancibia S, Tapia-Arancibia L (2003) Rapid induction of BDNF expression in the hippocampus during immobilization stress challenge in adult rats. Hippocampus 13:646-655.
Mason JW (1968) A Review of Psychoendocrine Research on Sympathetic-Adrenal Medullary System. Psychosomatic Medicine 30:631-&.
McCormick SD, Shrimpton JM, Carey JB, O'Dea MF, Sloan KE, Moriyama S, Bjornsson BT (1998) Repeated acute stress reduces growth rate of Atlantic salmon parr and alters plasma levels of growth hormone, insulin-like growth factor I and cortisol. Aquaculture 168:221-235.
McEwen BS (2000) The neurobiology of stress: from serendipity to clinical relevance. Brain Research 886:172-189.
McEwen BS, Stellar E (1993) Stress and the Individual - Mechanisms Leading to Disease. Archives of Internal Medicine 153:2093-2101.
Mommsen TP, Vijayan MM, Moon TW (1999) Cortisol in teleosts: dynamics, mechanisms of action, and metabolic regulation. Reviews in Fish Biology and Fisheries 9:211-268.
Morris RGM, Garrud P, Rawlins JNP, Okeefe J (1982) Place Navigation Impaired in Rats with Hippocampal-Lesions. Nature 297:681-683.
Mueller T, Wullimann MF (2002) BrdU-, neuroD (nrd)- and Hu-studies reveal unusual non-ventricular neurogenesis in the postembryonic zebrafish forebrain. Mechanisms of Development 117:123-135.
Mueller T, Wullimann MF (2003) Anatomy of neurogenesis in the early zebrafish brain. Developmental Brain Research 140:137-155.
Nakano S (1995) Individual-Differences in Resource Use, Growth and Emigration under the Influence of a Dominance Hierarchy in Fluvial Red-Spotted Masu Salmon in a Natural Habitat. Journal of Animal Ecology 64:75-84.
Nieuwenhuys R (1962) The morphogenesis and the general structure of the actinopterygian forebrain. Acta Morphol Neerl Scand 5:65-78.
Nieuwenhuys R, Meek J (1990) The telencephalon of actinopterygian fishes. In: Jones EG, Peters A (eds): Cerebral Cortex, Vol 8A New York: Plenum Press:31-73.
Nilsson GE, Soderstrom V (1997) Comparative aspects on nitric oxide in brain and its role as a cerebral vasodilator. Comparative Biochemistry and Physiology a-Molecular & Integrative Physiology 118:949-958.
Nilsson GE, Hylland P, Lofman CO (1994) Anoxia and Adenosine Induce Increased Cerebral Blood-Flow Rate in Crucian Carp. American Journal of Physiology 267:R590-R595.
Nilsson M, Perfilieva E, Johansson U, Orwar O, Eriksson PS (1999) Enriched environment increases neurogenesis in the adult rat dentate gyrus and improves spatial memory. Journal of Neurobiology 39:569-578.
Northcutt RG, Davis RE (1983) Telencephalic organization in ray-finned fishes. In: Davis, R. E., Northcutt, R.G. (eds): Fish Neurobiology, Vol. 2, Higher brain areas and functions. Ann Arbor: University of Michigan Press.203-236.
Oliveira RF, Almada VC (1996) Dominance hierarchies and social structure in captive groups of the Mozambique tilapia Oreochromis mossambicus (Teleostei Cichlidae). Ethology Ecology & Evolution 8:39-55.

54
Perry SF, Bernier NJ (1999) The acute humoral adrenergic stress response in fish: facts and fiction. Aquaculture 177:285-295.
Pickering AD, Pottinger TG, Sumpter JP (1987) On the Use of Dexamethasone to Block the Pituitary-Interrenal Axis in the Brown Trout, Salmo-Trutta-L. General and Comparative Endocrinology 65:346-353.
Pottinger TG, Carrick TR (1999) Modification of the plasma cortisol response to stress in rainbow trout by selective breeding. General and Comparative Endocrinology 116:122-132.
Pottinger TG, Carrick TR (2001) Stress responsiveness affects dominant-subordinate relationships in rainbow trout. Hormones and Behavior 40:419-427.
Prickaerts J, Koopmans G, Blokland A, Scheepens A (2004) Learning and adult neurogenesis: Survival with or without proliferation? Neurobiology of Learning and Memory 81:1-11.
Puglisiallegra S, Imperato A, Angelucci L, Cabib S (1991) Acute Stress Induces Time-Dependent Responses in Dopamine Mesolimbic System. Brain Research 554:217-222.
Rakic P (2002) Adult neurogenesis in mammals: An identity crisis. Journal of Neuroscience 22:614-618.
Reiner A, Northcutt RG (1992) An Immunohistochemical Study of the Telencephalon of the Senegal Bichir (Polypterus-Senegalus). Journal of Comparative Neurology 319:359-386.
Rodland TP, Nilsson GE (2002) Endothelin induced cerebral vasoconstriction in rainbow trout, detected in a novel in vitro preparation. Neuroscience Letters 325:195-198.
Rodrigues SM, Schafe GE, LeDoux JE (2001) Intra-amygdala blockade of the NR2B subunit of the NMDA receptor disrupts the acquisition but not the expression of fear conditioning. Journal of Neuroscience 21:6889-6896.
Rodriguez F, Lopez JC, Vargas JP, Broglio C, Gomez Y, Salas C (2002) Spatial memory and hippocampal pallium through vertebrate evolution: Insights from reptiles and teleost fish. Brain Research Bulletin 57:499-503.
Rose JD (2002) The Neurobehavioral nature of fishes and the question of awareness and pain. Reviews in Fisheries Science 10:1-38.
Salas C, Broglio C, Rodriguez F, Lopez JC, Portavella M, Torres B (1996) Telencephalic ablation in goldfish impairs performance in a 'spatial constancy' problem but not in a cued one. Behavioural Brain Research 79:193-200.
Santarelli L, Saxe M, Gross C, Surget A, Battaglia F, Dulawa S, Weisstaub N, Lee J, Duman R, Arancio O, Belzung C, Hen R (2003) Requirement of hippocampal neurogenesis for the behavioral effects of antidepressants. Science 301:805-809.
Sapolsky RM, Krey LC, McEwen BS (1986) The Neuroendocrinology of Stress and Aging - the Glucocorticoid Cascade Hypothesis. Endocrine Reviews 7:284-301.
Seyle H (1950) General summary. In H. Seyle (Ed.), The physiology and pathology of exposure to STRESS: A treatise based on the concepts of the General-Adaptation-Syndrome and the Diseases of Adaptation. Montreal, Canada: Acta:113-792.
Smith MA, Makino S, Kvetnansky R, Post RM (1995) Stress and Glucocorticoids Affect the Expression of Brain-Derived Neurotrophic Factor and Neurotrophin-3 Messenger-Rnas in the Hippocampus. Journal of Neuroscience 15:1768-1777.

55
Soderstrom V, Nilsson GE (2000) Brain blood flow during hypercapnia in fish: no role of nitric oxide. Brain Research 857:207-211.
Squire LR (1992) Memory and the Hippocampus - a Synthesis from Findings with Rats, Monkeys, and Humans. Psychological Review 99:195-231.
Stanford SC (1995) Central noradrenergic neurones and stress. Pharmacology & Therapeutics 68:297-342.
Sumpter JP (1997) The endocrinolog of fishes, In: Iwama, G.K. et al (eds). Fish Stress and Health in Aquaculture, Cambridge University Press.95-118.
Sunde J, Kiessling A, Higgs D, Opstvedt J, Venturini G, Rungruangsak-Torrissen K (2003) Evaluation of feed protein quality by measuring plasma free amino acids in Atlantic salmon (Salmo salar L.) after dorsal aorta cannulation. Aquaculture Nutrition 9:351-360.
Tamashiro KLK, Nguyen MMN, Sakai RR (2005) Social stress: From rodents to primates. Frontiers in Neuroendocrinology 26:27-40.
Tapia-Arancibia L, Rage F, Givalois L, Arancibia S (2004) Physiology of BDNF: focus on hypothalamic function. Frontiers in Neuroendocrinology 25:77-107.
van Praag H, Kempermann G, Gage FH (1999) Running increases cell proliferation and neurogenesis in the adult mouse dentate gyrus. Nature Neuroscience 2:266-270.
Veenema AH, Koolhaas JM, De Kloet ER (2004) Basal and stress-induced differences in HPA axis, 5-HT responsiveness, and hippocampal cell proliferation in two mouse lines. In: Stress: Current Neuroendocrine and Genetic Approaches, pp 255-265.
Winberg S, Nilsson GE (1992) Induction of Social-Dominance by L-Dopa Treatment in Arctic Charr. Neuroreport 3:243-246.
Winberg S, Nilsson GE (1993a) Roles of brain monoamine neurotransmitters in agonistic behaviour and stress reactions, with particular reference to fish. Comparative Biochemistry and Physiology Part C: Comparative Pharmacology and Toxicology 106:597-614.
Winberg S, Nilsson GE (1993b) Time-Course of Changes in Brain Serotonergic Activity and Brain Tryptophan Levels in Dominant and Subordinate Juvenile Arctic Charr. Journal of Experimental Biology 179:181-195.
Winberg S, Lepage O (1998) Elevation of brain 5-HT activity, POMC expression, and plasma cortisol in socially subordinate rainbow trout. American Journal of Physiology-Regulatory Integrative and Comparative Physiology 43:R645-R654.
Winberg S, Nilsson GE, Olsen KH (1991) Social Rank and Brain Levels of Monoamines and Monoamine Metabolites in Arctic-Charr, Salvelinus-Alpinus (L). Journal of Comparative Physiology a-Sensory Neural and Behavioral Physiology 168:241-246.
Winberg S, Nilsson GE, Olsen KH (1992) Changes in Brain Serotonergic Activity During Hierarchical Behavior in Arctic Charr (Salvelinus-Alpinus L) Are Socially Induced. Journal of Comparative Physiology a-Sensory Neural and Behavioral Physiology 170:93-99.
Winberg S, Myrberg AA, Nilsson GE (1996) Agonistic interactions affect brain serotonergic activity in an acanthopterygiian fish: The bicolor damselfish (Pomacentrus partitus). Brain Behavior and Evolution 48:213-220.
Winberg S, Winberg Y, Fernald RD (1997) Effect of social rank on brain monoaminergic activity in a cichlid fish. Brain Behavior and Evolution 49:230-236.

56
Winberg S, Carter CG, McCarthy JD, He ZY, Nilsson GE, Houlihan DF (1993) Feeding Rank and Brain Serotonergic Activity in Rainbow-Trout Oncorhynchus-Mykiss. Journal of Experimental Biology 179:197-211.
Wullimann MF, Puelles L (1999) Postembryonic neural proliferation in the zerbrafish forebrain and its relationship to prosomeric domains. Anatomy and Embryology 199:329-348.
Wullimann MF, Rupp B, Reichert H (1996) Neuroanatomy of the zebrafish brain: A topological atlas. Birkenhäuser Verlag, Basel, Switzerland.
Yadid G, Nakash R, Deri I, Tamer G, Kinor N, Gispan I, Zangen A (2000) Elucidation of the neurobiology of depression: insights from a novel genetic animal model. Progress in Neurobiology 62:353-378.
Zar JH (1999) Biostatistical Analysis. 4th Edition. Prentice-Hall, Inc., Upper Saddle River, NJ.
Zikopoulos B, Kentouri M, Dermon CR (2000) Proliferation zones in adult brain of hermaphrodite teleost species (Sparus aurata): Evidence for sex differences in the hypothalamus. European Journal of Neuroscience 12:5-5.
Zupanc GKH (2001) A comparative approach towards the understanding of adult neurogenesis. Brain Behavior and Evolution 58:246-249.
Zupanc GKH, Horschke I (1995) Proliferation Zones in the Brain of Adult Gymnotiform Fish - a Quantitative Mapping Study. Journal of Comparative Neurology 353:213-233.
Zupanc GKH, Ott R (1999) Cell proliferation after lesions in the cerebellum of adult teleost fish: Time course, origin, and type of new cells produced. Experimental Neurology 160:78-87.
Zupanc GKH, Clint SC (2003) Potential role of radial glia in adult neurogenesis of teleost fish. Glia 43:77-86.
Zupanc GKH, Horschke I, Ott R, Rascher GB (1996) Postembryonic development of the cerebellum in gymnotiform fish. Journal of Comparative Neurology 370:443-464.
Øverli Ø, Harris CA, Winberg S (1999) Short-term effects of fights for social dominance and the establishment of dominant-subordinate relationships on brain monoamines and cortisol in rainbow trout. Brain Behavior and Evolution 54:263-275.
Øverli Ø, Kotzian S, Winberg S (2002) Effects of cortisol on aggression and locomotor activity in rainbow trout. Hormones and Behavior 42:53-61.
Øverli Ø, Winberg S, Damsgard B, Jobling M (1998) Food intake and spontaneous swimming activity in Arctic char (Salvelinus alpinus): role of brain serotonergic activity and social interactions. Canadian Journal of Zoology-Revue Canadienne De Zoologie 76:1366-1370.
Øverli Ø, Pottinger TG, Carrick TR, Overli E, Winberg S (2001) Brain monoaminergic activity in rainbow trout selected for high and low stress responsiveness. Brain Behavior and Evolution 57:214-224.
Øverli Ø, Korzan WJ, Larson ET, Winberg S, Lepage O, Pottinger TG, Renner KJ, Summers CH (2004a) Behavioral and neuroendocrine correlates of displaced aggression in trout. Hormones and Behavior 45:324-329.
Øverli Ø, Korzan WJ, Hoglund E, Winberg S, Bollig H, Watt M, Forster GL, Barton BA, Øverli E, Renner KJ, Summers CH (2004b) Stress coping style predicts

57
aggression and social dominance in rainbow trout. Hormones and Behavior 45:235-241.

58
Appendix 1 – Telencephalic organization in rainbow trout
Figure 1 Lateral view of the brain of the
rainbow trout (Oncorhynchus mykiss).
Numbered lines indicate the levels of the
transverse sections in figures 2-3. From
Northcutt and Davis, 1983.
Figure 2 Transverse sections through
the caudal olfactory bulb (A) and
rostral telencephalon (B) in rainbow
trout. From Northcutt and Davis,
1983.

59
Figure 3 Transverse sections through the
maximal extent of the rostral subpallial areas
(A) and anterior commissure level (B) in
rainbow trout. From Northcutt and Davis, 1983.
Figure 4 Transverse sections through the
caudal third (A) and caudal pole (B) of the
telencephalon in rainbow trout. From
Northcutt and Davis, 1983.

60
Abbreviations for figures
c cerebellum D area dorsalis telencephali Dc central zone of D Dc-1,2,3,4 parts of Dc Dc dorsal zone of D Dd+Dl-d dorsal zone plus dorsal part of lateral zone of D Dl lateral zone of D Dl-d dorsal part of lateral zone of D Dl-p posterior part of lateral zone of D Dl-v ventral part of lateral zone of D Dm medial zone of D Dp posterior zone of D E entopeduncular nucleus ELC external cellular layer of olfactory bulb GL glomerular layer of olfactory bulb ICL internal cellulcar layer of olfactory bulb ob olfactory bulb PP periventricular preoptic nucleus SOF secondary olfactory fiber layer of the olfactory bulb t telencephalon te tectum V area ventralis telencephali Vc commissural nucleus of V Vd dorsal nucleus of V Vl lateral nucleus of V Vp postcommissural nucleus of V Vs supracommissural nucleus of V Vv ventral nucleus of V VT ventral thalamus

61
Appendix 2 - Protocol for BrdU staining
Procedure
Day 1
1. Thaw frozen slides until dry (15-20 min) in room temperature
2. Draw around sections with PAP pen (DAKO) (in fume hood), allow to dry
3. 2.0 M HCl at 37 °C for 60 min
4. 2 x 5 min rinse in PBS
5. 6% PBT for 60 min at room temp in humidified chamber
6. Anti-BrdU (1:400) in 0.6 % PBT over night at 4 °C in humidified chamber
Day 2
7. 2 x 5 min rinse in PBS
8. 1.4 % H2O2 at room temp for 15 min
9. 2 x 5 min rinse in PBS
10. Rabbit anti-mouse (1:50) in 0.6% PBT for 60 min
11. 2 x 5 min rinse in PBS
12. PAP (1:100) in 0.6% PBT for 45 min
13. 2 x 5 min rinse in PBS
14. DAB for 5-10 min at room temp (in fume hood)
15. 2 x 5 min rinse in dH2O
16. Counter-staining with haematoxylin for 45 s
17. 5 min rinse in running tap water
18. Coverslipping (in fume hood) with DAKO permanent mounting medium

62
Reagents
0.01 M PBS (Phosphate buffered saline)
Dissolve 1 PBS-tablet (Sigma) per 200 mL distilled water. Make up 5 L at a time (25
tablets) and keep in can on lab bench.
6% PBT (Phosphate buffered saline with Triton X-100 and BSA)
10 mL PBS
3 µL Triton X-100 (Sigma)
600 mg BSA (Sigma)
Vortex until the BSA is dissolved. Can be stored at 4 °C for 7 days.
0.6 % PBT
25 mL PBS
7.5 µL Triton X-100
150 mg BSA
Vortex until the BSA is dissolved. Can be stored at 4 °C for 7 days.
1.4 % H2O2
9.3 mL 30% H2O2 (Sigma)
Add dH2O up to 200 mL. 100 mL is enough for one cuvette (which takes 8 slides). Make
fresh before each treatment.

63
DAB stock solution
10 mL Autoclaved mqH2O
1 DAB tablet (DAKO cytomation)
Normally the DAB tablets do not dissolve completely. The solution still works properly.
Can be stored at 4 °C for up to 7 days. Be careful, very poisonous! If spilled, wash
immediately with hypoclorite (commercial Klorin).
3 % H2O2
10 µL 30% H2O2
90 µL Autoclaved mqH2O
Activated DAB solution
4 mL DAB stock solution
30 µL 3 % H2O2
Mix immediately before use. Be careful, very poisonous! If spilled, wash immediately
with hypoclorite (commercial Klorin). All waste products should be inactivated with
hypoclorite before thrown away in special litter bin.
Hematoxylin according to Mayer
Ready-made solution from Sigma, can be re-used. Filter before use.

64
Appendix 3 - RIA for cortisol
Materials 1. [1,2,6,7-3H] Cortisol 60 Ci mmol -1 (Amersham)
2. Phosphate buffered saline tablets (Sigma)
3. Bovine serum albumin (Sigma)
4. Dextran, clinical grade (Sigma)
5. Activated charcoal, neutralised (Sigma)
6. Hydrocortisone (Sigma)
7. Ethyl acetate (Sigma)
8. Anti-cortisol (Sigma)
9. Scintillation cocktail (Ultima Gold, Kodak)
Reagentes
1. Labelled cortisol:
Dilute the radiocortisol solution with a solution of toluene and ethanol (9:1) in the ratio
radiocortisol : toluene+ethanol 1:4. Store at -200C. For working solution, add 10 µL of
the stock solution to 12.5 mL of ethyl acetate. Store at -200C.
To control the working solution, pipette 50 µl into 4ml scintillant cocktail and mix by
inversion. Count in scintillation counter (should be approximately 20 000 dpm). Dpm
will decrease over time (months) so this ratio may need to be adjusted to achieve 20 000
dpm.

65
2. Standard inert cortisol:
(a) Make up 1mg ml-1 Hydrocortisone in ethanol 1 mg ml -1 A
(b) Add 50 µl A to 9.95 ml ethyl acetate 5 µg ml -1 B
(c) Add 100 µl B to 9.9 ml ethyl acetate 50 ng ml –1 C
(d) Add 800 µl C to 9.2 ml ethyl acetate 4 ng ml –1 D
(e) Add 5ml D to 5ml ethyl acetate 2 ng ml –1 E
(f) Add 5ml E to 5ml ethyl acetate 1 ng ml –1 F
(g) Add 5ml F to 5ml ethyl acetate 500 pg ml –1 G
(h) Add 5ml G to 5ml ethyl acetate 250 pg ml –1 H
(i) Add 5ml H to 5ml ethyl acetate 125 pg ml –1 I
(j) Add 5ml I to 5ml ethyl acetate 62.5 pg ml –1 J
3. Assaybuffer:
To 200 ml distilled water add one PBS tablet and 200 mg BSA. Mix on magnetic stirrer.
Can be kept for up to 7 days at 4 oC.
4. Dextran-coated charcoal:
To 200 ml distilled water, add one PBS tablet, 200 mg dextran and 1.0 g charcoal. Mix
on magnetic stirrer. Can be kept for up to 7 days at 4 oC.
5. Antibody solution:
Dilute freeze-dried antibody as directed by supplier and dispense aliquots of 50, 100 and
250 µL. Store in freezer. For working solution, dilute the antibody 10 times in assay
buffer and mix gently by inversion (do not vortex). Make up 100 µL working solution per
tube.

66
Procedure
Standard curve
1. The standard curve consists of 200 µl of standards D-J and a null-sample. Run two
duplicates, one before and one after the unknown samples.
Standard (pg)/ tube 0 12.5 25 50 100 200 400 800
200µl of stock 0 J I H G F E D
Extraction of cortisol
2. Steroids are removed from aqueous samples by extraction with ethyl acetate. For
routine determinations, add 1.0 ml ethyl acetate to 200 µl plasma, mix well and
centrifuge briefly (2min at 10 000 rpm and 4°C) to separate the two phases. The volume
of sample may be varied providing the ratio of solvent to sample is 5:1. Perform
extraction on ice. A quality control plasma sample (QC) should also be used, extracted at
the same ratio. After extraction samples can be stored at 4°C during assay and -200C long
term.
Assay procedure
3. Pipette into assay tubes (2 ml eppendorf tubes with lid removed) the required volume
of extract (e.g. 20µl for stressed fish up to 150µl for basal levels or 200µl if using dilute
extract). Also pipet 20µl of extract from QC sample. An assay blank (that will contain
tracer and 200 µl buffer but no antiserum) should also be included to provide a measure
of non-specific binding. Also pipet out two parallels of standard series. See overview.
4. Add 50 µl of ‘hot’ cortisol to all tubes.
5. Dry down all tubes under vacuum but without heat. (30-60 min in a vacuum exsiccator
with a water jet pump).

67
6. Add 100 µl assay buffer to all tubes. To the blank add 200µl of buffer to bring it up to
the same volume as those tubes that will receive antibody. Next add 100 µl of antibody
solution to each tube (not blank). Vortex, cover with clingfilm and incubate for 4-18
hours at 4oC or 1-2 hour on bench and 2 hours in the fridge.
7. Place racks of tubes on ice, add 100 µl of well mixed dextran coated charcoal to each
tube, vortex and incubate on ice for 5 min. (Use a repeater pipette tip that has had a
couple of mm of the end cut off to avoid clogging).
8. Spin down the charcoal (3500 rpm for 10 minutes at 4oC). Dispense 4.0 ml of
scintillation fluid into scintillation vials. Take tubes out of centrifuge and put back on ice.
Pipette 200 µl aliquot of the supernatant into the scintillant, mix well by inversion and
count under standard tritium conditions.

68
Appendix 4 – Post-hoc statistics
Control Dominant Subordinate Control - 0.938 0.001
Dominant 0.938 - 0.001 Subordinate 0.001 0.001 -
Table 1 Tukey Post-hoc statistics for feeding scores day 10-13.
Control Dominant Subordinate Control - 0.856 0.023
Dominant 0.856 - 0.009 Subordinate 0.023 0.009 -
Table 2 Tukey Post-hoc statistics for cortisol data.
Control Dominant Subordinate Control - 0.210 0.014
Dominant 0.210 - 0.286 Subordinate 0.014 0.286 -
Table 3 Tukey Post-hoc statistics for telencephalic cell proliferation.