stroke: diagnosis and therapy · magnetic resonance imaging non-contrast ct ct perfusion ......
TRANSCRIPT
Stroke: diagnosis and therapy
EFROSINI PAPADAKI
ASSIST. PROFESSOR OF NEURORADIOLOGY UNIVERSITY OF CRETE
GREECE
E-mail : [email protected]
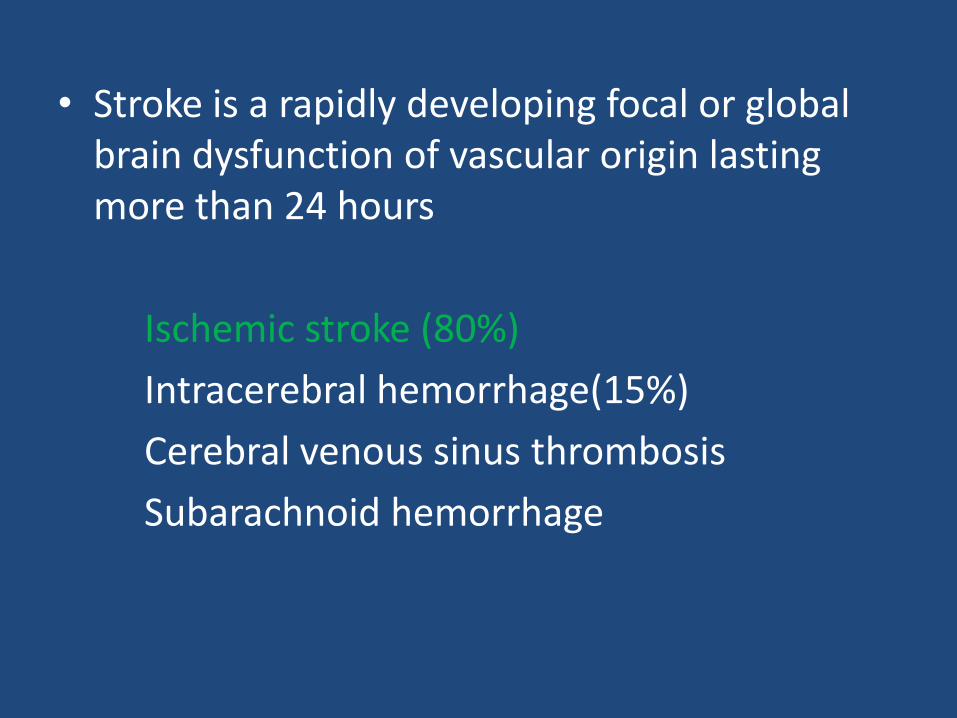
• Stroke is a rapidly developing focal or global brain dysfunction of vascular origin lasting more than 24 hours
Ischemic stroke (80%)
Intracerebral hemorrhage(15%)
Cerebral venous sinus thrombosis
Subarachnoid hemorrhage
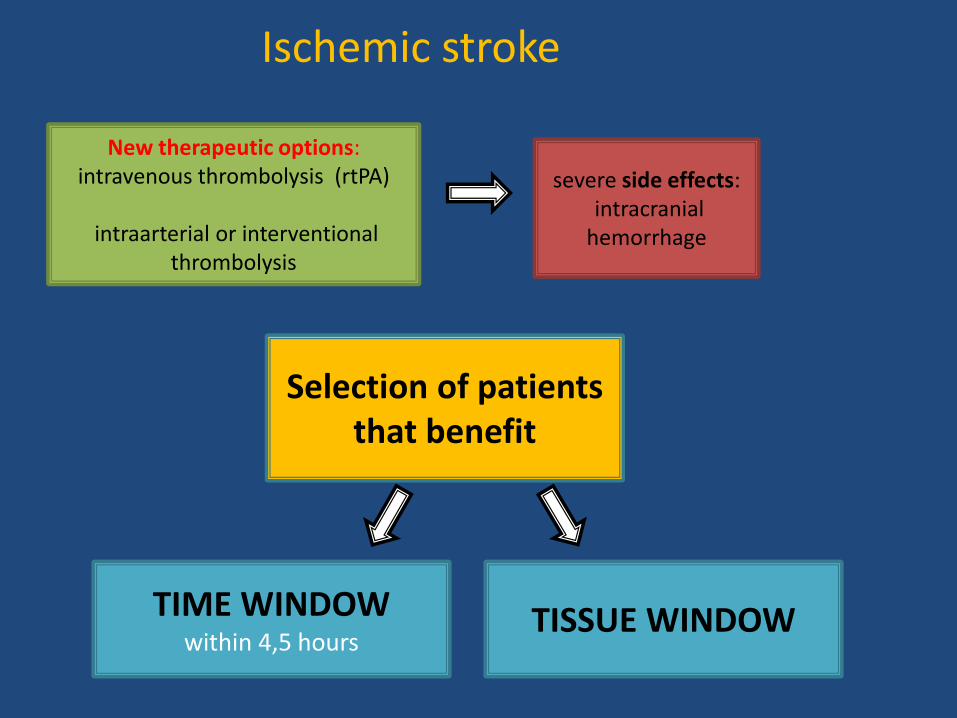
New therapeutic options: intravenous thrombolysis (rtPA)
intraarterial or interventional
thrombolysis
severe side effects: intracranial hemorrhage
Ischemic stroke
Selection of patients
that benefit
TISSUE WINDOW
TIME WINDOW
within 4,5 hours
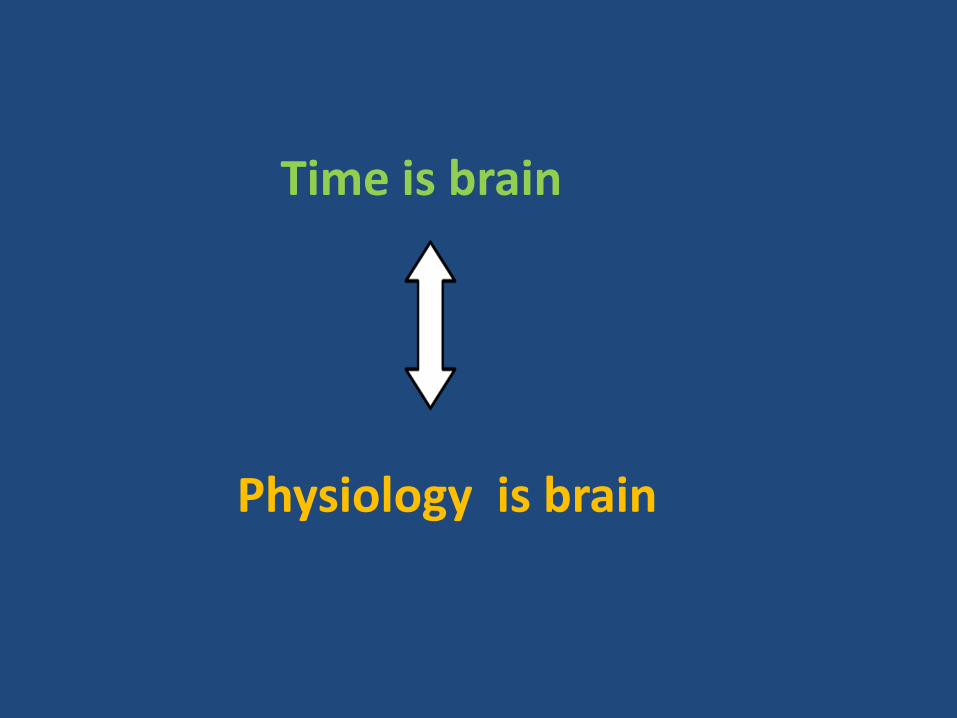
Time is brain
Physiology is brain
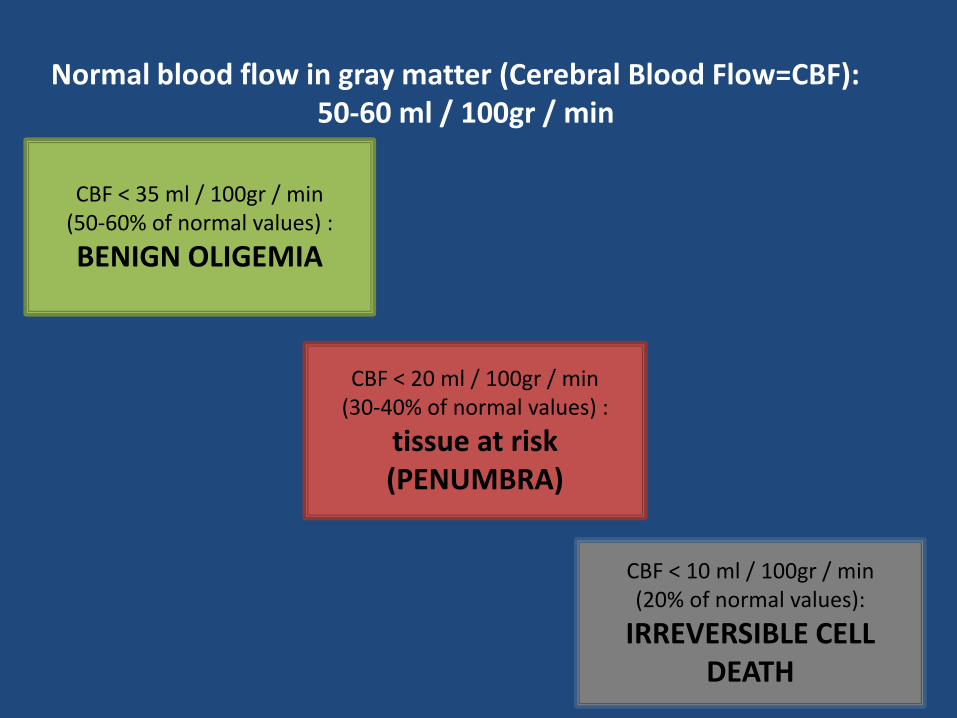
Normal blood flow in gray matter (Cerebral Blood Flow=CBF): 50-60 ml / 100gr / min
CBF < 35 ml / 100gr / min (50-60% of normal values) :
BENIGN OLIGEMIA
CBF < 20 ml / 100gr / min (30-40% of normal values) :
tissue at risk (PENUMBRA)
CBF < 10 ml / 100gr / min (20% of normal values):
IRREVERSIBLE CELL DEATH
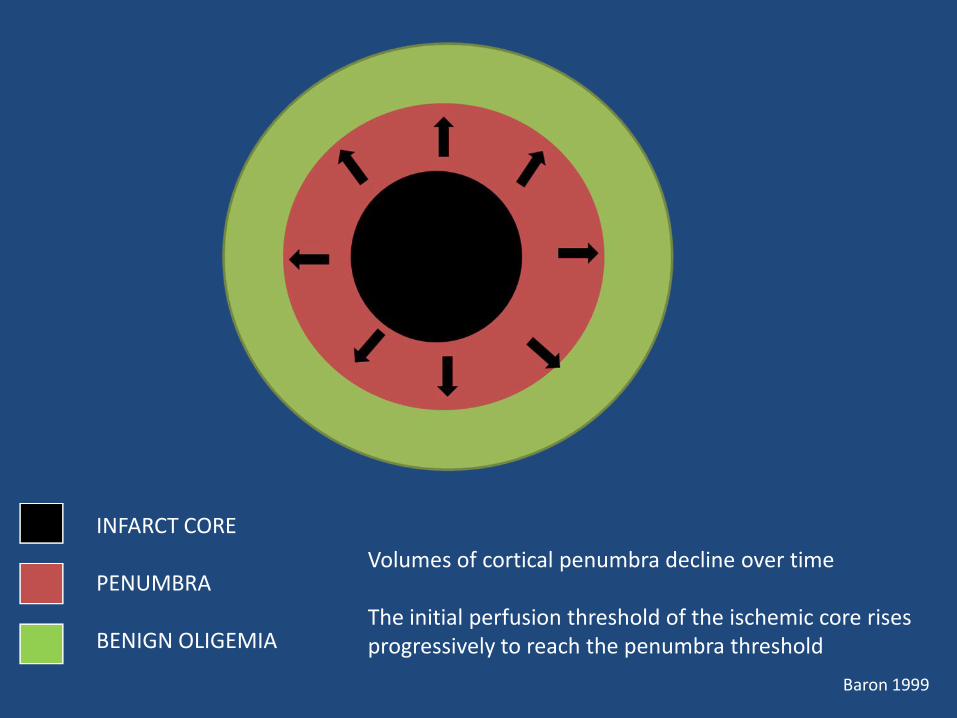
INFARCT CORE PENUMBRA BENIGN OLIGEMIA
Volumes of cortical penumbra decline over time The initial perfusion threshold of the ischemic core rises progressively to reach the penumbra threshold
Baron 1999
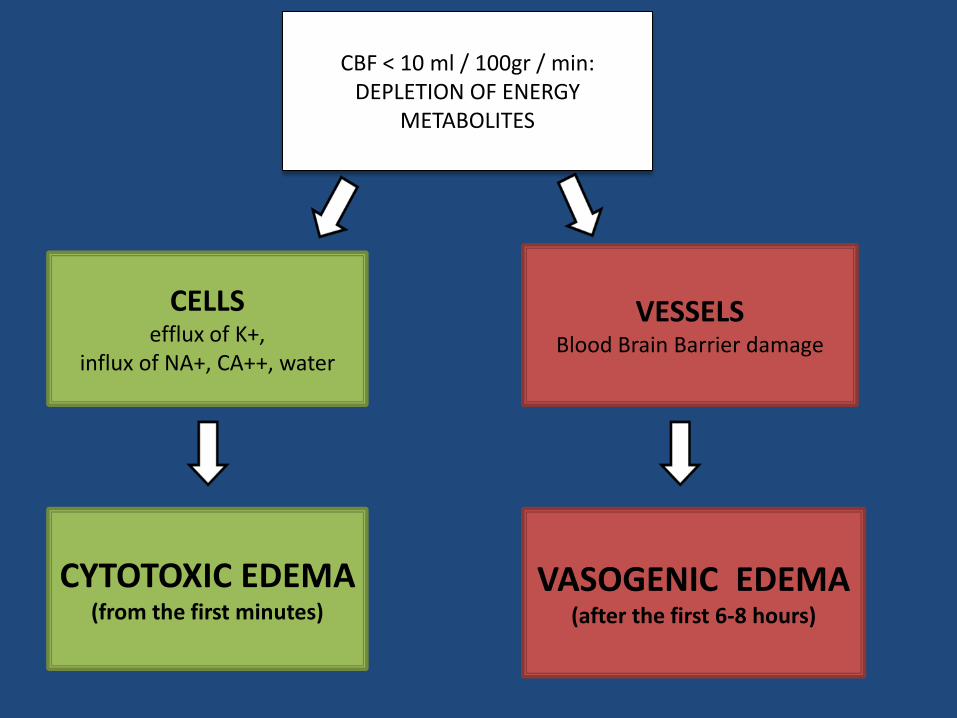
CBF < 10 ml / 100gr / min: DEPLETION OF ENERGY
METABOLITES
CELLS efflux of K+,
influx of NA+, CA++, water
CYTOTOXIC EDEMA (from the first minutes)
VESSELS Blood Brain Barrier damage
VASOGENIC EDEMA (after the first 6-8 hours)
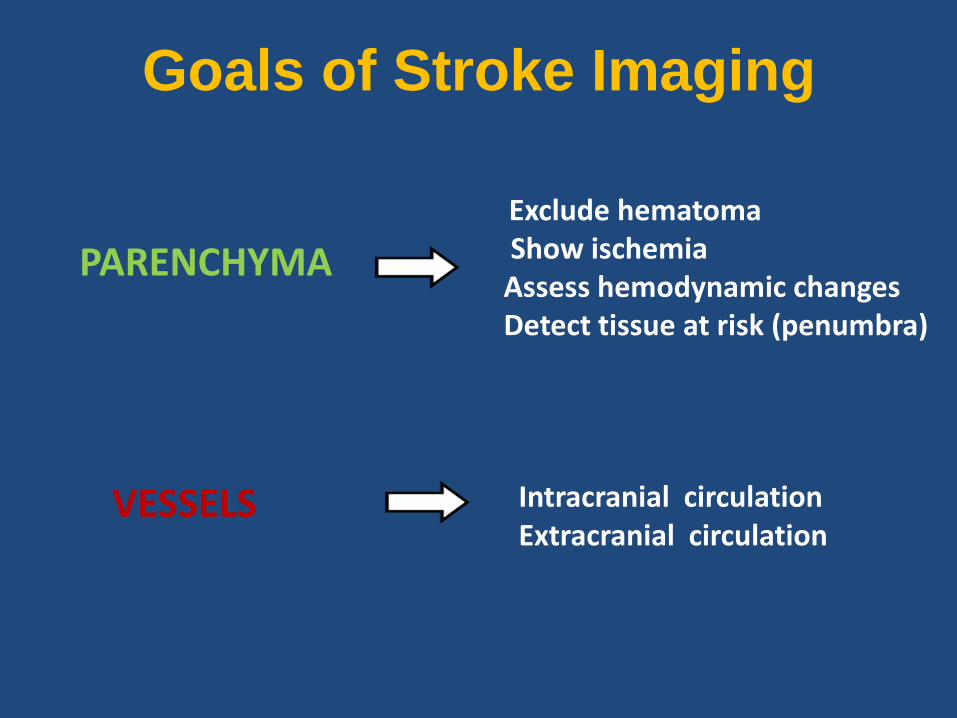
Goals of Stroke Imaging
PARENCHYMA
Exclude hematoma Show ischemia Assess hemodynamic changes Detect tissue at risk (penumbra)
VESSELS Intracranial circulation Extracranial circulation
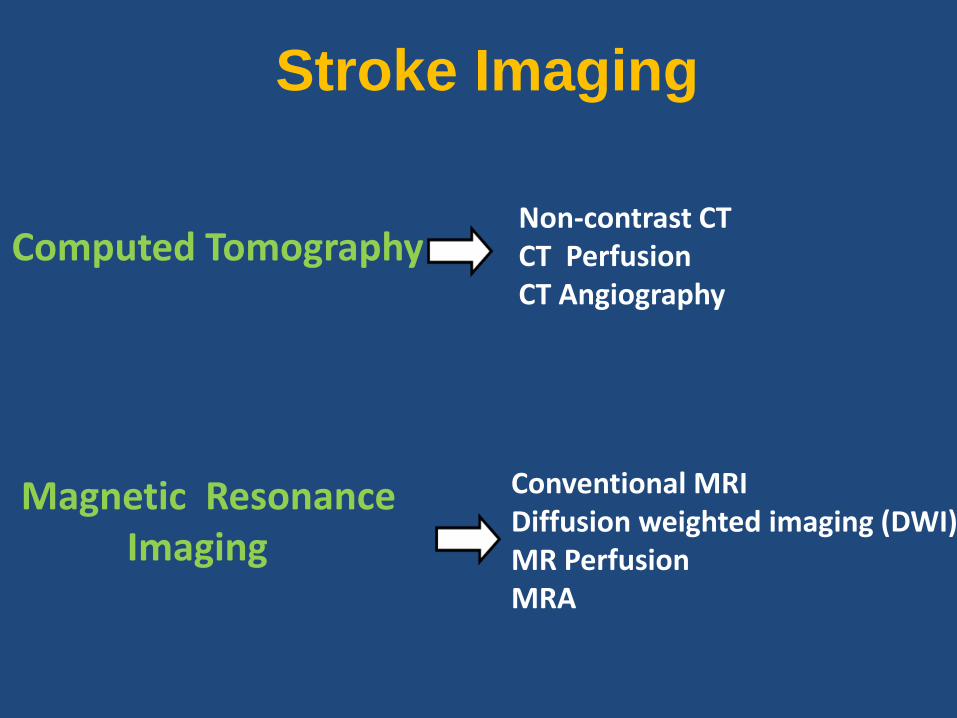
Stroke Imaging
Computed Tomography
Magnetic Resonance Imaging
Non-contrast CT CT Perfusion CT Angiography
Conventional MRI Diffusion weighted imaging (DWI) MR Perfusion MRA
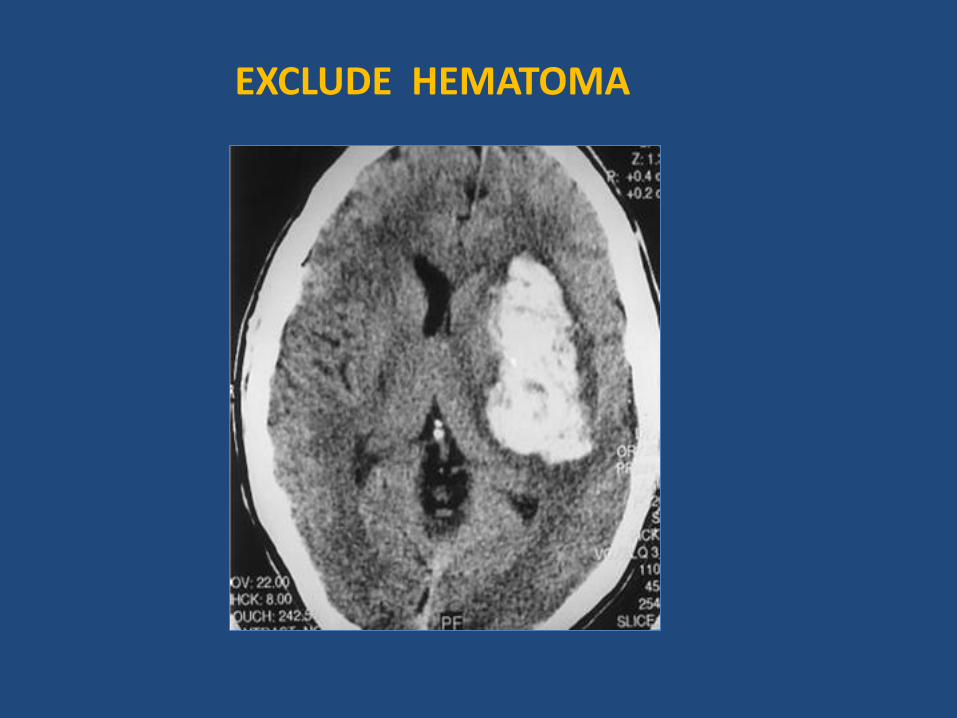
EXCLUDE HEMATOMA
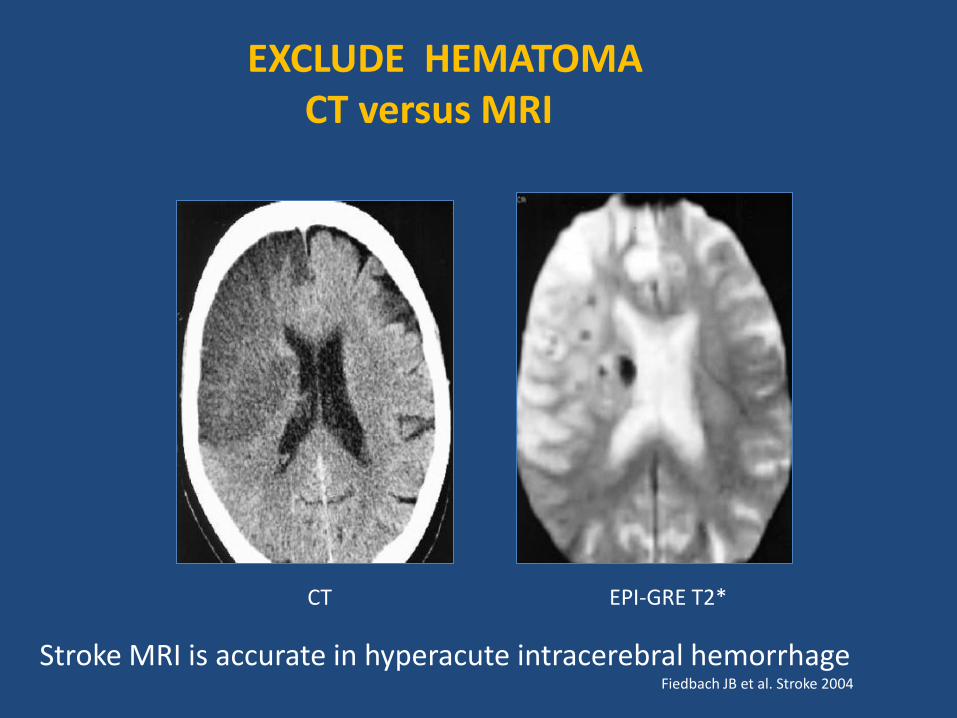
CT EPI-GRE T2*
Stroke MRI is accurate in hyperacute intracerebral hemorrhage Fiedbach JB et al. Stroke 2004
EXCLUDE HEMATOMA CT versus MRI
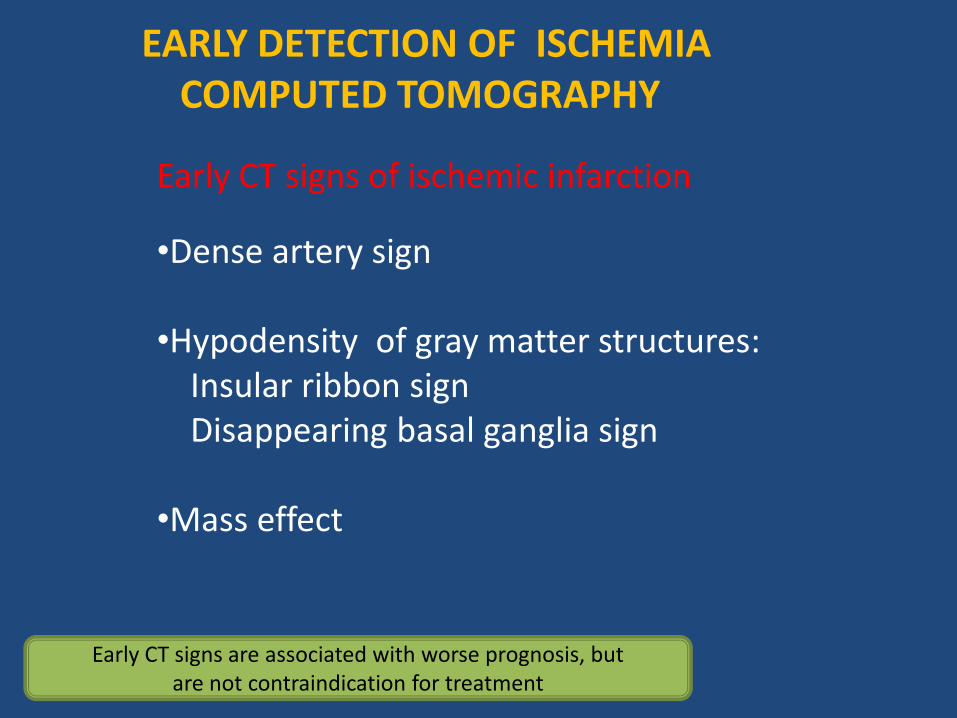
EARLY DETECTION OF ISCHEMIA COMPUTED TOMOGRAPHY
Early CT signs of ischemic infarction •Dense artery sign •Hypodensity of gray matter structures: Insular ribbon sign Disappearing basal ganglia sign •Mass effect
Early CT signs are associated with worse prognosis, but are not contraindication for treatment
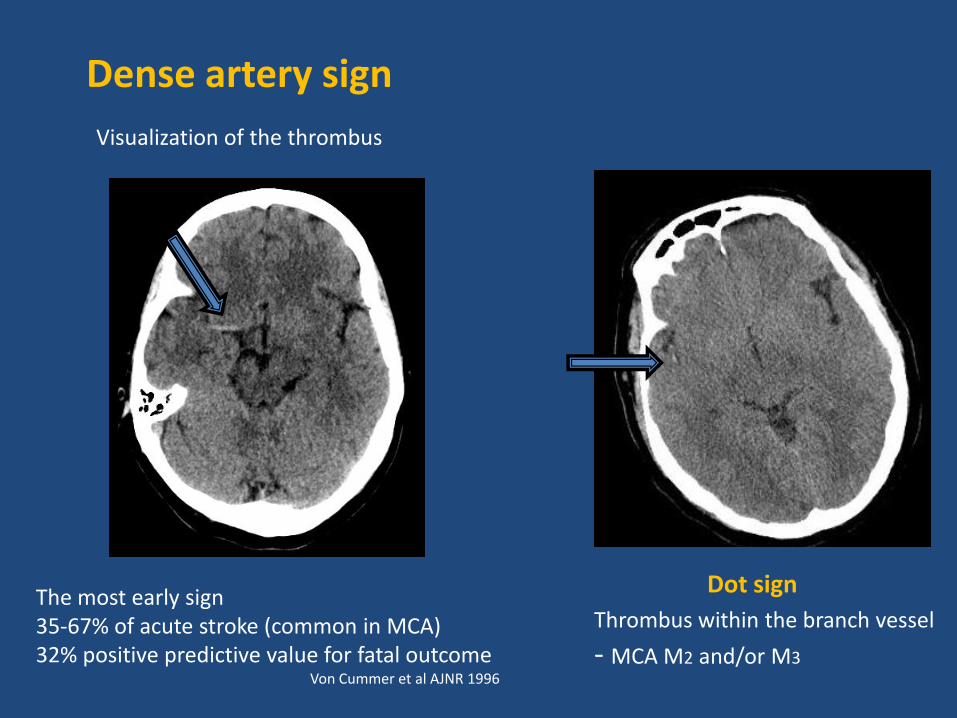
Dense artery sign
The most early sign 35-67% of acute stroke (common in MCA) 32% positive predictive value for fatal outcome Von Cummer et al AJNR 1996
Visualization of the thrombus
Dot sign
Thrombus within the branch vessel
- MCA M2 and/or M3
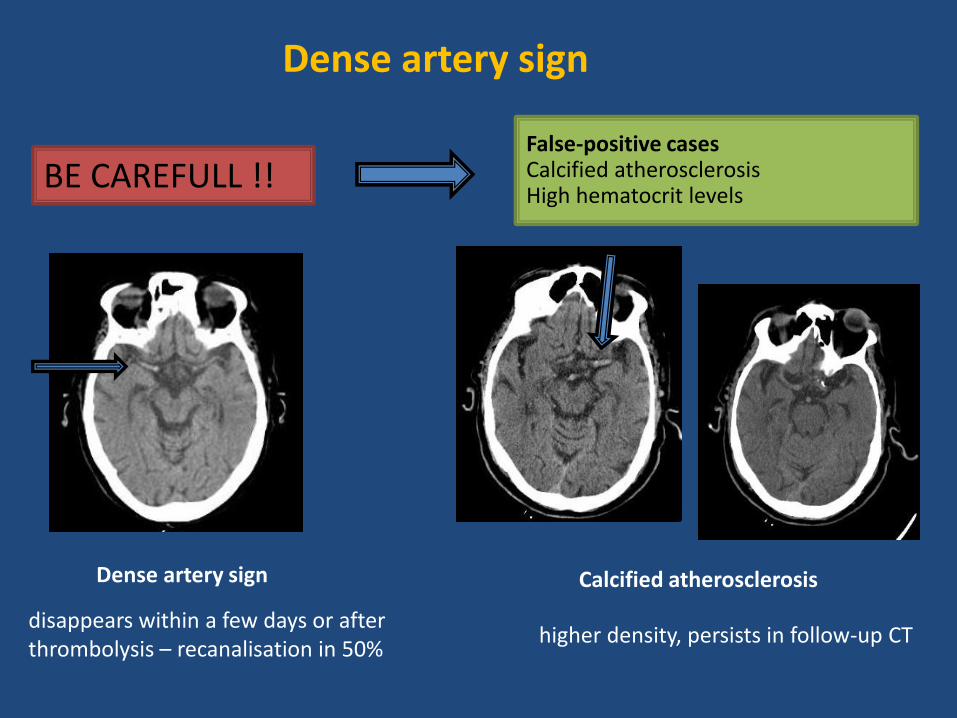
Dense artery sign
Dense artery sign
disappears within a few days or after thrombolysis – recanalisation in 50%
BE CAREFULL !! False-positive cases Calcified atherosclerosis High hematocrit levels
Calcified atherosclerosis
higher density, persists in follow-up CT
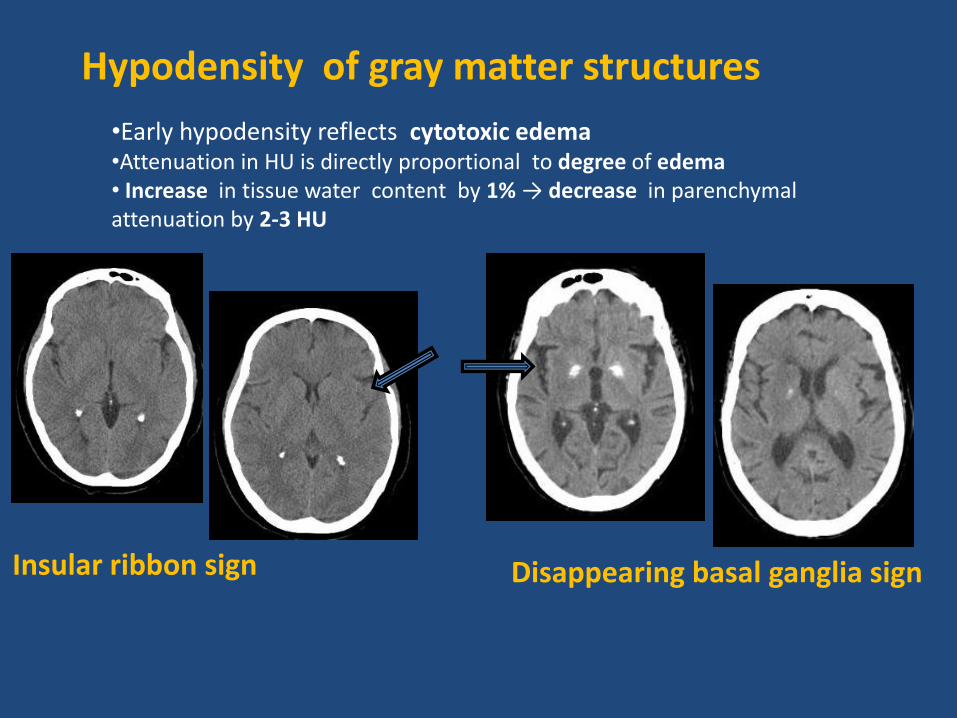
•Early hypodensity reflects cytotoxic edema •Attenuation in HU is directly proportional to degree of edema • Increase in tissue water content by 1% → decrease in parenchymal attenuation by 2-3 HU
Hypodensity of gray matter structures
Insular ribbon sign Disappearing basal ganglia sign
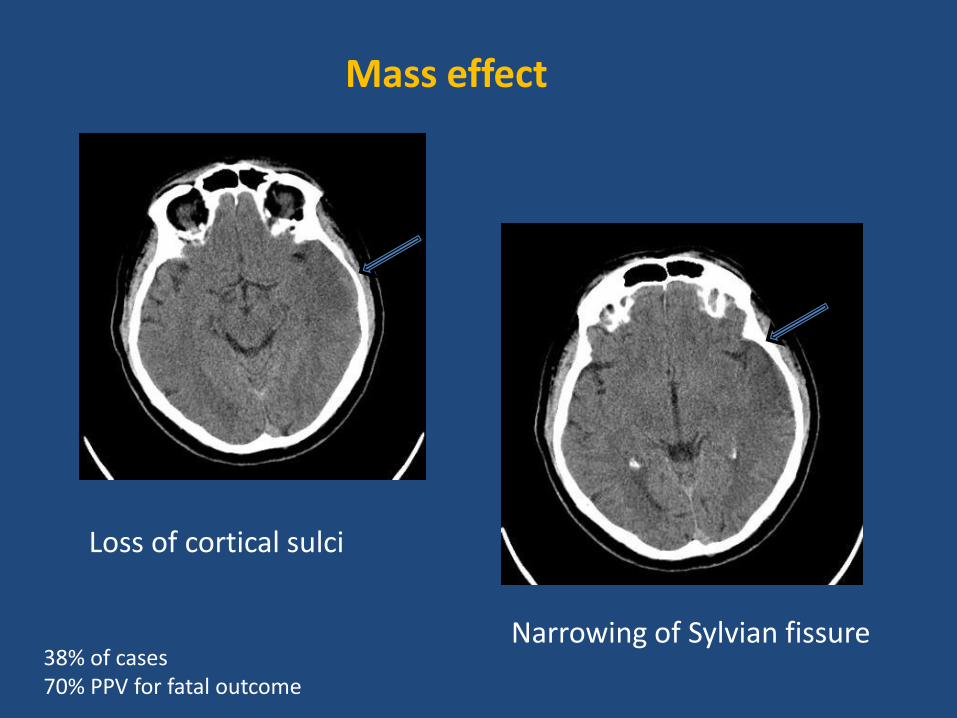
Mass effect
Narrowing of Sylvian fissure
Loss of cortical sulci
38% of cases 70% PPV for fatal outcome
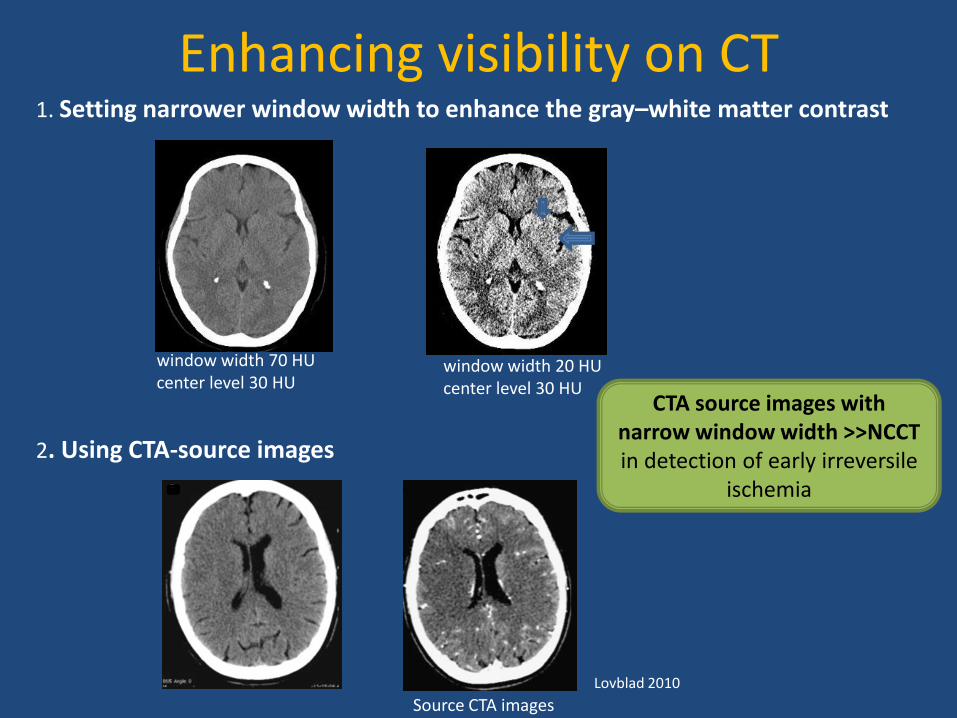
Enhancing visibility on CT 1. Setting narrower window width to enhance the gray–white matter contrast
window width 70 HU center level 30 HU
window width 20 HU center level 30 HU
2. Using CTA-source images
Source CTA images Lovblad 2010
CTA source images with narrow window width >>NCCT in detection of early irreversile
ischemia
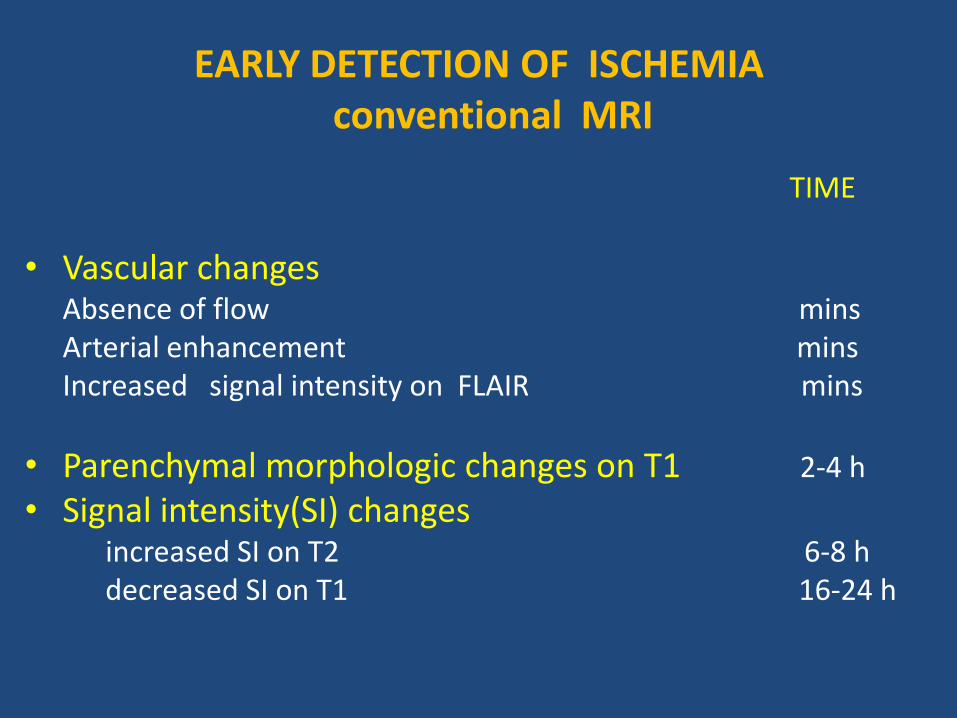
EARLY DETECTION OF ISCHEMIA conventional MRI
TIME
• Vascular changes Absence of flow mins Arterial enhancement mins Increased signal intensity on FLAIR mins
• Parenchymal morphologic changes on T1 2-4 h
• Signal intensity(SI) changes increased SI on Τ2 6-8 h decreased SI on Τ1 16-24 h
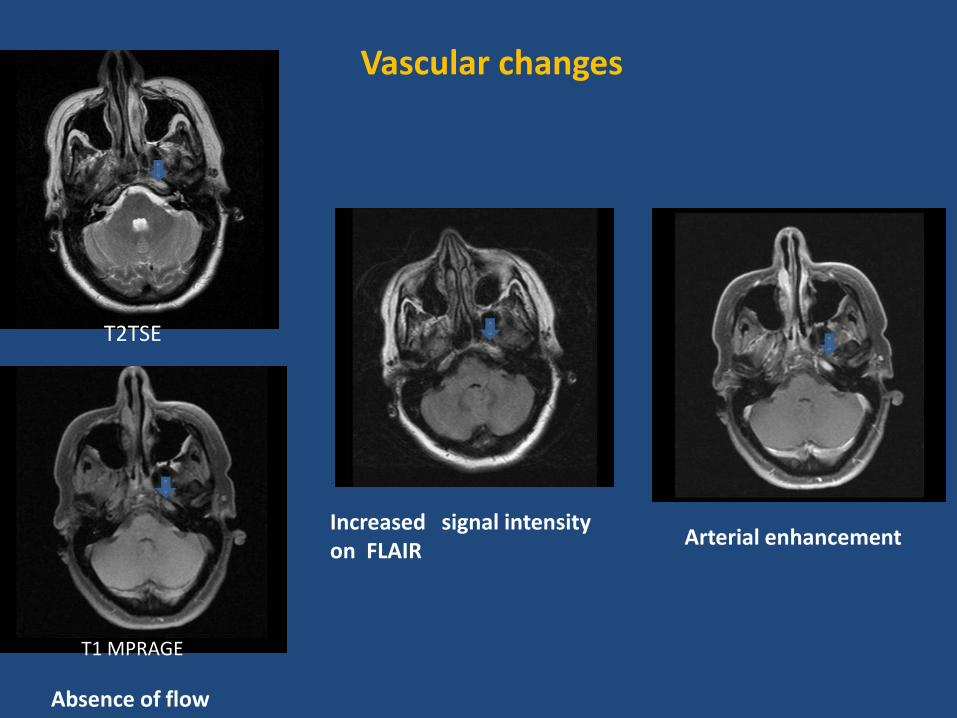
Absence of flow
Vascular changes
Arterial enhancement Increased signal intensity on FLAIR
T1 MPRAGE
T2TSE
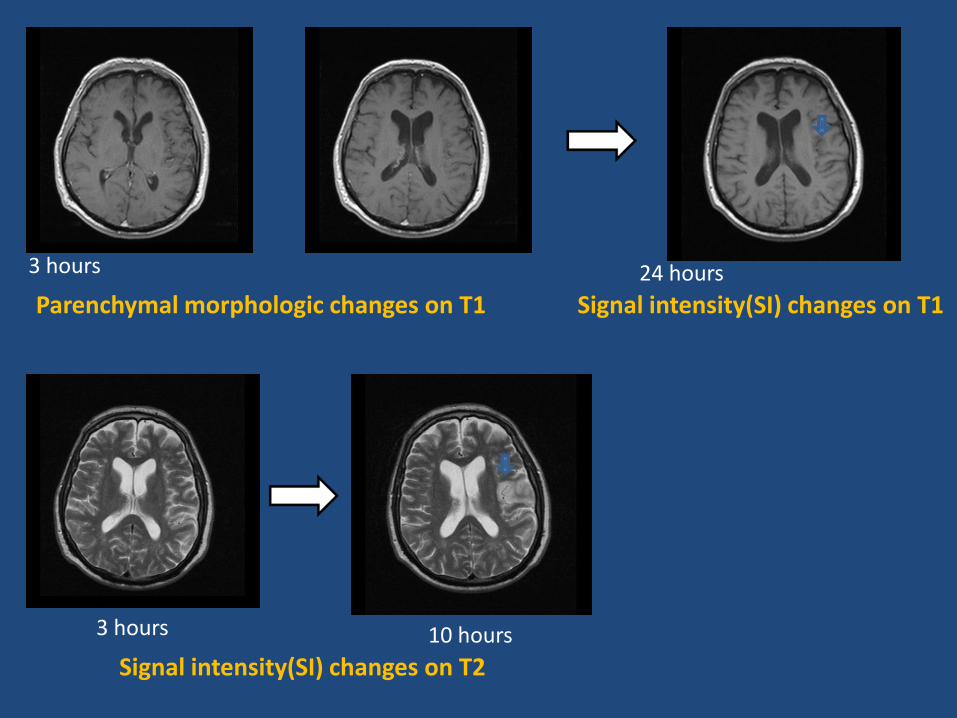
Parenchymal morphologic changes on T1
Signal intensity(SI) changes on T2
3 hours
3 hours 10 hours
Signal intensity(SI) changes on T1 24 hours
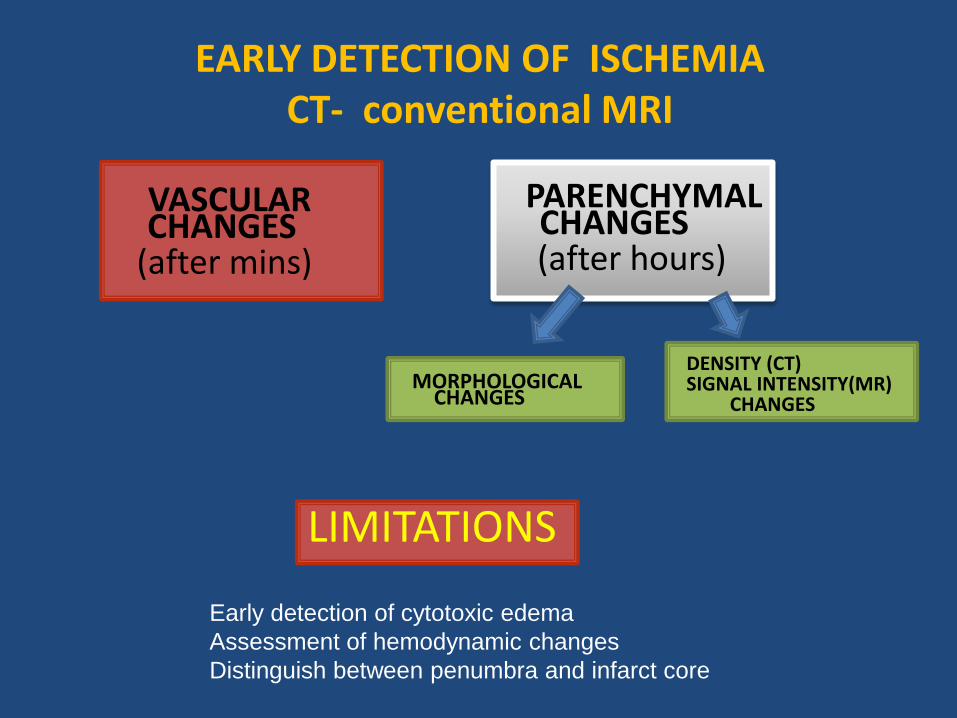
EARLY DETECTION OF ISCHEMIA CT- conventional MRI
PARENCHYMAL CHANGES
(after hours)
MORPHOLOGICAL CHANGES
DENSITY (CT) SIGNAL INTENSITY(MR) CHANGES
VASCULAR CHANGES
(after mins)
LIMITATIONS
Early detection of cytotoxic edema
Assessment of hemodynamic changes
Distinguish between penumbra and infarct core
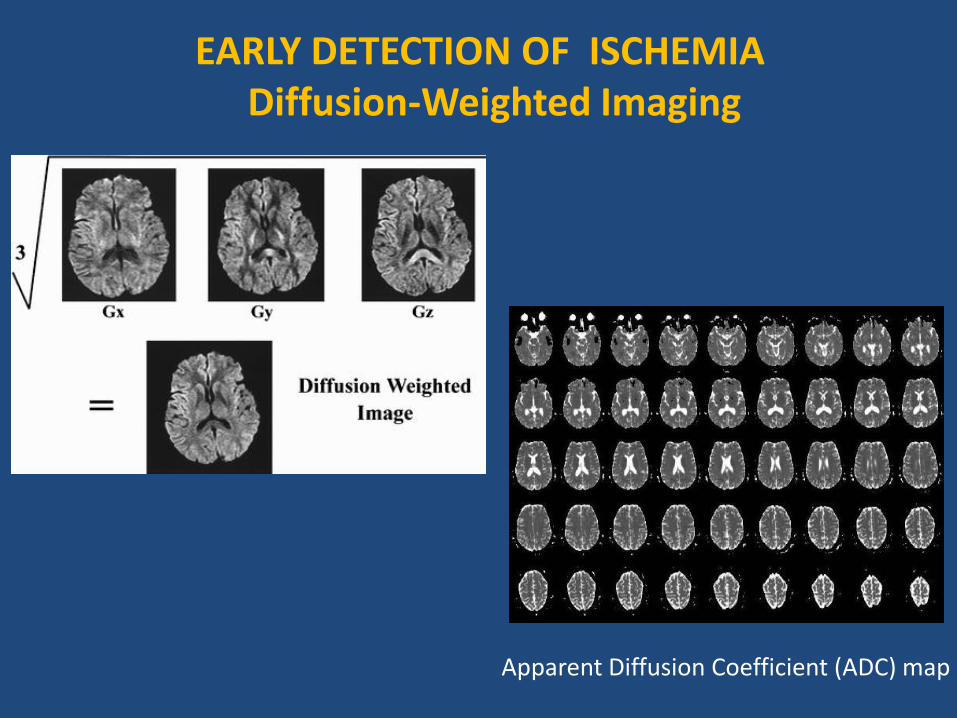
EARLY DETECTION OF ISCHEMIA Diffusion-Weighted Imaging
Apparent Diffusion Coefficient (ADC) map
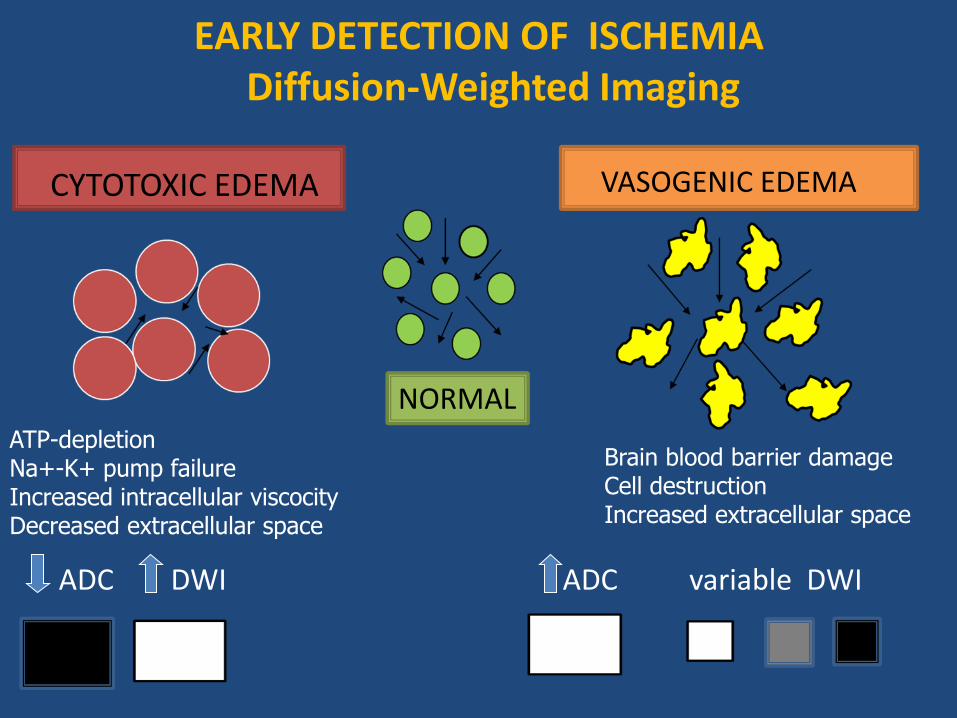
CYTOTOXIC EDEMA
NORMAL
ADC DWI ADC variable DWI
EARLY DETECTION OF ISCHEMIA Diffusion-Weighted Imaging
VASOGENIC EDEMA
ATP-depletion Na+-K+ pump failure Increased intracellular viscocity Decreased extracellular space
Brain blood barrier damage Cell destruction Increased extracellular space
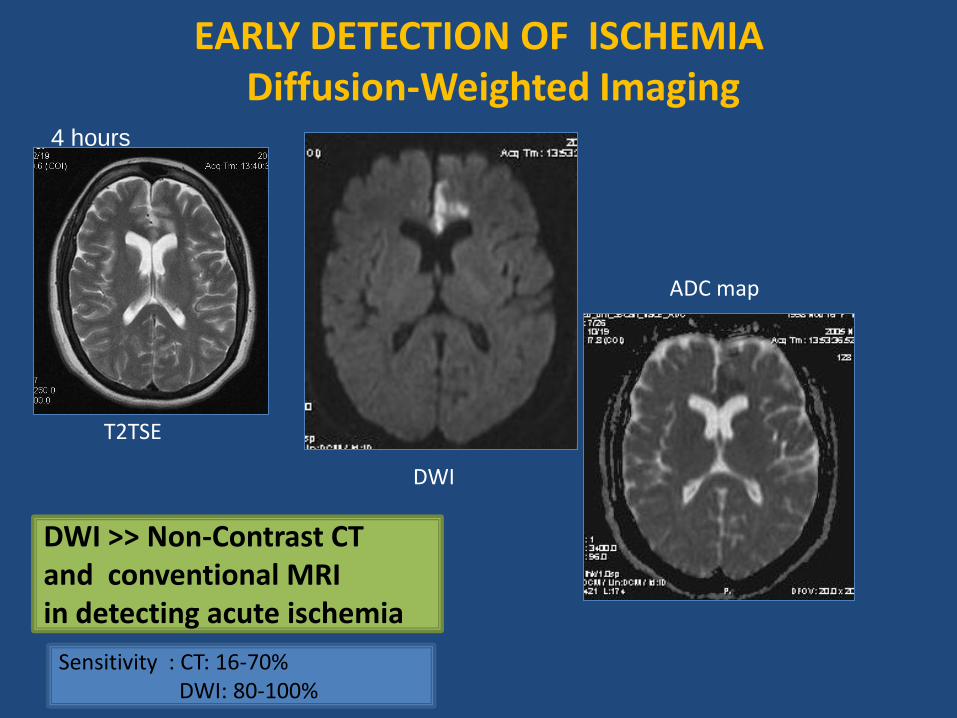
T2TSE
DWI
ADC map
EARLY DETECTION OF ISCHEMIA Diffusion-Weighted Imaging
DWI >> Non-Contrast CT and conventional MRI in detecting acute ischemia
Sensitivity : CT: 16-70% DWI: 80-100%
4 hours

T2 TSE DWI ADC Map
BE CAREFULL !! DWI and ADC map must be interpreted TOGETHER
T2 shine-through effect
T2 TSE DWI ADC Map
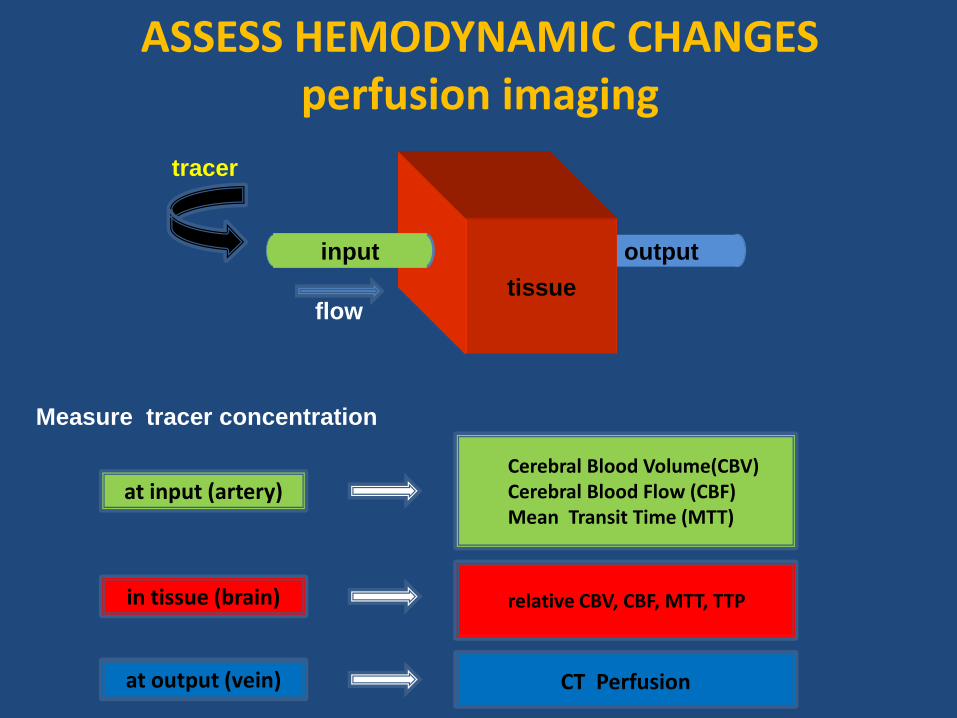
ASSESS HEMODYNAMIC CHANGES perfusion imaging
output
tissue
input
tracer
flow
at input (artery)
Cerebral Blood Volume(CBV) Cerebral Blood Flow (CBF) Mean Transit Time (MTT)
in tissue (brain) relative CBV, CBF, MTT, TTP
at output (vein)
CT Perfusion
Measure tracer concentration
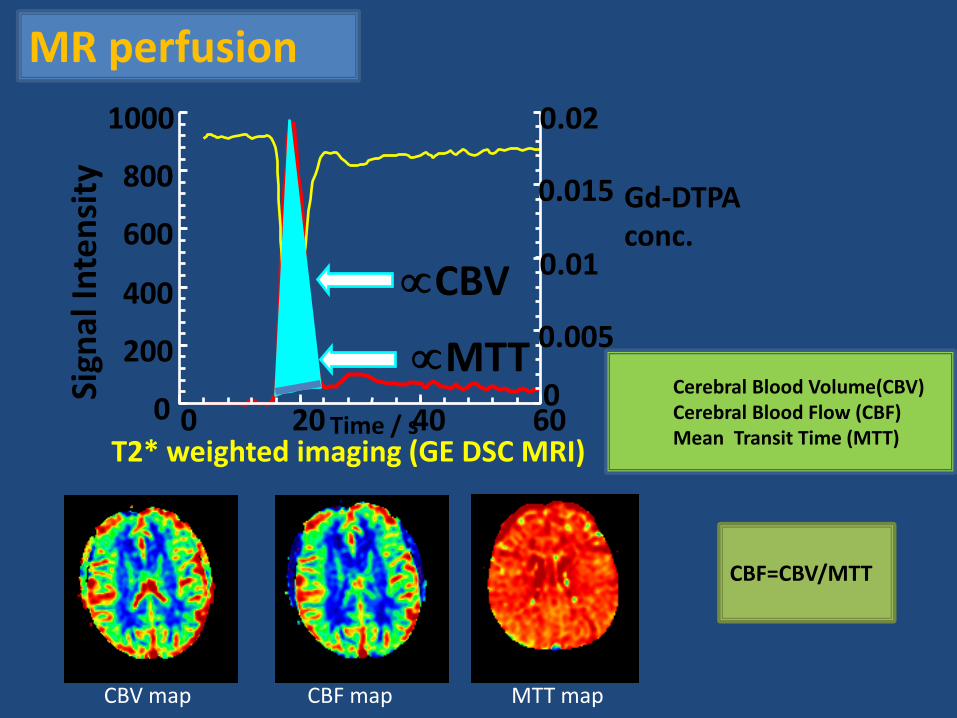
T2* weighted imaging (GE DSC MRI)
MR perfusion
CBV map CBF map MTT map
Time / s 0
200
400
600
800
1000
0 20 40 60 0
0.005
0.01
0.015
0.02 Si
gnal
Inte
nsi
ty
CBV
Gd-DTPA conc.
ΜΤΤ
CBF=CBV/MTT
Cerebral Blood Volume(CBV) Cerebral Blood Flow (CBF) Mean Transit Time (MTT)
CBV map CBF map MTT map
Ho
un
sfie
ld u
nit
s
Non ionic contrast agent concentration.
CT perfusion
Hoeffner et al ,2004
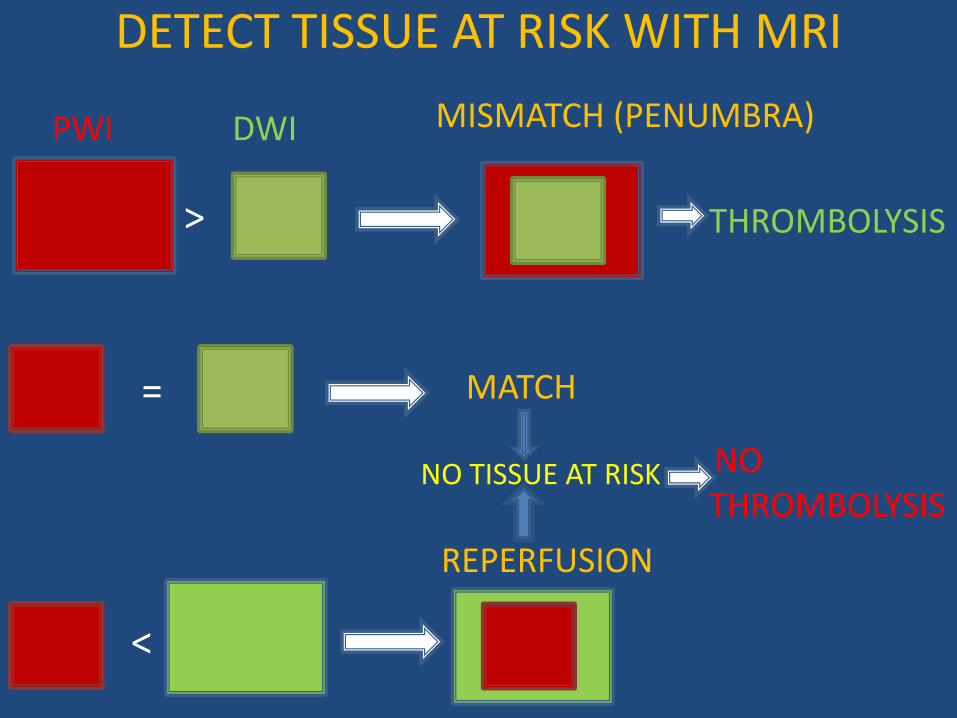
DETECT TISSUE AT RISK WITH MRI
>
PWI DWI
=
<
MATCH
REPERFUSION
MISMATCH (PENUMBRA)
THROMBOLYSIS
NO THROMBOLYSIS
NO TISSUE AT RISK
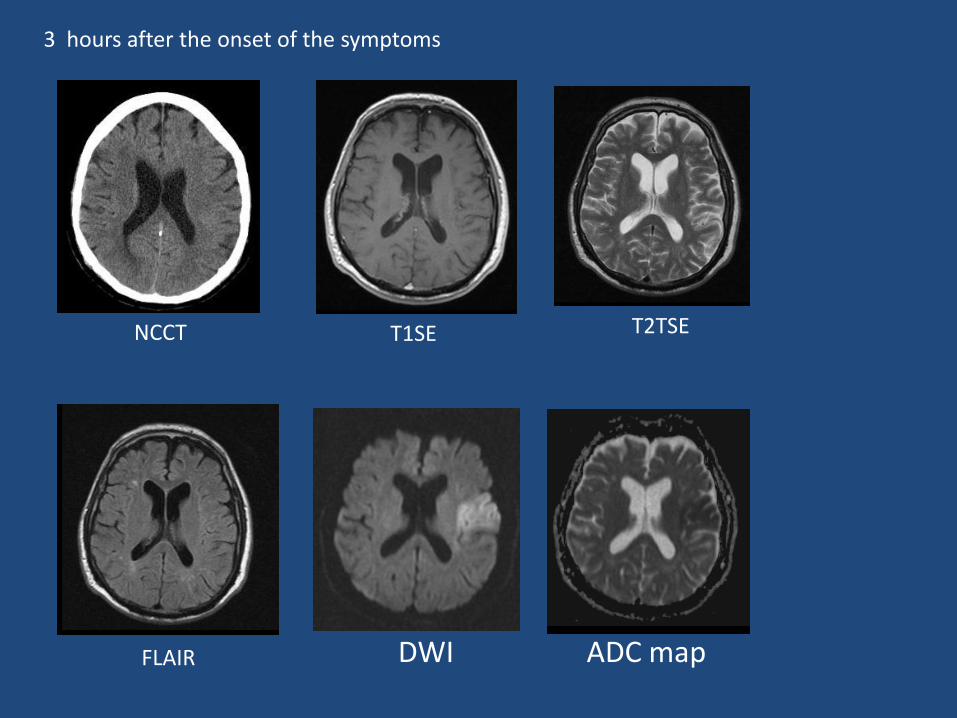
3 hours after the onset of the symptoms
DWI ADC map
T2TSE
FLAIR
T1SE NCCT
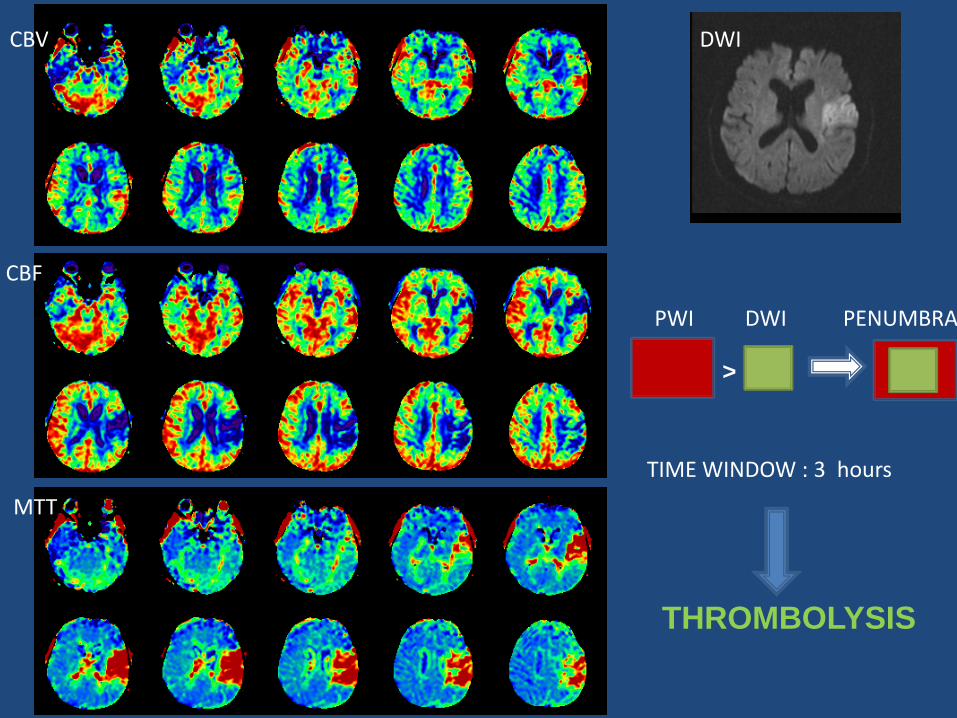
CBV
CBF
MTT
DWI
>
DWI PWI PENUMBRA
TIME WINDOW : 3 hours
THROMBOLYSIS
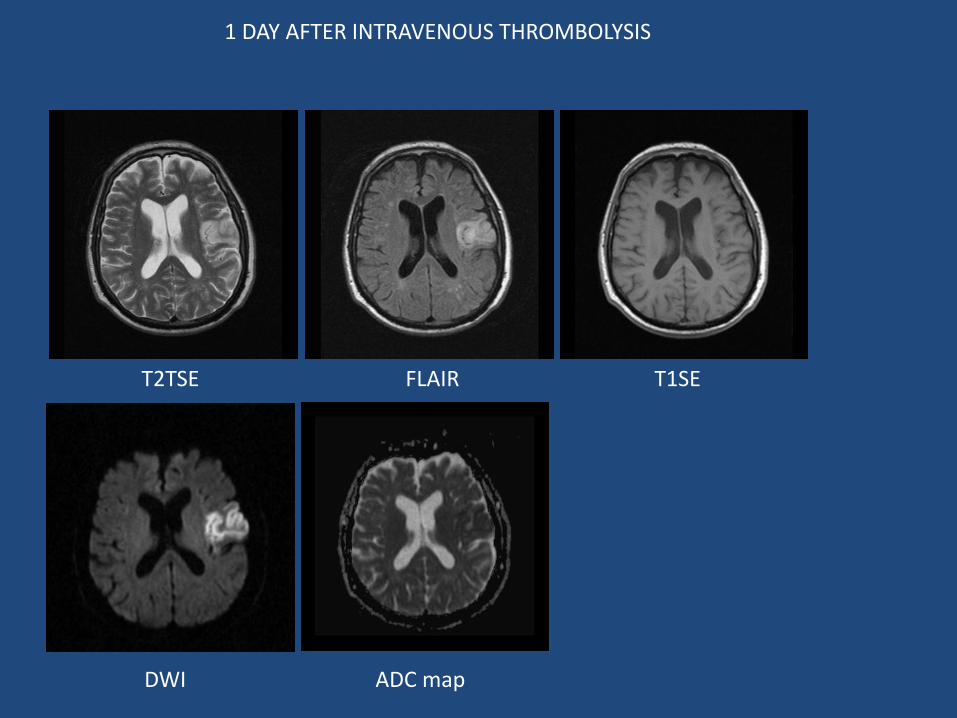
1 DAY AFTER INTRAVENOUS THROMBOLYSIS
ADC map DWI
T2TSE FLAIR T1SE
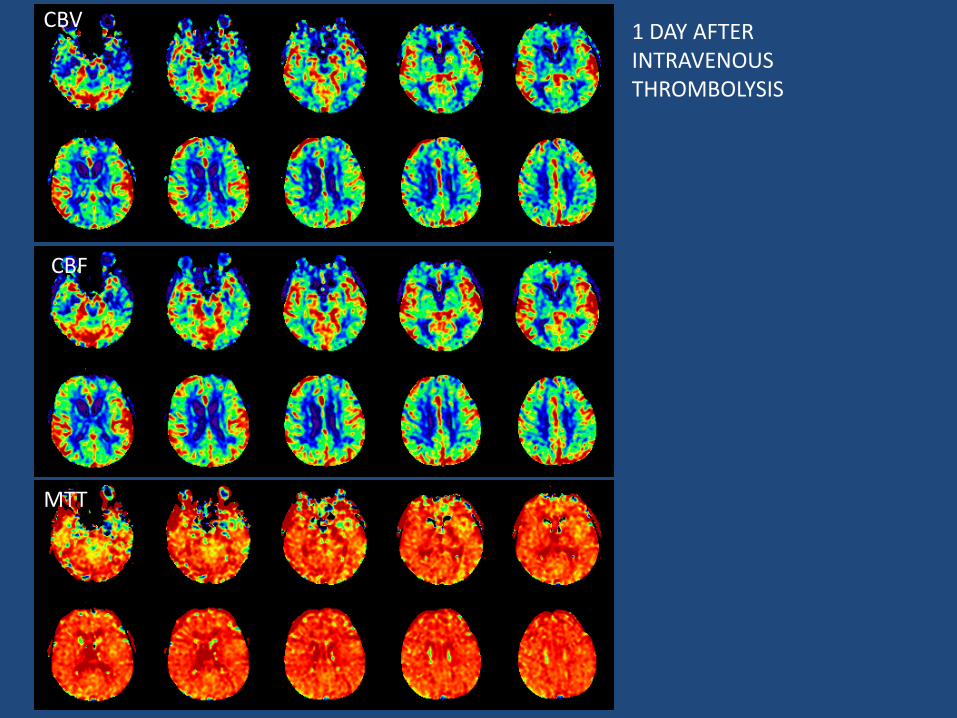
CBV
MTT
1 DAY AFTER INTRAVENOUS THROMBOLYSIS
CBF
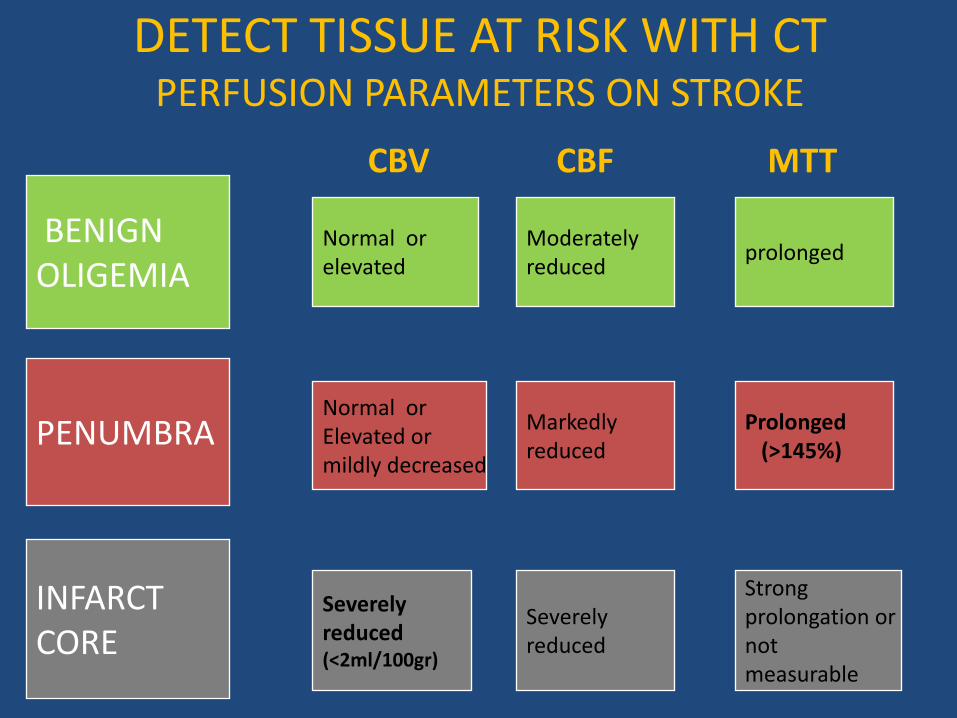
DETECT TISSUE AT RISK WITH CT PERFUSION PARAMETERS ON STROKE
PENUMBRA
INFARCT CORE
BENIGN OLIGEMIA
Normal or Elevated or mildly decreased
Severely reduced (<2ml/100gr)
Normal or elevated
Markedly reduced
Severely reduced
Moderately reduced
Prolonged (>145%)
Strong prolongation or not measurable
prolonged
CBV CBF MTT
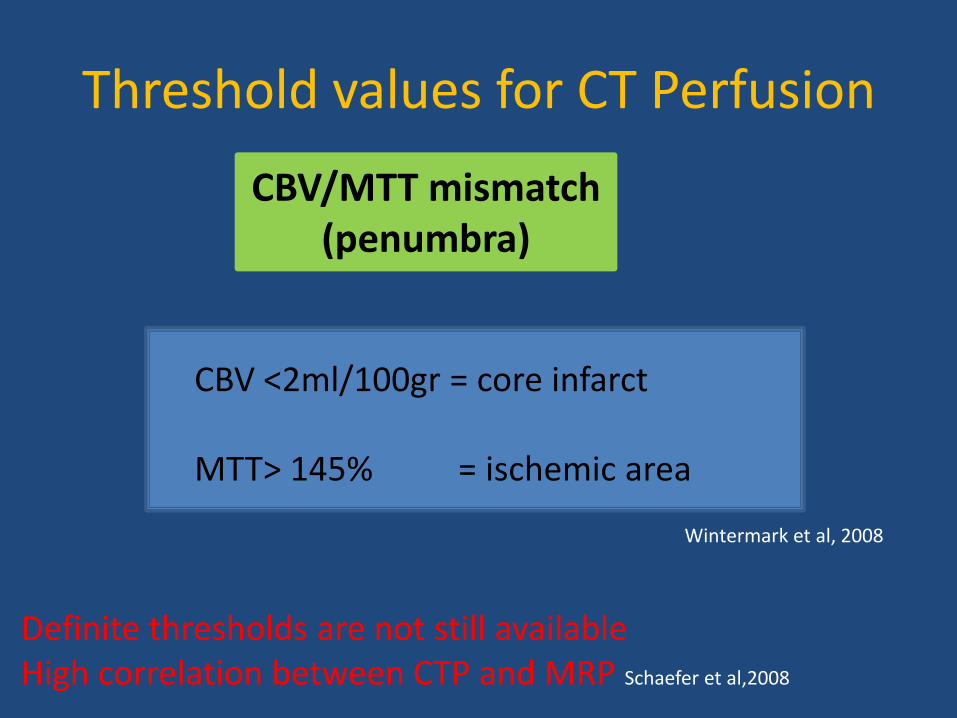
Threshold values for CT Perfusion
CBV/MTT mismatch (penumbra)
CBV <2ml/100gr = core infarct MTT> 145% = ischemic area
Wintermark et al, 2008
Definite thresholds are not still available High correlation between CTP and MRP Schaefer et al,2008
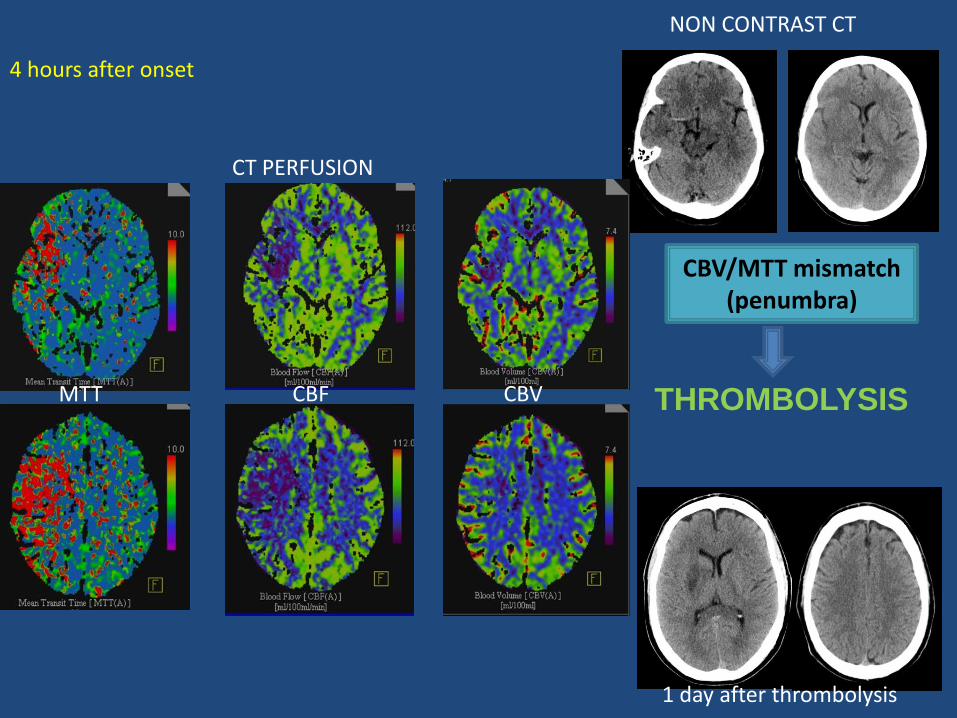
4 hours after onset
1 day after thrombolysis
NON CONTRAST CT
CT PERFUSION
MTT CBF CBV
CBV/MTT mismatch (penumbra)
THROMBOLYSIS
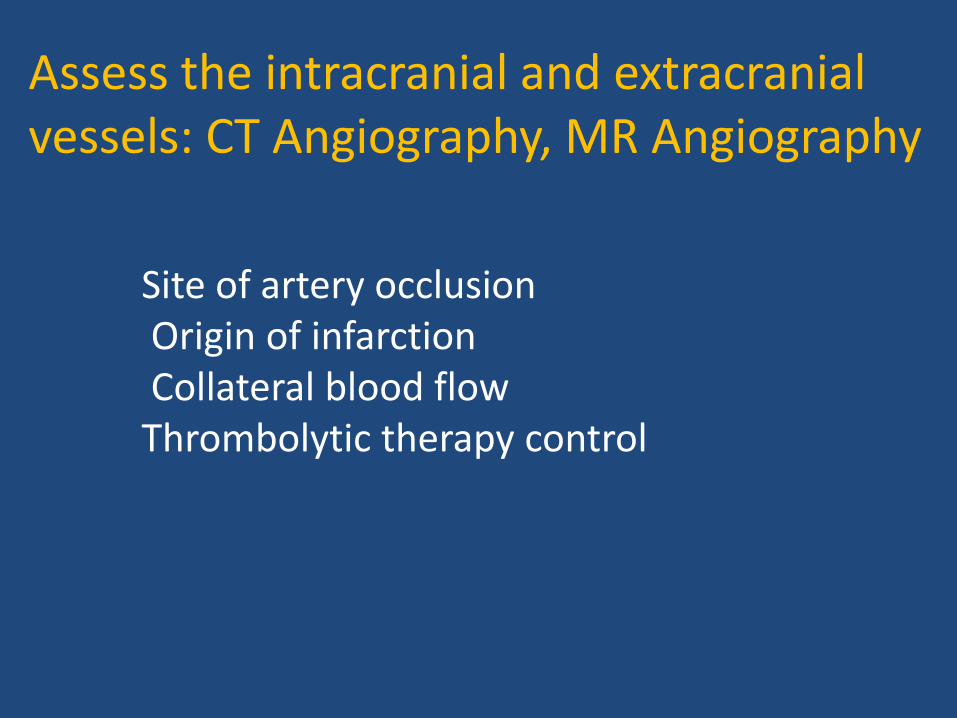
Assess the intracranial and extracranial vessels: CT Angiography, MR Angiography
Site of artery occlusion Origin of infarction Collateral blood flow Thrombolytic therapy control
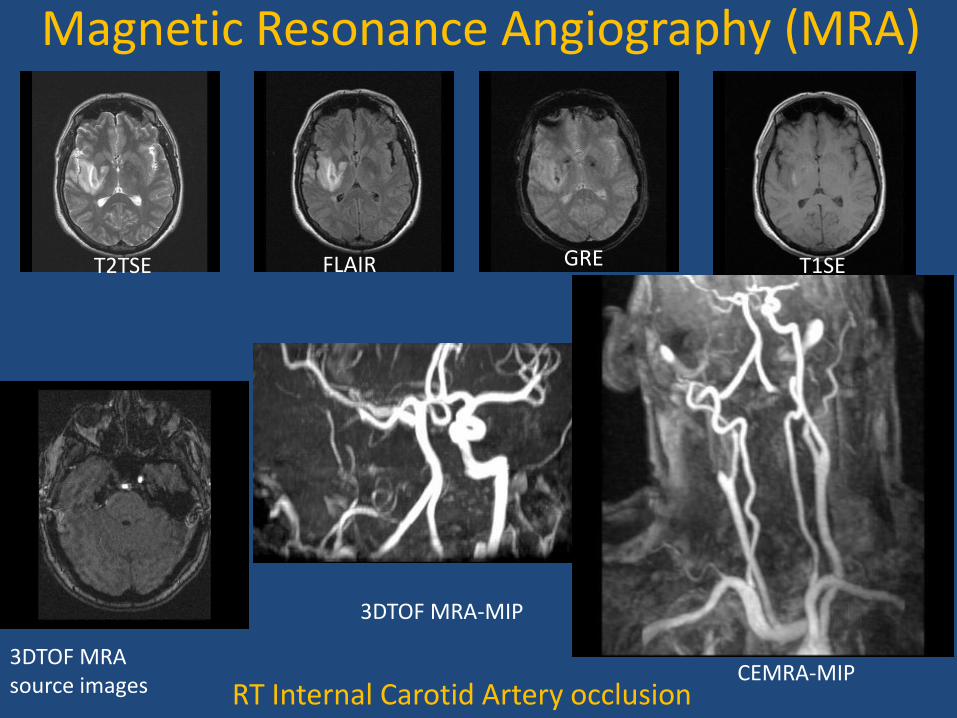
RT Internal Carotid Artery occlusion
3DTOF MRA source images
3DTOF MRA-MIP
Magnetic Resonance Angiography (MRA)
CEMRA-MIP
T2TSE FLAIR T1SE GRE
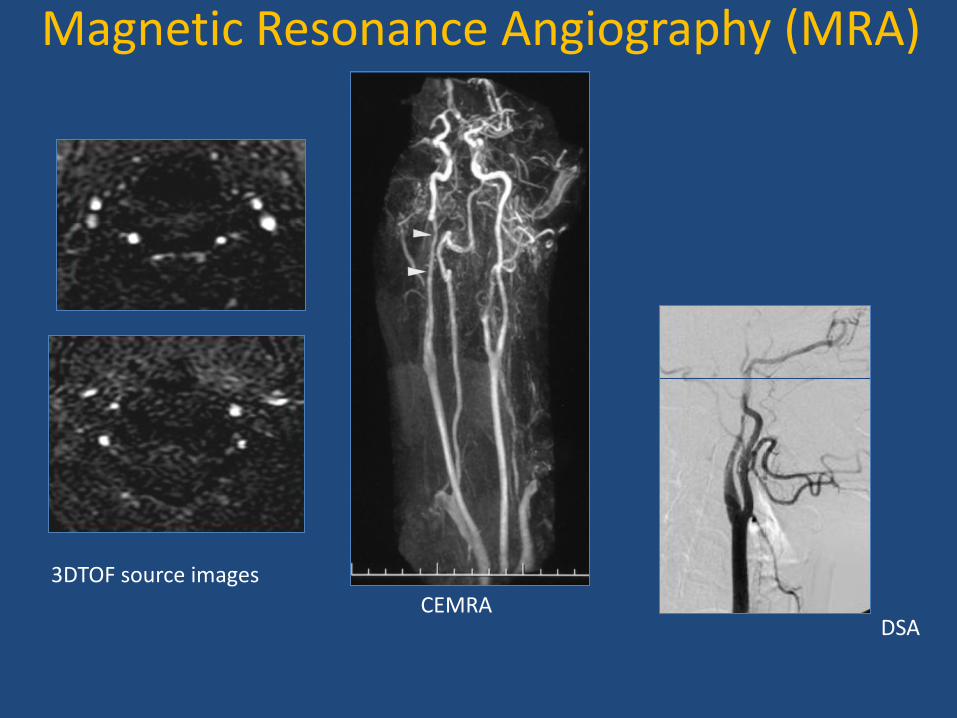
DSA
3DTOF source images
CEMRA
Magnetic Resonance Angiography (MRA)
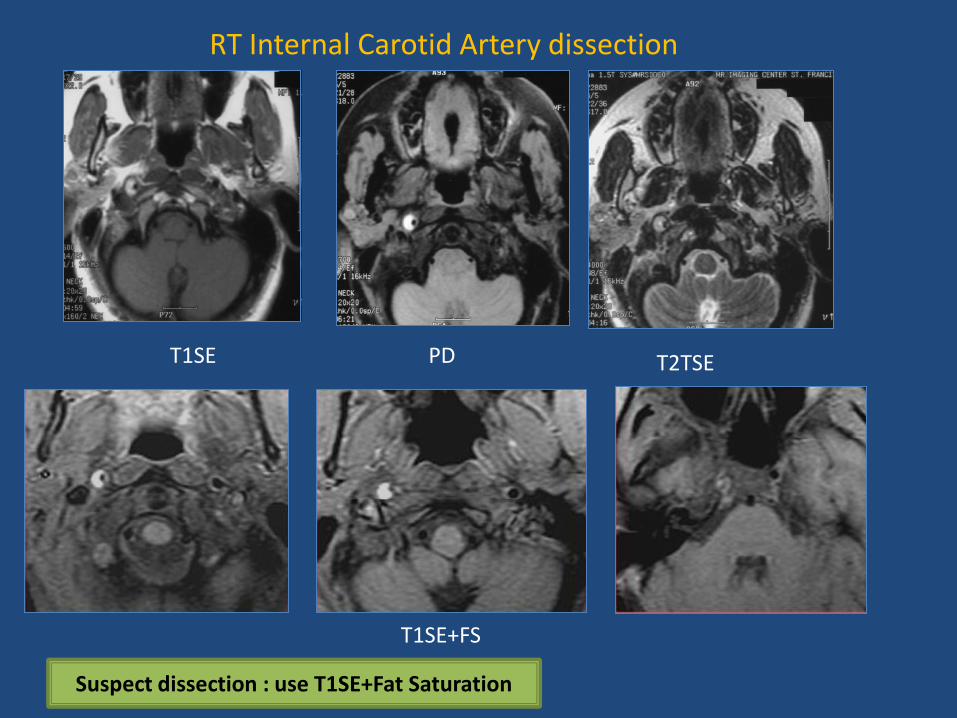
T1SE T2TSE PD
T1SE+FS
Suspect dissection : use T1SE+Fat Saturation
RT Internal Carotid Artery dissection
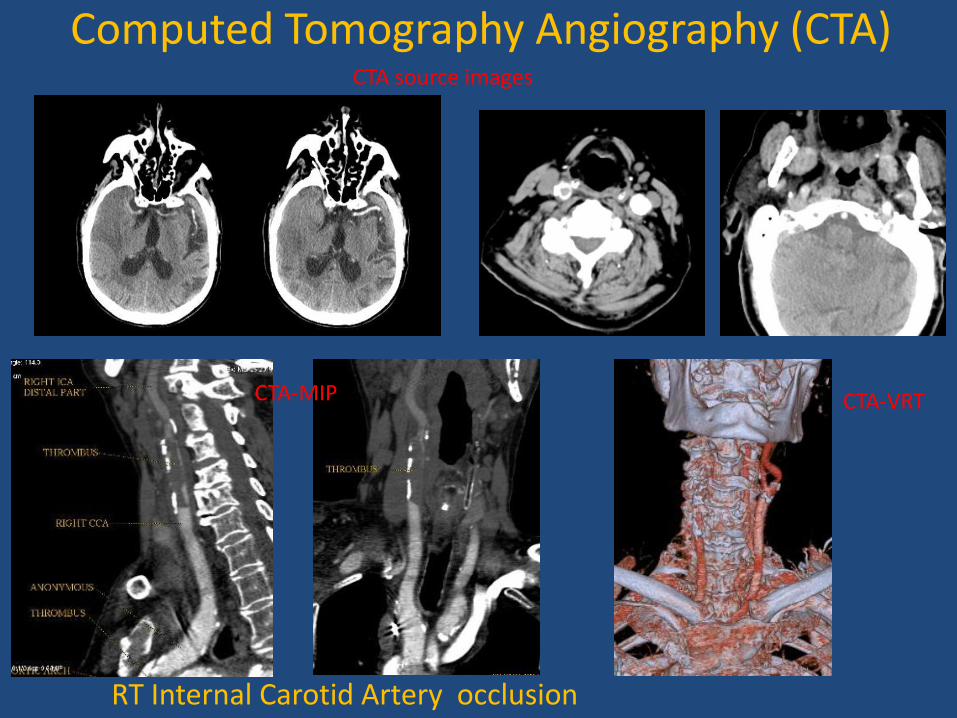
RT Internal Carotid Artery occlusion
CTA-MIP
CTA source images
CTA-VRT
Computed Tomography Angiography (CTA)
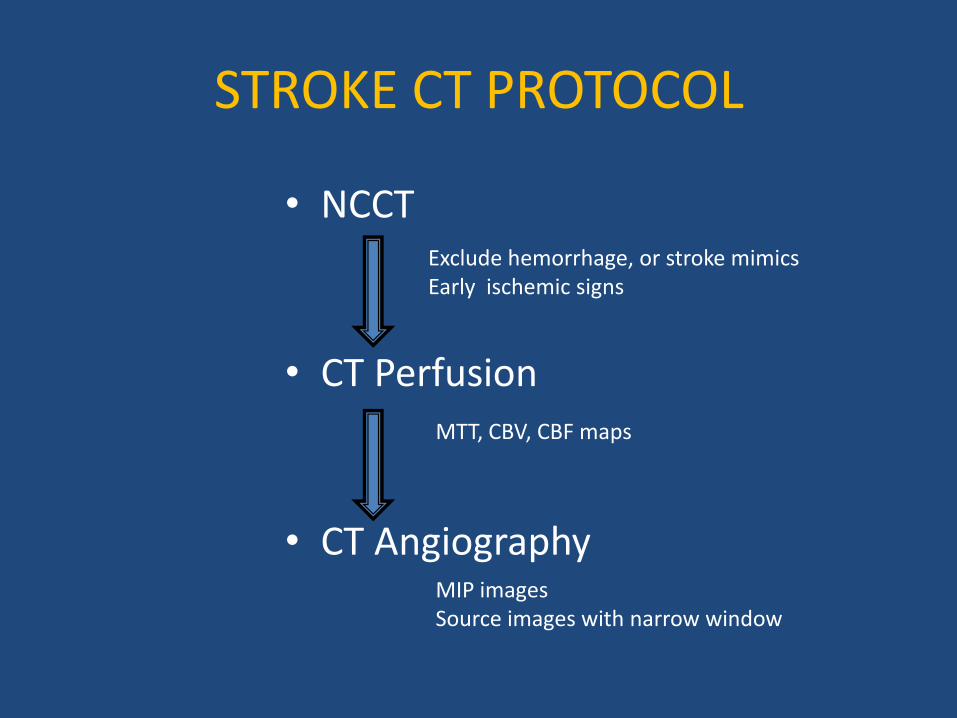
STROKE CT PROTOCOL
• NCCT
• CT Perfusion
• CT Angiography
Exclude hemorrhage, or stroke mimics Early ischemic signs
MTT, CBV, CBF maps
MIP images Source images with narrow window
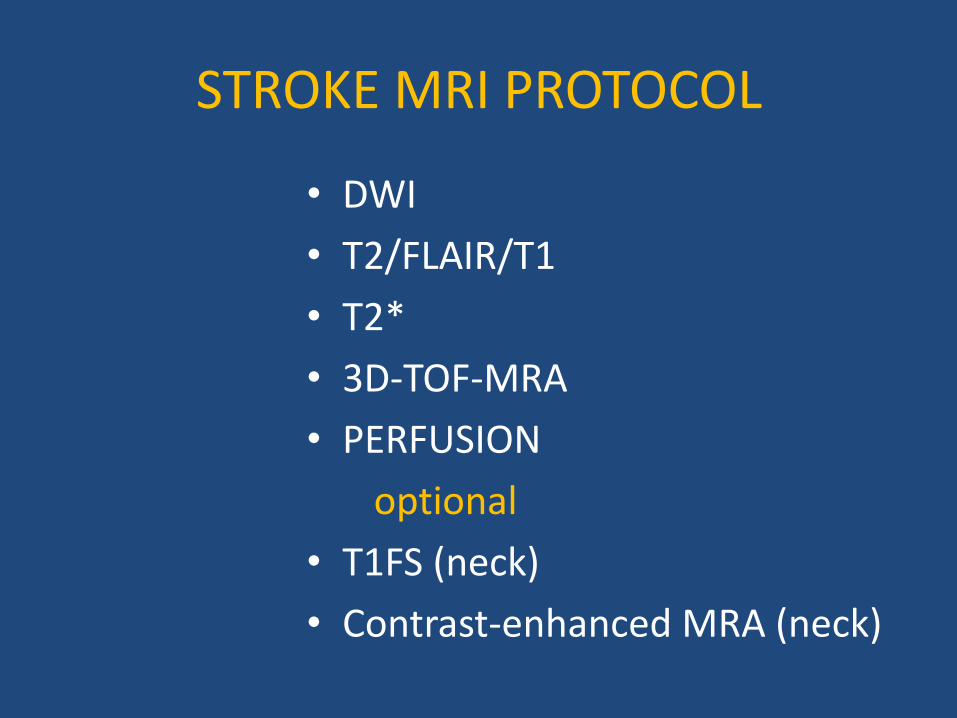
STROKE MRI PROTOCOL
• DWI
• T2/FLAIR/T1
• T2*
• 3D-TOF-MRA
• PERFUSION
optional
• T1FS (neck)
• Contrast-enhanced MRA (neck)
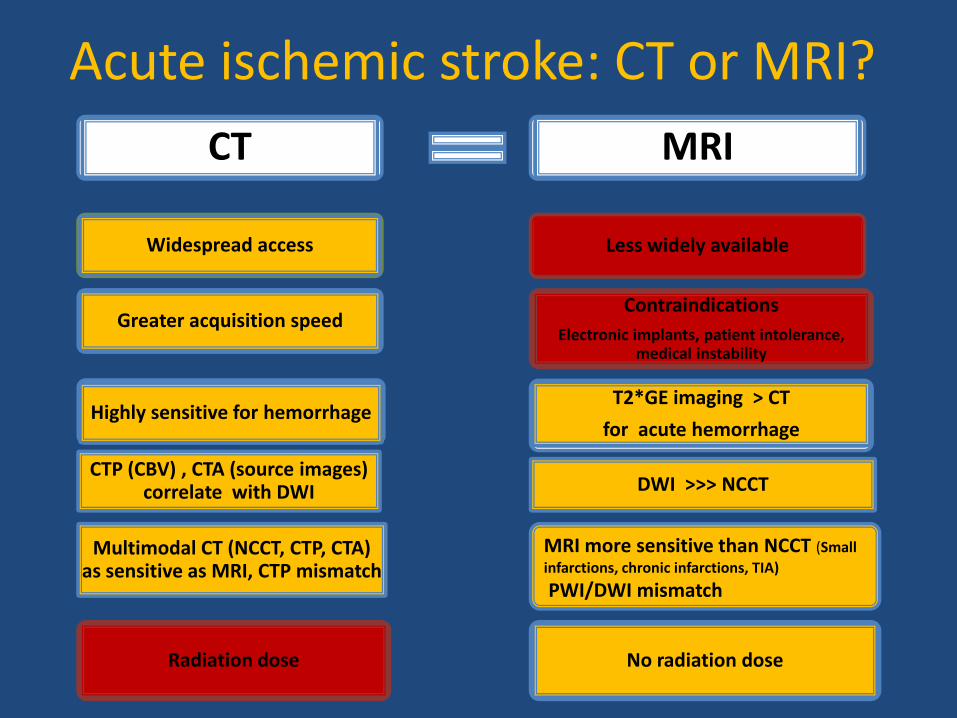
Acute ischemic stroke: CT or MRI?
CT MRI
Widespread access
Greater acquisition speed
Highly sensitive for hemorrhage
CTP (CBV) , CTA (source images) correlate with DWI
Multimodal CT (NCCT, CTP, CTA) as sensitive as MRI, CTP mismatch
Radiation dose
Less widely available
Contraindications
Electronic implants, patient intolerance, medical instability
T2*GE imaging > CT
for acute hemorrhage
DWI >>> NCCT
MRI more sensitive than NCCT (Small
infarctions, chronic infarctions, TIA)
PWI/DWI mismatch
No radiation dose
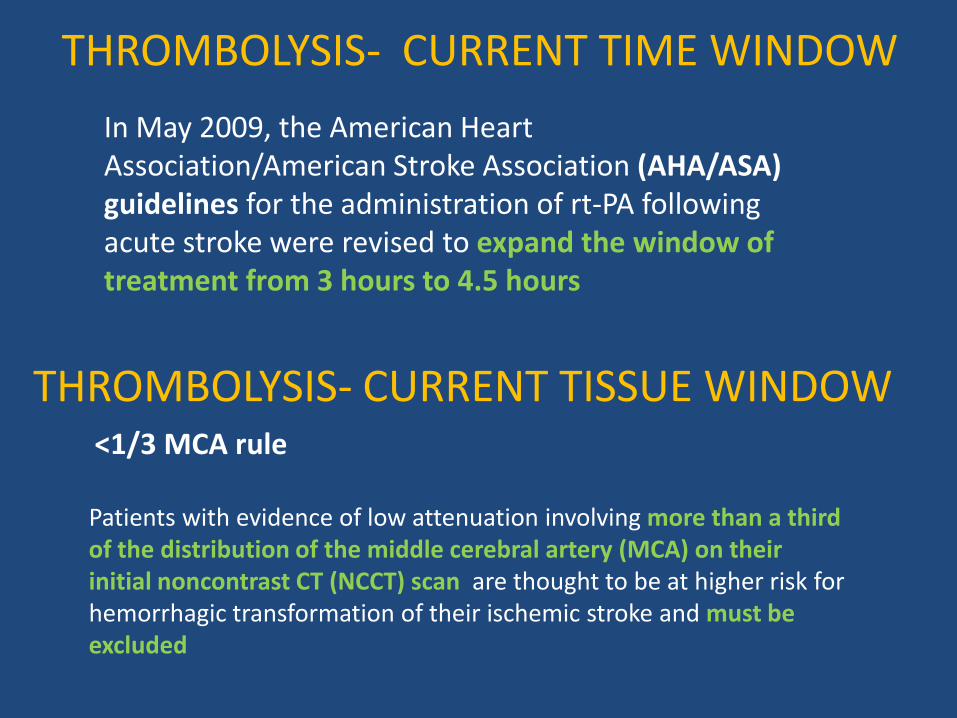
THROMBOLYSIS- CURRENT TIME WINDOW
THROMBOLYSIS- CURRENT TISSUE WINDOW
In May 2009, the American Heart Association/American Stroke Association (AHA/ASA) guidelines for the administration of rt-PA following acute stroke were revised to expand the window of treatment from 3 hours to 4.5 hours
<1/3 MCA rule Patients with evidence of low attenuation involving more than a third of the distribution of the middle cerebral artery (MCA) on their initial noncontrast CT (NCCT) scan are thought to be at higher risk for hemorrhagic transformation of their ischemic stroke and must be excluded
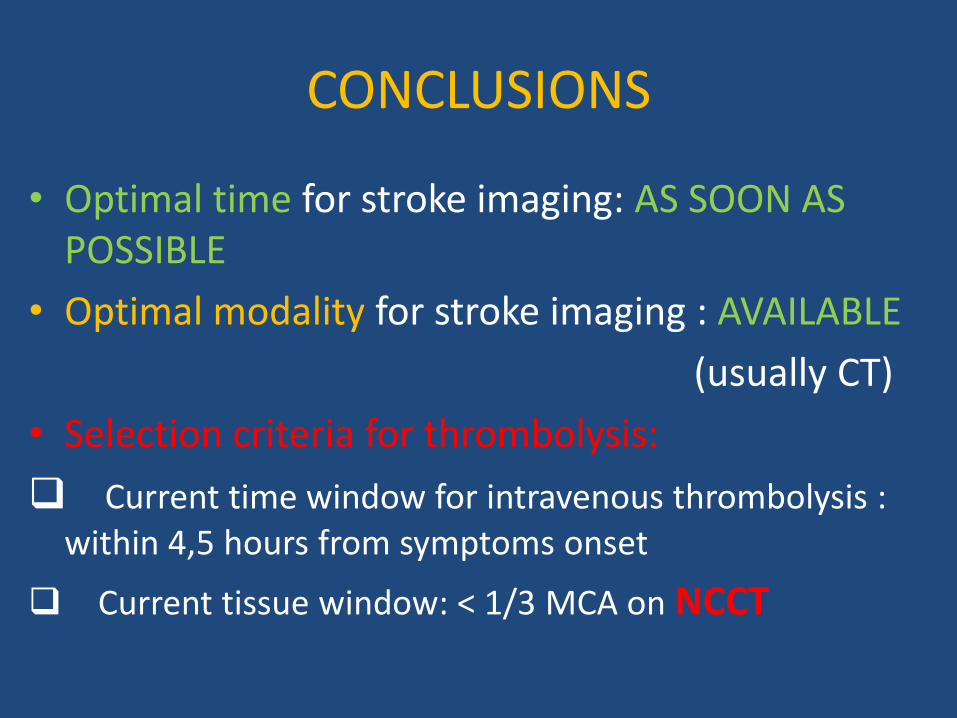
CONCLUSIONS
• Optimal time for stroke imaging: AS SOON AS POSSIBLE
• Optimal modality for stroke imaging : AVAILABLE
(usually CT)
• Selection criteria for thrombolysis:
Current time window for intravenous thrombolysis : within 4,5 hours from symptoms onset
Current tissue window: < 1/3 MCA on NCCT
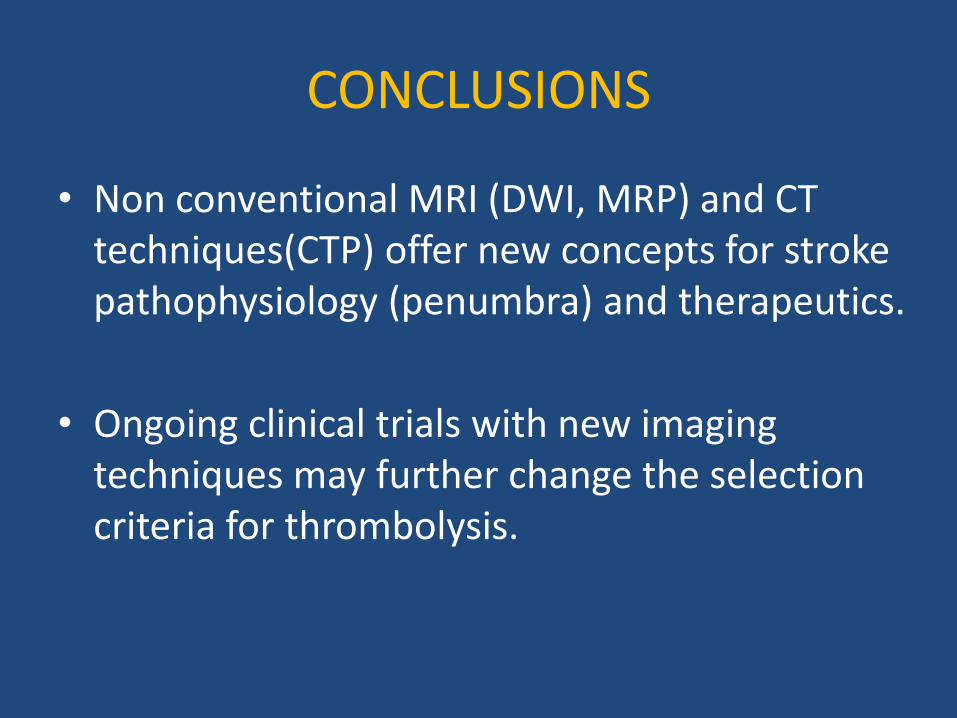
CONCLUSIONS
• Non conventional MRI (DWI, MRP) and CT techniques(CTP) offer new concepts for stroke pathophysiology (penumbra) and therapeutics.
• Ongoing clinical trials with new imaging techniques may further change the selection criteria for thrombolysis.