strong earnings growth, successful refinancing and...
TRANSCRIPT

Interim report 3 2017 Net Gaming Europe AB (publ)
1/14
Interim report for the period 1 January – 30 September 2017 All amounts in the report relate to the Group and are stated in SEK thousands unless otherwise indicated. Figures in brackets refer to the corresponding period in the previous year.
Strong earnings growth, successful refinancing and additional acquisition Third quarter
• Revenue amounted to SEK 40,190 (4,873) thousand, an increase of 725%. • Operating profit before depreciation (EBITDA) was SEK 25,607 (-557) thousand. • Adjusted EBITDA before non-recurring items was SEK 25,831 (-557) thousand. • Operating profit (EBIT) was SEK 25,349 (-705) thousand.
Period 1 January - 30 September 2017
• Revenue amounted to SEK 123,829 (13,733) thousand, an increase of 802%. • Operating profit before depreciation (EBITDA) was SEK 76,592 (-1,639) thousand. • Adjusted EBITDA before non-recurring items was SEK 76,816 (-557) thousand. • Operating profit (EBIT) was SEK 75,834 (-2,065) thousand.
CEO’s comments
It has been a particularly eventful third quarter. Revenue amounted to SEK 40.2 million, with an adjusted EBITDA of SEK 25.8 million. Operations have developed well, with Highlight Media showing organic growth of 15% in the third quarter compared with the same period the previous year. Organic EBITDA growth was 22.1%. Casino is our most important vertical, accounting for 80% of our revenue, and has shown FTD development with strong organic growth of 46%. Our revenue from the USA increased by 150%. Through our affiliate licence in the United States, we see good, sustainable growth potential in this large market. We have seen certain challenges within the poker segment and have launched a number of improvement measures.
We have also further streamlined our organisation so that more products can be launched at an increasing rate. Among other things, we have established a dedicated New Initiatives department to enable us to focus on new ideas, initiatives and product launches that will generate new revenue for the business in both the short and long term. The other single most important event was Net Gaming’s successful refinancing arrangement, which will mean significantly lower interest expenses in the future. After the end of the quarter, Net Gaming also acquired affiliate assets, mainly in Sweden and the UK. This is a business that is showing strong growth and driving a large part of its traffic through Paid Media. The acquisition will generate further growth for our existing operations. We see the Nordic region as an attractive growth market in which we can grow in the future, as the region currently represents just 4% of our revenue. We are continuing to work on our charted growth plan, and our acquisition announced today means that we will also gain additional traffic channels through which to grow. We are also still looking at the possibilities of making further acquisitions. Marcus Teilman, President and CEO

Interim report 3 2017 Net Gaming Europe AB (publ)
2/14
Significant events in the third quarter • The new share issue for payment of the additional purchase consideration associated
with the acquisition of HLM Malta Ltd has been registered by the Swedish Companies Registration Office, corresponding to 1,544,772 new shares.
• SEK 7,499,997.50 of the convertible debenture has been converted into 1,666,666 new shares.
• Net Gaming has issued a new bond loan of SEK 375 million and repaid the previous bond loan In addition, SEK 70 million of the convertible debenture has been repaid.
• Net Gaming has strengthened its management team by appointing Erik Gjerde as CEO and Sirp De Wit as COO of the subsidiary HLM Malta Ltd.
Significant events after the end of the period
• Net Gaming has listed its bond loan on Nasdaq Stockholm’s Corporate Bonds List. • SEK 2,499,997.50 of the convertible debenture has been converted into 555,555 new
shares. • Acquisition of Nordic affiliate business for an initial purchase consideration of EUR 3
million, with an additional consideration of EUR 3.75 million. Description of Net Gaming Net Gaming currently operates two different business areas: affiliation/lead generation and iGaming operations. Affiliate operations are conducted through Highlight Media and account for about 96% of Net Gaming’s total revenue. iGaming operations are conducted under two brands: PokerLoco and CasinoLoco. Affiliate operations Highlight Media was founded in 2003 and is a pioneer in lead generation in iGaming, in other words an Affiliate. PokerListings, one of the world’s most prominent and well-known brands in the poker segment, was launched in 2003. CasinoTop10 was launched in 2004 and a number of additional brands have also been launched since then. HLM currently operates over 130 sites in 30 countries. Highlight has over 80 employees, 10 of whom work through consulting agreements. Content writers, developers, project managers, SEO specialists, designers and other staff are based at the office in Malta. The focus is on systematically and methodically working every day to provide a
high-quality product for the end users, namely the online players. This is done by developing websites with a large amount of quality content, such as poker and casino guides, rules and strategies on how to play poker, reviews of iGaming operators, leader boards for iGaming operators, and bonuses, banners and targeted offers for players. When a player clicks on one of these links on Highlight’s websites, they are taken to the iGaming operator in question. This process is called a lead. Once the player has created an account with the iGaming operator and made their first deposit, this triggers a payment to Highlight (Qualified Referral). The focus is on quality and well-written content, which gives online players a sense of security and quality, and is a direct success factor for Highlight. Highlight has a proprietary Business Intelligence system that has collected a large amount of data over several years, which means that Highlight’s traffic is constantly and progressively optimised to increase the quality of referrals to iGaming operators, thereby increasing competitiveness and allowing higher payment for the services provided.

Interim report 3 2017 Net Gaming Europe AB (publ)
3/14
Revenue models för Casino and Poker
HLM’s payments come through different revenue models. The most common model is CPA (cost per acquisition). This is an initial payment that HLM receives when it has referred a paying player to one of its customers (operators). HLM considers CPA to be one of the most attractive models for receiving payment, as Highlight constantly optimises its traffic to increase conversion rates and the quality of its leads. Another way to receive payments is through revenue sharing. Under this model, HLM is paid over time as players registered with the operators continue to play. HLM also receives payments through a combination of these two (hybrid) or any other methods, such as permanent advertising space. Geographic distribution of Casino and Poker
HLM’s revenue comes mainly from different European markets, such as France, the Netherlands, Italy, Spain, the UK and Germany. Nordic, South America and Rest of the world are expected to account for an increasing share of total revenue in the future, as the underlying growth in these markets is currently good. The majority of the traffic to HLM’s sites comes from mobile devices.
FTD development for Casino and Poker aggregated
The chart above shows a type of index for FTD development over time for casino and poker aggregated. FTD stands for first time depositor, i.e. a newly depositing customer that HML has referred to one of its customers (operators). FTD development Casino
Growth within casino has continued to be very positive, +46%. It is particularly pleasing that other markets outside Europe are now starting to accelerate and are expected to develop well in the period ahead. iGaming operations iGaming operations have shown stable development during the quarter, with an EBITDA of SEK 317 thousand. Non-recurring costs Non-recurring costs affecting EBITDA during the quarter amounted to SEK 224 thousand, while non-recurring costs affecting finance costs amounted to SEK 39.4 million.
80%
12%
8%
0%
CPA
Rev Share
Hybrid
Other
4%
76%
11%1%8% Nordics
Europe
North Amerika
South America
Rest of World
0200400600800
1 0001 2001 400
Q1 Q2 Q3 Q4 Q1 Q2 Q3 Q4 Q1 Q2 Q3
2015 2016 2017
0
500
1 000
1 500
2 000
2 500
Q1 Q2 Q3 Q4 Q1 Q2 Q3 Q4 Q1 Q2 Q3
2015 2016 2017

Interim report 3 2017 Net Gaming Europe AB (publ)
4/14
Subsidiary’s ongoing merger process The subsidiary HLM Malta Limited has started the process of merging its own subsidiaries. The purpose is to enable the business to perform much more efficiently by merging four subsidiaries into one legal entity. Combining four companies’ skills in one common company creates better opportunities to exploit synergies and also to make cost-savings, notably in the form of administration and auditing. If the necessary approval is obtained from Malta’s Inland Revenue Department in 2017, the merger will be implemented with effect from 1 January 2017. Another effect of the merger is that the four different companies will become a single taxable entity and their accumulated loss carryforwards can be used against future profits. In view of the size of the loss carryforwards, no income tax will need to be paid in the HLM Group in 2017. Based on current forecasts, the loss carryforwards will be fully utilised by 2020. As the loss carryforwards are used and the deferred tax asset is reduced, this reduction will be recognised as tax expense and will be displayed as change in deferred income tax in the Consolidated Statement of Comprehensive Income. If the merger can not be executed in 2017, there is a possibility instead of recovering 6/7 of income tax from the Group's subsidiaries in Malta, in accordance with the Maltese tax system within the Group.

Interim report 3 2017 Net Gaming Europe AB (publ)
5/14
Consolidated Statement of Comprehensive Income
01/07/2017 01/07/2016 01/01/2017 01/01/2016
Amounts in SEK thousands
30/09/2017 30/09/2016 30/09/2017 30/09/2016
Revenue, affiliate operations 38,440 - 116,160 -
Revenue, gaming operations 1,750 4,873 7,669 13,733
Total revenue 40,190 4,873 123,829 13,733
Operating expenses, gaming operations -516 -1,744 -2,235 -4,790
Capitalised work for own account 76 73 228 246
Marketing expenses -2,332 -2,796 -9,979 -7,891
Other external expenses -4,167 -631 -12,869 -1,991
Personnel expenses -8,120 -602 -23,363 -1,609
Other operating income 538 270 1,105 663
Other operating expenses -62 - -124 -
EBITDA 25,607 -557 76,592 -1,639
Depreciation and amortisation -258 -148 -758 -426
Operating profit/loss (EBIT) 25,349 -705 75,834 -2,065
Interest and similar income – – – –
Interest and similar expenses -50,096 -736 -73,550 -888
Other financial items -1,351 – -816 –
Net financial items -51,447 -736 -74,366 -888
Profit/loss before tax -26,098 -1,441 1,468 -2,953
Current tax -7,588 – -21,907 –
Change in deferred income tax 1,932 – 4,622 –
Profit/loss for the year
-31,754 -1,441 -15,817 -2,953
Earnings per share (SEK) -0.51 -0.03 -0.26 -0.05
Earnings per share after dilution (SEK) -0.43 -0.21
Other comprehensive income,
income and expenses recognised directly in equity
Exchange differences on translation of foreign
operations 801 -268 210 -630
Other comprehensive income for the year 801 -268 210 -630
Total comprehensive income for the period -30,953 -1,709 -15,607 -3,583
Comprehensive income per share (SEK) -0.49 -0.03 -0.26 -0.06
Comprehensive income per share after dilution (SEK) -0.42 -0.21

Interim report 3 2017 Net Gaming Europe AB (publ)
6/14
Consolidated Statement of Financial Position
Amounts in SEK thousands 30/09/2017 31/12/2016 30/09/2016
ASSETS
Non-current assets
Property, plant and equipment 641 761 42
Goodwill 370,254 370,254 -
Other intangible assets 5,489 5,707 5,820
Other non-current receivables 7,338 6,911 -
Deferred tax assets 36,398 36,338 -
Total non-current assets 420,120 419,971 5,862
Current assets
Trade receivables 16,077 14,390 132
Other current assets 1,774 4,821 20,688
Prepayments and accrued income 6,390 5,987 1,880
Cash and bank balances 296,036 58,999 17,343
Total current assets 320,277 84,197 40,043
TOTAL ASSETS 740,397 504,168 45,905
EQUITY AND LIABILITIES
Equity 21,391 4,456 -4,535
Provisions
Other provisions 52,724 52,725 -
Non-current liabilities
Liabilities to parent company - - 34,000
Other non-current liabilities 426,358 332,409 -
Deferred tax liabilities 6,381 10,998 -
Total non-current liabilities 432,739 343,407 34,000
Current liabilities
Trade payables 2,491 3,249 1,533
Liabilities to Parent Company 3,365 3,243 3,120
Tax liabilities 23,213 1,337 -
Other current liabilities 192,620 80,423 9,765
Accrued expenses and prepaid income 11,854 15,328 2,022
233,543 103,580 16,440
TOTAL EQUITY AND LIABILITIES
740,397 504,168 45,905
Interim report 3 2017 Net Gaming Europe AB (publ)
7/14
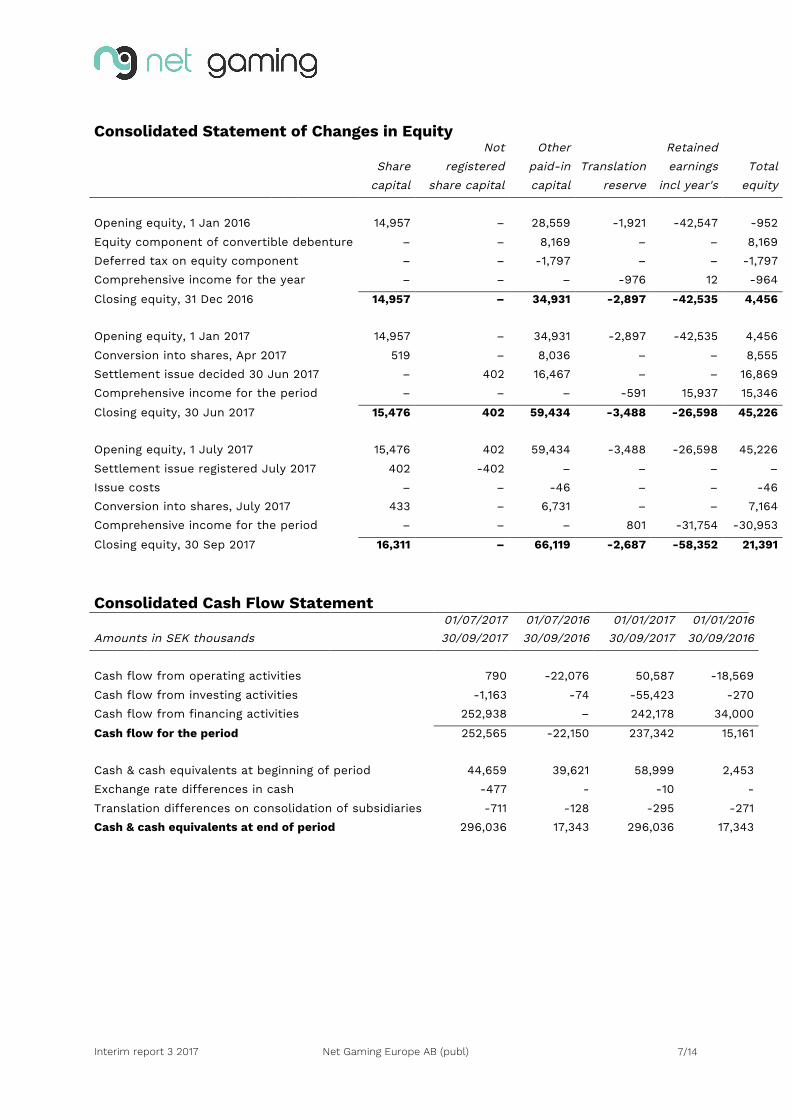
Consolidated Statement of Changes in Equity
Not Other Retained Share registered paid-in Translation earnings Total
capital share capital capital reserve incl year's equity
Opening equity, 1 Jan 2016 14,957 – 28,559 -1,921 -42,547 -952
Equity component of convertible debenture – – 8,169 – – 8,169
Deferred tax on equity component – – -1,797 – – -1,797
Comprehensive income for the year – – – -976 12 -964
Closing equity, 31 Dec 2016 14,957 – 34,931 -2,897 -42,535 4,456
Opening equity, 1 Jan 2017 14,957 – 34,931 -2,897 -42,535 4,456
Conversion into shares, Apr 2017 519 – 8,036 – – 8,555
Settlement issue decided 30 Jun 2017 – 402 16,467 – – 16,869
Comprehensive income for the period – – – -591 15,937 15,346
Closing equity, 30 Jun 2017
15,476 402 59,434 -3,488 -26,598 45,226
Opening equity, 1 July 2017 15,476 402 59,434 -3,488 -26,598 45,226
Settlement issue registered July 2017 402 -402 – – – –
Issue costs – – -46 – – -46
Conversion into shares, July 2017 433 – 6,731 – – 7,164
Comprehensive income for the period – – – 801 -31,754 -30,953
Closing equity, 30 Sep 2017
16,311 – 66,119 -2,687 -58,352 21,391
Consolidated Cash Flow Statement
01/07/2017 01/07/2016 01/01/2017 01/01/2016 Amounts in SEK thousands
30/09/2017 30/09/2016 30/09/2017 30/09/2016
Cash flow from operating activities 790 -22,076 50,587 -18,569
Cash flow from investing activities -1,163 -74 -55,423 -270
Cash flow from financing activities 252,938 – 242,178 34,000
Cash flow for the period 252,565 -22,150 237,342 15,161
Cash & cash equivalents at beginning of period 44,659 39,621 58,999 2,453
Exchange rate differences in cash -477 - -10 -
Translation differences on consolidation of subsidiaries -711 -128 -295 -271
Cash & cash equivalents at end of period 296,036 17,343 296,036 17,343

Interim report 3 2017 Net Gaming Europe AB (publ)
8/14
Key figures, Group
01/07/2017 01/07/2016 01/01/2017 01/01/2067 30/09/2017 30/09/2016 30/09/2017 30/09/2016
Operating margin 63% neg 61% neg
Equity/assets ratio 3% -10% 3% -10%
Return on equity neg neg neg neg
Equity per share, SEK 0,34 -0,08 0,34 -0,08
Number of shares at beginning of period 59,524,999 57,525,000 57,525,000 57,525,000
Number of shares at end of period 62,736,477 57,525,000 62,736,477 57,525,000
Average number of shares during period 62,561,902 57,525,000 59,742,564 57,525,000
Number of shares on maximum dilution 74,280,556 74,280,556
Market price per share at end of period 11.05 4.35 11.05 4.35
Definitions of key figures Operating margin Operating profit/loss as a percentage of sales. Equity/assets ratio Equity as a percentage of total assets. Return on equity Profit/loss after tax divided by average equity. Earnings per share, SEK Profit/loss after tax divided by the average number of shares. Equity per share, SEK Equity divided by the number of shares outstanding.

Interim report 3 2017 Net Gaming Europe AB (publ)
9/14
Income Statement – Parent Company
2017-07-01 2016-07-01 2017-01-01 2016-01-01 Amounts in SEK thousands
2017-09-30 2016-09-30 2017-09-30 2016-09-30
Revenue 123 391 356 1,118
Total revenue 123 391 356 1,118
OPERATING EXPENSES
Other external expenses -770 -324 -2,356 -866
Personnel expenses -41 -211 -87 -586
Other operating income -62 - -124 -
Operating profit/loss -750 -144 -2,211 -334
Profit/loss from financial items
Profit/loss from investments in Group companies 9,567 - 19,251 -61
Other interest and similar income 1,409 108 9,021 323
Interest and similar expenses -50,097 -736 -73,550 -888
Profit/loss after financial items -39,871 -772 -47,489 -960
Current tax – – – –
Change in deferred income tax 819 – 1,199 –
Profit/loss for the year
-39,052 -772 -46,290 -960

Interim report 3 2017 Net Gaming Europe AB (publ)
10/14
Balance Sheet – Parent Company
Amounts in SEK thousands
2017-09-30 2016-12-31 2016-09-30 ASSETS
Non-current assets
Financial assets
Investments in Group companies 324,562 324,562 11
Non-current receivables from Group companies 85,384 116,286 12,574
Other non-current receivables 7,338 6,911 –
Total financial assets 417,284 447,759 12,585
Total non-current assets 417,284 447,759 12,585
Current assets
Current receivables
Receivables from Group companies 18,116 24,653 1,209
Other current assets 162 1,641 20,232
Prepayments and accrued income
3,897 4,083 1,880
Cash and bank balances 249,694 20,011 12,416
Total current assets 271,869 50,388 35,737
TOTAL ASSETS 689,153 498,147 48,322
EQUITY AND LIABILITIES
Equity 13,204 26,952 9,246
Provisions
Other provisions 52,724 52,725 -
Non-current liabilities
Liabilities to Parent Company - - 34,000
Other non-current liabilities 426,358 332,409 -
Deferred tax liabilities 471 1,670 -
Total non-current liabilities 426,829 334,079 34,000
Current liabilities
Trade payables 487 441 1,191
Liabilities to Parent Company 3,365 3,243 3,120
Liabilities to Group companies 1,043 1,043 -
Other current liabilities 185,531 70,327 27
Upplupna kostnader och förutbetalda intäkter 5,970 9,337 738
196,396 84,391 5,076
TOTAL EQUITY AND LIABILITIES 689,153 498,147 48,322

Interim report 3 2017 Net Gaming Europe AB (publ)
11/14
Statement of Changes in Equity – Parent Company
Not Other Retained Share registered paid-in earnings Total
capital share capital capital incl year's equity
Parent Company
Opening equity, 1 Jan 2016 14,957 – – -4,751 10,206
Equity component of convertible debenture – – 8,169 – 8,169
Deferred tax on equity component – – -1,797 – -1,797
Comprehensive income for the year – – – 10,375 10,375
Closing equity, 31 Dec 2016 14,957 – 6,372 5,624 26,952
Opening equity, 1 Jan 2017 14,957 – 6,372 5,624 26,952
Conversion into shares, Apr 2017 519 – 8,036 – 8,555
Result of the AGM – – -6,372 6,372 –
Settlement issue decided 30 Jun 2017 – 402 16,467 – 16,869
Comprehensive income for the period – – – -7,238 -7,238
Closing equity, 30 Jun 2017 15,476 402 24,503 4,758 45,138
Opening equity, 1 July 2017 15,476 402 24,503 4,758 45,138
Settlement issue registered July 2017 402 -402 – – –
Issue costs – – -46 – -46
Conversion into shares, July 2017 433 – 6,731 – 7,164
Comprehensive income for the period – – – -39,052 -39,052
Closing equity, 30 Jun 2017 16,311 – 31,188 -34,294 13,204
Condensed Cash Flow Statement – Parent Company
2017-07-01 2016-07-01 2017-01-01 2016-01-01 Amounts in SEK thousands
2017-09-30 2016-09-30 2017-09-30 2016-09-30
Cash flow from operating activities -36,862 -21,648 -8,484 -21,690
Cash flow from investing activities -1,043 - -55,002 –
Cash flow from financing activities 262,505 - 292,956 34,000
Cash flow for the period 224,600 -21,648 229,470 12,310
Cash & cash equivalents at beginning of period 25,010 34,064 20,011 106
Exchange rate differences in cash 84 – 213 –
Cash & cash equivalents at end of period 249,694 12,416 249,694 12,416
Interim report 3 2017 Net Gaming Europe AB (publ)
12/14
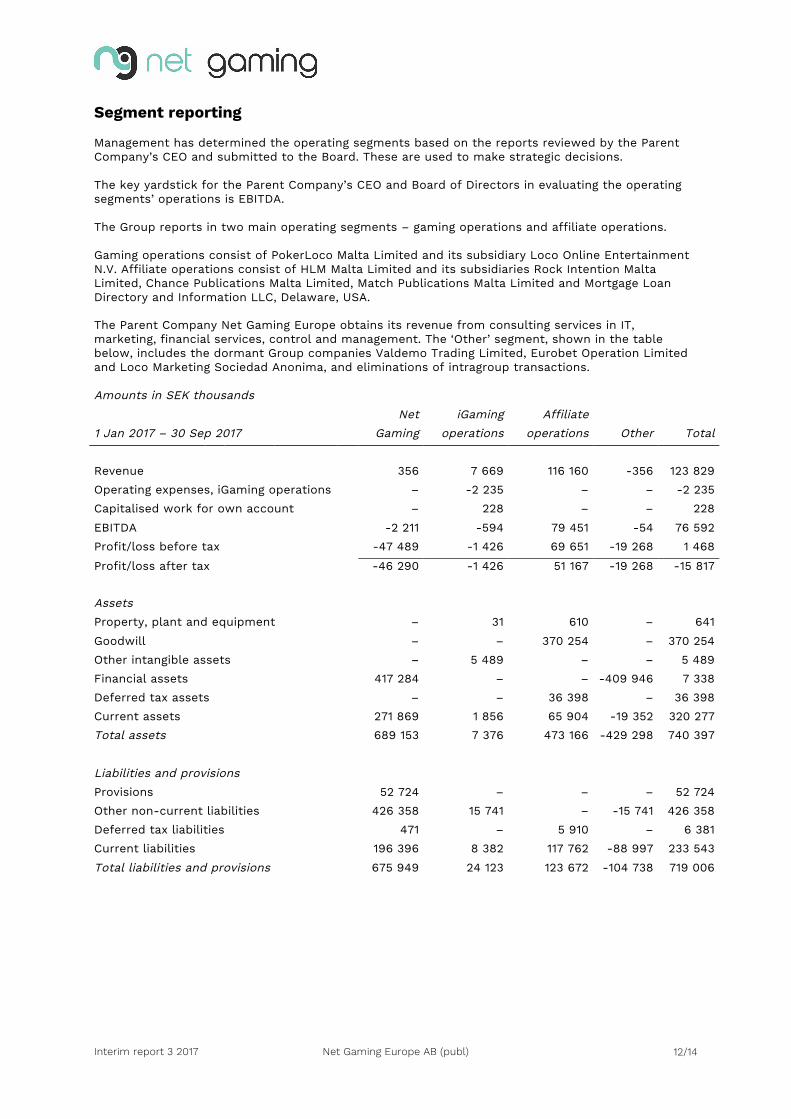
Segment reporting Management has determined the operating segments based on the reports reviewed by the Parent Company’s CEO and submitted to the Board. These are used to make strategic decisions. The key yardstick for the Parent Company’s CEO and Board of Directors in evaluating the operating segments’ operations is EBITDA. The Group reports in two main operating segments – gaming operations and affiliate operations. Gaming operations consist of PokerLoco Malta Limited and its subsidiary Loco Online Entertainment N.V. Affiliate operations consist of HLM Malta Limited and its subsidiaries Rock Intention Malta Limited, Chance Publications Malta Limited, Match Publications Malta Limited and Mortgage Loan Directory and Information LLC, Delaware, USA. The Parent Company Net Gaming Europe obtains its revenue from consulting services in IT, marketing, financial services, control and management. The ‘Other’ segment, shown in the table below, includes the dormant Group companies Valdemo Trading Limited, Eurobet Operation Limited and Loco Marketing Sociedad Anonima, and eliminations of intragroup transactions. Amounts in SEK thousands
Net iGaming Affiliate
1 Jan 2017 – 30 Sep 2017 Gaming operations operations Other Total
Revenue 356 7 669 116 160 -356 123 829
Operating expenses, iGaming operations – -2 235 – – -2 235
Capitalised work for own account
– 228 – – 228
EBITDA -2 211 -594 79 451 -54 76 592
Profit/loss before tax -47 489 -1 426 69 651 -19 268 1 468
Profit/loss after tax -46 290 -1 426 51 167 -19 268 -15 817
Assets
Property, plant and equipment – 31 610 – 641
Goodwill – – 370 254 – 370 254
Other intangible assets – 5 489 – – 5 489
Financial assets 417 284 – – -409 946 7 338
Deferred tax assets – – 36 398 – 36 398
Current assets 271 869 1 856 65 904 -19 352 320 277
Total assets 689 153 7 376 473 166 -429 298 740 397
Liabilities and provisions
Provisions 52 724 – – – 52 724
Other non-current liabilities 426 358 15 741 – -15 741 426 358
Deferred tax liabilities 471 – 5 910 – 6 381
Current liabilities 196 396 8 382 117 762 -88 997 233 543
Total liabilities and provisions 675 949 24 123 123 672 -104 738 719 006

Interim report 3 2017 Net Gaming Europe AB (publ)
13/14
Net iGaming
1 Jan 2016 – 30 Sep 2016 Gaming Operations Other Total
Revenue 1 118 13 733 -1 118 13 733
Operating expenses, iGaming operations
– -4 790 – -4 790
Capitalised work for own account – 246 – 246
EBITDA -334 -1 244 -61 -1 639
Profit/loss before tax -960 -2 019 26 -2 953
Profit/loss after tax -960 -2 019 26 -2 953
Assets 48 322 11 382 -13 799 45 905
Liabilities 39 076 25 169 -13 805 50 440
Related party transactions
2017-07-01 2016-07-01 2017-01-01 2016-01-01 Parent Company 2017-09-30 2016-09-30 2017-09-30 2016-09-30
Sales of services to subsidiaries 123 391 356 1 118
Interest income from subsidiaries 2 592 108 9 811 323
Interest expenses to other related parties -41 -736 -121 -885
Receivables from subsidiaries 105 965 16 248
Accumulated impairment of receivables from subsidiaries -2 465 -2 465
Carrying amount of receivables from subsidiaries 103 500 13 783
Liabilities to other related parties 3 365 37 120

Interim report 3 2017 Net Gaming Europe AB (publ)
14/14
Upcoming financial reports Year-end report 2017: 22 February 2018 Annual Report: published 27 April 2018 Interim report 1 2018: 24 May 2018 Interim report 2 2018: 23 August 2018 The Annual General Meeting will be held in Stockholm on 24 May 2018 Accounting policies This interim report has been prepared in accordance with IAS 34. The consolidated financial statements have been prepared in accordance with International Financial Reporting Standards, IFRS. This interim report has not been reviewed by the Company’s auditors. Stockholm, 23 November 2017 Board of Directors For further information, contact Marcus Teilman, President and CEO, telephone +46 8 410 380 44 or mobile +356 9936 7352 [email protected]