structural analysis of cleavage at sandy hollow, mccartney …
TRANSCRIPT

STRUCTURAL ANALYSIS OF CLEAVAGE AT SANDY HOLLOW, MCCARTNEY
MOUNTAIN FOLD-AND-THRUST SALIENT, SOUTHWEST MONTANA
by
Elizabeth Ashley Helmke
A thesis submitted in partial fulfillment of the requirements for the degree
of
Master of Science
in
Earth Sciences
MONTANA STATE UNIVERSITY Bozeman, Montana
November 2008

©COPYRIGHT
by
Elizabeth Ashley Helmke
2008
All Rights Reserved

ii
APPROVAL
of a thesis submitted by
Elizabeth Ashley Helmke
This thesis has been read by each member of the thesis committee and has been found to be satisfactory regarding content, English usage, format, citation, bibliographic style, and consistency, and is ready for submission to the Division of Graduate Education.
Dr. David R. Lageson
Approved for the Department of Earth Science
Dr. Stephan G. Custer
Approved for the Division of Graduate Education
Dr. Carl A. Fox

iii
STATEMENT OF PERMISSION TO USE
In presenting this thesis in partial fulfillment of the requirements for a
master’s degree at Montana State University, I agree that the Library shall make it
available to borrowers under rules of the Library.
If I have indicated my intention to copyright this thesis by including a
copyright notice page, copying is allowable only for scholarly purposes, consistent with
“fair use” as prescribed in the U.S. Copyright Law. Requests for permission for extended
quotation from or reproduction of this thesis in whole or in parts may be granted
only by the copyright holder.
Elizabeth Ashley Helmke November 2008

iv
DEDICATION
This document is dedicated to all who have encouraged my research throughout my geologic education. My advisor, Dr. David Lageson, has nurtured my understanding of the difficult subject of structural geology and has demonstrated patience throughout my degree at Montana State University. My committee members, Dr. James Schmitt and Dr. Colin Shaw, have been extremely influential with my thesis research giving me support academically whenever needed. My undergraduate advisor, Dr. Stephan Harlan, has been particularly influential in my geological career, encouraging me to go to graduate school and giving me advice about a variety of subjects. I thank the Geological Society of America for a graduate research grant, and the MSU Earth Science department for the excellent experience of working as a teaching assistant.
I sincerely thank my family who have guided my motivation and helped me see the forest through the trees. I especially give thanks to: my Grandma “Grammie” Jean who has been most instrumental in keeping me in school through difficult financial and mental times; my twin sister, Rebecca Courtright, who is my life long partner and hero in this crazy but beautiful life, to whom I attribute my strength and persistence; my parents, Sara and Thomas Helmke, who have always encouraged me to do my best and say what I really think instead of what people want to hear.
I also thank my friends at Montana State University. The camaraderie of the graduate students has been a crucial part of my education. I have learned more from conversations from my fellow students than I can account for. There is a long list of people at MSU that have helped facilitate my research: Dr. Michael Gardner for giving me opportunities to be a part of his research; Dr. Mark Skidmore for use of his chemistry lab; Travis Naibert, my field assistant, for keeping me sane in the field by providing brilliant ideas; Scott McLeod for helping me with multiple tasks from chemistry to photography; Scott Montrose for helping me with the chemical dissolution process; Sandy Underwood for showing me my way around the rock crushing equipment; Logan Hansen for attempting to cut thin section billets from my brittle, annoying rock samples; Melody Bergeron for expediting XRD analysis; and to all who have entertained me by coming out to my awesome field site: Justin Tully, Kelsey McNamara, Adriana Fernandez, Jeannette Wolak, and Evan Gearity. Special consideration is given to my close friends who have encouraged me throughout my degree: Bryan Anderson, Scott Warren, Joey Stiegler, Violet Shahriari, Kevin Boxx, and Matt Hogan.
I also extend gratitude to the University of Montana Western in Dillon for the use of their campus facilities during field work and to Marathon Oil Company for providing me the experience of working as an intern in the oil and gas industry.

v
TABLE OF CONTENTS
1. INTRODUCTION .........................................................................................................1 2. BACKGROUND INFORMATION ..............................................................................4
Regional Tectonic Framework .......................................................................................4 Sevier Fold-and-Thrust Belt ....................................................................................4 Sevier and Laramide Overlap Zone .........................................................................7 Montana-Idaho Batholith Province ..........................................................................9 Southwest Montana Cenozoic Tectonism ................................................................9 Local Stratigraphy of the Kootenai Formation ............................................................10 Previous Cleavage Studies ...........................................................................................11 3. GEOLOGY OF THE SANDY HOLLOW FIELD AREA ..........................................15
Sandy Hollow Thrust Fault ..........................................................................................15 Description of Folds .....................................................................................................20 Miscellaneous Features ................................................................................................31
4. CLEAVAGE FUNDEMENTALS ...............................................................................34 Terminology .................................................................................................................34 Process of Cleavage Formation ...................................................................................34
Cleavage Classification and Controls on Development ...............................................36 Classification of Cleavage .....................................................................................36 Lithologic Controls ................................................................................................37 Structural Controls .................................................................................................39
5. METHODS OF ANALYSIS .......................................................................................42
Outcrop Methods .........................................................................................................42 Classification of Morphology ................................................................................42 Classification of Cleavage Intensity ......................................................................42 Collection of Oriented Samples .............................................................................43 Collection of Structural Orientation Measurements ..............................................43
Laboratory Methods .....................................................................................................43 Thin Section Investigation .....................................................................................43 Chemical Dissolution .............................................................................................44 X-Ray Diffraction (XRD) ......................................................................................45

vi
TABLE OF CONTENTS – CONTINUED
Stereographic Analysis ................................................................................................45
Cleavage Data ........................................................................................................46 6. OBSERVATIONS .......................................................................................................47
Cleavage Domain Morphology ....................................................................................47
Mesoscopic Observations ......................................................................................47 Microscopic Observations .....................................................................................47
Cleavage Domain Intensity ..........................................................................................52 Mesoscopic Observations ......................................................................................52 Microscopic Observations .....................................................................................58
Laboratory Analysis .....................................................................................................58 Chemical Dissolution .............................................................................................58 X-Ray Diffraction .................................................................................................58
Structural Analysis .......................................................................................................62 Cleavage .................................................................................................................62 Group 1 ............................................................................................................62 Group 2 ............................................................................................................64 Group 3 ............................................................................................................64
7. DISCUSSION ..............................................................................................................67
Cleavage Domain Characteristics ................................................................................67 Cleavage Domain Morphology ..............................................................................67 Cleavage Domain Intensity ....................................................................................68
Lithologic Controls on Stratigraphic Distribution .......................................................69 Kinematic and Dynamic Interpretations of Cleavage Formation ................................71
Cleavage Population 1 ...........................................................................................71 Cleavage Population 2 ...........................................................................................78
Hydrocarbon Significance ...........................................................................................81 Carbon Dioxide Sequestration Importance ..................................................................82 Suggestions for Future Work .......................................................................................83
8. CONCLUSIONS..........................................................................................................84 REFERENCES CITED ......................................................................................................86 APPENDICIES ..................................................................................................................94
APPENDIX A: Tectonic Timing Information .............................................................95

vii
TABLE OF CONTENTS – CONTINUED
APPENDIX B: Fold Attributes and Bedding Data ......................................................97 APPENDIX C: Dissolution Analysis Data ................................................................111 APPENDIX D: Cleavage Plane Data ........................................................................114

viii
LIST OF FIGURES
Figure Page
1. Tectonic Map of Southwest Montana ................................................................5
2. Deformational Events Time Line for Southwest Montana ................................6
3. Footwall Ramp Diagram ....................................................................................8
4. Stratigraphy of the Kootenai Formation ..........................................................12
5. Geologic Map of the Sandy Hollow Field Area ..............................................16
6. Mechanical Stratigraphy Diagram ...................................................................17
7. Structural Cross-Section Line A - A’...............................................................18
8. Photograph of the Sandy Hollow Thrust Fault ................................................19
9. Equal-area, Lower-Hemisphere Projection of Creasey Gulch Anticline ..............................................................................22
10. Ramsay Classification Fold Train Diagram .....................................................23
11. Equal-area, Lower-Hemisphere Projection
of Ziegler Syncline ...........................................................................................24
12. Equal-area, Lower-Hemisphere Projection of Ziegler Anticline ..........................................................................................25
13. Second-Order Structures in the Sandy
Hollow Thrust Sheet .......................................................................................27
14. Shear-Couple Fold-Pair in the Dinwoody Limestone .........................................................................................................28
15. Equal-area, Lower-Hemisphere Projection
of Sandy Hollow Anticline ..............................................................................29 16. Duplex Structure in the Sandy Hollow Footwall .............................................30

ix
LIST OF FIGURES – CONTINUED
Figure Page
17. Summary of Cleavage Terminology ................................................................35 18. Calcite and Dolomite Solubility Graph............................................................38
19. Summary Diagram of Cleavage Orientation ....................................................40
20. Outcrop Observation of Planar Cleavage Morphology ...................................48
21. Outcrop Observation of Wavy Cleavage Morphology ....................................49
22. Photomicrograph #1 of Cleavage Domain
Morphology......................................................................................................50
23. Photomicrograph #2 of Cleavage Domain Morphology .....................................................................................................51
24. Outcrop Observation of Cleavage Intensity .....................................................53
25. Outcrop Spatial Variability Map of Cleavage
Intensity for Group 1 ........................................................................................54
26. Outcrop Spatial Variability Map of Cleavage Intensity for Groups 2 and 3 ...........................................................................55
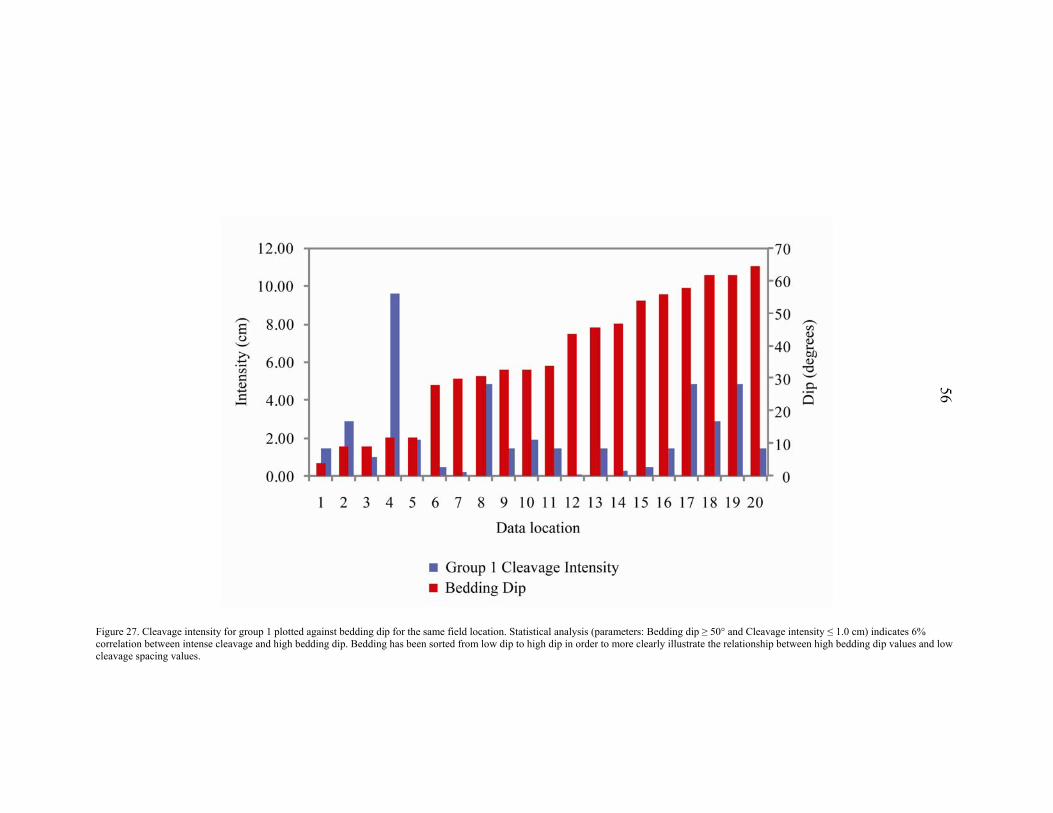
27. Bedding Dip and Cleavage Intensity for
Group 1 Comparison ........................................................................................56
28. Bedding Dip and Cleavage Intensity for for Groups 2 and 3 Comparison .......................................................................57
29. Photomicrograph of Cleavage Domain Intensity .............................................59
30. X-Ray Diffractogram .......................................................................................60
31. Photomicrograph of Fossils .............................................................................61
32. Equal-area, Lower-Hemisphere Projections
of Cleavage- Group 1 .......................................................................................63

x
LIST OF FIGURES – CONTINUED
Figure Page 33. Equal-area, Lower-Hemisphere Projections
of Cleavage- Group 2 .......................................................................................65
34. Equal-area, Lower-Hemisphere Projections of Cleavage – Group 3 .....................................................................................66
35. Outcrop Pictures Showing Cleavage Orientation in Kk2b ..............................70
36. Cleavage-Structure Geometric Relationship Diagram .....................................73
37. Beutner Model of Curved Stress Trajectories ..................................................75
38. Idealized Structural Domains of the McCartney
Mountain Salient Impingement Zone ..............................................................76
39. Hypothetical Stress Trajectories of the McCartney Mountain Salient Impingement Zone ..............................................................77
40. Block Diagram Salient Movement Model .......................................................80

xi
ABSTRACT
The McCartney Mountain salient is a distinct convex-east segment of the Sevier fold-and-thrust belt in southwest Montana, lying east of the Pioneer batholith and west of basement-cored Laramide uplifts. Prominent features of the central part of the salient include the in-sequence Sandy Hollow thrust fault (displacing Permian over Lower Cretaceous strata), and hanging wall and footwall syncline-anticline pairs that display complex intra-formational duplexes and parasitic detachment folds at all scales.
Cleavage occurs in the argillaceous carbonate members of the Cretaceous Kootenai and Triassic Dinwoody formations throughout the area. Cleavage has been systematically mapped and characterized according to morphology, domainal spacing and orientation for all exposed outcrops of a distinctive yellowish dolomitic unit in the lower limestone member of the Kootenai. Cleavage within this unit exhibits planar morphology with domainal spacing at the mm-cm scale, classified as moderate to very strong spaced cleavage.
Structural orientation data divides the cleavage into two populations. S1 is defined by cleavage that trends N-S, dips east, and is inferred to be reoriented axial planar cleavage that may have been modified during late-stage shortening as the frontal fold-and-thrust system impinged against basement uplifts in the foreland. S2 is recognized by E-W striking cleavage that dips within 10o of vertical, cross cutting hanging wall, and footwall folds in the area. S2 is inferred to have formed during the final stages of deformation in the Sandy Hollow fold-and-thrust system. S2 may reflect N-S shortening caused by lateral forces along the salient boundary as the fold-and-thrust system propagated eastward into the salient nose.

1
INTRODUCTION
The McCartney Mountain salient is a small-scale, convex-east segment of the
Sevier fold-and-thrust belt in southwest Montana (Figure 1). The chord of the salient
strikes roughly north with a length of 48 km and a width of 16 km (Brumbaugh and
Dresser, 1976). The Sandy Hollow field area is located in the apex of the salient at the
eastern extent of the frontal fold-and-thrust belt. The field area contains several well
exposed thrust sheets with associated folds, as well as sedimentary units that display
intense cleavage. Previous cleavage studies in fold-and-thrust belts indicate that cleavage
intensity typically decreases towards the foreland, eventually becoming absent in frontal
thrust sheets (Mitra and Yonkee, 1985; Yonkee, 2005). Therefore, the Sandy Hollow
field area provided an opportunity to investigate atypical cleavage development.
Tectonic cleavage is an expression of internal strain accommodated by
sedimentary units within a deformed terrain. Cleavage domains have been shown by
previous studies to form perpendicular to the local finite shortening direction (e.g.
Wanless, 1979; Onasch, 1983). Structural analysis of cleavage domain orientation can be
utilized to yield information regarding the direction of maximum shortening. Cleavage-
structure relationships can also be analyzed to determine the relative timing of cleavage
development. Therefore, sedimentary units that contain several populations of cleavage
record the complex evolution of fold-and-thrust belt deformation.
Physical attributes of cleavage domains, such as morphology and intensity, vary
as a function of rock composition and strain magnitude (e.g. Engelder and Marshak,

2 1985). Spatial variability of cleavage attributes can be used to deduce strain gradients in
relation to local structural geometry, and the effects of lithologic variation.
Cleavage has been identified in a well exposed distinctive yellow dolomitic
limestone unit (Kk2a) in the informal lower limestone member of the Lower Cretaceous
Kootenai Formation within the Sandy Hollow field area. This unit was chosen for the
focus of this study after preliminary field observations indicated that this unit contained
several cleavage populations distinguished by domain orientation. Cleavage within this
unit was characterized according to domain morphology, intensity, and orientation to
address the foremost research problem: Why is tectonic cleavage so well developed in
frontal fold-and-thrust sheets of the McCartney Mountain salient? This research question
can be broken down into several more specific questions, from a mesoscopic to
macroscopic scale:
1) Does proximity to local structures influence cleavage domain
morphology, and/or intensity?
2) Does lithologic variability control cleavage development, and/or
cleavage attributes?
3) What are the structural relationships between cleavage, and local fold-
and-thrust belt structures?
4) What is the relative timing of cleavage formation with respect to local
fold-and-thrust belt structures?
5) What are the viable tectonic mechanisms responsible for cleavage
development?

3 Field mapping, laboratory analyses, and stereographic techniques were combined
to investigate each of the defined research questions. The results of this research led to
the recognition of several cleavage-structure relationships that were utilized to propose
models for the kinematic evolution of cleavage development. These models were in-turn
used to explore several hypotheses that describe the possible tectonic mechanisms
responsible for the development of the various cleavage populations within Kk2a.

4
BACKGROUND INFORMATION
Regional Tectonic Framework
The McCartney Mountain salient delineates the eastern front of the fold-and-
thrust belt in southwest Montana, and lies within the temporal and spatial overlap zone of
contractile and extensional structures north of the Eastern Snake River Plain (e.g. Kulik
and Schmidt, 1988; Schmidt et al., 1988; Perry et al., 1989) (Figure 1). The overlap zone
includes structures associated with the Cretaceous to Eocene Sevier orogenic belt, the late
Cretaceous to Eocene Laramide foreland province, the late Cretaceous to early Paleogene
Montana-Idaho batholith province, and several phases of Cenozoic extension (Figure 2)
(Appendix A).
Sevier Fold-and-Thrust Belt
The Sevier fold-and-thrust belt is part of the Cordilleran orogenic belt that extends
the length of the North American continent from Alaska to southern Mexico. Subduction
of the Farallon and Kula plates along the western margin of North America from Late
Jurassic to early Paleogene led to the deformation of Proterozoic and Phanerozoic
miogeoclinal strata, and formation of a retroarc foreland basin (Dickinson, 2004;
DeCelles, 2004). The Sevier fold-and-thrust belt is characterized by west dipping stacked
imbricated thrust sheets that translated as a deforming sedimentary wedge eastward

5
Figure 1. Tectonic framework map illustrating the interaction between several styles of deformation including the Idaho-Montana Batholith province, Laramide foreland uplift province, Sevier fold-thrust belt, metamorphic core complexes, and the limit of the Snake River Plain & Yellowstone caldera. AMCC = Anaconda metamorphic core complex, BB = Boulder Batholith, BMCC = Bitterroot metamorphic core complex, BTP = Beartooth Plateau, BTM = Blacktail Mountains, HMU = Highland Mountain Uplift, IBB = Idaho-Bitterroot Batholith, MMP = McCartney Mountain Pluton, MMS = McCartney Mountain Salient, PB = Pioneer Batholith, RMU = Ruby Mountain Uplift, SCU = Snowcrest Uplift, SWMTZ = Southwest Montana Transverse Zone, SWMR = Southwestern Montana Recess, TRB = Tobacco Root Batholith, TRU = Tobacco Root Uplift and YSC = Yellowstone caldera. The inset map shows the regional Sevier fold-and-thrust belt limit illustrating large scale recesses and salients. This figure was constructed from multiple figures from the following sources: Kulik and Schmidt, 1988, Schmidt et al., 1988, O’Neill et al., 1990, O’Neill et al., 2004, DeCelles, 2004, Dickinson, 2004. GIS data source: Stoeser et al., 2005.
5

6
Figure 2. Summary diagram of overlapping tectonic events that have affected southwest Montana including Sevier fold-and-thrust belt, Laramide foreland uplifts, Idaho-Montana Batholith province and several phases of extension. Abbreviations BMB and MCC stand for Block Mountain Basalt and metamorphic core complex, respectively. Literature sources for approximate dates are outlined in Appendix A.

7 towards the North American craton or foreland (Armstrong, 1968). Propagation of the
fold-and-thrust belt did not occur in southwest Montana until Late Cretaceous time,
(Campanian) and is constrained by growth strata, radiometric dating of igneous deposits,
and cross-cutting field relationships (Kalakay, 2001). Total shortening estimates for the
southwest Montana region are at least 75 - 50 km (Skipp, 1988).
Sevier and Laramide Overlap Zone
Southwest Montana is characterized by the interaction of classic Sevier thin-
skinned structures, and basement-cored Laramide uplifts, within a spatial overlap of 100-
150 km, and temporal overlap from the Late Cretaceous to early Eocene (Kulik and
Schmidt, 1988) (Figure 2). Frontal fold-and-thrust systems in southwest Montana have
been noted by previous workers to impinge against basement-cored structures of the
foreland (e.g. Ruppel and Lopez, 1984; Kulik and Schmidt, 1988; Schmidt et al., 1988).
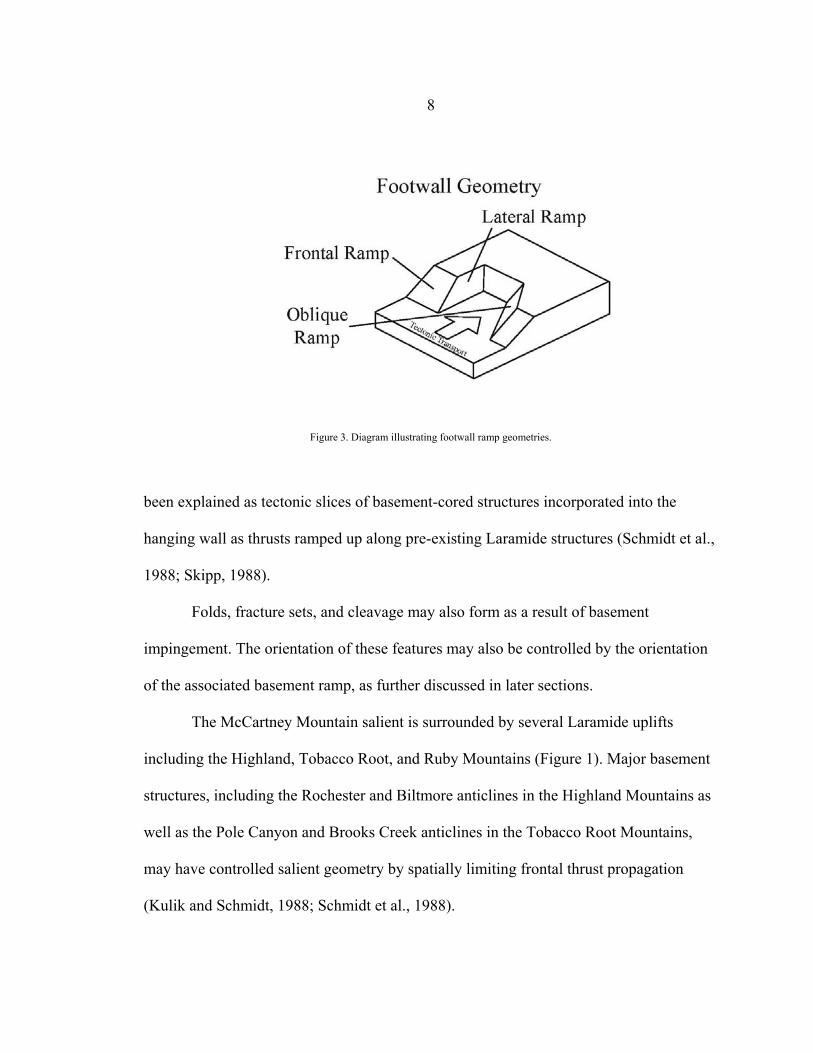
Uplifted basement blocks act as structural ramps, and can be termed frontal, lateral, or
oblique according to the relative orientation of the ramp to the tectonic transport (Kulik
and Schmidt, 1988) (Figure 3). Thin-skinned thrust faults are forced to ramp up-section
as their basal décollement encounters high-angle faults within crystalline basement rocks
(Kulik and Schmidt, 1988). Consequently, thin-skinned thrust sheets share common
geometries with the basement structure in the footwall (Schmidt et al., 1988).
Additionally, Archean metamorphic rocks have been observed in the hanging wall of
several leading edge thrusts in the Tobacco Root and Highland Mountains (Schmidt et
al., 1988). The occurrence of Archean rocks in the hanging wall of frontal thrusts has
8
Figure 3. Diagram illustrating footwall ramp geometries.
been explained as tectonic slices of basement-cored structures incorporated into the
hanging wall as thrusts ramped up along pre-existing Laramide structures (Schmidt et al.,
1988; Skipp, 1988).
Folds, fracture sets, and cleavage may also form as a result of basement
impingement. The orientation of these features may also be controlled by the orientation
of the associated basement ramp, as further discussed in later sections.
The McCartney Mountain salient is surrounded by several Laramide uplifts
including the Highland, Tobacco Root, and Ruby Mountains (Figure 1). Major basement
structures, including the Rochester and Biltmore anticlines in the Highland Mountains as
well as the Pole Canyon and Brooks Creek anticlines in the Tobacco Root Mountains,
may have controlled salient geometry by spatially limiting frontal thrust propagation
(Kulik and Schmidt, 1988; Schmidt et al., 1988).

9 Montana-Idaho Batholith Province
Many Late Cretaceous (80-70 Ma) plutonic bodies occupy eastern Idaho and
western Montana including the Boulder, Idaho, Tobacco Root, and Pioneer batholiths as
part of the Montana-Idaho Batholith Province (Figure 1). The Pioneer Batholith is located
west of the Sandy Hollow field area, and occupies a central position within the
McCartney Mountain salient. The Pioneer Batholith was emplaced from 83-65 Ma as
determined by K-Ar dating techniques (Snee, 1982) (Figure 2).
Southwest Montana Cenozoic Tectonism
Several phases of over-printing extension have been documented throughout the
region, and have been linked to several processes, including: 1) gravitational collapse of
the Sevier and Laramide orogenic belts; 2) upper crustal extension related to Basin and
Range processes; and 3) extension related to Eastern Snake River plain magmatism (e.g.
Thomas et al., 1995; Janecke et al., 2001).
Gravitational collapse of the Sevier and Laramide orogenic belts started in middle
Eocene, and continued into the early middle Miocene (Constenius, 1996; Janecke et al.,
2001). Convergence along the western margin of the North American continent was
greatly reduced around 50 Ma thus diminishing the west to east compressional stress in
the Cordilleran orogenic belts (Constenius, 1996). The development of metamorphic core
complexes has also been shown to correspond with the collapse of structural and
magmatic culminations within the fold-and-thrust belt (Constenius, 1996; Janecke et al.,
2001; O’Neill et al., 2004). The Anaconda and Bitterroot core complexes of Montana and

10 Idaho are thought to have developed coevally in middle Eocene time (O’Neill et al.,
2004) (Figure 1).
Eocene crustal extension was accompanied by the emplacement of regional
magmatic belts such as the Challis-Lowland Creek and Absaroka volcanic provinces of
northwestern United States (Chadwick, 1981; Feeley, 2003). These provinces are
characterized by compositionally diverse suites of plutonic and volcanic rocks
(Chadwick, 1981; Feeley, 2003).
Basin and Range processes (17 Ma to present) have affected southwest Montana
by producing northeast trending grabens that preserved syn-extensional deposits,
including arkosic sandstones, fluvial sandstones and gravels, debris flow deposits,
tephras, and volcanic flows (Thomas et al., 1995; Janecke et al., 2001). Crustal
adjustments caused by the Eastern Snake River plain have also been shown to have
produced extensional faults in southwest Montana starting sometime after 6 Ma (Fritz
and Sears, 1993; Thomas, et al., 1995).
Local Stratigraphy of the Kootenai Formation
In southwest Montana the Aptian Kootenai Formation overlies the Kimmeridgian
Morrison Formation, representing a regional unconformity that is locally angular
(DeCelles, 1986; Schwartz and DeCelles, 1988). The Kootenai is overlain by the Albian
Blackleaf Formation with a gradational contact (DeCelles, 1986). The Kootenai

11 Formation is correlative with the Gannet Group of the Wyoming-Idaho-Utah thrust belt
(Zaleha, 2006). The Kootenai Formation is characterized by diverse non-marine strata
that can be subdivided into distinct lithologic informal members and units (Figure 4).
This study divides the Kootenai into four informal members: Kk1, from the distinctive,
basal chert pebble conglomerate to the top of a red to green, claystone and mudstone unit;
Kk2, from the base of a recessive, silty, orange, lacustrine dolomite to the top of a dark
gray, massive, lacustrine, fossiliferous limestone; Kk3, a thick section of red to green,
claystone and mudstone with isolated sandstone lens; Kk4, from the top of the fine-
grained member to the top of a distinctive gray, lacustrine gastropod limestone (DeCelles,
1986; Schwartz and DeCelles, 1988). This study investigated tectonic cleavage in a
yellowish micritic dolomitic lacustrine limestone unit within the second informal member
of the Kootenai, referred to here as Kk2a (Figure 4).
Previous Cleavage Studies
Deformed sedimentary units in the Appalachian fold-and-thrust belt have been the
subject of many early cleavage development studies. These studies focused on cleavage-
structure relationships, factors that control cleavage development, and deformational
processes responsible for cleavage formation (Wanless, 1979; Gray, 1981; Onasch, 1983;
Engelder and Marshak, 1985; Marshak and Engelder, 1985; Mitra, 1988).
Cleavage development has also been recognized in many sedimentary units
throughout the Cordilleran orogenic belt. Well studied examples include cleavages that

12
Figure 4. Stratigraphy and nomenclature of the Lower Cretaceous Kootenai Formation. This study divides the Kootenai into four informal members and further divides the Lower Limestone member into three informal units. The focus of this study was to investigate cleavage in Kk2a, a dolomitic limestone unit. Stratigraphic columns were modified from: Schwartz and DeCelles, (1988); Kiorpes, (1990).
12

13 developed in Mississippian limestone units such as the Banff Formation in the Front
Ranges of the Canadian Rocky Mountains, and the Madison Group in the U.S. Sevier
orogen (e.g. Spang et al., 1979; Geiger, 1980). Additionally, the Jurassic Twin Creek
Limestone, exposed in the Wyoming-Idaho-Utah thrust belt, contains several populations
of cleavage that record the complex evolution of thrust sheet emplacement (Yonkee,
1983; Mitra and Yonkee, 1985; Coogan and Royse, 1990). Valuable information
regarding the physical conditions of cleavage development, process of cleavage
refraction, and cleavage-structure relationships have been gained by these studies.
In southwest Montana, Geiger (1980) documented several generations of cleavage
development that demonstrate strain partitioning across the McCartney Mountain salient.
Her conclusions indicate that strain increased to the north due to impingement of the
thrust belt against a basement-cored foreland structure, the Rochester anticline. Elevated
temperatures, due to the emplacement of the Pioneer batholith, facilitated ductile
deformation and allowed late-stage cleavage development in several units, including the
Mississippian Madison limestone (Geiger, 1980).
Kiorpes (1990) investigated the process of cleavage development as a strain
mechanism that can cause significant volume loss, and lead to unbalanced cross-sections.
He analyzed a well exposed outcrop of the lower limestone member of the Kootenai
Formation (Kk2) in the Sandy Hollow field area. Analysis of the intensely cleaved upper
argillaceous limestone units indicated that total volume loss by pressure solution process
was up to 15%. Cleavage was not recognized in the lower dolomitic unit at this location.

14 However, his findings indicated that the restore bed length of the dolomitic unit was
shortened by about 13%, similar to other analyzed units, possibly by stress induced
dolomitization. He states that future work would be necessary to properly address strain
accommodation in the lower dolomitic unit of the lower limestone member of the
Kootenai.

15
GEOLOGY OF THE SANDY HOLLOW FIELD AREA
The Sandy Hollow field area contains well exposed examples of thin-skinned, in-
sequence thrust faults with associated syncline-anticline pairs that display complex intra-
formational duplexes and parasitic folds. The prominent thrust faults in the field area are
the Sandy Hollow and Hogback thrusts (Figure 5).
Sandy Hollow Thrust Fault
The restored Sandy Hollow thrust sheet contains about 1,150 meters of
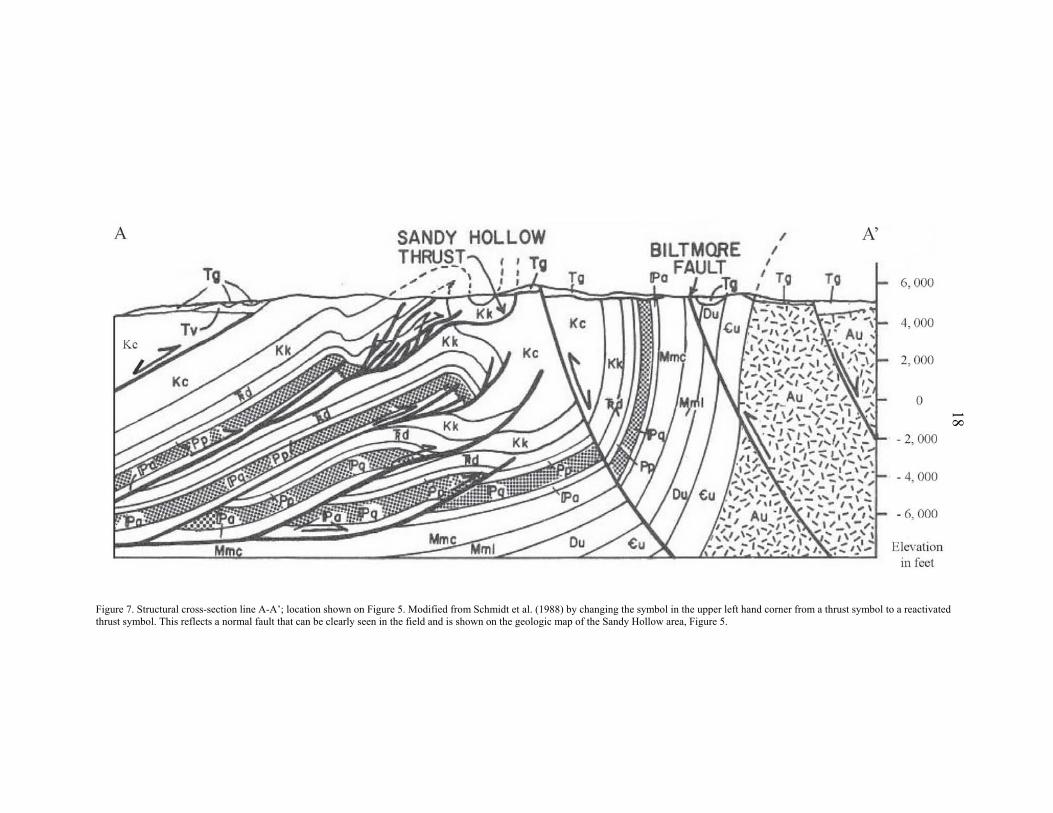
Mississippian through Cretaceous strata (Figure 6). The Sandy Hollow thrust has a stair-
step geometry with the regional décollement in the shaley Mississippian-Pennsylvanian
Amsden Formation (Figures 7 and 8). Ramps are located in the Pennsylvanian Quadrant
Sandstone, the upper Dinwoody Formation, and the lower Cretaceous Kootenai
Formation (Figure 7). Flats tend to be located in the thinly bedded limestones of the
Permian Phosphoria, and lower shaley unit of the Dinwoody Formations. The Sandy
Hollow thrust sheet is dissected by several imbricate thrusts that initiate along a flat
within the Dinwoody shale. Duplex horse structures displace the basal chert pebble
conglomerate of the Kootenai along upper ramps.
The Sandy Hollow thrust strikes roughly north-to-northeast. The trace of the
thrust abruptly changes for about 800 meters to strike east-to-southeast with a steep

16
Figure 5. Detailed geologic map of the Sandy Hollow field area showing the major structures: Sandy Hollow thrust, Hogback thrust and associated hanging wall and footwall folds. BJS = Buffalo Jump syncline, CDS = Coal Draw syncline, CGA = Creasey Gulch anticline, SHA = Sandy Hollow anticline, ZA = Ziegler anticline and ZS = Ziegler syncline. Tertiary basin fill (Tbf) represents undifferentiated Cenozoic deposits. Tertiary volcanic deposits (Tv) represent Eocene Block Mountain basalt. Diagonal pattern represents the informal middle limestone member of the Cretaceous Kootenai Formation, including the analyzed unit, Kk2a. Dashed fault traces and fold axes indicate inferred data. Arrows on transverse faults indicate relative movement. A-A’ cross-section line is presented in Figure 7. Note the cross-section line continues to the north east for about 0.5 km. This map is the result of GIS compilation of maps from Brandon (1984) and unpublished field maps by the author.

17
Figure 6. Mechanical stratigraphy diagram summarizing deformation style for lithographic units involved in thrusting at the Sandy Hollow field area. The Jurassic Morrison Formation is shown as a thin shaley unit as part of the upper Dinwoody. Note that this study investigated cleavage in the lower dolomitic unit in Kk2a. Stratigraphic column was modified from Brandon (1984).
16
Figure 7. Structural cross-section line A-A’; location shown on Figure 5. Modified from Schmidt et al. (1988) by changing the symbol in the upper left hand corner from a thrust symbol to a reactivated thrust symbol. This reflects a normal fault that can be clearly seen in the field and is shown on the geologic map of the Sandy Hollow area, Figure 5.
18

19
Figure 8. Photograph of the Sandy Hollow thrust displacing the Permian Phosphoria Formation over the Lower Cretaceous Kootenai Formation. Photograph is looking roughly north along Burma Road. Photograph illustrates several thrust geometries including: steep west dip of the Sandy Hollow thrust, fault-bend folds, and the stair-step geometry of the thrust surface. Note: all photographs have been taken by the author unless otherwise noted.

20 north- to-northeast dip (Figure 5). The trace of the thrust again turns to continue roughly
northward, but is obscured by Eocene Block Mountain basalt, and younger surficial
deposits (Figure 5). Previous workers interpreted this along-strike variation as a result of
impingement of the Sandy Hollow thrust against a pre-existing footwall anticline (Sandy
Hollow anticline), causing a “collision structure” (Brumbaugh and Dresser, 1976;
Hendrix and Porter, 1980). More recent detailed mapping and structural analysis of the
Sandy Hollow thrust indicate that: 1) the change in strike is characteristic of a folded
thrust associated with the in-sequence development of the Hogback thrust, 2) the Sandy
Hollow anticline is a hanging wall feature of the Hogback thrust, and 3) the “collision
structure” is a footwall duplex structure that developed in a ramp area to facilitate the
transfer of slip towards the foreland (Brandon, 1984; Schmidt et al., 1988).
Description of Folds
The Sandy Hollow thrust sheet displays several first-order folds including, from
west to east, Creasey Gulch anticline, Ziegler syncline, and Ziegler anticline (Figure 5).
Folds located in the hanging wall of the Sandy Hollow thrust have experienced co-axial
refolding by in-sequence development of the Hogback thrust and, consequently, are all
slightly asymmetric (Appendix B) (Fleuty, 1964; William and Chapman, 1983).
The Creasey Gulch anticline is a disharmonic, upright, asymmetric, tight
cylindrical fold that plunges slightly to the south and trends 194° (Figure 9). The shape of
the anticline exhibits an equant, sub-rounded form (Appendix B) (Fleuty, 1964; William

21 and Chapman, 1983). The Creasey Gulch anticline displays parallel folds in competent
limestone units, and more similar behavior in less competent shaley units along the hinge
zone (Ramsay, 1962) (Figure 10) (Appendix B). This fold is interpreted to be a fault-bend
anticline related to a ramp of the Sandy Hollow thrust within the Quadrant Formation
(Figure 7).
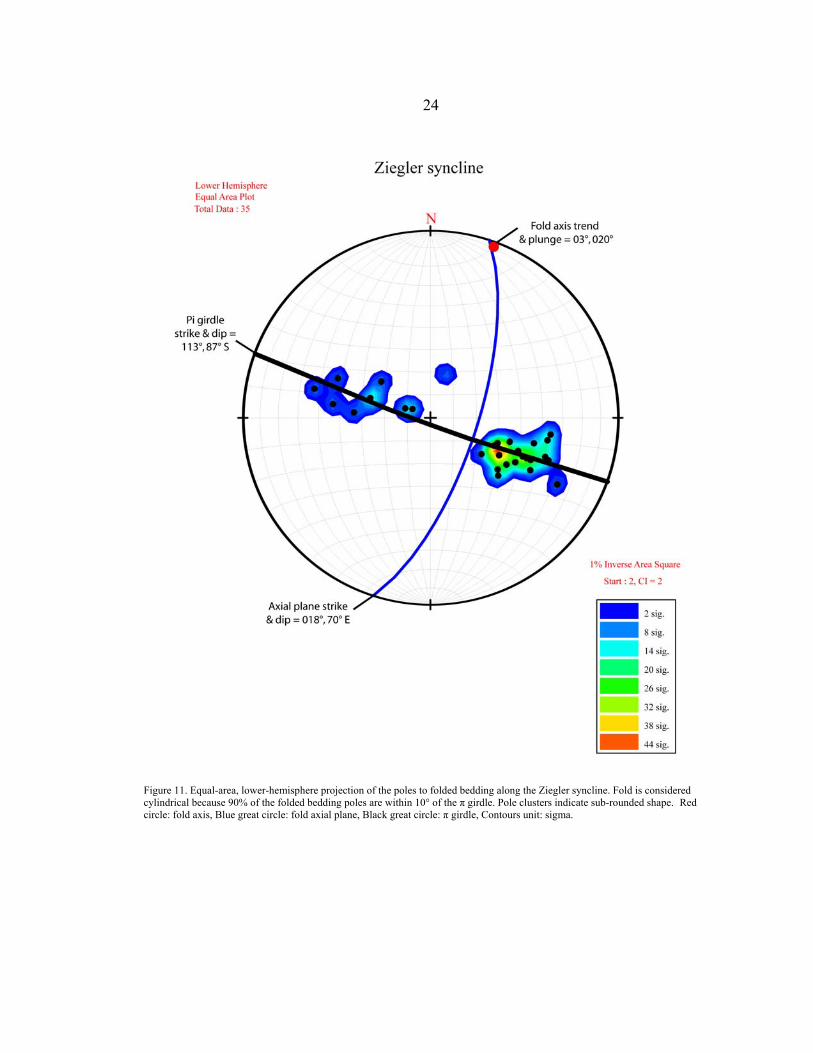
The Ziegler syncline is a disharmonic, steeply inclined, asymmetric, tight,
cylindrical fold that plunges 03° to the north and trends 020° (Figure 11). The shape of
the anticline is described as an elongate, sub-angular to parabolic fold (Appendix B)
(Fleuty, 1964; William and Chapman, 1983). The fold ranges from class 1C to class 3 to
class 2 within the incompetent upper shaley unit of Kootenai Formation in the hinge zone
of the structure, while approaching parallel style along the limbs (Ramsay, 1962) (Figure
10) (Appendix B). This fold is also interpreted to be a fault-bend fold that developed as a
result of down-flexing of the thrust package as the thrust propagated through a flat
located within the Phosphoria Formation (Figure 7).
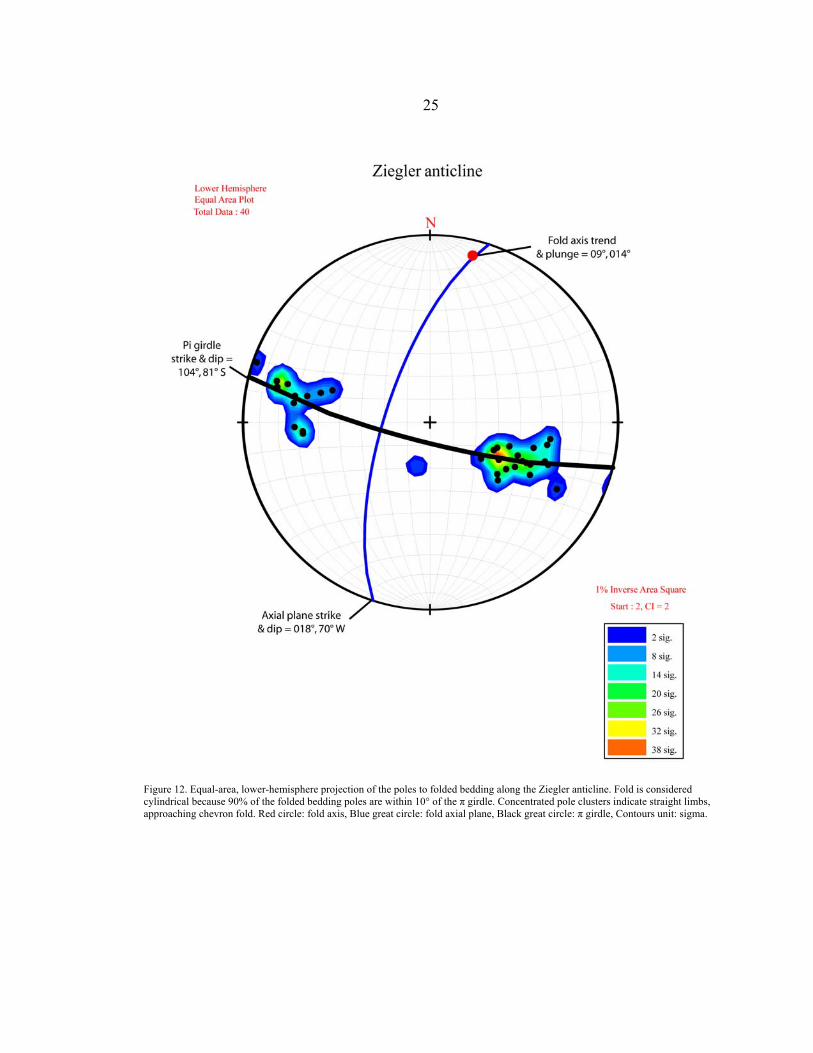
The Ziegler anticline is a disharmonic, steeply inclined, asymmetric, tight,
cylindrical fold that plunges 09° north and trends 014° (Figure 12). The fold has an
equant, sub-rounded form that approaches a chevron fold (Appendix B) (Fleuty, 1964;
William and Chapman, 1983). The anticline displays similar behavior in the thickened
hinge zone within incompetent units, and a parallel style along the limbs of all deformed
units (Ramsay, 1962) (Figure 10) (Appendix B). The Ziegler anticline developed as a
fault-bend fold as the Sandy Hollow thrust ramped up-section through the competent
limestone unit of the Dinwoody Formation (Figure 6) (Schmidt et al., 1988).

22
Figure 9. Equal-area, lower-hemisphere projection of the poles to folded bedding along the Creasey Gulch anticline. Fold is considered cylindrical because 90% of the folded bedding poles are within 10° of the π girdle. Diffuse pole clusters indicate rounded, parabolic shape. Red circle: fold axis, Blue great circle: fold axial plane, Black great circle: π girdle, Contour unit: sigma.

23
Figure 10. Fold train diagram illustrating fold style based on the Ramsay classification (1962). Hinge zones are commonly classified as class 2 similar style while most limbs approach class 1B parallel style. Note that the middle limestone member of the Kootenai Formation (Kk2) is consistently classified as 1B indicating that this bed behaved competently and maintained constant bed thickness.
24
Figure 11. Equal-area, lower-hemisphere projection of the poles to folded bedding along the Ziegler syncline. Fold is considered cylindrical because 90% of the folded bedding poles are within 10° of the π girdle. Pole clusters indicate sub-rounded shape. Red circle: fold axis, Blue great circle: fold axial plane, Black great circle: π girdle, Contours unit: sigma.
25
Figure 12. Equal-area, lower-hemisphere projection of the poles to folded bedding along the Ziegler anticline. Fold is considered cylindrical because 90% of the folded bedding poles are within 10° of the π girdle. Concentrated pole clusters indicate straight limbs, approaching chevron fold. Red circle: fold axis, Blue great circle: fold axial plane, Black great circle: π girdle, Contours unit: sigma.

26 This fold is dissected by many intraformational imbricate thrust faults that initiated along
a flat within the Phosphoria Formation, some of which may exist as blind thrusts.
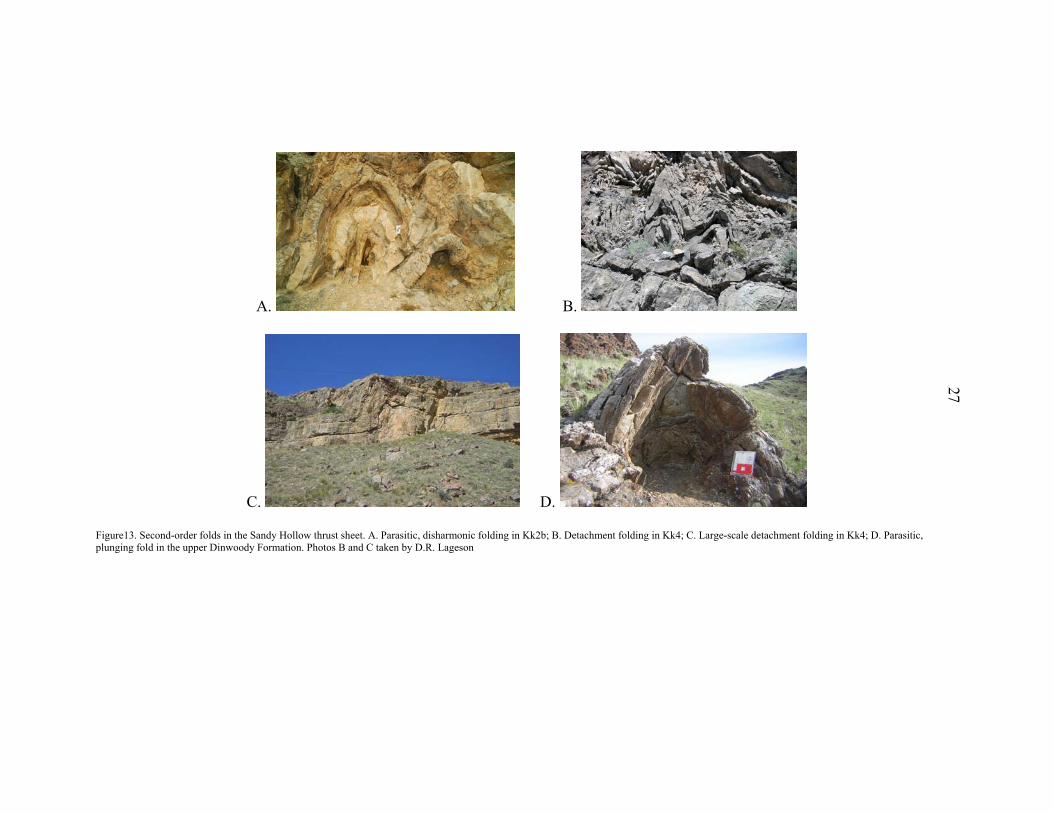
Small-scale parasitic detachment folds are also present in the Sandy Hollow thrust
sheet that detach within the shale units above and below limestone units of the Dinwoody
and Kootenai formations (Figure 13). The hinge zone of the Ziegler anticline contains a
well developed shear-couple fold-pair within the Dinwoody limestone indicating flexural
slip along the limbs of the anticline (Figure 14).
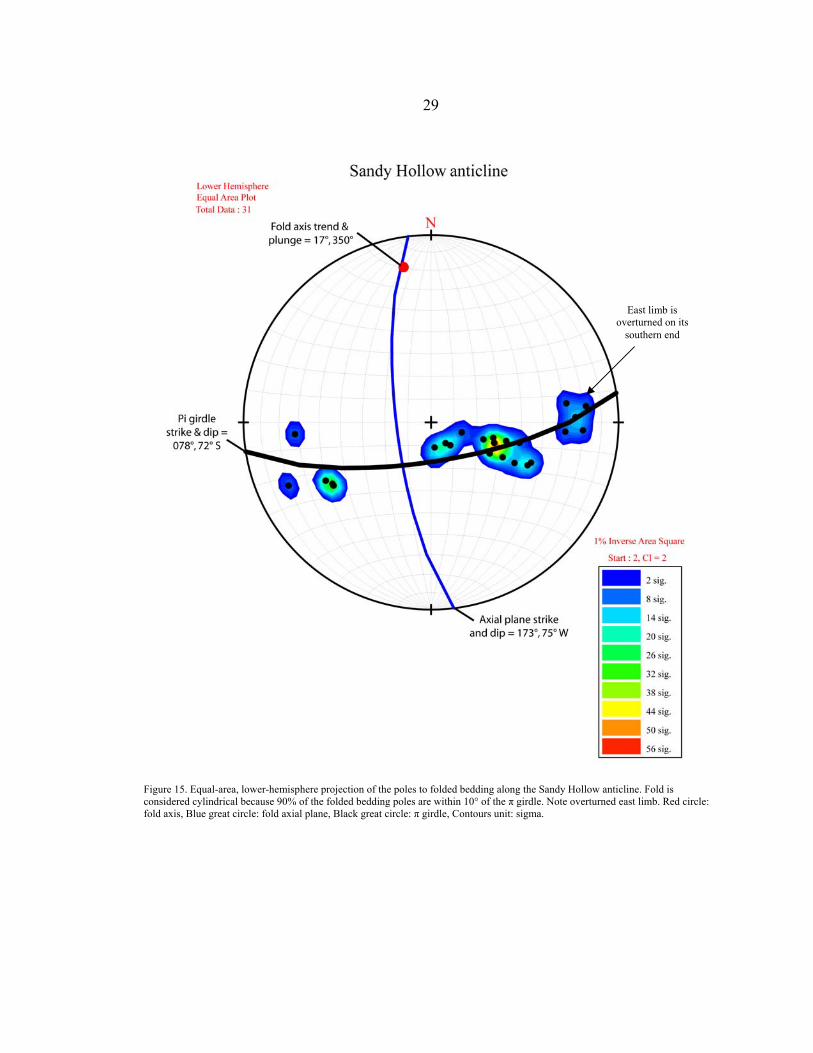
The footwall of the Sandy Hollow thrust or, alternatively, the hanging wall of the
in-sequence Hogback thrust, is dominated by the Sandy Hollow anticline (Figure 5). The
anticline is a disharmonic, steeply inclined, east-verging, closed, cylindrical fold that
plunges 17° to the north and trends 350° (Figure 15). The shape is characterized as
equant, sub-angular to parabolic (Appendix B) (Fleuty, 1964; William and Chapman,
1983). The Sandy Hollow anticline exhibits similar folding within the Dinwoody and
lower unit of the Kootenai formations along the hinge zone. Parallel folding dominates
the limbs as well as the entire folded middle limestone unit of the Kootenai (Ramsay,
1963) (Figure 10) (Appendix B). This structure is a fault-bend fold that developed as the
Hogback thrust ramped through the Quadrant Formation, and has probably also
experienced minor refolding as the next in-sequence thrust propagated into the foreland
(Figure 7) (Schmidt et al., 1988).
A footwall duplex structure, in close proximity to the along-strike variation of the
Sandy Hollow thrust, strongly deforms the upper gastropod limestone unit of the
Kootenai (Figure 16). Various disharmonic parasitic detachment folds, and small-scale
27
A. B.
C. D.
Figure13. Second-order folds in the Sandy Hollow thrust sheet. A. Parasitic, disharmonic folding in Kk2b; B. Detachment folding in Kk4; C. Large-scale detachment folding in Kk4; D. Parasitic, plunging fold in the upper Dinwoody Formation. Photos B and C taken by D.R. Lageson
27

26
Figure 14. Shear-couple fold-pair in the upper Dinwoody Formation along the limbs of the Ziegler anticline. Photograph is looking north, northeast. Note field vehicle for scale.
28
29
Figure 15. Equal-area, lower-hemisphere projection of the poles to folded bedding along the Sandy Hollow anticline. Fold is considered cylindrical because 90% of the folded bedding poles are within 10° of the π girdle. Note overturned east limb. Red circle: fold axis, Blue great circle: fold axial plane, Black great circle: π girdle, Contours unit: sigma.
East limb is overturned on its
southern end

30
Figure 16. Duplex structure in the Sandy Hollow footwall localized within Kk4. A. Interpreted cross-section showing intraformational thrusts, small scale detachment folds and the over riding Sandy Hollow thrust (Hendrix and Porter, 1980). B. Annotated photograph of roughly the middle portion of the outcrop; taken by Scott McLeod.

31 intraformational thrusts formed to accommodate foreland directed slip along the ramped
surface of the overlying Sandy Hollow thrust. The interbedded fine-grained layers of Kk4
act as local detachment surfaces, allowing the fold to increase in amplitude and transfer
slip eastward.
Miscellaneous Features
The McCartney Mountain intrusive body is located within the Sandy Hollow field
area, and contains granodiorite and quartz monzodiorite plutons (Figure 1). It is
interpreted to be a series of tongue-shaped sills genetically linked to the Pioneer Batholith
that were emplaced along a footwall ramp-hanging wall flat between the Anglers thrust to
the west, and Sandy Hollow thrust to the east (Gunckel, 1990; Kalakay, 2001). Cooling
indicators for the McCartney pluton indicate a K/Ar biotite date of 74 ±1 Ma
(Brumbaugh and Hendrix, 1981). Also, many smaller sills have intruded fine-grained
units throughout the field area including the Vaughn and middle Flood members of the
Blackleaf, lower and upper mudstones of the Kootenai, and lower Dinwoody Formation
(Figure 5).
Several strike-slip faults offset intrusive bodies as well as folded sedimentary
units in the Sandy Hollow field area (Figure 5). In the northern part of the field area,
movement is sinistral, whereas to the south movement is dextral. These faults could have
accommodated shear along the boundaries of the salient as the fold-and-thrust belt
propagated into the salient ‘nose’ becoming progressively laterally limited.

32
Two normal faults are located in the Sandy Hollow field area, both of which are
interpreted to be reactivated reverse/thrust faults. The eastern normal fault is most likely a
fault splay related to the reactivated Biltmore reverse fault (Figure 7). Archean crystalline
rocks, and lower Paleozoic sedimentary units, exposed 4 km east of the study area, are
interpreted to have been uplifted by the Biltmore fault system. Reactivation of this fault
splay probably occurred during the gravitational collapse of many northwest trending
reverse faults in the early to middle Miocene (Schmidt et al., 1988).
Along the southern flank of the McCartney Mountain intrusion, a normal fault
displaced Oligocene Renova and Miocene Sixmile Creek Formations against the lower
clastic unit of the Flood member of the Cretaceous Blackleaf Formation. This fault is
interpreted to be a reactivated west-dipping thrust fault with down to the south-southwest
movement (Figures 5 and 7).
Block Mountain, located in the eastern part of the field area, displays well
developed columnar basalt, dated to an age of 44.8 Ma (Chadwick, 1981). The
emplacement of this volcanic body is interpreted to be related to the Challis magmatic
belt, active during a period of major Eocene extension (Christiansen and Yeats, 1992).
The basaltic body was probably emplaced along a fissure, and now represents an
excellent example of topographic inversion (Chadwick, 1981). The basalt covers the
northern portion of the Sandy Hollow thrust as well as much of the Hogback thrust
footwall.

33 Much of the topography surrounding the Sandy Hollow field area is covered by
thick gravel deposits interpreted to be fluvial in origin (Hanneman, 1989). Provenance
data indicate clasts were sourced from the Highland and Pioneer Mountains (Hanneman,
1989). The age of the deposit is poorly constrained by a few late Miocene fossils, and a
3.7 Ma air-fall tuff (Hanneman, 1989).

34
CLEAVAGE FUNDEMENTALS
Terminology
The term cleavage generally refers to the tendency of a rock to break along a
secondary plane of weakness. Different types of cleavage are classified according to: 1)
spacing of weakness planes, and 2) relationship to pre-existing rock layering (Powell,
1979). Cleavage spacing refers to the pervasiveness of weakness planes. Penetrative or
continuous cleavage describes cleavage that is observable at all scales (Figure 17).
Spaced or non-continuous cleavage is recognized by observable portions of uncleaved
rock, called microlithons, separated by cleavage domains (Figure 17). Cleavage that
cross-cuts original rock layering is termed disjunctive, while crenulation cleavage
deforms preexisting layering (Figure 17). The term cleavage in this paper will be used to
describe a secondary, spaced fabric composed of clay-rich domains in sedimentary rocks
that are at high-angles to bedding.
Process of Cleavage Formation
Spaced cleavage forms in sedimentary rocks during low-grade metamorphism (T
< 200° C, P < 5 kb) at shallow crustal depths (< 8 km) (Spang et al., 1979; Mitra and
Yonkee, 1985; Engelder and Marshak, 1985). Pressure solution is considered to be the
major process responsible for spaced cleavage development (e.g. Alvarez et al., 1978;

35
Figure 17. Summary of Cleavage Terminology. A. Types of cleavage based on scale of observation and relationship to bedding; B. Weathered cleavage domain morphology classification; C. Cleavage domain spacing or intensity classification.
36 Onasch, 1983). Pressure solution is a multi-part process: 1) strain concentrated at grain-
to-grain contacts acts to dissolve grain material, 2) dissolved material located in grain-
boundary fluid films diffuses to areas of lower strain, and 3) dissolved material
precipitates in areas of lower strain along grain contacts (Marshak and Engelder, 1985).
The rate of dissolution is controlled by the magnitude of normal stress across a
grain-to-grain contact (Engelder and Marshak, 1985). Pressure solution is dependent on
rock-water interaction and, as a consequence, is largely controlled by: 1) amount of pore
fluid, 2) amount of fluid circulation, and 3) the percentage of clay-quartz matrix
(Engelder and Marshak, 1985; Marshak and Engelder, 1985). Insoluble grains increase
the efficiency of the pressure solution process by attracting fluid films to their
boundaries, thereby establishing paths for the diffusion of dissolved solute (Engelder and
Marshak, 1985). A minimum of 10% clay-quartz matrix is a requirement for the
development of pressure solution induced cleavage (Wanless, 1979).
The term grain in this paper, when referring to grain-boundary dissolution, is a
coherent structural particle. In this study, cleavage is investigated in a micritic dolomitic
limestone. The pressure solution process is therefore dissolving the boundaries of micritic
dolomite crystals.
Cleavage Classification and Controls on Development
Classification of Cleavage
Cleavage classification is based on domainal spacing, and the shape of cleavage
domains. These attributes vary with rock composition and strain magnitude associated

37 with structural geometry. Domainal spacing is the perpendicular distance between
individual cleavage domains. Alvarez et al. (1978) classified cleavage according to
domainal spacing distinguishing between weak (> 5 cm), moderate (1-5 cm), strong (0.5-
1 cm), and very strong (< 0.5 cm) (Figure 16). Wanless (1979) classified domain
morphology by describing the outcrop pattern of weathered cleavage domains. Following
the Wanless classification, Engelder and Marshak (1985) described cleavage domain
morphology as sutured, non-sutured, planar, wavy, or anastomosing (Figure 17). This
classification does not imply information regarding the process of cleavage formation,
and is therefore favored over genetic morphology classifications.
Lithologic Controls
The stratigraphic distribution of cleavage within a deformed terrane is controlled
by lithology. Rock units that contain higher amounts of clay have been observed to
develop cleavage, while pure limestones or sandstones deform by intracrystalline
mechanisms resulting in undulose extinction, deformational bands, and/or twin lamellae
(Engelder and Marshak, 1985). Changes in rock composition within the same lithologic
unit may control the distribution of cleavage if the clay-quartz content varies
considerably. Cleavage is most commonly observed in argillaceous limestones, and to a
lesser degree, impure dolomites and sandstones (e.g. Wanless, 1979).
Calcite, the dominant mineral in limestones, has a higher solubility rate than
dolomite (Figure 18). Since the strain rate for pressure solution is proportional to the
solubility of calcite/dolomite (and to diffusivity), a higher strain rate is needed to develop

38 cleavage in dolomitic rocks than is necessary for cleavage development in limestone
lithologies (Schweitzer and Simpson, 1986; Mitra and Yonkee, 1985).
Figure 18. Calcite and dolomite solubility curves illustrating a lower solubility rate for dolomite as compared to limestone. Modified from Herman (1982).
Cleavage intensity is directly related to the amount of clay in a given lithologic
unit. Units with high clay content (>15%) are more susceptible to cleavage development
and therefore can display closely spaced cleavage domains (Wanless, 1979; Engelder and
Marshak, 1985; Marshak and Engelder, 1985). Domain morphology is also strongly
controlled by rock composition (Wanless, 1979; Engelder and Marshak, 1985). In
general, rock units that contain more than 20% clay material will display planar or non-
sutured domains while units with at least 10% clay content will have sutured or pitted

39 cleavage domains (Wanless, 1979; Engelder and Marshak, 1985). Also, rock units that
contain fossils or chert may display sutured cleavage morphology as the cleavage
domains are deflected by these inhomogeneities.
Structural Controls
Cleavage may vary in intensity and domain morphology within the same rock unit
as a function of strain distribution related to structural position (Alvarez et al., 1978).
Cleavage intensity greatly increases in areas of high strain such as overturned limbs and
along fault zones (the higher the strain, the closer spacing of cleavage domains). Field
observations indicate that cleavages that develop in zones of low strain will exhibit wavy
morphology whereas in areas of high strain they tend to be dominantly planar (Gray,
1981; Marshak, 1983).
Cleavage domains have been shown to form perpendicular to maximum finite
shortening direction (e.g. Wanless, 1979; Onasch, 1983). Structural analysis of cleavage
domain orientation reveals cleavage-structure geometric relationships that are utilized to
deduce the evolution of a deformed terrane. Relative timing of cleavage development is
inferred by cross-cutting relationships between cleavage and structural features.
Three common geometric relationships exist and include: 1) fanning cleavage, 2)
axial planar cleavage, and 3) transect cleavage (Figure 19).

40
Figure 19. Summary diagram of cleavage orientation A. Cleavage-fold relationships; S0 indicates bedding; S1 shows fanning cleavage; S2 shows axial planar cleavage; S3 shows transect cleavage. B. Strain axes; Axial plane of fold in A lies in the XY plane.
Cleavage can form perpendicular to bedding during early layer-parallel shortening
as a precursor to faulting and folding as a result of shear movement between two beds
with contrasting ductility (Ramsay, 1963; Gray, 1981; Marshak and Engelder, 1985).
Cleavage domains are then subsequently rotated during folding, producing a fanning
geometry about the fold axis (e.g. Gray, 1981).
Frequently, cleavage domain orientation is parallel to sub-parallel to local fold
axial surfaces. This geometric relationship implies that previously formed cleavage has

41 been reoriented in response to fold formation to lie within the plane of the fold axis, or
that the initial timing of cleavage development overlapped with the formation of the fold
(Engelder and Marshak, 1985; Marshak and Engelder, 1985). Further evidence of the
latter relationship is the intensification of cleavage in overturned fold limbs or in hinge
zones of tight folds (Mitra and Yonkee, 1985).
Transect cleavage is neither fanning nor axial planar. Transect cleavage can be
developed by various mechanisms. Cleavage may develop during initial flexural-slip
folding followed by progressive fold flattening that passively rotates selective cleavage
planes. This mechanism produces partial cleavage fans. Cleavage may also be reoriented
during backthrusting and/or as younger thrust sheets ramp up-section. Adjustment of the
deforming thrust sheet related to along-strike variations in the regional fold-and-thrust
belt can also cause late-stage cleavage development (Yonkee, 1983; Mitra and Yonkee,
1985; Marshak and Engelder, 1985). Local late-stage folds develop as thrust sheets climb
up-section over foreland footwall ramps (Mitra and Yonkee, 1985; Coogan and Royse,
1990). Cleavage that forms in association with foreland footwall structures often has an
axial planar relationship to second-order late-stage folds, consequently cross-cutting first-
order pre-existing structures (Mitra and Yonkee, 1985; Coogan and Royse, 1990). Lastly,
cleavage that strikes at high angles to fold-and-thrust structures may have formed in
response to a younger, unrelated tectonic event.
42
METHODS OF ANALYSIS
Outcrop Methods
Classification of Morphology
Outcrop observations of cleavage domain morphology in Kk2a were collected
during detailed field mapping of the Sandy Hollow field area. Morphology descriptions
were guided using the morphology classification scheme of Engelder and Marshak
(1985) to determine lithologic and local structural controls that may have affected
cleavage development (Figure 17).
Classification of Cleavage Intensity
Cleavage intensity outcrop measurements were recorded as the perpendicular
distance between individual cleavage domains in centimeters with an accuracy of ± 2
mm. Ten to fifteen measurements were taken and averaged at each outcrop site. The
domainal spacing classification scheme of Alvarez et al. (1978) was used in this study to
characterize cleavage as weak (> 5 cm), moderate (1-5 cm), strong (0.5 – 1 cm), or very
strong (< 0.5 cm) (Figure 17). Intensity measurements were tied to a GIS/GPS database
as a spatial attribute. Maps of intensity variability throughout the field area were
produced from these data. Bedding dip angle and cleavage intensity values from the same
field station were extracted from the GIS database. Bar graphs were produced to compare
these values, and to analyze possible relationships between fold and cleavage
development.

43 Collection of Oriented Samples
Oriented samples were collected using the procedure outlined by Compton (1984,
p. 46). The extraction of oriented samples was not possible at all locations due to poor
exposure and/or because the sample would fall apart before the extraction was complete.
Thirty-three oriented samples were collected from field locations throughout the Sandy
Hollow area to aid in the production of oriented thin sections. Only twelve samples
remained intact from the field to the rock preparation laboratory due to the brittle nature
of Kk2a.
Collection of Structural Orientation Measurements
Orientation of cleavage and bedding planes were measured using a Brunton
compass and recorded in the right-hand rule form. Most outcrops contained more than
one cleavage population, distinguished by average orientation. Several cleavage planes of
similar orientation were measured within the same outcrop, and the mean orientation was
recorded to ensure accuracy was not affected by domain morphology variation.
Laboratory Methods
Thin Section Investigation
Six out of twelve oriented samples survived billet preparation. Therefore, only a
limited microscopic investigation was completed. Thin sections were cut perpendicular to
cleavage domains. Microscopic investigations were conducted on six oriented thin
sections using a petrographic microscope (Nikon Eclipse Lv 100 POL) with a mounted
digital camera. Photomicrographs were taken at magnifications ranging from 20x to

44 200x in plane polarized light with a few taken in cross-polarized light to illustrate the
presence of calcite. Photomicrographs reflect the true orientation of cleavage domains
with the top of the picture representing the top of the slide producing an oriented
photomicrograph.
Microscopic morphologic characteristics of individual domains were documented
by recording the overall cleavage domain shape and perpendicular domain thickness.
Microscopic intensity measurements were recorded by measuring domain spacing in
micrometers (μm) and converted to millimeters (mm).
Chemical Dissolution
Chemical dissolution analysis was performed to determine the percent- by-weight
of insoluble material within samples of Kk2a. Hand samples with representative cleavage
were taken from the Ziegler anticline nose, the west limb of the Creasey Gulch anticline,
and the east limb of the Sandy Hollow anticline (see Appendix C for the rock sample
location map). Unweathered rock samples were crushed using a disk mill. Crushed
samples were sorted to a size of 1.5Φ using a mechanical sieve. Fifteen grams of each
sample were carefully selected to ensure metal contamination from the mill was not
introduced to the sample. The sample particles were then reduced to powder form using a
porcelain mortar and pestle to increase the surface area to effectively accelerate chemical
dissolution. Three powdered samples for each field location were then weighed using an
electronic balance to an accuracy of one ten-thousandth of a gram.

45
The samples were then transferred to a glass microfibre filter (90 mm ø) and
placed inside a porcelain funnel. The funnel was fitted with a rubber stopper to an
Erlenmeyer flask with air suction. Approximately 14 mL of 6 M HCL was used to
dissolve each sample. The reaction was considered complete when the powdered sample
stopped effervescing. The sample was then rinsed with distilled water to drive off any
remaining acid. The sample and filter were then removed, covered, and allowed to dry for
48 hours to ensure all water had evaporated. Finally, the sample was weighed and
calculations were made to determine the percent-by-weight of insoluble materials within
the sample.
X-Ray Diffraction (XRD)
XRD analysis was conducted on a Scintag XGEN 4000 diffractometer, using CuK
α radiation. Four powdered samples (three insoluble residue samples and one undissolved
sample) were put onto side-load random powder mounts and analyzed from 4° to 65° 2θ
with step size of 0.02° and a step scan rate of 0.04° per minute. Mineral identification
was determined using Scintag Inc. DMSNT software by comparing experimental d-
spacing values, and d-spacing values published in the International Centre for Diffraction
Data (ICDD) database.
Stereographic Analysis
Cleavage domain and bedding orientation data were tied to a GIS/GPS database to
preserve the coordinates of each measurement. This also allowed for the production of

46 detailed outcrop maps that illustrate cleavage-bedding relationships. Equal-area, lower-
hemisphere stereonet projections were produced and analyzed using RockWare
StereoStat v. 1.7.4. Manual stereonet methods were also employed to ensure the accuracy
of numeric results produced from the StereoStat software.
Cleavage Data
Several geometric cleavage populations were recognized and grouped according
to average strike and dip. It was therefore assumed that cleavage populations that exhibit
similar geometries formed cogenetically. Analysis was as follows: 1) cleavage poles were
plotted and contoured using a 1% area contouring method with a contour interval of 2
sigma, and a smoothing technique of inverse area square (method of Vollmer, 1995); 2)
cleavage poles were analyzed using the Fisher method (1953) to compute the geometric
mean cleavage pole; and 3) bedding π – girdle and π – point were plotted to represent the
average fold orientation for the Sandy Hollow field area to reveal geometric cleavage-
structure relationships.

47
OBSERVATIONS
Variable cleavage was documented throughout the Sandy Hollow field area
within Kk2a. Three groups of cleavage were recognized based on average planar domain
orientation. However, groups 2 and 3 are collectively analyzed within the intensity
section of this chapter given that the average orientation of these groups only varied
slightly. Groups 2 and 3 will be further joined as one population of cleavage within the
Discussion chapter.
Cleavage Domain Morphology
Mesoscopic Observations
Cleavage that developed within Kk2a exhibited dominantly planar morphology
consistent throughout the Sandy Hollow field area (Figure 20). In some areas, the
cleavage domains seemed to terminate into a wavy or non-sutured pattern towards the top
or bottom of individual beds (Figure 21).
Microscopic Observations
Domain shape in thin section varied from roughly planar to sutured (Figures 22 &
23). In all documented cases, domains that are dominantly planar are also thicker (Figure
22). For example, Figure 22A shows a planar domain with a thickness of 62.5 μm; Figure
22B shows a sutured domain with a domain thickness of only 37.5 μm. Two types of
domain suturing were observed, straight sutures and rounded sutures. Figure 22B
illustrates a straight sutured domain with pitted sections linked by perpendicular domains.

48
Figure 20. Outcrop observation of cleavage domain morphology. A. Kk2a outcrop along the west limb of the Sandy Hollow anticline illustrating planar cleavage morphology and relationship to bedding. B. Gray area indicates range of cleavage morphology classification in the Sandy Hollow field area.

49
Figure 21. Outcrop observation of wavy cleavage morphology. Note the bottom of the picture is the bottom of the bed. The scale north arrow reflects true geographic direction.

50
Figure 22. Microscopic observation of cleavage domain morphology. Both microphotographs were taken in plane polarized light. A. Cleavage morphology is dominantly planar. B. Cleavage morphology is highly sutured and thin. Note that lighter linear features shown in the background of the microphotographs are artifacts from the thin section production process.

51
Figure 23. Microscopic observation of cleavage domain morphology. Cleavage is sutured around calcite grains. A. Microphotograph taken in plane polarized light. B. Microphotograph taken in cross-polarized light.

52 Enveloping surfaces of the domain remain parallel to each other, reflecting development
perpendicular to principal shortening direction. Rounded sutured domains appear to have
been influenced by the presence of large sparry regions within the micritic matrix of the
rock unit. In Figure 23, the cleavage domain is seen to curve around the sparry region
until continuing on a planar path.
Cleavage Domain Intensity
Mesoscopic Observations
Cleavage intensity in Kk2a ranged from > 50 cm to < 1 cm throughout the field
area (Figure 24). Cleavage intensity values varied greatly even within the same outcrop
probably due to the presence of a weathered “film” on outcrop surfaces that inhibited
observations. The majority of intensity measurements, however, taken at the mesoscopic
scale would classify cleavage in Kk2a as strong to moderate spaced cleavage (Alvarez et
al., 1978).
Spatial variability maps were produced for recognized cleavage groups to
illustrate cleavage-structure relationships (Figure 25 and 26). Intensity distribution in
relation to fold hinge zones and proximity to thrust faults did not demonstrate a clear
pattern. If cleavage is related to folding, it would be expected that cleavage intensity
would increase as bedding dip increased. Bedding dip angles as compared to cleavage
intensity also did not yield any clear results (Figures 27 and 28).

53
Figure 24. A. Photograph of mesoscopic observation of domain spacing. B. Gray area indicates dominant cleavage intensity through the Sandy Hollow field area classifying cleavage intensity as moderate to very strong.

54
Figure 25. Spatial variability of cleavage intensity for group 1. Lower values indicate increased distance between individual cleavage domains termed strong cleavage.

55
Figure 26. Spatial variability of cleavage intensity for groups 2 and 3. Lower values indicate increased distance between individual cleavage domains termed strong cleavage.
53
Figure 27. Cleavage intensity for group 1 plotted against bedding dip for the same field location. Statistical analysis (parameters: Bedding dip ≥ 50° and Cleavage intensity ≤ 1.0 cm) indicates 6% correlation between intense cleavage and high bedding dip. Bedding has been sorted from low dip to high dip in order to more clearly illustrate the relationship between high bedding dip values and low cleavage spacing values.
56

54
Figure 28. Cleavage intensity for groups 2 and 3 plotted against bedding dip for the same field location. Statistical analysis (parameters: Bedding dip ≥ 50° and Cleavage intensity ≤ 1.0 cm) indicates 24% correlation between intense cleavage and high bedding dip. This correlation percentage is probably artificially high due to the relatively large number of cleavage intensity values that are classified as strong. Bedding has been sorted from low dip to high dip in order to more clearly illustrate the relationship between high bedding dip values and low cleavage spacing values.
57

58 Microscopic Observations
The maximum domain spacing cannot be distinguished in thin sections due to the
limited field of view. However, at the microscopic scale, minimum intensity values are
more accurately measured than at the mesoscopic scale. Intensity values measured in thin
section fell between 5 – 2 mm, classified as strong spaced to very strong spaced cleavage.
In Figure 29, domains A and B are spaced 4.35 mm apart while B and C are only spaced
1.90 mm apart.
Laboratory Analysis
Chemical Dissolution
Percent of insoluble residue by weight ranged from 28.90% to 32.50% with an
overall mean of 31.02% (Appendix C). The percent by weight calculations did not yield
significant insoluble lithologic variability within Kk2a and, therefore, can be ruled out as
a possible control for intensity variations throughout the field site. However, the results
of this analysis did support the minimum insoluble material content of 10% that Wanless
(1979) outlined as a requirement for cleavage development.
X-Ray Diffraction
The analysis of XRD data for an undissolved, bulk rock (sample ID 001) showed
that the dominate minerals present in Kk2a are dolomite and quartz with small amounts
of calcite and clay (Figure 30). The small amount of calcite probably represents sparry
regions along cleavage domain boundaries, and secondary replacement of fossils as seen
in thin section (Figures 23 and 31). The diffractogram illustrates the efficiency of the

59
Figure 29. Microphotograph documenting cleavage domain spacing. Microphotograph was taken in plane polarized light. Note that lighter linear features shown in the background of the microphotographs are artifacts from the thin section production process.

57
Figure 30. X-Ray diffractogram for an undissolved Kk2a sample (001) and three residue samples (005, 013, 025). Bulk sample results show that Kk2a is mainly composed of dolomite and quartz. Residue samples show the efficiency of the chemical dissolution process with minor amounts of dolomite and a strong signal of quartz and clays. See Appendix C for a location map of rock samples used in this analysis.
60

61
A.
B.
Figure 31. Examples of fossils contained in Kk2a. A. Microphotograph taken in plane polarized light. B. Microphotograph taken in cross-polarized light. Fossils probably represent the majority of calcite found in Kk2a from XRD analysis. Note that lighter linear features shown in the background of the microphotographs are artifacts from the thin section production process.
Fossils
Fossils

62 dissolution process showing a low concentration of dolomite and calcite in the dissolved
samples. The diffractogram also shows 7 Å and 14 Å peaks in the clay region that
represent chlorite (7 Å and 14 Å peaks), smectite (14 Å peaks) and/or kaolinite (7 Å
peaks). These data only identify some combination of chlorite, kaolinite and/or smectite.
Other chemical analyses would have to be performed in order to further identify the clays
in Kk2a.
Structural Analysis
The π-method was used to obtain an average fold axis trend and plunge for all
folded bedding data which produced a value of 08°, 007°. Therefore, fold axis orientation
indicates that folds within the Sandy Hollow field area developed as a result of a
maximum shortening direction of west-east. This information will be used to deduce
cleavage-structure relationships in future sections.
Cleavage
Group 1: Cleavage domains with predominately northeast strike and moderate
southeast dip are recognized as group 1 (n = 18).Group 1 occurred throughout the field
area but was concentrated along limbs of the Creasey Gulch anticline (Figure 32).
Contouring results show a concentration of poles to cleavage planes in the northwest
quadrant with a Fisher axis value of 54°, 300°. Similarly, the Fisher analysis gave an
average cleavage strike and dip of 030°, 36° E.

63
Figure 32. Geometric data for group 1 cleavage. A. Equal-area, lower-hemisphere projection showing contoured poles to cleavage planes with associated Fisher axis indicated by red box. Note contour range is in units of sigma. Best-fit great circle and fold axis shown by gray line and gray box, respectively. B. Outcrop map of Kk2a showing location for plotted orientation data. See Appendix D for complete dataset.
64 Group 2: Group 2 cleavage is recognized by east-west strike and steep north dip
(n = 25). Group 2 occurs only in the hanging wall of the Sandy Hollow thrust (Figure 33).
Cleavage pole contouring illustrates a concentration in the central southern portion of the
stereonet projection with a Fisher axis trend and plunge of 23°, 185°. The average
orientation of cleavage in group 2 expressed as a plane is 275°, 67° N (Figure 33).
Group 3: Cleavage with mainly east-west strike and steep south dip are
recognized as group 3 (n = 71). Group 3 cleavage exist in abundance at every measured
outcrop throughout the Sandy Hollow field area (Figure 34). Contouring results showed
excellent concentration of cleavage poles in the north central section of the stereoplot.
Average orientation of group 3 cleavage planes was calculated to be 090°, 70° S with a
Fisher axis trend and plunge of 20°, 360° (Figure 34).

65
Figure 33. Geometric data for group 2 cleavage. A. Equal-area, lower-hemisphere projection showing contoured poles to cleavage planes with associated Fisher axis indicated by red box. Note contour range is in units of sigma. Best-fit great circle and fold axis shown by gray line and gray box, respectively. B. Outcrop map of Kk2a showing location for plotted orientation data. See Appendix D for complete dataset.

66
Figure 34. Geometric data for group 3 cleavage. A. Equal-area, lower-hemisphere projection showing contoured poles to cleavage planes with associated Fisher axis indicated by red box. Note contour range is in units of sigma. Best-fit great circle and fold axis shown by gray line and gray box, respectively. B. Outcrop map of Kk2a showing location for plotted orientation data. See Appendix D for complete dataset.

67
DISCUSSION
Cleavage Domain Characteristics
Cleavage Domain Morphology
Outcrop observations of cleavage in Kk2a classified domain morphology as
dominantly planar throughout the field area. Planar morphology in Kk2a is interpreted
here to be a result of a generally lithologic homogenous stratigraphic unit accommodating
high magnitude strain caused by tectonic shortening. Outcrop observations of wavy to
non-sutured morphology towards bedding boundaries may reflect termination geometries
of cleavage domains. Wavy to non-sutured geometries are similar to “horse-tailing”, a
term usually used to describe terminating geometries of fractures. “Horse-tailing”
describes a single surface that branches off as several thinner surfaces. “Horse-tailing”
geometries have been citied as evidence for the anti-crack model for cleavage initiation
and development (Fletcher and Pollard, 1981). The anti-crack model proposes a
mechanism in which the tip of each branch is the site of stress concentration that acts to
propagate and displace strain through the rock body (Fletcher and Pollard, 1981).
Microscopic observations of cleavage further indicate sutured domain
morphologies. Regions of sparry calcite apparently acted as a barrier to cleavage
development, and caused domains to curve around the area creating a rounded sutured
domain shape. Straight sutures were also observed, although not as commonly. Lithologic
variation was not observed in regions that exhibited straight sutures. However, given the
68 fine grained nature of Kk2a, the presence of fine grained quartz concentrations acting as
barriers should be considered.
Cleavage Domain Intensity
Previous studies have indicated that cleavage domain intensity is controlled by
lithologic variations and strain magnitude (e.g. Engelder and Marshak, 1985). Kk2a was
found to be relatively compositionally homogenous by the results of sample dissolution
and XRD analysis. Thus, major lithologic variation has been discounted as a possible
control on cleavage intensity within Kk2a.
Cleavage domain intensity varied greatly throughout the field area. Group 1
cleavage is less abundant with moderate to weak intensity. Spatial patterns for this
population illustrate increased intensity along fold limbs and decreased intensity within
hinge zones (Figure 25). Comparison of folded bedding dip values to cleavage intensity
measurements collected at the same location show a weak association (6%) of higher
bedding dips, and more intense cleavage (Figure 27). Groups 2 and 3 are abundant at
nearly every outcrop with 94 % of intensity values classified as moderate to strong.
Proximity to local structures did not seem to influence cleavage intensity for these groups
(Figure 26). Bedding dip compared to intensity measurements for groups 2 and 3 also
indicated a weak to moderate positive relationship (24%) (Figure 28). These spatial and
structural patterns do not indicate a strong connection between fold geometries and
cleavage development.
69
Lithologic Controls on Stratigraphic Distribution
The stratigraphic distribution of cleavage is a function of mechanical stratigraphy.
Dolomite has a lower solubility rate than calcite. A limestone like Kk2a, that has
experienced dolomitization, will not develop cleavage as easy as a silty limestone (Figure
18). The second and third units of the informal limestone member of the Kootenai
Formation are micritic limestones (Kk2b and c) (Figure 4 and 6). Kk2b and Kk2c exhibit
typical cleavage-structure relationships such as fanning and axial planar cleavage in the
hinge zone of the Zeigler syncline (Figure 35). Kk2a exhibits atypical cleavage-structure
relationships with cleavage striking almost perpendicular to large-scale fold axes. The
solubility rate disparity between dolomite and calcite can be used to explain the
variability of cleavage development within the three units of the middle limestone
member. The upper limestone units probably responded to early layer-parallel shortening
with continued cleavage development during fold formation while Kk2a did not form
cleavage until fold formation ceased, or during very late-stage fold flattening. Kk2b and
Kk2c could have been mechanically exhausted if cleavage evolved over an extended
period leading to reduction of pore-fluids and diffusion pathways necessary for the
progressive development of cleavage. This hypothesis may explain why Kk2a exhibits
different cleavage populations than units directly above it. The amount of shortening,
however, experienced by the three limestone units remains unresolved.

70
A.
B.
Figure 35. Outcrop observations of Kk2b in the Ziegler syncline hinge zone. A. Cleavage fans around parasitic fold axis. B. Cleavage is parallel to first-order fold axial planes. Photographs are looking to the north. Both photographs taken by Scott McLeod.

71
Kinematic and Dynamic Interpretations of Cleavage Formation
Relative timing of cleavage development can be inferred from cross-cutting
relationships with other structures within the field area. Cleavage planes form
perpendicular to the maximum direction of shortening and therefore record finite strain
processes operating within the fold-and-thrust system. As previously, mentioned three
geometric cleavage-structure relationships commonly are observed in fold-and-thrust
systems. These relationships can be summarized as follows: 1) cleavage domains that fan
about fold axes form during early layer-parallel shortening, and pre-date fold-thrust
development; 2) cleavage domains that strike parallel or sub-parallel to axial planes of
folds are genetically related to fold formation; and 3) cleavage planes that cross cut first-
order local structures form during the final phases of fold-thrust evolution, or form in
response to an overprinting younger deformational event. Thus, in the next sections, the
average orientation of cleavage populations is utilized to deduce kinematic and dynamic
interpretations.
Cleavage group 1 is considered population 1 and further S1 to distinguish this
group as the oldest observed cleavage in KK2a throughout the Sandy Hollow field area.
Cleavage groups 2 and 3 will be collectively referred to as population 2 and were
grouped as such due to the similarity of domain orientations. Population 2 will also be
termed S2 to reflect the youngest observed generation of cleavage.

72 Cleavage Population 1
Cleavage domains recognized in population 1 have an average orientation of
030°, 36° E and are located in the footwall and hanging wall of the Sandy Hollow thrust.
The strike of cleavage within this population is sub-parallel to the average trend of local
first-order fold axes. However, S1 cleavage planes dip to the southeast at high angles to
fold axial planes (Figure 36). Therefore, S1 cleavage can not be considered to be axial
planar.
The presence of S1 cleavage in both the hanging wall and footwall implies a late-
stage formation during final deformation of the fold-thrust system. This relationship
implies that cleavage developed during a similar finite shortening direction as the fold-
and-thrust belt but may record late-stage adjustments of the system, perhaps related to
continued regional shortening of the fold-and- thrust system against Laramide basement-
cored uplifts to the east.
A viable mechanism to facilitate late-stage adjustment of the fold-thrust system
includes interaction with basement-cored structures of the foreland (effects of basement
buttressing). The Biltmore anticline is the most likely candidate due to the proximity to
the field area and orientation of the structure. The Biltmore anticline is considered to
have formed on the hanging wall of the Biltmore fault, a high-angle reverse fault that
strikes northwest and dips northeast (Figure 6) (Schmidt et al., 1988). If footwall
imbrication of the Sandy Hollow-Hogback thrust system progressed further to the east, as
suggested by several workers, (Geiger, 1980; Brandon, 1984; Schmidt et al., 1988)
interaction of the fold- thrust system with basement-cored structures would be recorded

73
Figure 36. Cleavage-structure relationship diagrams. Best-fit fold axis trend and plunge = 08°, 007°. Axial surface indicated by gray plane. A. Cleavage population 1 strikes on average 030°, 54° E. B. Cleavage population 2 is shown cross-cutting the fold axial plane. Group 2 strikes on average 275°, 67° N. Group 3 strikes on average 090°, 70° S.

74 by late-stage deformation.
Strain related to late-stage deformation could have been partially accommodated
by cleavage development. Orientation of cleavages that formed in response to
impingement with the Biltmore system would be expected to form parallel to sub-parallel
to the orientation of the foreland structure, an orientation of northwest strike and steep
northeast dip. Since S1 strikes northeast and dips gently to the southeast, this mechanism
may not be viable. It is possible that strain related to basement buttressing was deflected
as the fold-and-thrust system impinged against foreland structures causing variations in
maximum shortening directions throughout the region. Basement buttressing has been
predicted to cause “stress trajectories that curve to reflect newly-imposed boundary
conditions” (Beutner, 1977) (Figure 37). Geometric and kinematic information regarding
the earliest location of basement impingement is necessary to further investigate how
stress trajectories were affected by basement impingement, requiring 3D seismic
reflection data of the subsurface. When the Beutner model is applied to the impingement
zone east of the front of the McCartney Mountain salient using an interpreted geologic
map, stress trajectories are seen to vary greatly within the nose of the salient (Figures 38
and 39). This model is only one of many possible conditions that may have occurred
during the progressive and overlapping strain related to both the propagation of the fold-
and-thrust belt into the foreland as well as basement-cored structure movement.
However, the model does illustrate that the stress trajectories should be expected to be
highly variable within the nose of the salient.

75
Figure 37. Beutner (1977) model of curved stress trajectories as a result of buttressing. Two materials of highly contrasting mechanical strength are compressed against each other with uniform compression. The gentle ramps allow the gelatin to be translated up onto the clay within salient areas. Lines of principle stress (σ1) are shown to curve around the newly imposed boundary features of the clay (foreland).

76
Figure 38. Idealized structural domains of the McCartney Mountain impingement zone. The McCartney Mountain salient geometry is shown to have been largely a consequence of pre-existing foreland basement structures that may have acted as foreland oblique ramps (shown as dashed red lines). The field area is shown as a yellow box. The blue polygon represents the frontal impingement zone. The gray area is interpreted to be dominantly Laramide basement uplifts. The outer boundary of the McCartney Mountain salient is shown as a solid black line. Geologic map from Ruppel et al., (1993).

77
Figure 39. Hypothetical stress trajectories of the McCartney Mountain impingement zone. Maximum stress trajectories are shown to be highly variable within the nose of the McCartney Mountain salient. Black stress trajectories represent one case of impingement in which the fold-and-thrust belt was compressed against the eastern boundary of the interpreted Laramide province. The blue trajectories represent stress paths if the impingement occurred at the western boundary of the interpreted Laramide province. A minimum basement ramp angle of 5.83° was calculated from depth to basement values collected from exploratory oil and gas wells. This is a minimum value since the wells are not located perpendicular to the interpreted basement ramp.
78
Another factor to consider is whether physical conditions during late-stage
deformation were suitable for cleavage development. As previously mentioned, cleavage
forms as a result of ductile deformation by fluid assisted grain-boundary diffusion during
low-grade metamorphism conditions ( T< 200 C, P< 5 kb) at burial depths <8 km (e.g.
Engelder and Marshak, 1985). Frontal fold-and-thrust systems are not subjected to deep
burial depths due to lack of overriding thrust plates. If frontal imbrications of the Sandy
Hollow-Hogback thrust system did interact with the Biltmore system, basal décollements
would have ramped up in section, further decreasing burial depth. However, thermal
requirements for cleavage development could have been facilitated by heat generated by
contemporaneous emplacement of local plutons (e.g. Pioneer and Boulder Batholiths)
(Geiger, 1980). Therefore it is a reasonable to suggest that S1 could have formed during
late-stage deformation related to the impingement of the Sandy Hollow-Hogback thrust
system against the Biltmore fault system, assisted by high regional heat flow from
shallow plutons in the area.
Cleavage Population 2
Cleavage population 2 is comprised of groups 2 and 3. Cleavage group 2 is
characterized by east-west strike with steep north dip with an average orientation of 275°,
67° N. Cleavage group 3 is similarly recognized by east-west strike with steep south dip
with an average orientation of 090°, 70° S. S2 was recorded at almost every measured
outcrop throughout the Sandy Hollow field area. S2 consistently strikes almost

79 perpendicular to first-order fold axes (Figure 36). Given that S2 cleavages cross-cut all
structural features of the fold-and-thrust system with remarkable geometric regularity, it
is confidently interpreted here that S2 developed after fold-thrust deformation in response
to a north-south maximum shortening direction.
Salient geometries are largely controlled by pre-existing structural features and
are defined by a frontal portion of the deforming sedimentary wedge that has been
allowed to propagate further into the foreland (e.g. Yonkee 2005) (Figure 38). The
McCartney Mountain salient is bounded to the north, north-east and south-east by
foreland basement uplifts that either pre-date or are synchronous with fold-and-thrust
deformation in south-west Montana (Figure 38). Data that support pre-existing foreland
basement uplifts includes variable isopach patterns of the Jurassic Ellis Group typical of a
structurally partitioned and differentially subsiding foreland as well as the incorporation
of basement rocks in the hanging wall of thin-skinned thrust faults (e.g. Kulik and
Schmidt, 1988; Schwartz and DeCelles, 1988). Progressive propagation into the salient
‘nose’ requires the wedge to interact with inherited foreland structures that may serve as
lateral and/or oblique transfer zones (footwall ramps) (Figure 40). Footwall ramps
accommodate ‘out-of-the-salient’ movement as the wedge is continually laterally limited.
The evolution of the deforming wedge is characterized by structural domains that are
divided according to several different directions of maximum shortening in response to
lateral adjustment (Figure 38 and 39). Late-stage cleavage forms parallel-to-oblique to
lateral transfer zones and axial planar to second-order super imposed folds. S2 cleavage

79
Figure 40. Block diagram of salient movement. As the frontal fold-and-thrust salient propagated into the foreland, it became laterally limited, likely caused by inherited lateral footwall ramps in foreland basement-cored uplifts. This hypothesis is proposed here to provide a tectonic mechanism for north-south shortening event to account for west-east cleavage strikes in population 2 cleavage.
80

81 may have formed in response to north-south compression related to late-stage lateral
impingement of the salient nose (Figure 40). Although the Sandy Hollow-Hogback thrust
system lacks second-order superimposed folds that would reflect strain related to lateral
impingement, there are several strike-slip faults that cut first-order folds and igneous
intrusive deposits that may have also formed in response to late-stage adjustment of the
salient (Figure 4). Strike-slip faults to the north are sinistral while to the south the faults
are dextral. These faults could have been acting to effectively shear the outer boundaries
of the salient system as the fold-and-thrust belt propagated further into the salient nose.
Hydrocarbon System Importance
Cleavage distribution and intensity variations in fold-and-thrust belts introduce
considerable heterogeneities in potential hydrocarbon systems. The pressure solution
process, largely responsible for cleavage development, is considered a porosity and
permeability reduction mechanism (Mitra, 1988). Local precipitation of dissolved
material in the pore network, the suturing of grain boundaries, and the development of
clay-rich cleavage domains collectively act to reduce pore volume and inhibit fluid
migration (Mitra, 1988). Reduced porosity and permeability degrades reservoir potential
by decreasing the space in which hydrocarbons could be stored, and by creating
insufficient migration pathways for hydrocarbon recovery. Therefore, structural analysis
of cleavage formation aids in predicting hydrocarbon reservoir quality as well as
migration pathways in fold-and-thrust belts.

82 Evidence presented in this study indicates that, at odds to many previous cleavage
studies, intense cleavage can form in frontal fold-and-thrust sheets with orientations
related to the impingement of thin-skinned features against pre-existing foreland
structures. Careful consideration of carbonate reservoirs is necessary to predict cleavage
orientation and intensity. Intense cleavage approximating population 2 cleavage in this
study would be highly unpredictable without detailed field mapping.
Carbon Dioxide Sequestration Importance
The emerging field of carbon dioxide capture and storage in geological reservoirs
also requires detailed reservoir characterization. Many CO2 sequestration reservoirs are
currently proposed within deep saline aquifer systems (i.e. Riley Ridge field on the Moxa
Arch, Wyoming) as well as in mature hydrocarbon reservoirs that are located within the
Sevier fold-and-thrust belt. Structural fabrics associated with the fold-and-thrust belt,
such as cleavage, must be considered as major factors that could control CO2 plume
migration away from the injection site. Cleavage, for example, could cause the injected
CO2 to migrate along clay-rich domains greatly affecting the long term pathway of the
plume. Detailed core analysis should be conducted to determine structural fabric
characteristics that can be used in pre-injection plume modeling.
83
Suggestions for Future Work
Collection of additional strain data, such as orientation of fracture, conjugate sets,
and cleavage in multiple stratigraphic units is necessary in order to fully investigate strain
in the Sandy Hollow field area. Strain accommodation within the middle limestone
member of the Kootenai Formation remains enigmatic. A detailed microscopic to
macroscopic study of all units within this member is needed to address the disparities of
cleavage development. Fluid inclusion analysis of calcite-filled fractures and/or a paleo-
magnetization investigation is needed obtain timing information for the development of
folds. A comprehensive geophysical study (collection of gravity and seismic data) of the
outer boundaries of the McCartney Mountain salient is required to gain more information
about the interaction of the fold-and-thrust belt against foreland basement structures.
Regional geologic mapping, focused on north-south compression, would further reveal
viable tectonic models for the development of S2.

84
CONCLUSIONS
Structural analysis of cleavage within a dolomitic unit of the Kootenai formation in
the Sandy Hollow field area elucidates the following conclusions.
1) The analyzed unit (Kk2a) is lithologically homogenous as indicated by chemical
dissolution, and XRD analysis. Therefore, lithologic variations within the unit can
be discounted as a possible control on cleavage intensity or morphology
variability.
2) Cleavage morphology was observed to be dominantly planar reflecting a tectonic
mechanism for cleavage development.
3) Cleavage intensity did not yield a recognizable relationship to folded bedding dip
or proximity to fold-and-thrust structures. Cleavage intensity within Kk2a is
shown to be classified as moderate – very strong.
4) Two generations of cleavage were recognized in Kk2a within a frontal fold-and-
thrust system. At odds to common cleavage-structure relationships, neither
cleavage generation was recognized as fanning cleavage, or as axial planar
cleavage.
5) Final S1 cleavage development occurred after first-order fold geometries were
established in response to a northwest-southeast directed maximum shortening
direction. S1 cleavage may have initially formed as axial planar but experienced
reorientation by the late-stage adjustment of the Sandy Hollow-Hogback thrust
system as a result of basement impingement against the Biltmore fault system.

85 6) S2 cleavage formation post-dates fold-and-thrust deformation, and developed in
response to a north-south maximum shortening direction. Lateral limitation of the
fold-and-thrust system into the nose of the salient may have created local north-
south maximum compression structural domains responsible for S2 development.

86
REFERENCES CITED

87
Alvarez, W., Engelder, T., and Geiser, P. A., 1978, Classification of solution cleavage in pelagic limestones: Geology, v. 6, p. 263-266. Armstrong, R.L., 1982, Cordilleran metamorphic core complexes- From Arizona to southern Canada: Annual Review of Earth and Planetary Sciences, v. 10, p. 129-154. Beutner, E.C., 1977, Causes and consequences of curvature in the Sevier Orogenic Belt, Utah to Montana in Heisey, E.L., Lawson, D.E., Norwood, E.R., Wach, P.H., and Hale, L.A., eds., Rocky Mountain Thrust belt geology and resources: Casper, Wyoming Geological Association, 29th Annual Field Conference, Guidebook, p. 353-365. Brandon, W., 1985, Preliminary geologic map of the McCartney Mountain salient, Beaverhead, Madison, and Silver Bow counties, Montana: MBMG Open-File Map 156, scale 1: 62,500, 4 sheets. Brandon, W., 1984, An origin for the McCartney's Mountain salient of the southwestern Montana fold and thrust belt [Master thesis]: Missoula, University of Montana, 128 p. Brumbaugh, D.S. and Dresser, H.W., 1976, Exposed Step in Laramide Thrust Fault, Southwest Montana: American Association of Petroleum Geologists Bulletin, v. 60, n. 12, p. 2142-2149. Brumbaugh, D.S. and Hendrix, T.E., 1981, The McCarthy Mountain Structural Salient Southwestern Montana in Tucker, T. E., ed., Guidebook to Southwest Montana: Billings, Montana Geological Society field conference and symposium, p. 201-209. Chadwick, R.A., 1981, Chronology and structural setting of volcanism in southwestern and central Montana in Tucker, T.E., ed., Guidebook to Southwest Montana: Billings, Montana Geological Society field conference and symposium, p. 301-315. Chester, J. S., 2003, Mechanical stratigraphy and fault-fold interaction, Absaroka thrust sheet, Salt River Range, Wyoming: Journal of Structural Geology, v. 25, p. 1171-1192. Christiansen, R.L. and Yeats, R.S., 1992, Post-Laramide geology of the U.S. Cordilleran region in Burchfiel, B.C., et al., eds., The Cordilleran Orogen: Conterminous U.S., v. G-3: Boulder, Geological Society of America, p.261-406. Compton, R.R., 1985, Geology in the Field: Hoboken, John Wiley and Sons, 398 p. Constenius, K.N., 1996, Late Paleogene extensional collapse of the Cordilleran foreland fold and thrust belt: Geological Society of America Bulletin, v.108, n. 1, p. 20-39.

88 Coogan, J.C., and Royse, F., Jr., 1990, Overview of recent developments in thrust belt interpretation, in Roberts, S., ed., Geologic field tours of western Wyoming and adjacent Idaho, Montana, and Utah: Laramide, Geological Survey of Wyoming Public Information Circular, v. 29, p. 89-124. Dahlstrom, C.D.A., 1977, Structural geology in the eastern margin of the Canadian Rocky Mountains in Heisey, E.L., Lawson, D.E., Norwood, E.R., Wach, P.H., and Hale, L.A., eds., Rocky Mountain thrust belt; Geology and Resources: Twenty-Ninth Annual field conference, Wyoming Geological Association Guidebook, p. 407-439. DeCelles, P.G., 2004, Late Jurassic to Eocene evolution of the Cordilleran thrust belt and foreland basin system, western U.S.A.: American Journal of Science, v. 304, p. 105-168. DeCelles, P.G., 1986, Sedimentation in a tectonically partitioned, nonmarine foreland basin: The Lower Cretaceous Kootenai Formation, southwestern Montana: Geological Society of America Bulletin, v. 978, p. 911-931. Dickinson, W.R., 2002, The Basin and Range province as a composite extensional domain: International Geology Review, v. 44, p. 1-38. Dickinson, W.R., 2004, Evolution of the North American Cordillera: Annual Review of Earth and Planetary Sciences, v. 32, p. 13-45. Engelder, T. and Marshak, S., 1985, Disjunctive cleavage formed at shallow depths in sedimentary rocks: Journal of Structural Geology, v.7, p. 327-343. Feeley, T.C., 2003, Origin and tectonic implications of across-strike geochemical variations in the Eocene Absaroka volcanic province, United States: The Journal of Geology, v. 111, p. 329-346. Fisher, R.A., 1953, Dispersion on a sphere: Proceedings of the Royal Society, London, v. A17, p. 295-305. Fletcher, R.C. and Pollard, D.D., 1981, Anticrack model for pressure solution surfaces: Geology, v. 9, p. 419-424. Foster, D.A., Schafer, C., Fanning, M., and Hyndman, D.W., 2001, Relationships between crustal partial melting, plutonism, orogeny, and exhumation: Idaho-Bitterroot batholith: Tectonophysics, v. 342, p. 313-350. Fritz, W.J., and Sears, J.W., 1993, Tectonics of the Yellowstone hotspot wake in southwestern Montana: Geology, v. 21, p. 427-430.

89 Geiger, B.C., 1980, Ductile strain in the overlap zone between the Cordilleran thrust belt and the Rocky mountain foreland near Melrose, Montana [Master thesis]: Missoula, University of Montana, 47 p. Geist, K. and Richards, M., 1993, Origin of the Columbia Plateau and Snake River plain; deflection of the Yellowstone plume: Geology, v. 21, p. 789-792. Gray, D.R., 1981, Cleavage-fold relationships and their implications for transected folds: an example from southwest Virginia, U.S.A.: Journal of Structural Geology, v. 3, n. 3, p. 265-277. Gunckel, K.L., 1990, McCartney Mountain Intrusion; a bulged sheet intrusion emplaced along thrust fault during thrust movement: Northwest Geology, v. 19, p. 14-22. Harlan, S.S., Geissman, J.W., Lageson, D.R. and Snee, L.W., 1988, Paleomagnetic and isotopic dating of thrust-belt deformation along the eastern edge of the Helena salient, northern Crazy Mountains Basin, Montana: Geological Society of America Bulletin, v. 100, p. 492-499. Hanneman, D.L., 1989, Cenozoic basin evolution in a part of southwestern Montana [Ph.D. thesis]: Missoula, University of Montana, 342 p. Heller, P.L., Bowdler, S.S., Chambers, H.P., Coogan, J.C., Hagen, E.S., Shuster, M.W., and Winslow, N.S., 1986, Time of initial thrusting in the Sevier orogenic belt, Idaho-Wyoming and Utah: Geology, v.14, p. 388-191. Hendrix, T.E. and Porter, E., 1980, Sandy Hollow collision structure in Guidebook of the Drummond-Elkhorn areas, west-central Montana: Butte, Montana Bureau of Mines and Geology, Special Publication 82, p. 25-34. Herman, J.S., 1982, The dissolution kinetics of calcite, dolomite, and dolomitic rocks in the CO2-water system [Ph.D thesis]: Philadelphia, Pennsylvania State University, 214 p. Hodges, K.V. and Applegate, J.D., 1993, Age of Tertiary extension in the Bitterroot metamorphic core complex, Montana and Idaho: Geology, v. 21, p. 161-164. Janecke, S.U., VanDenburg, C.J., and Blankenau, J.J., 1998, Geometry, mechanisms and significance of extensional folds from examples in the Rocky Mountain Basin and Range province: Journal of Structural Geology, v. 20, p. 841-856. Janecke, S., McIntosh, W., and Good, S., 1999, Testing models of rift basins: structure and stratigraphy of an Eocene-Oligocene supradetachment basin, Muddy Creek half graben, south-west Montana: Basin Research, v. 11, p. 143-165.

90 Janecke, S.U., VanDenburg, C.J., Blankenau, J.J., and M’Gonigle, J.W., 2000, Long-distance longitudinal transport of gravel across the Cordilleran thrust belt of Montana and Idaho: Geology, v. 28, p. 439-442. Janecke, S.U., Blankenau, J.J. VanDenburg, C.J., and VanGosen, B.S., 2001, Map of normal faults and extensional folds in the Tendoy Mountains and Beaverhead Range, southwest Montana and eastern Idaho: United States Geological Survey Miscellaneous Field Studies Map MF-2362, version 1.0, scale 1:100,000, 1 sheet. Kalakay, T.J., 2001, The role of magmatism during crustal shortening in the retroarc fold and thrust belt of southwestern Montana [Ph.D. thesis]: Laramide, University of Wyoming, 204 p. Kiorpes, S.T., 1990, Pressure Solution Leading to Unbalanceable Cross-sections: Analysis of an Outcrop-scale Example from the Southwestern Montana Fold-and-thrust Belt near Dillon, Montana [Master thesis]: Seattle, University of Washington, 85 p. Kulik, D.M. and Schmidt, C.J., 1988, Region of overlap and styles of interaction of Cordilleran thrust belt and Rocky Mountain foreland in Schmidt, C.J., Perry Jr., W.J., eds., Interaction of the Rocky Mountain Foreland and the Cordilleran thrust belt: Boulder, Geological Society of America Memoir 171, p. 75-98. Kulik, D.M. and Perry, Jr., W.J., 1988, The Blacktail-Snowcrest foreland uplift and its influence on structure of the Cordilleran thrust belt – Geological and geophysical evidence for the overlap province in southwestern Montana in Schmidt, C.J., Perry Jr., W.J., eds., Interaction of the Rocky Mountain Foreland and the Cordilleran thrust belt: Boulder, Geological Society of America Memoir 171, p. 291-306. Lageson, D.R. and Schmitt, J.G., 1995, The Sevier orogenic belt of the western United States: Recent advances in understanding its structural and sedimentologic framework in Caputo, M.V., Paterson, J.A. and Franczyk, K.J., eds., Mesozoic systems of the Rocky Mountain region, USA: Denver, Rocky Mountain Section of the Society for Sedimentary Geology, p. 27-64. Lopez, D.A. and Schmidt, C.J., 1985, Seismic profile across the leading edge of the fold and thrust belt in southwestern Montana, in Gries, R.R., and Dyer, R.C., eds., Seismic exploration of the Rocky Mountain region: Rocky Mountain Association of Geologists and Denver Geophysical Society, p. 45-50. Lund, K., Aleinikoff, J.N., Kunk, M.J., Unruh, D.M., Zeihen, G.D., Hodges, W.C., Du Bray, E.A., and O’Neill, J.M., 2002, SHRIMP U-Pb and 40Ar/39Ar age constraints for relating plutonism and mineralization in the Boulder batholith region, Montana: Economic Geology, v. 97, p. 241-267.

91 Marvin, R.F., Mehnert, H.H., Naeser, C.W., and Zartman, R.E., 1989, U.S. Geological Survey radiometric ages—compilation “C,” Part five: Colorado, Montana, Utah, and Wyoming: Isochron/West, no. 53, p. 14-19. Marshak, S. and Engelder, T., 1985, Development of cleavage in limestones of a fold-thrust belt in eastern New York: Journal of Structural Geology, v. 7, p. 345-359. Mitra, S., 1988, Effects of deformation mechanisms on reservoir potential in central Appalachian Overthrust Belt: American Association of Petroleum Geologist Bulletin, v. 72, p. 536-554. Mitra, G. and Yonkee, W.A., 1985, Relationship of spaced cleavage to folds and thrusts in the Idaho-Utah-Wyoming thrust belt: Journal of Structural Geology, v. 7, n. 3-4, p. 361-373. Onasch, C.M., 1983, Origin and significance of microstructures in sandstones of the Martinsburg Formation, Maryland: American Journal of Science, v. 283, p. 936-966. O’Neill, J.M. and Lopez, D.A., Character and regional significance of Great Falls tectonic zone, east-central Idaho and west-central Montana: American Association of Petroleum Geologist Bulletin, v. 69, p. 437-447. O’Neill, J.M., Lonn, J.D., Lageson, D.R., and Kunk, M.J., 2004, Early Tertiary Anaconda metamorphic core complex, southwestern Montana: Canadian Journal of Earth Sciences, v. 41, p. 63-72. Perry, W.J., Dyman, T.S., and Sando, W.J., 1989, Southwestern Montana recess of Cordilleran thrust belt in French, D.E. and Grabb, R.F., eds., Geologic Resources of Montana, Volume 1: Billings, Montana Geological Society, 1989 Field conference Guidebook, Montana Centennial Edition, p. 261-270. Powell, C. McA., 1979, A morphological classification of rock cleavage: Tectonophysics, v. 58, p. 21-34. Price, R.A., 1981, The Cordilleran foreland thrust and fold belt in the southern Canadian Rocky Mountains: Geological Society of London, Special Publications, v. 9, p. 427-448. Ramsay, J.G., 1963, Structural investigations in the Barberton Mountain Land, eastern Transvaal: Transactions of the Geological Society of South Africa, v. 66, p. 353-401. Ramsay, J.G., 1967, Folding and fracturing of rocks: New York, McGraw-Hill, 568 p.

92 Ruppel, E.T. and Lopez, D.A., 1984, The thrust belt in southwest Montana and east-central Idaho: United States Geological Survey Professional Paper 1278, 41 p. Ruppel, E.T., 1993, Cenozoic tectonic evolution of southwest Montana and east-central Idaho: Montana Bureau of Mines and Geology, Memoir 65, 62 p. Ruppel, E.T., O’Neill, J.M., and Lopez, D.A., 1993, Geologic map of the Dillon 1 x 2 quadrangle, Idaho and Montana: United States Geological Survey Miscellaneous Investigations Series Map I-1803-H, scale 1:250,000, 1 sheet. Schmidt, C.J. and Hendrix, T.E., 1981, Tectonic controls for the thrust belt and Rocky Mountain foreland structures in the northern Tobacco Root Mountains – Jefferson Canyon area, southwestern Montana in Tucker, T.E., ed., Guidebook to Southwest Montana: Billings, Montana Geological Society field conference and symposium, p. 167-180. Schmidt, C.J. and Garihan, J.M., 1983, Laramide tectonic development of the Rocky Mountain foreland of southwestern Montana in Lowell, J.D., ed., Rocky Mountain foreland basins and uplifts: Denver, Rocky Mountain Association of Geologist, p. 271-294. Schmidt, C.J., O’Neill, J.M., and Brandon, W.C., 1988, Influence of Rocky Mountain foreland uplifts on the development of the frontal fold and thrust belt, southwestern Montana in Schmidt, C.J., Perry Jr., W.J., Interaction of the Rocky Mountain Foreland and the Cordilleran thrust belt: Boulder, Geological Society of America Memoir 171, p. 171-201. Sears, J.W., Hurlow, H., Fritz, W.J., and Thomas, R.C., 1995, Late Cenozoic disruption of Miocene grabens on the shoulder of the Yellowstone hotspot track in southwest Montana—Field guide from Lima to Alder, Montana, in Mogk, D.W., ed., Field guide to geologic excursions in southwest Montana: Bozeman, Northwest Geology, v. 24, p.201-219. Skipp, B., 1988, Cordilleran thrust belt and faulted foreland in the Beaverhead Mountains, Idaho and Montana, in Schmidt, C.J., and Perry, W.J., Jr., eds., Interaction of the Rocky Mountain foreland and the Cordilleran thrust belt: Geological Society of America Memoir 171, p. 237-266. Snee, L.W., 1982, Emplacement and cooling of the Pioneer batholith, southwest Montana [Ph.D. thesis]: Columbus, Ohio State University, 320 p. Spang, J.H., Oldershaw, A.E., and Stout, M.Z., 1979, Development of cleavage in the Banff formation at Pigeon Mountain, Front Ranges, Canadian Rocky Mountains: Canadian Journal of Earth Sciences, v. 16, p. 1108-1115.

93 Schwartz, R.K., and DeCelles, P.G., 1988, Cordilleran foreland basin evolution in response to interactive Cretaceous thrusting and foreland partitioning, southwestern Montana in Schmidt, C.J., Perry Jr., W.J., Interaction of the Rocky Mountain Foreland and the Cordilleran thrust belt: Boulder, Geological Society of America Memoir 171, p. 489-513. Thomas, R.C., Sears, J.W., Ripley, A.A. and Berg, R.B., 1995, Tertiary extensional history of southwestern Montana: Field trip guide for the Sweetwater and Upper Ruby valleys, Montana: Northwestern Geology, v. 25, p. 5-25. Tysdal, R.G., 1981, Foreland deformation in the northern part of the Ruby range of southwestern Montana in Tucker, T.E., ed., Guidebook to Southwest Montana: Billings, Montana Geological Society field conference and symposium, p. 215-224. VanDenburg, C.J., Janecke, S.U., and McIntosh, W.C., 1998, Three-dimensional strain produced by >50 My of episodic extension, Horse Prairie basin area, SW Montana, U.S.A.: Journal of Structural Geology, v. 20, p. 1747-1767. Vollmer, F.W., 1995, C program for automatic contouring of spherical orientation data using a modified Kamb method: Computers and Geosciences v. 21 p. 31-49. Wanless, H.R., 1979, Limestone response to stress: Pressure solution and dolomitization: Journal of Sedimentary Petrology, v. 49, p. 437-462. Yonkee, A., 2005, Strain patterns within part of the Willard thrust sheet, Idaho-Utah-Wyoming thrust belt: Journal of Structural Geology, v. 27, p. 1315-1343. Yonkee, A., 1983, Minerology and structural relationships of cleavage in the Twin Creek Formation within part of the Crawford thrust sheet in Wyoming [M.S. thesis]: Laramide, University of Wyoming, 125 p.

94
APPENDICES

95
APPENDIX A
TECTONIC TIMING INFORMATION

96
Deformational Event Feature AgeDating Technique or Field
Evidence Citations
Sevier fold-thrust belt Late Cretaceous to earliest Eocene paleomagnetic dating Harlan et al., 1988
Mid-early Cretaceous to mid Eocene (50Ma) collective dating techniques Dickinson, 2004
Late Jurassic to Eocene collective dating techniques DeCelles, 2004
Laramide basement cored foreland uplifts
North west trending basement involved reverse faults 70-75 Ma
Deformed strata associated with thin-skinned thrusting ramping up over basement uplifts
Schmidt and O'Neill, 1981; Ruppel et al., 1983; Schmidt and Garihan, 1983; Brandon, 1984
Blacktail-Snowcrest Uplift completed by 78 MaPalynological dating of syntectonic sediments Kulik and Perry, 1988
Ruby Uplift Latest Cretaceous to late Eocene
strucutral relationships and vertebrete fossils from Beaverhead conglomerate Tysdal, 1981
Tobacco Root Uplift Latest Cretaceous to late Eocenecross cutting field relationships Schmidt and Hendrix, 1981
Highland Mountain Uplift Latest Cretaceouscross cutting field relationships Schmidt et al., 1988
Idaho-Montana Batholith Province
Main phase of emplacement 80-65 Ma collective dating techniques Snee, 1982
Pioneer Batholith 83-65 Ma; Main phase 77-72 Ma K-Ar dating Snee, 1982
Boulder Batholith 80.4 +/-1.2 to 74.5 +/- 0.9 Ma U-Pb TIMS and SHRIMP Lund et al., 2002
Phillipsberg Batholith 77.2 +/- 1.9 Ma, 73.3 +/- 1.8 Ma Biotite K-Ar method Marvin et al., 1989
Idaho-Bitteroot Batholith 80 - 53 Ma Ar-Ar SHRIMP Foster et al., 2001
Tobacco Root Batholith 75 Ma K-Ar dating Schmidt and Hendrix, 1981McCartney Mountain pluton 74 +/- 1 Ma K-Ar biotite date
Brumbaugh and Hendrix, 1981
Extensional phases Sevier Orogenic collapse 50 - 20 Ma collective dating techniquesConstenius, 1996; Janecke et al., 2001
Bitterroot metamorphic core complex 46.4 +/- 0.8 Ma 46 - 48 Ma 40Ar/39Ar cooling dates Hodges and Applegate, 1993Anaconda metamorphic core complex 47.2 +/- 0.14 Ma 40Ar/39Ar age spectrum O'Neill et al., 2004
Laramide collapse 49 - 20 Ma collective dating techniques Constenius, 1996
Block Mountain Basalt 44.8 Ma K-Ar whole rock dating Chadwick, 1981
Snake River Plain starts 17.5 Ma; affected SW MT ~6 Ma
dating of volcanic deposits and tectonic reconstruction models Fritz and Sears, 1993
Basin and Range starts in 17 Ma collective dating techniques Thomas et al., 1995
Tectonic timing table showing sources used in the Regional Tectonic section and to produce Figure 2, Deformational events timeline for southwest Montana.

97
APPENDIX B
FOLD ATTRIBUTES AND BEDDING DATA

98
S tructure Name Folded Bedding Orientation DataS andy Hollow Anticline S trike Dip Dip Direction
183 70 W184 61 W193 40 W194 34 W194 28 W198 24 W198 14 W198 29 W201 31 W201 31 W202 48 W204 47 W206 35 W206 41 W208 29 W230 13 NW235 11 NW262 11 N327 52 E328 52 E331 54 E336 72 E172 62 W174 72 W355 62 NE178 66 W
S tructure Name Folded Bedding Orientation Data
C reasey Gulch Anticline S trike Dip Dip Direction232 28 NW36 27 S E23 45 E14 54 E4 34 E25 9 E8 44 E18 28 E20 12 E258 4 NW198 19 W174 44 W196 22 W188 26 W202 24 W181 24 W164 9 SW
Tabular orientation data for KK2a folded bedding. Presented in right hand rule form.

99
S tructure Name Folded Bedding Orientation DataZ iegler Anticline S trike Dip Dip Direction
11 63 E12 57 E358 62 E8 63 E18 46 E15 51 E19 88 E15 72 E15 74 E15 68 E13 73 E260 18 N320 57 E338 54 E355 58 E356 58 E201 31 W221 39 W208 42 W218 37 W203 44 W204 30 W209 34 W197 36 W175 41 W191 53 W199 54 W212 39 W188 54 W203 48 W203 46 W200 56 W194 47 W208 50 W207 33 W208 65 W216 27 W207 33 W201 41 W
Tabular orientation data for KK2a folded bedding, continued. Presented in right hand rule form. Note that the measurements for the Ziegler syncline are preserved within the east limb of the Creasey Gulch anticline, and the west limb of the Ziegler anticline data.

100
Creasey Gulch Anticline Dimensions Order of Fold First Amplitude 920 m Half-Wavelength 627 m Attitude Trend of Fold Axis 194° Plunge of Fold Axis 01° Horizontal Strike of Axial Plane 014° Dip of Axial Plane 88° E Upright Geometry of Axial Plane Curved Shape Aspect Ratio 1.468 Equant Harmony 1.459 Disharmonic Symmetry 1° diff Asymmetric Bluntness 0.63 Sub-rounded Tightness 14° Tight Cylindricity Cylindrical Curvature Distribution Diffuse pattern Rounded form Ziegler Syncline Dimensions Order of Fold First Amplitude 1667 m Half-Wavelength 387 m Attitude Trend of Fold Axis 020° Plunge of Fold Axis 03° Sub-horizontal Strike of Axial Plane 018°
Dip of Axial Plane 70° W Steeply Inclined
Geometry of Axial Plane Curved Shape Aspect Ratio 4.3103 Elongate Harmony 2.365 Disharmonic Symmetry 3.5° diff Bluntness 0.40 Sub-rounded Tightness 15° Tight Cylindricity Cylindrical Curvature Distribution Cluster pattern Parabolic Fold attributes for the Creasey Gulch anticline and Ziegler syncline.

101 Ziegler Anticline Dimensions Order of Fold First Amplitude 2053 m Half-Wavelength 1560 m Attitude Trend of Fold Axis 014° Plunge of Fold Axis 09° Sub-horizontal Strike of Axial Plane 018° Dip of Axial Plane 70° W Steeply Inclined Geometry of Axial Plane Curved Shape Aspect Ratio 1.316 Equant Harmony 0.7424 Disharmonic Symmetry 5° diff Asymmetric Bluntness 0.37 Sub-angular Tightness 26° Tight Cylindricity Cylindrical Curvature Distribution Cluster pattern Chevron like Sandy Hollow Anticline Dimensions Order of Fold First Amplitude 1547 m Half-Wavelength 1387 m Attitude Trend of Fold Axis 350° Plunge of Fold Axis 17° Gently plunging Strike of Axial Plane 173° Dip of Axial Plane 75° W Steeply Inclined Geometry of Axial Plane Overturned and curved East verging Shape Aspect Ratio 1.1153 Equant Harmony 0.9232 Disharmonic Symmetry 2° diff Asymmetric Bluntness 0.27 Sub-angular Tightness 64° Close Cylindricity Cylindrical Curvature Distribution Moderately diffuse pattern Parabolic
Fold attributes for the Ziegler and Sandy Hollow anticlines.

102
Williams and Chapman (1983) fold classification for synclines and anticlines of the Sandy Hollow field area. Plotted data shows the Sandy Hollow folds classifed as cylindrical, tight to closed folds with chevron to parabolic shapes.

103
Draft diagram for Creasey Gulch anticline showing calculation of bluntness, interlimb angle, and degree of symmetry.

104
Ramsay classification of the Creasey Gulch anticline showing drafted dip isogons.

105
Draft diagram for Ziegler syncline showing calculation of bluntness, interlimb angle, and degree of symmetry.

106
Ramsay classification of the Ziegler syncline showing drafted dip isogons.

107
Draft diagram for Ziegler anticline showing calculation of bluntness, interlimb angle, and degree of symmetry.

108
Ramsay classification of the Ziegler anticline showing drafted dip isogons.

109
Draft diagram for Sandy Hollow anticline showing calculation of bluntness, interlimb angle, and degree of symmetry.

110
Ramsay classification of the Sandy Hollow anticline showing drafted dip isogons.

111
APPENDIX C
DISSOLUTION ANALYSIS RESULTS

112
Sample Name Filter (g) Sample & Filter (g) Initial Sample (g) Filter top (g) Total Filter (g) Final Sample & Filters (g) Final Sample (g) % wt Average %005-A 0.3491 1.3497 1.0006 0.3492 0.6983 1.0146 0.3163 31.61%005-B 0.3472 1.3481 1.0009 0.3463 0.6935 1.0032 0.3097 30.94%005-C 0.3465 1.3552 1.0087 0.3458 0.6923 1.0201 0.3278 32.50% 31.68%013-A 0.3451 1.3503 1.0052 0.3485 0.6936 1.0041 0.3105 30.89%013-B 0.3454 1.3467 1.0013 0.3467 0.6921 1.0057 0.3136 31.32%013-C 0.3472 1.3520 1.0048 0.3488 0.6960 1.0112 0.3152 31.37% 31.19%025-A 0.3466 1.3429 1.0063 0.3459 0.6925 0.9833 0.2908 28.90%025-B 0.3481 1.3486 1.0005 0.3461 0.6942 1.0023 0.3081 30.79%025-C 0.3476 1.3488 1.0012 0.3474 0.6950 1.0039 0.3089 30.85% 30.18% Tabular results from sample dissolution analysis. .
112

113
Map showing the locations of rock samples used in the chemical dissolution, and XRD analysis. Sample 001 was used to determine the bulk rock chemistry of Kk2a during XRD analysis. Samples 005, 013, and 025 were dissolved to determine the relative amount of insoluble material within Kk2a. XRD analysis was then performed on the resulting insoluble residues.

114
APPENDIX D
CLEAVAGE ORIENTATION DATA

115
C leavage G roup 1S TR IK E DIP DIPDXN
8 23 E14 21 E26 19 E5 10 E26 54 E44 32 E24 32 E12 38 E23 48 E48 42 E30 41 E24 53 E11 76 E15 42 E149 62 S W158 69 S W11 61 E15 76 E
Tabular orientation data for group 1 cleavage domains. Note theses values represent the mean of several measurements taken at each outcrop.

116
C leavage G roup 2S TR IK E DIP D IPDXN333 69 NE304 67 NE276 41 N256 34 N266 66 N266 64 N276 68 N274 76 N259 65 N257 46 N261 37 N287 78 N261 84 N270 69 N266 84 N293 56 N314 86 N261 77 N262 73 N257 71 N270 79 N283 76 N303 72 N255 77 N259 84 N
Tabular orientation data for group 2 cleavage domains. Note theses values represent the mean of several measurements taken at each outcrop.

117
C leavage G roup 3S TR IK E DIP D IPDXN
79 86 S89 79 S92 68 S91 57 S96 71 S74 80 S75 62 S85 79 S72 51 S89 78 S84 78 S106 81 S94 56 S109 77 S109 74 S86 84 S103 89 S100 84 S116 81 S118 77 S113 89 S116 70 S110 72 S102 79 S83 71 S90 87 S66 79 S78 61 S91 60 S98 77 S82 73 S75 69 S79 69 S111 81 S82 87 S84 76 S76 76 S93 64 S94 71 S
Tabular orientation data for group 3 cleavage domains, continued. Note theses values represent the mean of several measurements taken at each outcrop.

118
C leavage G roup 3 continuedS TR IK E DIP D IPDXN
83 74 S101 84 S94 76 S80 60 S113 76 S115 86 S135 85 S89 71 S86 64 S113 81 S81 54 S93 71 S84 74 S94 71 S106 71 S107 82 S56 73 S E52 68 S E51 64 S E47 57 S E103 78 S71 87 S64 72 S51 65 S E67 61 S E53 38 S E118 42 S131 39 S124 28 S133 28 S41 84 S60 82 S
Tabular orientation data for group 3 cleavage domains, continued. Note theses values represent the mean of several measurements taken at each outcrop.

119