structural damage diagnosis of steel truss bridges by ... · structural damage diagnosis of steel...
TRANSCRIPT

Structural damage diagnosis of steel truss bridges by outlierdetection
Kim, C. W., Kitauchi, S., Chang, K. C., Mcgetrick, P. J., Sugiura, K., & Kawatani, M. (2014). Structural damagediagnosis of steel truss bridges by outlier detection. In G. Deodatis, B. R. Ellingwood, & D. M. Frangopol (Eds.),Safety, Reliability, Risk and Life-Cycle Performance of Structures and Infrastructures - Proceedings of the 11thInternational Conference on Structural Safety and Reliability, ICOSSAR 2013. (pp. 4631-4638). New York: CRCPress.Published in:Safety, Reliability, Risk and Life-Cycle Performance of Structures and Infrastructures - Proceedings of the 11thInternational Conference on Structural Safety and Reliability, ICOSSAR 2013
Document Version:Peer reviewed version
Queen's University Belfast - Research Portal:Link to publication record in Queen's University Belfast Research Portal
Publisher rights© 2014 CRC Press/Balkema.The final version was published in Safety, Reliability, Risk and Life-Cycle Performance of Structures and Infrastructures
General rightsCopyright for the publications made accessible via the Queen's University Belfast Research Portal is retained by the author(s) and / or othercopyright owners and it is a condition of accessing these publications that users recognise and abide by the legal requirements associatedwith these rights.
Take down policyThe Research Portal is Queen's institutional repository that provides access to Queen's research output. Every effort has been made toensure that content in the Research Portal does not infringe any person's rights, or applicable UK laws. If you discover content in theResearch Portal that you believe breaches copyright or violates any law, please contact [email protected].
Download date:16. Feb. 2017
a)
b)
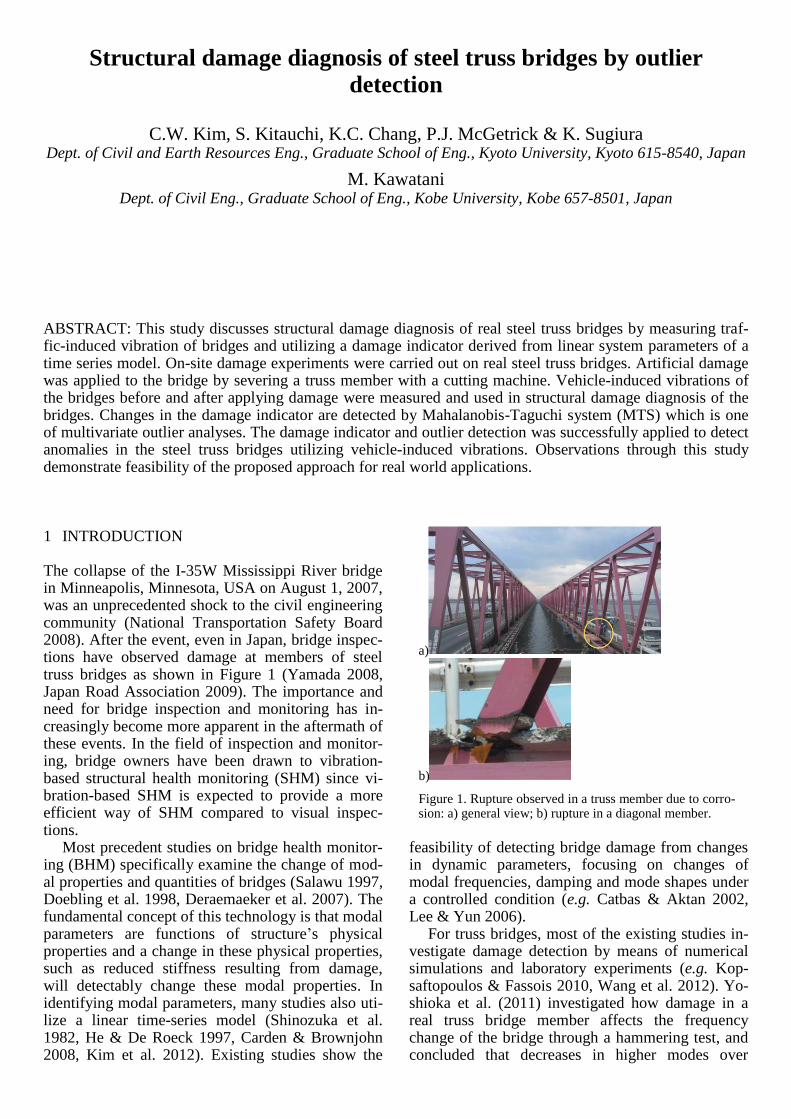
Figure 1. Rupture observed in a truss member due to corro-sion: a) general view; b) rupture in a diagonal member.
1 INTRODUCTION
The collapse of the I-35W Mississippi River bridge in Minneapolis, Minnesota, USA on August 1, 2007, was an unprecedented shock to the civil engineering community (National Transportation Safety Board 2008). After the event, even in Japan, bridge inspec-tions have observed damage at members of steel truss bridges as shown in Figure 1 (Yamada 2008, Japan Road Association 2009). The importance and need for bridge inspection and monitoring has in-creasingly become more apparent in the aftermath of these events. In the field of inspection and monitor-ing, bridge owners have been drawn to vibration-based structural health monitoring (SHM) since vi-bration-based SHM is expected to provide a more efficient way of SHM compared to visual inspec-tions.
Most precedent studies on bridge health monitor-ing (BHM) specifically examine the change of mod-al properties and quantities of bridges (Salawu 1997, Doebling et al. 1998, Deraemaeker et al. 2007). The fundamental concept of this technology is that modal parameters are functions of structure’s physical properties and a change in these physical properties, such as reduced stiffness resulting from damage, will detectably change these modal properties. In identifying modal parameters, many studies also uti-lize a linear time-series model (Shinozuka et al. 1982, He & De Roeck 1997, Carden & Brownjohn 2008, Kim et al. 2012). Existing studies show the
feasibility of detecting bridge damage from changes in dynamic parameters, focusing on changes of modal frequencies, damping and mode shapes under a controlled condition (e.g. Catbas & Aktan 2002, Lee & Yun 2006).
For truss bridges, most of the existing studies in-vestigate damage detection by means of numerical simulations and laboratory experiments (e.g. Kop-saftopoulos & Fassois 2010, Wang et al. 2012). Yo-shioka et al. (2011) investigated how damage in a real truss bridge member affects the frequency change of the bridge through a hammering test, and concluded that decreases in higher modes over
Structural damage diagnosis of steel truss bridges by outlier
detection
C.W. Kim, S. Kitauchi, K.C. Chang, P.J. McGetrick & K. Sugiura Dept. of Civil and Earth Resources Eng., Graduate School of Eng., Kyoto University, Kyoto 615-8540, Japan
M. Kawatani Dept. of Civil Eng., Graduate School of Eng., Kobe University, Kobe 657-8501, Japan
ABSTRACT: This study discusses structural damage diagnosis of real steel truss bridges by measuring traf-fic-induced vibration of bridges and utilizing a damage indicator derived from linear system parameters of a time series model. On-site damage experiments were carried out on real steel truss bridges. Artificial damage was applied to the bridge by severing a truss member with a cutting machine. Vehicle-induced vibrations of the bridges before and after applying damage were measured and used in structural damage diagnosis of the bridges. Changes in the damage indicator are detected by Mahalanobis-Taguchi system (MTS) which is one of multivariate outlier analyses. The damage indicator and outlier detection was successfully applied to detect anomalies in the steel truss bridges utilizing vehicle-induced vibrations. Observations through this study demonstrate feasibility of the proposed approach for real world applications.
100Hz were observed due to damage, although a lot of effort is required to perform the hammering test.
However, there exists a drawback of modal pa-rameter-based bridge diagnosis using time series models: the optimal time series model for vibration responses of bridge structures usually comprises a higher order term and as a result, the optimal model detects even numerical parameters which cause spu-rious system frequencies and damping constants. In fact, those spurious system parameters make it diffi-cult to choose proper modal parameters affected by structural damage. Nair et al. (2006) investigated feasibility of a damage-sensitivity feature derived from linear system parameters utilizing data from the ASCE benchmark test on a scaled building. Kim et al. (2013) also examined the feasibility of the damage-sensitivity feature derived from linear sys-tem parameters but the study considers damage de-tection of a scaled bridge under a passing model ve-hicle. Both investigations show successful application of the damage-sensitivity feature for damage detection within the laboratory scale.
This study investigates the feasibility of vibra-tion-based damage detection of real steel truss bridges utilizing traffic-induced vibration of the bridges. On-site moving vehicle experiments on a real nine-span-continuous truss bridge and a single-span truss bridge were carried out. Both bridges are steel bridges and are planned to be removed. It is noteworthy that the on-site experiment on the con-tinuous-span bridge focuses on the detection of damage in a diagonal member under heavy vehicle-induced vibration. On the other hand, for the single-span bridge, feasibility of fault detection of the bridge with step-by-step damage applied to vertical members is investigated, with vibrations induced by a light moving vehicle.
This study considers a damage indicator derived from linear system parameters of a time series model identified from traffic-induced vibration data as a damage-sensitive feature. The Mahalanobis-Taguchi system (MTS) (Taguchi & Jugulum 2000) which is a multivariate statistical pattern recognition method (e.g. Sohn et al. 2001) is used to cope with any vari-ation of identified results caused by uncertainties in the health monitoring and to emphasize potential change in the identified damage indicator due to damage. The outliers crossing the threshold are counted and this information is used to make a deci-sion on bridge condition.
2 ON-SITE MOVING VEHICLE EXPERIMENTS ON STEEL TRUSS BRIDGES
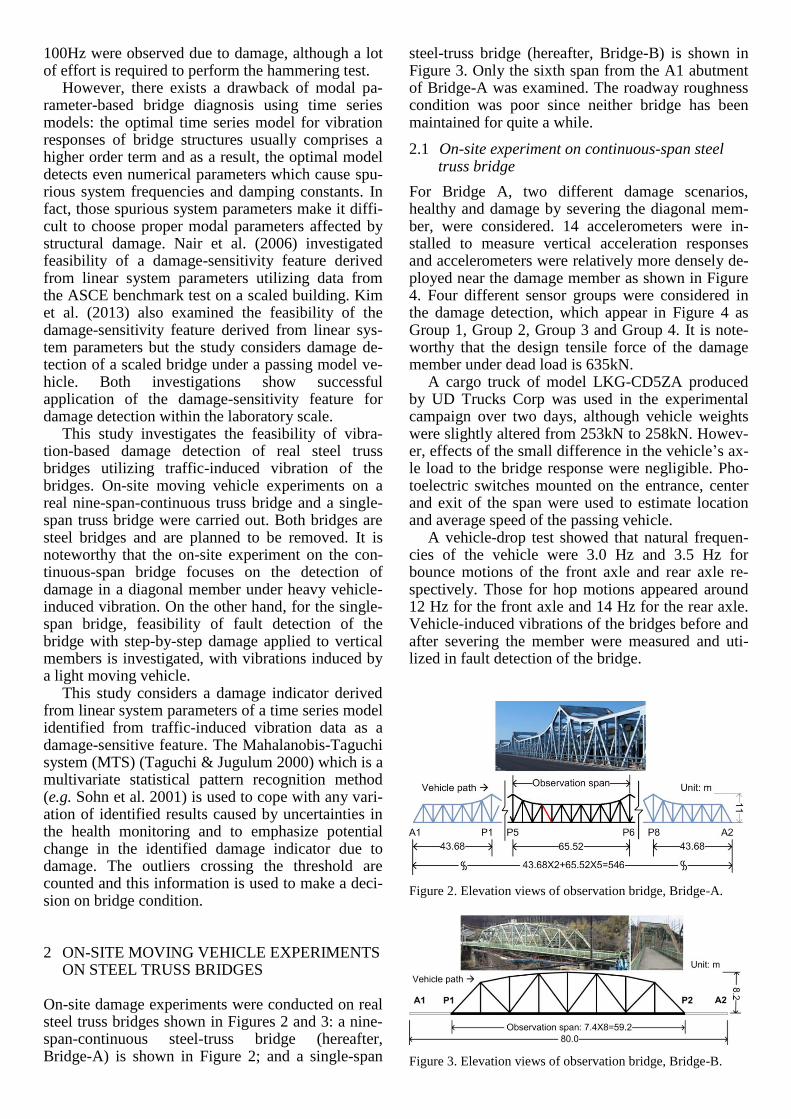
On-site damage experiments were conducted on real steel truss bridges shown in Figures 2 and 3: a nine-span-continuous steel-truss bridge (hereafter, Bridge-A) is shown in Figure 2; and a single-span
steel-truss bridge (hereafter, Bridge-B) is shown in Figure 3. Only the sixth span from the A1 abutment of Bridge-A was examined. The roadway roughness condition was poor since neither bridge has been maintained for quite a while.
2.1 On-site experiment on continuous-span steel truss bridge
For Bridge A, two different damage scenarios, healthy and damage by severing the diagonal mem-ber, were considered. 14 accelerometers were in-stalled to measure vertical acceleration responses and accelerometers were relatively more densely de-ployed near the damage member as shown in Figure 4. Four different sensor groups were considered in the damage detection, which appear in Figure 4 as Group 1, Group 2, Group 3 and Group 4. It is note-worthy that the design tensile force of the damage member under dead load is 635kN.
A cargo truck of model LKG-CD5ZA produced by UD Trucks Corp was used in the experimental campaign over two days, although vehicle weights were slightly altered from 253kN to 258kN. Howev-er, effects of the small difference in the vehicle’s ax-le load to the bridge response were negligible. Pho-toelectric switches mounted on the entrance, center and exit of the span were used to estimate location and average speed of the passing vehicle.
A vehicle-drop test showed that natural frequen-cies of the vehicle were 3.0 Hz and 3.5 Hz for bounce motions of the front axle and rear axle re-spectively. Those for hop motions appeared around 12 Hz for the front axle and 14 Hz for the rear axle. Vehicle-induced vibrations of the bridges before and after severing the member were measured and uti-lized in fault detection of the bridge.
Figure 2. Elevation views of observation bridge, Bridge-A.
Figure 3. Elevation views of observation bridge, Bridge-B.
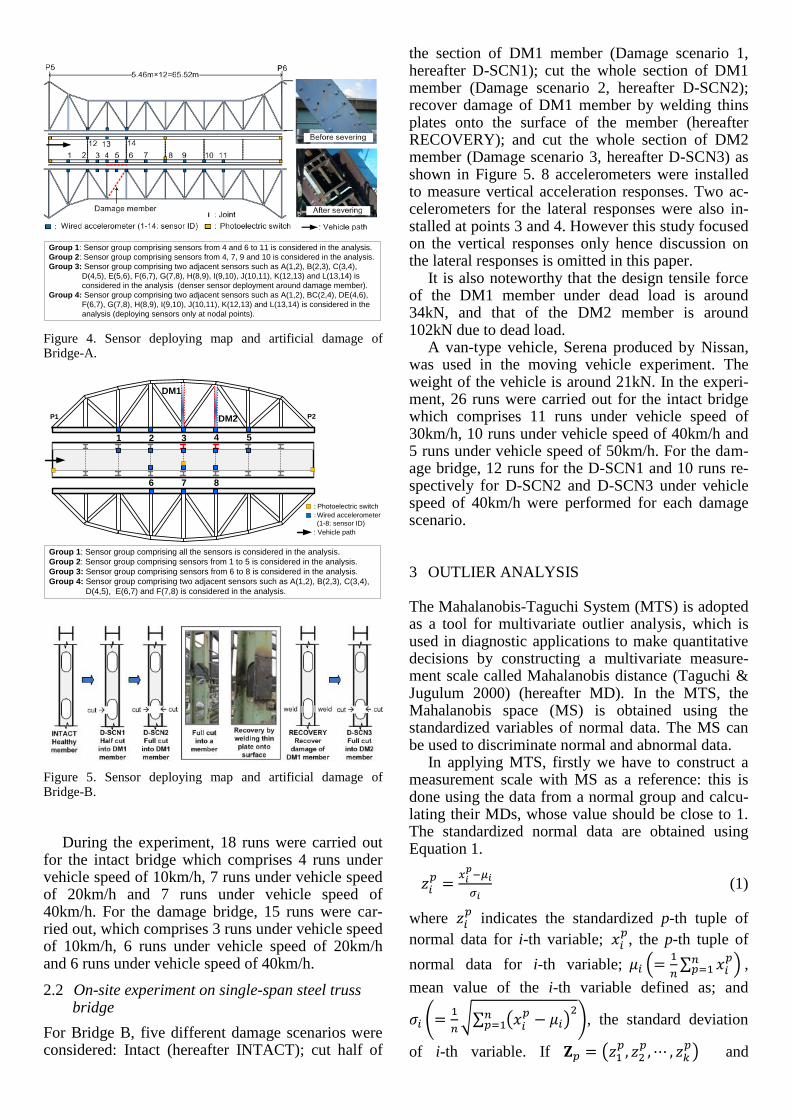
Group 1: Sensor group comprising sensors from 4 and 6 to 11 is considered in the analysis.
Group 2: Sensor group comprising sensors from 4, 7, 9 and 10 is considered in the analysis.
Group 3: Sensor group comprising two adjacent sensors such as A(1,2), B(2,3), C(3,4),
D(4,5), E(5,6), F(6,7), G(7,8), H(8,9), I(9,10), J(10,11), K(12,13) and L(13,14) is
considered in the analysis (denser sensor deployment around damage member).
Group 4: Sensor group comprising two adjacent sensors such as A(1,2), BC(2,4), DE(4,6),
F(6,7), G(7,8), H(8,9), I(9,10), J(10,11), K(12,13) and L(13,14) is considered in the
analysis (deploying sensors only at nodal points).
Figure 4. Sensor deploying map and artificial damage of Bridge-A.
Group 1: Sensor group comprising all the sensors is considered in the analysis.
Group 2: Sensor group comprising sensors from 1 to 5 is considered in the analysis.
Group 3: Sensor group comprising sensors from 6 to 8 is considered in the analysis.
Group 4: Sensor group comprising two adjacent sensors such as A(1,2), B(2,3), C(3,4),
D(4,5), E(6,7) and F(7,8) is considered in the analysis.
Figure 5. Sensor deploying map and artificial damage of Bridge-B.
During the experiment, 18 runs were carried out
for the intact bridge which comprises 4 runs under vehicle speed of 10km/h, 7 runs under vehicle speed of 20km/h and 7 runs under vehicle speed of 40km/h. For the damage bridge, 15 runs were car-ried out, which comprises 3 runs under vehicle speed of 10km/h, 6 runs under vehicle speed of 20km/h and 6 runs under vehicle speed of 40km/h.
2.2 On-site experiment on single-span steel truss bridge
For Bridge B, five different damage scenarios were considered: Intact (hereafter INTACT); cut half of
the section of DM1 member (Damage scenario 1, hereafter D-SCN1); cut the whole section of DM1 member (Damage scenario 2, hereafter D-SCN2); recover damage of DM1 member by welding thins plates onto the surface of the member (hereafter RECOVERY); and cut the whole section of DM2 member (Damage scenario 3, hereafter D-SCN3) as shown in Figure 5. 8 accelerometers were installed to measure vertical acceleration responses. Two ac-celerometers for the lateral responses were also in-stalled at points 3 and 4. However this study focused on the vertical responses only hence discussion on the lateral responses is omitted in this paper.
It is also noteworthy that the design tensile force of the DM1 member under dead load is around 34kN, and that of the DM2 member is around 102kN due to dead load.
A van-type vehicle, Serena produced by Nissan, was used in the moving vehicle experiment. The weight of the vehicle is around 21kN. In the experi-ment, 26 runs were carried out for the intact bridge which comprises 11 runs under vehicle speed of 30km/h, 10 runs under vehicle speed of 40km/h and 5 runs under vehicle speed of 50km/h. For the dam-age bridge, 12 runs for the D-SCN1 and 10 runs re-spectively for D-SCN2 and D-SCN3 under vehicle speed of 40km/h were performed for each damage scenario.
3 OUTLIER ANALYSIS
The Mahalanobis-Taguchi System (MTS) is adopted as a tool for multivariate outlier analysis, which is used in diagnostic applications to make quantitative decisions by constructing a multivariate measure-ment scale called Mahalanobis distance (Taguchi & Jugulum 2000) (hereafter MD). In the MTS, the Mahalanobis space (MS) is obtained using the standardized variables of normal data. The MS can be used to discriminate normal and abnormal data.
In applying MTS, firstly we have to construct a measurement scale with MS as a reference: this is done using the data from a normal group and calcu-lating their MDs, whose value should be close to 1. The standardized normal data are obtained using Equation 1.
𝑧𝑖𝑝 =
𝑥𝑖𝑝
−𝜇𝑖
𝜎𝑖 (1)
where 𝑧𝑖𝑝 indicates the standardized p-th tuple of
normal data for i-th variable; 𝑥𝑖𝑝, the p-th tuple of
normal data for i-th variable; 𝜇𝑖 (=1
𝑛∑ 𝑥𝑖
𝑝𝑛𝑝=1 ) ,
mean value of the i-th variable defined as; and
𝜎𝑖 (=1
𝑛√∑ (𝑥𝑖
𝑝 − 𝜇𝑖)2𝑛
𝑝=1 ), the standard deviation
of i-th variable. If 𝐙𝑝 = (𝑧1𝑝, 𝑧2
𝑝, ⋯ , 𝑧𝑘𝑝) and
1 2 3 4 5
6 7 8
P1 P2
DM1
DM2
: Vehicle path
: Photoelectric switch
: Wired accelerometer
(1-8: sensor ID)

𝐂 ∈ ℝ𝑘×𝑘 denotes correlation matrix for k standard-
ized variables, then MD calculated for the p-th tuple
of normal data in a sample size n with k variable is
given by
𝑀𝐷𝑝 = 𝐷𝑝2 =
1
𝑘𝐙𝑝
𝑇𝐂−1𝐙𝑝 (2)
Next, the signal space is obtained from abnormal data or newly monitored data. Abnormal data are al-so standardized utilizing mean and standard devia-tion values of the normal data as
𝑦𝑖𝑝 =
𝑤𝑖𝑝
−𝜇𝑖
𝜎𝑖 (3)
The 𝑀𝐷𝑝 of the normalized abnormal data in the signal space can be defined by Equation 4 from the normalized abnormal data and C, which is obtained from known data. If newly monitored data is abnor-mal, the 𝑀𝐷𝑝 should be considerably greater than one.
𝑀𝐷𝑝 = 𝐷2𝑝 =
1
𝑘𝐘𝑝
𝑇𝐂−1𝐘𝑝 (4)
where 𝐘𝑝 = (𝑦1𝑝
, 𝑦2𝑝
, ⋯ , 𝑦𝑘𝑝
) .
The required conditions to utilize MTS are as fol-lows: the number of variables k of normal data is equivalent to that of abnormal data; the number of observation data n is larger than that of variable k; and the standard deviation of normal data 𝜎𝑖 is not zero.
This study utilizes the outliers crossing a thresh-old for structural damage diagnosis. In deciding the threshold, the largest and smallest values of MD tak-en from the cross-validation were removed, and the trimmed mean value was adopted as the threshold using (n-2) MD distances to reduce the effect of out-liers on the MDs. The n-fold cross-validation was al-so adopted for assessing how the results of a statis-tic analysis will generalize to an independent data set (Bishop 2006).
4 DAMAGE-SENSITIVE FEATURE
The linear dynamic system can be modeled by the AR model (Ljung 1999, Kim et al. 2012) as
𝑦(𝑘) + ∑ 𝑎𝑖𝑦(𝑘 − 𝑖) = 𝑒(𝑘)𝑝𝑖=1 (5)
where y(k) denotes the output of the system, ai is the i-th order AR coefficient and e(k) indicates the noise term.
The coefficient ap is related to the pole of the sys-tem because the z-transformation of Equation 5 can be written as
𝑌(𝑧) = 𝐻(𝑧)𝐸(𝑧) =1
1+∑ 𝑎𝑖𝑧−𝑖𝑝𝑖=1
𝐸(𝑧) (6)
where Y(z) and E(z) are z-transformations of y(k) and e(k), H(z) is the transfer function of the system in the
discrete-time complex domain, and 𝑧−𝑖 denotes the forward shift operator.
Values of z in which the elements of the transfer function matrix show infinite values are the poles. This means that the denominator of the transfer function is the characteristic equation of the dynamic system, given as
𝑧𝑝 + 𝑎1𝑧𝑝−1 + 𝑎2𝑧𝑝−2 + ⋯ + 𝑎𝑝−1𝑧 + 𝑎𝑝 = 0 (7)
The poles on the complex plane are associated with the frequency and damping constant of the dy-namic system of structures, as follows:
𝑧𝑘 = exp (−ℎ𝑘𝜔𝑘 ± 𝑗𝜔𝑘√1 − ℎ𝑘2) (8)
where ℎ𝑘 and 𝜔𝑘 are the damping constant and circular frequency, respectively, of the k-th mode of the system, and j represents the imaginary unit.
The poles 𝑧𝑘 of Equation 6 are obtained by find-ing the roots of the AR coefficient polynomial in the denominator of H(z). The number of poles in the z-plane equals the AR model order. It should be noted that AR coefficients can be defined by sums and products of its roots 𝑧𝑘 in Equation 8 according to Vieta’s formula (Bold 1982). In other words, AR coefficients are directly associated with the modal parameters such as ωk and hk in Equation 8, and AR coefficients are also affected by damage. Therefore the parameter from AR coefficients is adopted as a damage-sensitive feature and defined as
𝐷𝐼𝑗 =|𝑎1|
√∑ 𝑎𝑖2𝑗
𝑖=2
(9)
where ai denotes the i-th AR coefficient and 𝐷𝐼𝑗 is the damage indicator (DI) that considers up to the j-th AR coefficient. Kim et al. (2013) show potential of damage detection of a scaled bridge utilizing the damage-sensitive feature through a laboratory mov-ing-vehicle experiment.
5 STRUCTURAL DAMAGE DIAGNOSIS BY OUTLIER DETECTION
Damage detection of the bridge is carried out utiliz-ing the DI and MTS. The 𝐷𝐼3 (Nair et al. 2006) is used in this study, since the first AR coefficient is the most dominant among the coefficients and the influence of higher order coefficients decreases dras-tically with respect to time (Kim et al. 2013).
The MTS requires a rather larger number of ob-servations than the number of variables or sensors. However only a limited number of runs were carried out in the field experiment in order to reduce time and cost. Therefore this study utilized data from sen-sor groups to reduce the number of sensors which is considered as the number of variables in MTS since reducing the number of variables in MTS results in a

similar effect of increasing the number of observa-tions relatively.
5.1 Continuous-span steel truss bridge
In applying MTS to damage detection of the nine-span continuous bridge, Bridge-A, four different sensor groups are considered as shown in Figure 4: Group 1 utilizes all the observation data from the 7 observation points, 4 and 6 to 11, for the damage de-tection; Group 2 utilizes all the observation data from the 4 observation points, 4, 7, 9, 11; Group 3 utilizes the data from two adjacent observation points for detecting even the damage location; and Group 4 utilizes the observation points except the two observation points near the damaged member, points 3 and 5 in Group 3, to examine the feasibility of detecting damage location without considering data from the sensors near the damage. Examples of the measured acceleration responses before and after severing the member are shown in Figure 6.
Results of MTS considering Group 1 and Group 2 are shown in Figure 7, in which the red horizontal line denotes the threshold. Figure 7 shows that most of the MDs of damage cross the threshold, and indi-cates high possibility of anomalous events in the bridge. It is obvious that for Group 2 the probability of MDs of the n-fold cross-validation crossing the threshold is lower than that of Group 1, which indi-rectly proves the fact that more observations can provide more stable results. The same conclusion was deduced for the other sensor groups investigated and is omitted for brevity.
Detecting the damage location is carried out using Group 3, and MDs are plotted as shown in Figure 8a). Apparently, the probability of crossing the threshold was higher for the group containing obser-vation points near the damaged member as shown in Figure 8b). The result of detecting the damage loca-tion is natural since the result considers the data of two additional sensors deployed near the damaged
member, although it is a rather unrealistic idea to predict the damaged member and deploy sensors around that member for monitoring.
a)
b) Figure 7. MDs of DI of Bridge -A: a) Group 1; b) Group 2.
a)
b)
Figure 8. MTS results of Group 3 of Bridge-A: a) MDs; b) Per-centage of MDs crossing the threshold, and mean length from the threshold of the MDs which cross the threshold.
Percentage crossing threshold
0% 38% 100%
Percentage crossing threshold
7% 31% 100%
Cross Validation
Damage
a)
b)
Figure 6. Vehicle-induced vibrations of Bridge-A: a) Intact
(v=40 km/h, Run 1); b) Damage (v=40 km/h, Run 3).
a)
b)
Figure 9. MTS results of Group 4 of Bridge-A: a) MDs; b) Per-centage of MDs crossing the threshold, and mean length from the threshold of the MDs which cross the threshold.
This study also examines the feasibility of detect-ing damage location utilizing all observation points except the two observation points near the damaged member (Group 4). The results are summarized in Figure 9, which shows difficulty of identifying the damage location despite the results providing infor-mation about an anomaly in the observation data.
5.2 Single-span steel truss bridge
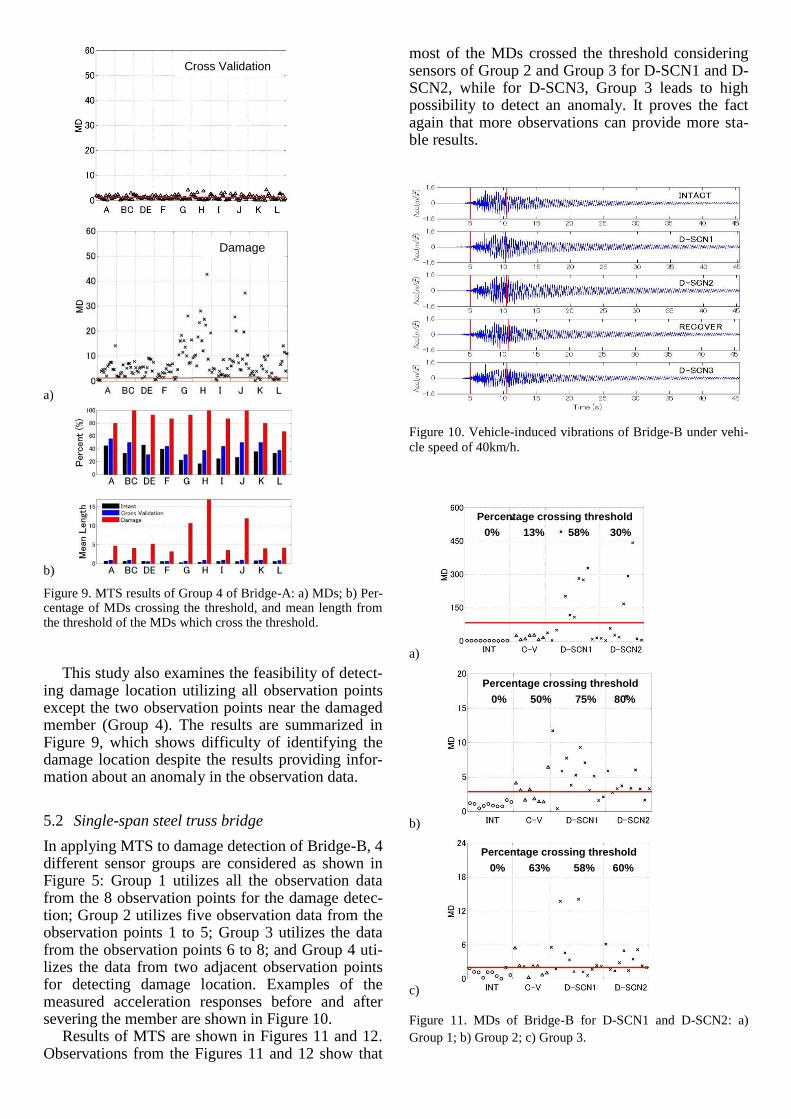
In applying MTS to damage detection of Bridge-B, 4 different sensor groups are considered as shown in Figure 5: Group 1 utilizes all the observation data from the 8 observation points for the damage detec-tion; Group 2 utilizes five observation data from the observation points 1 to 5; Group 3 utilizes the data from the observation points 6 to 8; and Group 4 uti-lizes the data from two adjacent observation points for detecting damage location. Examples of the measured acceleration responses before and after severing the member are shown in Figure 10.
Results of MTS are shown in Figures 11 and 12. Observations from the Figures 11 and 12 show that
most of the MDs crossed the threshold considering sensors of Group 2 and Group 3 for D-SCN1 and D-SCN2, while for D-SCN3, Group 3 leads to high possibility to detect an anomaly. It proves the fact again that more observations can provide more sta-ble results.
Figure 10. Vehicle-induced vibrations of Bridge-B under vehi-
cle speed of 40km/h.
a)
Percentage crossing threshold
0% 13% 58% 30%
b)
Percentage crossing threshold
0% 50% 75% 80%
c)
Percentage crossing threshold
0% 63% 58% 60%
Figure 11. MDs of Bridge-B for D-SCN1 and D-SCN2: a)
Group 1; b) Group 2; c) Group 3.
Cross Validation
Damage
a)
Percentage crossing threshold
0% 13% 0%
b)
Percentage crossing threshold
0% 38% 20%
c)
Percentage crossing threshold
0% 38% 80%
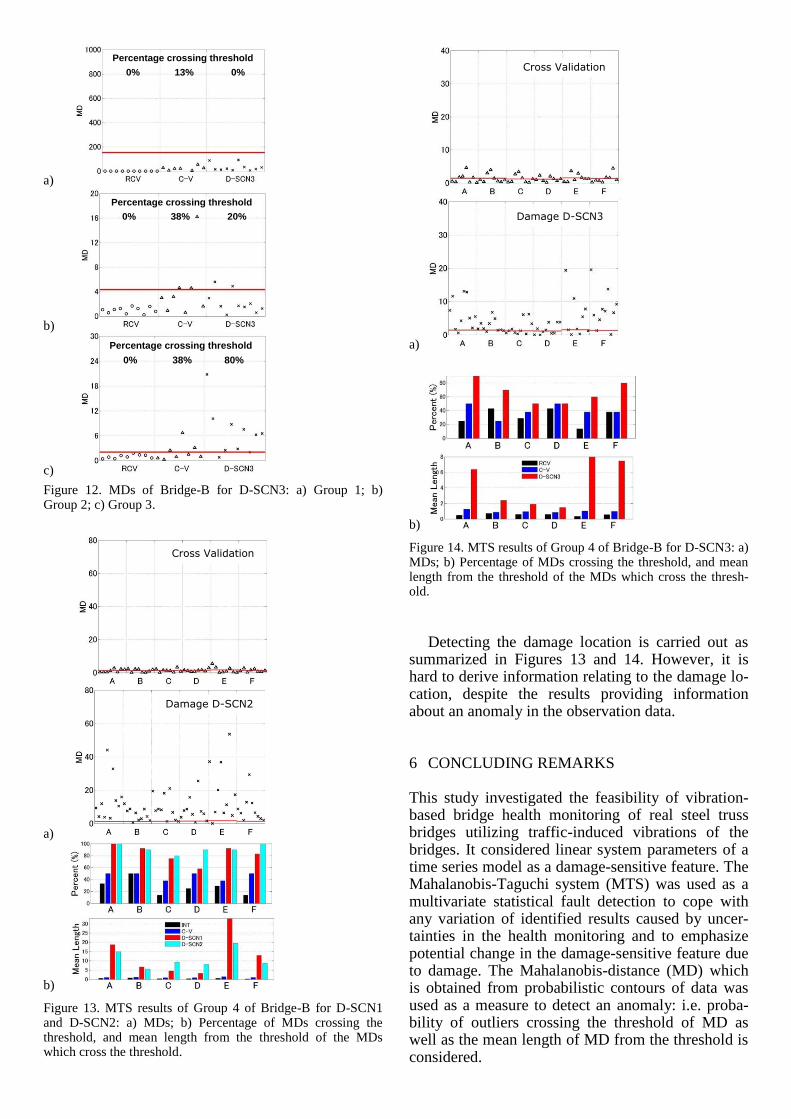
Figure 12. MDs of Bridge-B for D-SCN3: a) Group 1; b) Group 2; c) Group 3.
Cross Validation
a)
Damage D-SCN2
b)
Figure 13. MTS results of Group 4 of Bridge-B for D-SCN1 and D-SCN2: a) MDs; b) Percentage of MDs crossing the threshold, and mean length from the threshold of the MDs which cross the threshold.
Cross Validation
a)
Damage D-SCN3
b)
Figure 14. MTS results of Group 4 of Bridge-B for D-SCN3: a) MDs; b) Percentage of MDs crossing the threshold, and mean length from the threshold of the MDs which cross the thresh-old.
Detecting the damage location is carried out as summarized in Figures 13 and 14. However, it is hard to derive information relating to the damage lo-cation, despite the results providing information about an anomaly in the observation data.
6 CONCLUDING REMARKS
This study investigated the feasibility of vibration-based bridge health monitoring of real steel truss bridges utilizing traffic-induced vibrations of the bridges. It considered linear system parameters of a time series model as a damage-sensitive feature. The Mahalanobis-Taguchi system (MTS) was used as a multivariate statistical fault detection to cope with any variation of identified results caused by uncer-tainties in the health monitoring and to emphasize potential change in the damage-sensitive feature due to damage. The Mahalanobis-distance (MD) which is obtained from probabilistic contours of data was used as a measure to detect an anomaly: i.e. proba-bility of outliers crossing the threshold of MD as well as the mean length of MD from the threshold is considered.

The damage indicator, a damage-sensitive feature derived from the coefficient of the AR model, com-bining with MTS was successfully applied to detect damage of the real steel truss bridges even utilizing the vehicle-induced vibration data. Denser sensor deployment near the damage member led to success in detecting damage location. However detection of damage location was unsuccessful after excluding the sensors near the damage member in the damage detection procedure. It also showed that more obser-vations can provide more stable results from a statis-tical point of view.
Comparing results of Bridge-A (nine-span con-tinuous bridge) with those of Bridge B (single-span bridge), mean values and probability of MD crossing the threshold of Bridge-A clearly showed higher possibility of detecting an anomalous event. One reason for the difference of accuracy in the statistical fault detection could be the severity of external loads since the external loading effect on vibrations of Bridge-A was more severe than those of Bridge-B.
The proposed damage detection approach which is based on the multivariate statistical fault detection is nonetheless applicable to BHM of real truss bridges. However, more comprehensive investiga-tion is needed to clarify the reason for the failure to detect damage location of the single span bridge un-der a light moving vehicle and for the nine-span con-tinuous bridge after removing the sensors near the damaged member under consideration. Future re-search will also focus on deciding the optimal num-ber of sensors.
ACKNOWLEDGEMENT
This study is partly sponsored by JSPS, “Grant-in-Aid for Scientific Research (B) under project No. 24360178.” The third author, K.C. Chang, is spon-sored by “the JSPS Postdoctoral Fellowship for For-eign Researchers” Program. Such financial aids are gratefully acknowledged. The support from Osaka prefecture for the on-site experiment of the continu-ous-span steel truss bridge, and from Nara prefecture for the on-site experiment of the single-span steel truss bridge are also gratefully acknowledged.
REFERENCES
Bishop, C M. 2006. Pattern Recognition and Machine Learn-
ing, Springer.
Bold, B. 1982. Famous problems of geometry and how to solve
them. New York, Dover.
Carden, E and Brownjohn, J. 2008. Arma modelled time-series
classification for structural health monitoring of civil infra-
structure. Mechanical Systems and Signal Processing, 22
(2): 295–314. Catbas, FN and Aktan, AE. 2002. Modal analysis for damage
identification: past experiences and Swiss Z-24 bridge,
in: Proceedings of IMAC 20: International Modal Analysis Conference, Los Angeles, CA: 448–456.
Deraemaeker, A, Reynders, E, De Roeck, G and Kullaa, J. 2007. Vibration-based structural health monitoring using output-only measurements under changing environment, Mechanical Systems and Signal Processing, 22(1): 34-56.
Doebling, SW, Farrar, CR, Prime, MB and Shevitz, DW. 1998, A review of damage identification methods that examine changes in dynamic properties. Shock and Vibration Digest, 30(2): 91-105.
He, X and De Roeck, G. 1997. System identification of me-chanical structures by a high-order multivariate autoregres-sive model. Computers and Structures, 64(1-4): 341-351.
Japan Road Association. 2009. A case studies on repairing and reinforcing highway bridges. Maruzen Co. Ltd. (in Japa-nese)
Kim, CW, Kawatani, M and Hao, J. 2012. Model parameter identification of short span bridges under a moving vehicle by means of multivariate AR model. Structure and Infra-structure Engineering, 8(5): 459-472.
Kim, CW, Isemoto, R, Sugiura, K, Kawatani, M. 2013. Struc-tural fault detection of bridges based on linear system pa-rameter and MTS method. J. of JSCE, JSCE, 1: 32-43.
Kopsaftopoulos, FP and Fassois, SD. 2010. Vibration based health monitoring for a lightweight truss structure: Experi-mental assessment of several statistical time series methods. Mechanical Systems and Signal Processing, 24(7): 1977–1997.
Lee, JJ and Yun, CB. 2006. Damage diagnosis of steel girder bridges using ambient vibration data. Engineering Struc-tures, 28(6): 912–925.
Ljung, L. 1999. System identification-Theory for the user, 2nd Ed. PTR Prentice Hall, Upper Saddle River, M. J.
Nair, KK, Kiremidjian, AS and Law, KH. 2006. Time series-based damage detection and localization algorithm with ap-plication to the ASCE benchmark structure. J. of Sound and Vibration, 291(1-2): 349-368.
National Transportation Safety Board. 2008. Collapse of I-35W Highway bridge, Minneapolis, Minnesota, August 1, 2007. Highway Accident Report NTSB/HAR-08/03. Washington, DC.
Salawu, OS. 1997. Detection of structural damage through changes in frequency: A review. Engineering Structures, 19: 791-808.
Shinozuka, M, Yun, CB and Imai, H. 1982. Identification of linear structural dynamic systems. J. Engg. Mech. Div., ASCE, 108(6): 1371-1390.
Sohn, H, Farrar, C, Hunter, N and Worden, K. 2001. Structural health monitoring using statistical pattern recognition tech-niques. Journal of Dynamic Systems, Measurement, and Control, 123 (4): 706–711.
Taguchi, G and Jugulum, R. 2000. New trends in multivariate
diagnosis. Indian Journal of Statistics, 62(B): 233-248. Wang, L, Chan, THT, Thambiratnam, DP, Tan, ACC and
Cowled, CJL. 2012. Correlation-based damage detection for complicated truss bridges using multi-layer genetic al-gorithms. Advances in Structural engineering, 15(5): 693-706.
Yamada, K. 2008. An advice from rupture into a diagonal member of Kisogawa bridge. JSCE Magazine Civil Engi-neering, 93(1):29-30. (in Japanese)
Yoshioka, T, Takahashi, M, Yamaguchi, H and Matsumoto, Y. 2011. Damage Assessment of Truss Diagonal Members Based on Frequency Changes in Local Higher Modes. Pro-cedia Engineering, 14: 3119–3126.