structural, electronic and vibrational properties of...
TRANSCRIPT
IOP PUBLISHING JOURNAL OF PHYSICS: CONDENSED MATTER
J. Phys.: Condens. Matter 21 (2009) 485404 (12pp) doi:10.1088/0953-8984/21/48/485404
Structural, electronic and vibrationalproperties of tetragonal zirconia underpressure: a density functional theory studyVictor Milman1, Alexander Perlov1, Keith Refson2,Stewart J Clark3, Jacob Gavartin1 and Bjoern Winkler4
1 Accelrys, 334 Science Park, Cambridge CB4 0WN, UK2 Rutherford Appleton Laboratory, Chilton, Didcot, Oxfordshire OX11 0QX, UK3 Department of Physics, University of Durham, South Road, Durham DH1 3LE, UK4 Institut fur Geowissenschaften, Abteilung Kristallographie, Johann WolfgangGoethe-Universitat Frankfurt, Altenhoferallee 1, D-60438, Frankfurt am Main, Germany
E-mail: [email protected]
Received 23 September 2009Published 6 November 2009Online at stacks.iop.org/JPhysCM/21/485404
AbstractWe present the results of a plane wave based density functional study of the structure andproperties of tetragonal zirconia in the range of pressures from 0 to 50 GPa. We predict atransition to a fluorite-type cubic structure at 37 GPa which is likely to be of a soft mode originand is accompanied by a power law decrease of the frequency of the Raman-active A1g mode. Adetailed study of the pressure effect on phonon modes is given, including theoretical Ramanspectra and their pressure dependence. Our results provide a consistent picture of thepressure-induced phase transition in tetragonal zirconia.
1. Introduction
Zirconia, ZrO2, is an extremely important ceramic material formodern technological applications. It has useful mechanicalproperties for manufacturing of medical devices [1], andgenerally excellent characteristics for engineering applica-tions [2]. One of the most important features that definethe mechanical properties of zirconia is the transformationtoughening mechanism [3]. At ambient pressure, ZrO2
has three polymorphs, cubic (c-ZrO2), tetragonal (t-ZrO2)and monoclinic (m-ZrO2). Phase transformations betweencubic and tetragonal, and tetragonal and monoclinic phasesoccur on cooling from high temperatures. Remarkably, theground state monoclinic phase has an atomic density only96% of that of the cubic phase and 97% of that of thetetragonal phase. It is this anomalous property that makestransformation toughening possible. In view of this, theunderstanding of the interplay between mechanical propertiesof zirconia and its density becomes of paramount importance.A number of phase transformations in ZrO2 are known tooccur under hydrostatic pressure; for example, the monoclinicphase undergoes transitions to different orthorhombic phasesupon compression [4]. The complete P–T phase diagram of
zirconia [5, 6] demonstrates a rich variety of transformationsthat are possible in this system in response to changes inexternal parameters. These transformations are responsiblefor the high fracture toughness of zirconia based ceramics,although properties of actual engineering materials are affectedalso by structural defects, crystallite size, sample treatmenthistory, etc.
There is a long history of theoretical studies of propertiesand phase transformations of ZrO2. Density functionaltheory (DFT) is currently the method of choice for first-principles studies of crystalline materials, and a number ofDFT studies address fundamental issues of structure andproperties of various phases of zirconia [7, 8]. Latticedynamics is one of the central issues in such investigations,since it is expected that many transformations in theZrO2 phase diagram are related to the soft phonon modemechanism [9].
An important issue which arises when one comparestheoretical and experimental results is that the DFT studies areusually performed in the athermal limit, T = 0 K. Most phasesof ZrO2 are difficult to stabilize at low temperatures withoutapplying pressure or introducing dopants. The situation ismore promising in the case of the tetragonal modification,
0953-8984/09/485404+12$30.00 © 2009 IOP Publishing Ltd Printed in the UK1
J. Phys.: Condens. Matter 21 (2009) 485404 V Milman et al
which can be stabilized in nanocrystalline form at ambientpressure and room temperature without doping. Recentexperimental studies probed a number of important structuraland vibrational properties of t-ZrO2 [4, 5] including pressure-induced changes in its phonon spectrum [4]. In spite of theseinvestigations a number of open issues remain, in particularrelated to the assignment of vibrational modes. Therefore, afurther analysis of the pressure-induced changes in the phononspectrum as related to the suggested high pressure phasetransition [4] is required.
The present work is focused on the theoretical studyof structure and properties of t-ZrO2 under hydrostaticcompression, with particular emphasis on phonon frequenciesand Raman spectra. It has been suggested that externalpressure removes tetragonal distortions and the structuretransforms to a cubic modification via most probably a softmode mechanism [4]. The main experimental technique usedto diagnose a soft mode behaviour is Raman spectroscopy. Wepresent the first DFT results on the pressure dependence ofRaman frequencies and intensities and use these theoreticaldata to interpret experimental findings.
The overall structure of the paper is as follows. Section 2presents the computational set-up of the current investigation.We then present in section 3 our results for properties of t-ZrO2 at ambient pressure and provide a comprehensive criticalreview of the available experimental and theoretical data onthe structure, compressibility, elastic constants, Born effectivecharges, dielectric permittivity, and phonon frequencies of thispolymorph. The accuracy of these results allows us to proceedwith the study of the effect of compression on the structure andproperties (section 4), and this is followed by conclusions.
2. Computational methodology
The tetragonal modification of ZrO2 has space group 137(P42/nmc) with two formula units per cell. In the setting thatcorresponds to the origin choice 1 as defined in [10] there isa Zr atom located on the Wyckoff position 2a (0 0 0), and anO atom located on the Wyckoff position 4d (0 0.5 Oz). Thestructure is defined by three parameters: lattice constants aand c, and the z coordinate of the oxygen atom, Oz [11]. Theactual tetragonal phase represents only a slight modification ofthe fluorite structure of the cubic form c-ZrO2. The deviationfrom the ideal cubic arrangement is described via the tetragonaldistortion of the cell parameters, A = c
a√
2, and the internal
distortion, dz = Oz − 0.25. The cubic setting is characterizedby A = 1 and dz = 0.
All calculations were carried out using the DFT basedCASTEP code [12, 13]. The local density approximation,LDA, is used to represent the exchange–correlation functionalin the DFT formalism. It is known that for transitionmetal oxides a gradient-corrected approximation, GGA, to theexchange–correlation functional does not improve on the LDAdescription; the resulting structures overestimate bond lengthsand produce too low phonon frequencies [14, 15]. On the otherhand, GGA can produce more accurate formation energies,as was shown for zirconia polymorphs [16]. The pressureinduced phase transition studied here relies exclusively on the
effect of pressure on the crystal structure, electronic structureand vibrational properties and does not make use of relativeenergies of different phases; hence we adopted the LDAapproach.
The electron–ion interaction was represented in our cal-culations by norm-conserving pseudopotentials; the referenceconfigurations for valence electrons were 4s24p64d25s2 forzirconium (cut-off radii of 1.58, 1.73, 1.79 and 1.72 a.u.,respectively) and 2s22p4 for oxygen (cut-off radii of 1.34 and1.53 a.u., respectively). Pseudopotentials were generated usingthe designed nonlocal pseudopotential scheme of Rappe et al[17, 18] which was used to guarantee accurate valence states inunfrozen semicore potentials.
A plane wave basis set with the energy cut-off of 750 eVwas used to expand the wavefunctions. An 8 × 8 ×6 Monkhorst–Pack grid [19] was used for Brillouin zoneintegration (30 points in the irreducible part of the Brillouinzone). The SCF convergence criterion was set to 1 ×10⁻⁸ eV/atom. Lattice parameters were converged to 2×10⁻⁵
A and fractional atomic coordinates to 1×10⁻⁵ as compared tocalculations using a higher energy cut-off of 900 eV and a moreaccurate k-point grid of 14 × 14 × 10 (140 irreducible points).A smaller set of k-points, 5 × 5 × 3 (12 irreducible points),has been used in earlier studies (e.g., [8, 14, 20, 21]). Wefound that this setting can affect cell parameters by as much as0.001 A and does not provide converged results for the phononfrequencies and dielectric properties that are sensitive to thecrystal structure.
The pressure response of t-ZrO2 was studied bycalculating its P—V equation of state, EOS, for appliedpressures up to 50 GPa. The lattice parameters and oxygenposition were optimized at each value of the external pressure,so that the volume could be determined. The structures wereconsidered converged when the z component of the force onoxygen atom was less than 0.0005 eV A
−1, and the maximum
component of the stress tensor was less than 0.01 GPa.The resultant EOS was fitted using the third-order Birch–Murnaghan analytical expression [22] to produce the bulkmodulus, B , and its pressure derivative, B ′. Physical propertiesof t-ZrO2 including the band structure, optical properties,vibrational frequencies, dielectric permittivity, Born charges,and infrared and Raman intensities were calculated for eachpoint of the EOS.
These structural optimizations yield an equation of statein the ‘athermal limit’, where the effect of both zero-point energy and temperature is neglected. The quasi-harmonic approximation models a thermal correction underthe assumption that the dominant contribution arises from thechange in vibrational free energy under thermal expansion dueto the volume dependence of the phonon frequencies. Usingthe results of our lattice dynamics calculations at the � pointwe computed the vibrational free energy as a function ofvolume. This gives a zero-point and thermal contribution to thepressure of 2.2 GPa, in the pressure range from 0 to 30 GPa.However the quasi-harmonic approximation is not valid in thevicinity of a soft mode phase transition, where anharmonicityis large and the harmonic expression for the vibrational freeenergy does not apply. The contribution of the remaining hard
2
J. Phys.: Condens. Matter 21 (2009) 485404 V Milman et al
modes which do not exhibit any large anomaly through thephase transition (see figure 6) will remain roughly constant,but there is no effective means within the scope of the theoryused here to compute the soft mode contribution. Consequentlywe choose to report pressures in the text and figures in theathermal limit unless stated otherwise.
Variational density functional perturbation theory, DFPT,was used to evaluate the lattice dynamics and the response toan electric field [23]. Raman activities were computed usinga hybrid method combining density functional perturbationtheory with finite displacements. The Raman activity tensor ofa mode is given by the derivative of the dielectric permittivitytensor with respect to the mode amplitude. This wasevaluated using a numerical approximation of the centraldifference between permittivity tensors computed using DFPTat geometries displaced from equilibrium by small positive andnegative amplitudes according to the mode eigenvector. Thismethod is similar to that of Porezag and Pedersen [24] exceptfor our use of DFPT to compute the dielectric permittivity.
There exist a large body of experimental and theoreticalresults for t-ZrO2 properties at ambient conditions. It shouldbe noted that comparisons of theoretical data to experimentcan be difficult since some of the experimental results referto materials stabilized by impurities, or to high temperatureproperties, while calculations are performed on a pure materialat 0 K. Nevertheless a comparison of our results to otheravailable data can be used to judge the accuracy of the currentzero-pressure calculations.
There is little information about the behaviour of thetetragonal phase of pure zirconia under pressure [4, 5]. Themain goal of the subsequent discussion is to analyse the highpressure behaviour in connection with the changes in thephonon spectrum and their relationship to pressure-inducedphase transitions. An analysis of the Raman mode evolution [4]based purely on experimental data was not sufficient to explainthe experimentally observed transition from the tetragonal tocubic modification [5].
3. Properties of tetragonal zirconia at ambientpressure
This section presents our results for various lattice properties oft-ZrO2 at zero pressure in comparison with experimental dataand other DFT results. Such an analysis establishes the level ofexpected accuracy of the present calculations and is a necessaryprerequisite for a phase transition study.
3.1. The structure of tetragonal zirconia
There are a wealth of experimental reports on the structuret-ZrO2; however, care needs to be exercised in selectingthe structure that can be used to validate theoretical resultsfor pure zirconia in the athermal limit. Pure t-ZrO2 hasbeen studied using single-crystal x-ray diffraction at hightemperature [11] and later at room temperature [4]. Aneutron powder diffraction study of pure t-ZrO2 has beenperformed at room temperature [25] and down to cryogenictemperatures [26, 27]; the results can be compared to thosefrom neutron powder diffraction analysis of yttria-stabilized t-ZrO2 [28]. A compilation of experimentally reported structural
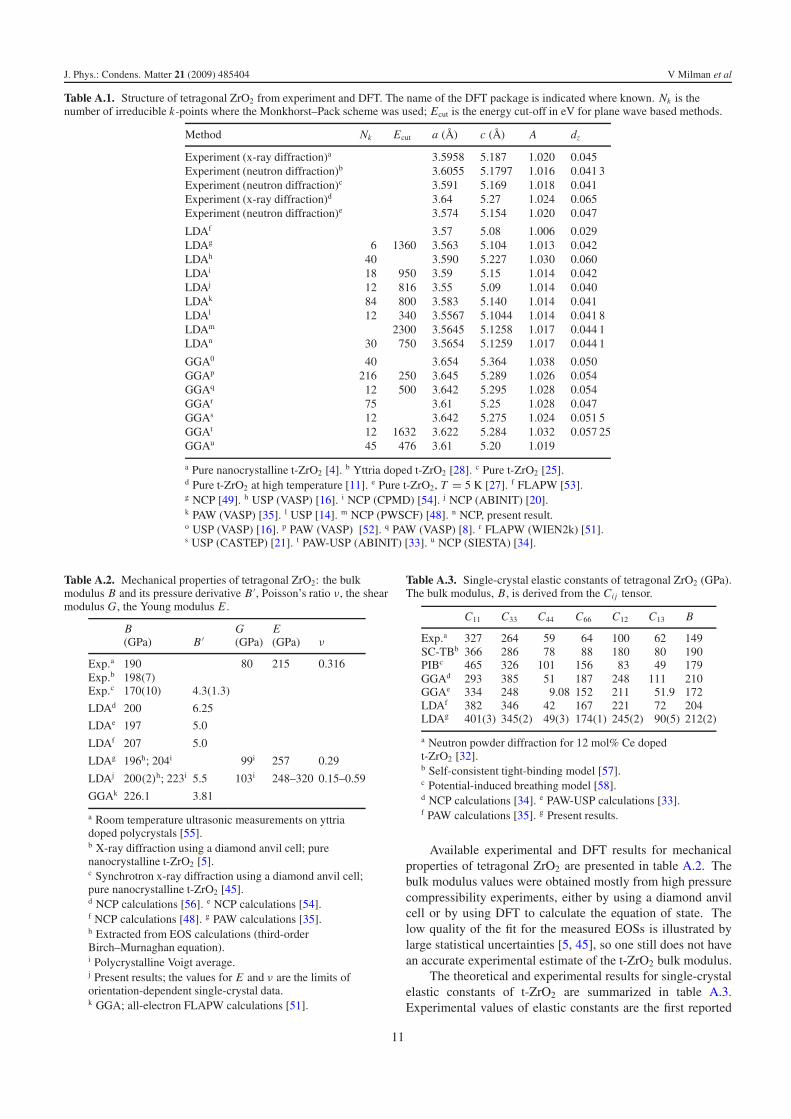
parameters is given in table A.1. It has to be noted thatexperimental results for nanocrystalline zirconia can exhibita strong dependence of structural parameters and vibrationalfrequencies upon the crystallite size. This size has to besufficiently small for the tetragonal phase to stabilize, butnot so small as to distort bulk-like properties. It appearsfrom experimental x-ray diffraction and Raman spectroscopystudy that the recommended crystallite size range is 10–20 nm [29, 30]. We suggest that the neutron diffraction resultsobtained at 5 K for samples with the grain size of 13 nmprovide the most accurate description of the structure of pure t-ZrO2 [27]. This structure is characterized by a = 3.5742(3) A,c = 5.1540(8) A, with tetragonal distortion parameters A =1.0196 and dz = 0.0473(4).
DFT studies of zirconia polymorphs have a long history.The structures of cubic and tetragonal modifications are fairlysimple and require only modest computational resources,and hence have been studied since the early days of DFTapplications to solid state problems. A number of DFT resultsfor t-ZrO2 published in the last two decades are collectedin table A.1 and compared to experimental data. Table A.1groups LDA and GGA results separately and the underbindingeffect of GGA can be seen clearly since the cell volume isoverestimated by 5–6%. LDA overbinding errors are lesspronounced—the volume is underestimated by about 1%, afraction of the GGA error. Our LDA result gives a =3.5654 A, c = 5.1258 A, A = 1.0166 and dz = 0.0441 ingood agreement with experiment and with other accurate LDAcalculations.
Table A.1 shows a similarity between converged theoret-ical studies that use different pseudopotential schemes: theprojector augmented wave method (PAW), norm-conservingpseudopotentials (NCP) or ultrasoft pseudopotentials (USP).The results of pseudopotential calculations also agree wellwith the all-electron FLAPW data. This indicates that thereis no transferability issue in well converged pseudopotentialDFT calculations. This compilation of structural data alsoprovides a guide to the sensitivity of the results obtained tosuch parameters as temperature and doping in the case ofexperimental data, and the k-point sampling and basis set sizein the case of calculations.
3.2. Compressibility and elastic constants
We compare calculated elastic characteristics of t-ZrO2 toknown data in order to confirm that the response of thelattice to applied strain is reproduced accurately in DFTcalculations. Available experimental and DFT results formechanical properties and single-crystal elastic constants oftetragonal ZrO2 are summarized in tables A.2 and A.3,respectively. The bulk modulus of single-crystalline t-ZrO2 canbe estimated at about 190(10) GPa from experimental studies,and our calculated values of 200(2) GPa in the athermallimit and 183(2) GPa taking into account quasi-harmoniccorrections are in good agreement with this estimate and withother theoretical results (table A.2).
Voigt-averaged results for B and G in table A.2 representan upper limit for polycrystalline moduli. Alternative
3
J. Phys.: Condens. Matter 21 (2009) 485404 V Milman et al
averaging schemes of Reuss and Hill were applied to ourcalculated elastic constants and produced respectively (all inGPa): BR = 212, BH = 217, GR = 76, and GH = 89.The Poisson ratio and Young modulus are strongly orientationdependent, as indicated in table A.2; our results agree well withthe scarce data available for polycrystals.
Single-crystal elastic constants of t-ZrO2 were calculatedby applying finite strains and linearly fitting the calculatedstrain–stress dependences as described in [31]. The internaldegrees of freedom are optimized for each strained structure.These calculations were carried out in two different ways:(i) using the correct crystal symmetry, where strainedstructures possessed the tetragonal symmetry reduced inaccordance with the applied strain; and (ii) using the P1version of the structure. The latter approach was utilized toaccount for the possible softening of elastic constants as aresult of symmetry breaking under external stress. The effect ofassociated relaxations resulted in a decrease of the value of C13
by about 10 GPa and had very little effect on any other elasticconstant. The theoretical single-crystal elastic constants aregiven in table A.3 in comparison to other published results. Thebulk modulus as obtained from Ci j coefficients is 212(2) GPaand thus is in reasonable agreement with the EOS result.
It is clear from table A.3 that the bulk modulus evaluatedfrom experimental elastic constants [32] is considerably lowerthan our calculated value and experimental estimates fromhydrostatic compression (table A.2). The difference may berelated to the fact that the experiment [32] was conductedon a ceria doped material. One could also note that thetechnique relies on the reference value of the Young modulusin addition to the diffraction data. The single-crystal Youngmodulus is orientation dependent, and according to our resultsits value is between 248 GPa (perpendicular to the c axis)and 320 GPa (along the c axis). If we multiply the datafrom [32] by a scaling factor to account for a different valueof the Young modulus, we get some Ci j components andthe bulk modulus in better agreement with DFT calculations.However, the discrepancy for the off-diagonal terms remainslarge or becomes worse, suggesting that either this techniqueis not sufficiently accurate for determining elastic constantsof t-ZrO2, or that ceria doping has a strong effect on elasticproperties.
The two most recent GGA calculations [33, 34] stronglydisagree with each other as regards nearly all components ofthe elastic constants tensor (table A.3). It is likely that thek-point sampling used in [33] is not sufficiently accurate; itresults in an overestimated tetragonal distortion A (table A.1)and strongly underestimated elastic constants for the tetragonalphase.
Our LDA result for elastic constants is consistent withearlier LDA calculations [35] and with the measured bulkmodulus, and represents a reliable estimate of t-ZrO2 elasticproperties.
3.3. Born effective charge tensors
The Born effective charge tensor Z∗ki j can be defined in two
equivalent ways. The charge can be thought of either as a
Table 1. Born charges of tetragonal ZrO2.
LDAa LDAb LDAc
Z∗Zr11 5.75 5.74 5.89
Z∗Zr33 5.09 5.15 5.11
Z∗O11 −3.53 −3.52 −3.70
Z∗O22 −2.22 −2.49 −2.19
Z∗O33 −2.53 −2.57 −2.56
a USP calculations [14].b NCP calculations usingABINIT [20].c NCP calculations, presentresult.
force in the direction i on the atom k as a result of applyinga unitary electric field along the direction j , or as the inducedpolarization in the direction i due to the unitary displacement inthe direction j of all atoms k. The Born effective charge tensorsare diagonal in the high symmetry structure of t-ZrO2 [20].The charge tensor of Zr atoms is diagonal with only twoindependent components, along and perpendicular to the c axis(Z∗Zr
11 and Z∗Zr33 ). The Born effective charge tensor of O atoms
is diagonal with three inequivalent components, Z∗O11 , Z∗O
22 andZ∗O
33 .We present calculated LDA values at ambient pressure in
table 1. Our data are in good agreement with the previousresults and reproduce well the strong anisotropy of the Borneffective charge tensor on oxygen atoms. The discrepancybetween our results and earlier findings [14, 20] is well withinthe range that can be attributed to differences in the theoreticalground state structures.
3.4. The dielectric permittivity tensor
The frequency-dependent dielectric tensor of tetragonal ZrO2
is diagonal and has two independent components: εxx = εyy
perpendicular to the c axis, and εzz along the c axis. There aretwo contributions to the dielectric tensor, electronic and lattice(phonon). The static value, ε0, includes both contributionswhile the optical limit, ε∞, includes only the electroniccontribution. Available LDA results for these properties arecompared in table 2. The results from [14] include only thelattice contribution, ε0 − ε∞.
The best, although approximate, way to comparecalculated single-crystal results to experimental data obtainedon polycrystalline samples is to average the components ofthe computed tensor to produce ε = 2εxx +εzz
3 . The resultsare included in table 2 and show a qualitative agreement withother calculations and with experiment. Overestimation of thedielectric tensors illustrated in table 2 is common for the LDAlevel of theory [20].
The asymmetry of the static dielectric tensor is clearlydue to the lattice contributions from IR-active modes, since theelectronic contribution ε∞ is nearly isotropic.
3.5. Phonon frequencies at the � point
An accurate description of phonon frequencies is a stringenttest for a theoretical model. There are a number of
4
J. Phys.: Condens. Matter 21 (2009) 485404 V Milman et al
Table 2. Dielectric permittivity tensors of tetragonal zirconia.
LDAa LDAb LDAc Experimentd
ε0xx — 48.10 54.58
ε0zz — 20.31 20.23
ε0xx -εxx
∞ 41.6 42.36 48.54
ε0zz–ε∞
zz 14.9 15.03 14.82
ε0 — 38.84 43.13 34.5–39.8
ε∞xx — 5.74 6.04
ε∞zz — 5.28 5.41
ε∞ — 5.59 5.83 4.2–4.9
a USP calculations; only the lattice contribution isreported [14].b NCP calculations using ABINIT [20].c NCP calculations, present result.d Quoted from [20].
experimental data on vibrational modes of tetragonal zirconiafrom IR and Raman spectroscopy [36–39], as well as a body ofmodel [36, 40] and DFT [14, 20] calculated results. However, acontroversy still exists as regards the phonon mode assignment.An effort at resolving this issue has been offered in [36] andindependently in [20], but the resulting assignments still do notagree with each other.
Group theoretical analysis of optical modes (e.g., usingthe Bilbao Crystallographic Server [41]) shows that there aresix Raman-active modes (A1g, 2B1g, 3Eg), three IR-activemodes (A2u, 2Eu), and a silent mode (B2u) in tetragonalzirconia. Experiments have been performed mostly ontetragonal zirconia stabilized with dopants which explains thescatter of experimental data reported in table 3. The mostaccurate results available are from the Raman spectra of a puretetragonal phase [4, 36].
Our results for phonon frequencies are in good agreementwith the earlier LDA calculations and with experimental data(table 3). Note that the GGA frequencies [8] are much lessaccurate than the LDA ones for both IR- and Raman-activemodes, which supports our choice of the LDA functionalfor this study. The results of the symmetry analysis of the� point phonons confirm assignments from [20] with oneexception—we find that the Raman mode A1g (271 cm−1) hasa higher frequency than the IR-active mode with Eu symmetry(258 cm−1). This Raman frequency agrees very well with theresults for pure t-ZrO2 [4, 26, 36]. The assignment describedin table 3 is essentially equivalent to an earlier suggestion [43]and it finally disproves an alternative assignment from [38].
4. The pressure-induced transition to the cubic phase
The results presented in the previous section illustrate the levelof accuracy achievable in DFT calculations of ground stateproperties of tetragonal zirconia. The main motivation of thepresent study is to extend such calculations to explain thechanges of structure and properties under compression thatpotentially lead to a phase transition.
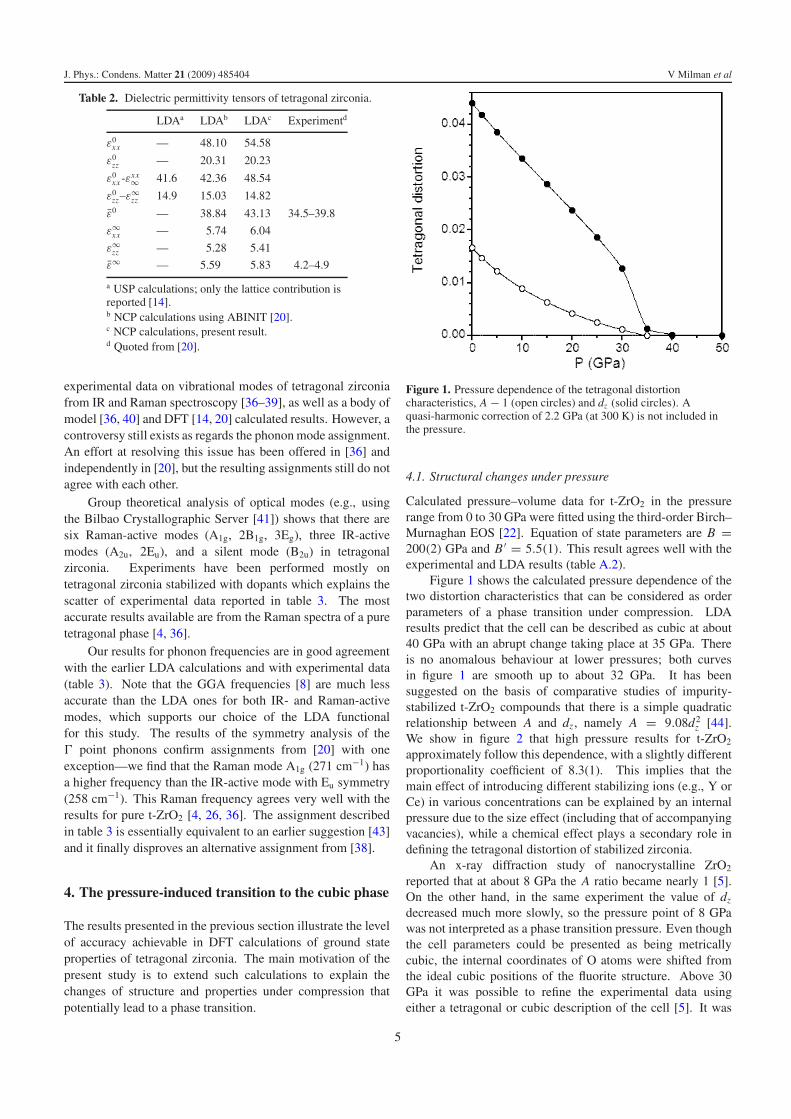
Figure 1. Pressure dependence of the tetragonal distortioncharacteristics, A − 1 (open circles) and dz (solid circles). Aquasi-harmonic correction of 2.2 GPa (at 300 K) is not included inthe pressure.
4.1. Structural changes under pressure
Calculated pressure–volume data for t-ZrO2 in the pressurerange from 0 to 30 GPa were fitted using the third-order Birch–Murnaghan EOS [22]. Equation of state parameters are B =200(2) GPa and B ′ = 5.5(1). This result agrees well with theexperimental and LDA results (table A.2).
Figure 1 shows the calculated pressure dependence of thetwo distortion characteristics that can be considered as orderparameters of a phase transition under compression. LDAresults predict that the cell can be described as cubic at about40 GPa with an abrupt change taking place at 35 GPa. Thereis no anomalous behaviour at lower pressures; both curvesin figure 1 are smooth up to about 32 GPa. It has beensuggested on the basis of comparative studies of impurity-stabilized t-ZrO2 compounds that there is a simple quadraticrelationship between A and dz , namely A = 9.08d2
z [44].We show in figure 2 that high pressure results for t-ZrO2
approximately follow this dependence, with a slightly differentproportionality coefficient of 8.3(1). This implies that themain effect of introducing different stabilizing ions (e.g., Y orCe) in various concentrations can be explained by an internalpressure due to the size effect (including that of accompanyingvacancies), while a chemical effect plays a secondary role indefining the tetragonal distortion of stabilized zirconia.
An x-ray diffraction study of nanocrystalline ZrO2
reported that at about 8 GPa the A ratio became nearly 1 [5].On the other hand, in the same experiment the value of dz
decreased much more slowly, so the pressure point of 8 GPawas not interpreted as a phase transition pressure. Even thoughthe cell parameters could be presented as being metricallycubic, the internal coordinates of O atoms were shifted fromthe ideal cubic positions of the fluorite structure. Above 30GPa it was possible to refine the experimental data usingeither a tetragonal or cubic description of the cell [5]. It was
5
J. Phys.: Condens. Matter 21 (2009) 485404 V Milman et al
Table 3. Phonon frequencies of tetragonal ZrO2. Assignments of experimental results follow analysis from [20]; the two modes marked with§ were incorrectly assigned in [20].
Mode IR Raman LDAa LDAb GGAc Exp.d Exp.e Exp.f Exp.g Exp.h Exp.i LDAj
Eg Y 146.7 126 155 150 149 146 139.2Eu TO Y 152.7 154 76 164 140 142.9Eu LO Y 259.1 § 232 257.6A1g Y 270.5 § 286 266 257 262 269 267 271.4B1g Y 330.5 290 326 305 328 319 315 319.2A2u TO Y 338.5 334 325 339 320 335.2Eu TO Y 449.4 437 435 467 550 436.1Eg Y 473.7 411 474 465 470 461 456 452.7B1g Y 607.0 569 616 595 609 602 607 592.5Eg Y 659.2 625 645 630 643 648 645 641.3A2u LO Y 663.8 650 648.1B2u 673.4 654.4Eu LO Y 734.1 734 727.1
a NCP calculations using ABINIT [20].b USP calculations; only frequencies of IR-active transverse modes are reported [14].c PAW calculations using VASP [8]. d IR reflectance spectroscopy [42].e Raman spectroscopy, 4.6 mol % Y2O3 [38]. f IR and Raman spectroscopy, yttria and ceria doped t-ZrO2 [39].g Raman spectroscopy on yttria doped t-ZrO2; frequencies are extrapolated to 0 K [37]. h Raman spectroscopy,nanosized pure t-ZrO2 [4, 36]. i Raman spectroscopy, nanosized pure t-ZrO2 [26].j Present results.
Figure 2. Correlation between two tetragonal distortioncharacteristics, A − 1 and dz .
not possible to suggest a definitive transition pressure fromthe diffraction data, but our estimate of ≈37 GPa (includinga 2.2 GPa thermal correction) is in good agreement withthe experimental analysis. However, the observation of ananomaly at 8 GPa cannot be explained on the basis of presenttheoretical results and could be due to an experimental artefactsuch as an inhomogeneous pressure distribution inside the highpressure cell. The fact that our data follow the quadraticcoupling between A and dz (see figure 2) while experimentaldata from [5] strongly disagree with it further suggests aproblem with the high pressure experiment.
A recent more accurate study of the structural evolutionunder pressure up to 18 GPa did not confirm the existence
of a feature at 8 GPa [45]. A linear extrapolation of the cellparameters showed that the distortion A becomes equal to 1 atabout 36 GPa. The arguments invoked in [45] to justify a linearextrapolation instead of the EOS fitting are not clear, but eitherway the pressure range was not sufficiently large for getting anaccurate estimate of the transition point.
ZrO8 octahedra are strongly distorted at P = 0, so thereare two inequivalent Zr–O bonds with bond lengths of 2.072and 2.335 A. The Mulliken bond populations that give aqualitative assessment of the bond strength are respectively0.62 and 0.35 in this structure. A compression towardsa fluorite-type structure makes the polyhedron essentiallysymmetrical, and the bond populations become 0.45 for bothbonds at 35 GPa. Further compression to 50 GPa preservesthe cubic structure and reduces bond populations only veryslightly.
4.2. Electronic structure changes under pressure
Electronic states of t-ZrO2 can be described as follows. Thevalence band is comprised of a relatively narrow (2 eV wide)band of O s states at about 16 eV below the Fermi level;these states are hybridized with Zr s and p states. Thereis a broad band (5 eV wide) of mostly O p states that arehybridized with Zr d states at the top of the valence band.The lowest conduction band is mostly of Zr d character. Wefind the band gap at P = 0 to be indirect with the value of3.73 eV. Experimental results for the band gap of t-ZrO2 are4.2 eV from electron energy-loss spectroscopy (EELS) [46]and 5.78–6.62 eV from vacuum-ultraviolet (VUV) absorptionspectroscopy [47]. One should note that the EELS value givesat best an estimate of a single-particle band gap [48], so theVUV result is more reliable despite the large uncertainty of theVUV band gap [47].
The underestimation of the band gap observed here istypical of Kohn–Sham DFT calculations. Other published
6

J. Phys.: Condens. Matter 21 (2009) 485404 V Milman et al
Figure 3. Pressure dependence of the indirect (solid circles) anddirect (open circles) band gaps. A quasi-harmonic correction of 2.2GPa (at 300 K) is not included in the pressure.
LDA values of a band gap are 4.10 eV [49], 4.0 eV [48],3.85 eV [16] and 3.93 eV [50], while GGA calculationsproduced similar values of 3.95 eV [51], 3.90 eV [16],4.21 eV [52], 3.7 eV [34], and 3.17 eV [21]. It is possibleto improve the description of the band gap by using moreadvanced treatments such as invoking a screened exchangeformalism. This approach produces an indirect band gap of5.95 eV but otherwise does not introduce qualitative changes tothe calculated band structure [50]. An approximate applicationof a more sophisticated GW method gives an even higher valueof the band gap, 6.40 eV [49].
The band gap in the tetragonal phase changes its characterunder compression. The conduction band minimum, CBM,remains at the zone centre � in all calculations. The valenceband maximum, VBM, is at the point A (1/2 1/2 1/2) forpressures below 15 GPa. The indirect band gap decreaseson compression, and the low pressure part of the dependenceshown in figure 3 can be described using a linear fit with a slopeof −6.3 meV GPa−1.
The inflection point at 15 GPa can be seen in figure 3. Atthis pressure the VBM is located in the middle of the A–Mpath, where M is the (1/2 1/2 0) point. VBM moves to thepoint M at pressures above 15 GPa. High pressure structuresstarting from the 35 GPa point produce essentially equivalentvalues for the valence band maxima at M and � which is easilyunderstood as these two points are equivalent in a cubic cell.The band gap after the transition at 35 GPa shows a linearincrease with pressure with a slope of 5.2 meV GPa−1.
The main changes in the electron density of states, DOS,upon compression can be described as a widening of allthe bands. The width of the valence and conduction bandsincreases by approximately 50% at 40 GPa relative to theambient conditions. This applies also to the localized Zr 4 pstates that nominally could be considered as core states. Theircontribution to the DOS has a noticeable dispersion even at
P = 0, creating a peak at −25 eV which is approximately1 eV wide. This peak becomes even more dispersive at 40 GPa,and it starts showing strong hybridization with O s states. Thisobservation of the chemical activity of Zr 4p states shows thatit was essential to include semicore states of Zr explicitly in thecalculation.
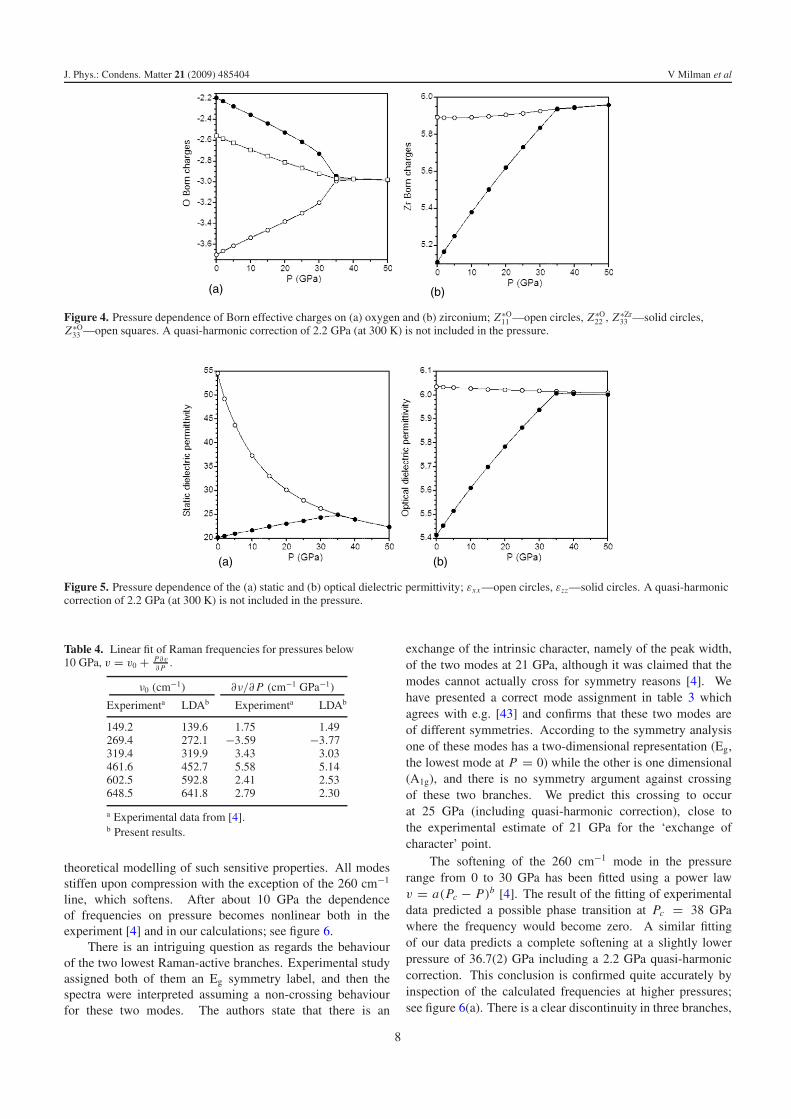
4.3. Born effective charge tensors and dielectric tensors underpressure
The pressure dependence of the symmetrically inequivalentcomponents of the Born effective charge tensors on O and Zratoms is presented in figure 4. The Born effective charges forthe pseudo-cubic structure obtained at 40 GPa are essentiallyisotropic with the values of 5.94 for Zr and −2.97 for O(the ratio has to be exactly −2 as a result of the acousticsum rule). The charges calculated for cubic zirconia atambient conditions [14] are 5.72 and −2.86, respectively. Itis clear from figure 4 that the anisotropy of Born effectivecharge tensors decreases under compression and essentiallydisappears at the point of transition to fluorite structure.
The large changes in calculated Born effective chargesare in stark contrast to the behaviour of the Mulliken chargesthat are commonly used as a qualitative measure of thecharge transfer. Mulliken charges in tetragonal zirconia arecompletely independent of pressure, with values of −0.73 (O)and 1.46 (Zr) from 0 to 50 GPa.
The pressure dependence of the dielectric permittivityis given in figure 5. The static permittivity calculatedfor the cubic structure above the transition pressure, ∼26,is noticeably lower than the reported permittivity of cubiczirconia at ambient conditions, ε0 = 35.5 [20]. Atthe same time the average value of the optical permittivityincreases on compression, albeit slightly. The difference ofthe pressure effects on the lattice contributions to the parallel,ε0
zz , and perpendicular, ε0xx , components of the static dielectric
permittivity can be explained by the nature of the contributingvibrations. The ε0
xx contribution is due to two Eu modes, whileε0
zz is due to the A2u mode. The contributions are linearlyproportional to the mode oscillator strength and inverselyproportional to the square of the mode frequency. This impliesthat in most cases the dielectric permittivity is determined bythe low frequency IR-active modes. The oscillator strength ofthe A2u mode increases under pressure faster than the squareof the mode frequency, hence the overall increase in the ε0
zzvalues. The frequency of the lowest Eu mode, on the otherhand, increases very rapidly upon compression which leads toa drop in the ε0
xx values.
4.4. Phonon frequencies at the � point under pressure
High quality Raman spectra are available from diamond anvilcell experiments on nanosized pure t-ZrO2 crystals in thepressure range from 0 to 31 GPa [4]. The results showthat at low pressure all Raman frequencies change linearlywith the slopes given in table 4 (these values are relatedto the mode Gruneisen coefficients, γi = −∂ ln vi/∂ ln V ).Calculated LDA values are in good quantitative agreement withexperiment, thus confirming the high accuracy achievable in
7
J. Phys.: Condens. Matter 21 (2009) 485404 V Milman et al
(a) (b)
Figure 4. Pressure dependence of Born effective charges on (a) oxygen and (b) zirconium; Z∗O11 —open circles, Z∗O
22 , Z∗Zr33 —solid circles,
Z∗O33 —open squares. A quasi-harmonic correction of 2.2 GPa (at 300 K) is not included in the pressure.
(a) (b)
Figure 5. Pressure dependence of the (a) static and (b) optical dielectric permittivity; εxx —open circles, εzz—solid circles. A quasi-harmoniccorrection of 2.2 GPa (at 300 K) is not included in the pressure.
Table 4. Linear fit of Raman frequencies for pressures below10 GPa, v = v0 + P∂v
∂ P .
ν0 (cm−1) ∂ν/∂ P (cm−1 GPa−1)
Experimenta LDAb Experimenta LDAb
149.2 139.6 1.75 1.49269.4 272.1 −3.59 −3.77319.4 319.9 3.43 3.03461.6 452.7 5.58 5.14602.5 592.8 2.41 2.53648.5 641.8 2.79 2.30
a Experimental data from [4].b Present results.
theoretical modelling of such sensitive properties. All modesstiffen upon compression with the exception of the 260 cm−1
line, which softens. After about 10 GPa the dependenceof frequencies on pressure becomes nonlinear both in theexperiment [4] and in our calculations; see figure 6.
There is an intriguing question as regards the behaviourof the two lowest Raman-active branches. Experimental studyassigned both of them an Eg symmetry label, and then thespectra were interpreted assuming a non-crossing behaviourfor these two modes. The authors state that there is an
exchange of the intrinsic character, namely of the peak width,of the two modes at 21 GPa, although it was claimed that themodes cannot actually cross for symmetry reasons [4]. Wehave presented a correct mode assignment in table 3 whichagrees with e.g. [43] and confirms that these two modes areof different symmetries. According to the symmetry analysisone of these modes has a two-dimensional representation (Eg,the lowest mode at P = 0) while the other is one dimensional(A1g), and there is no symmetry argument against crossingof these two branches. We predict this crossing to occurat 25 GPa (including quasi-harmonic correction), close tothe experimental estimate of 21 GPa for the ‘exchange ofcharacter’ point.
The softening of the 260 cm−1 mode in the pressurerange from 0 to 30 GPa has been fitted using a power lawv = a(Pc − P)b [4]. The result of the fitting of experimentaldata predicted a possible phase transition at Pc = 38 GPawhere the frequency would become zero. A similar fittingof our data predicts a complete softening at a slightly lowerpressure of 36.7(2) GPa including a 2.2 GPa quasi-harmoniccorrection. This conclusion is confirmed quite accurately byinspection of the calculated frequencies at higher pressures;see figure 6(a). There is a clear discontinuity in three branches,
8

J. Phys.: Condens. Matter 21 (2009) 485404 V Milman et al
(a) (b)
Figure 6. Calculated pressure dependence of Raman frequencies (a) and intensities (b). The symbols in the two charts correspond to the samephonon branches. The solid line with no symbols represents the combined intensity of two high frequency modes. A quasi-harmoniccorrection of 2.2 GPa (at 300 K) is not included in the pressure.
and most prominently there is a strong dip of the A1g branch toessentially zero frequency.
A very detailed symmetry analysis of a possible symmetrychange under pressure has been offered in [45]. The underlyingassumption was again that the two lowest modes do not crossunder compression and hence are of the same Eg symmetry.The conclusion was that the highest frequency mode at639 cm−1 is the soft mode of A1g symmetry. Furthermore,it was suggested that there is a new intermediate tetragonalphase (space group 136, Z = 4) which is achieved undercompression—and this new phase then further transforms intoa cubic phase. We find it difficult to see how the highestRaman-active mode could be responsible for a soft modetransition. There is indeed a slight softening of that mode at thephase transition point of 35 GPa (figure 6(a)) but it is quite clearfrom the actual symmetry analysis that it is the 260 cm−1 modewhich has an A1g character, which softens to zero frequencyand is thus responsible for the tetragonal to cubic transition.
The frequencies of the three high frequency Raman-active modes as extrapolated in the experimental study wouldconverge at approximately 650 cm−1 ‘at high pressures’ [4].This statement has to be qualified for ‘high pressures’ to meana point at about 35 GPa where tetragonal distortions disappear.Our calculated frequencies agree with the estimate, and evensuch fine detail as a decrease of the highest frequency Eg modebefore the transition is faithfully reproduced.
4.5. Raman intensities at ambient conditions and underpressure
There have been a number of reports of the Raman spectraof tetragonal zirconia at zero pressure. These include studiesof pure nanosized powders [4, 26, 27, 36] as well as yttria-stabilized samples [37, 39]. Quantitative data on relativeintensities of various lines are invariably noisy since the linesare fairly broad in nanosized powders and often have to beseparated from the spectrum of the monoclinic phase, but thereseems to be a consensus that the A1g line at 260 cm−1 is thestrongest, followed by the high frequency Eg mode.
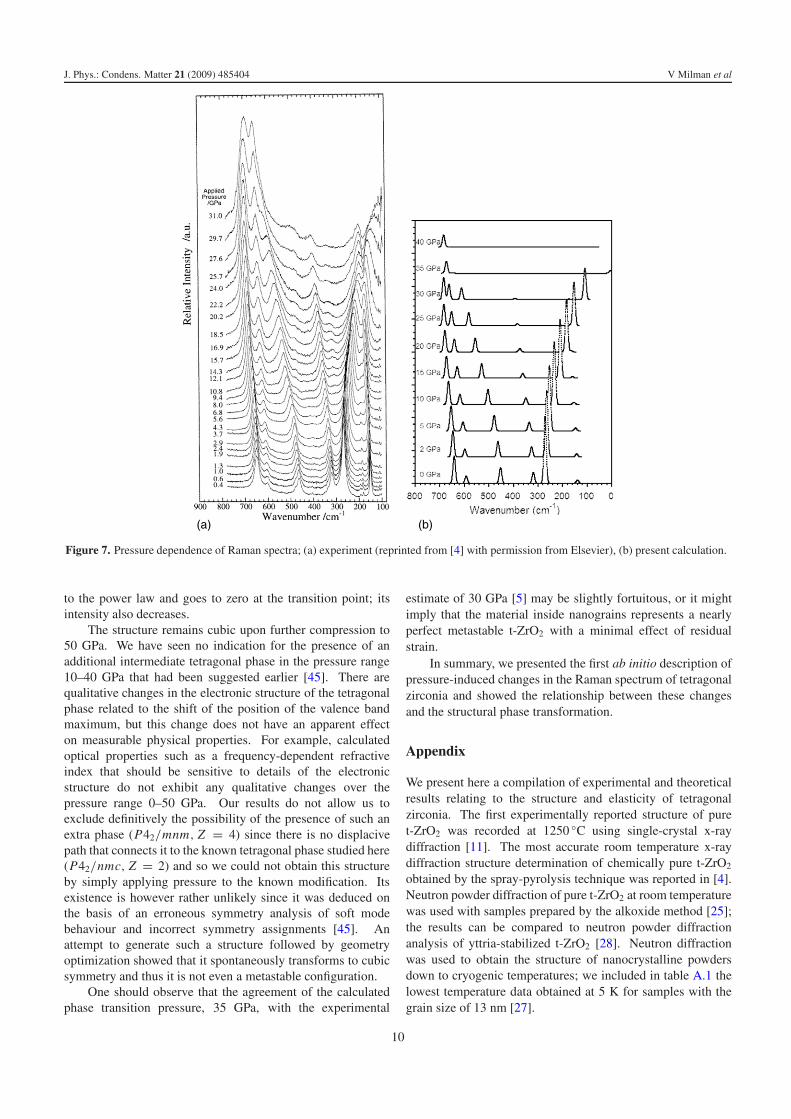
There is an experimentally observed global loss ofintensity in Raman spectra above 24 GPa. The spectrum movestowards a single line at about 700 cm−1, although the spectrumat 31 GPa still shows a split high frequency peak, so thestructure is not yet cubic at that pressure [4].
Calculated Raman spectra are shown in figure 7 incomparison with the experimental spectra [4]. Note that weanalyse Raman intensities, not Raman activities [24], so theresults presented in figure 7(b) should be directly comparableto experiment. The spectra were produced by applying aninstrumental broadening of 10 cm−1 and by using a lowtemperature limit in the Raman intensity calculations [24].
The soft mode at 260 cm−1 is the strongest feature inthe spectrum at zero pressure; its intensity is twice as largeas the combined intensities of the two high frequency modes,both in our calculations (figure 6(b)) and in experiment [4, 26].The intensity of the soft mode decreases monotonically undercompression and falls to zero upon transition to the cubicmodification. At the same time the intensity of the highfrequency features increases as a result of a monotonic increaseof the intensity of the B1g line combined with the jump of theEg mode intensity at the phase transition point. The pressuredependence of the combined intensity of these two modes, asshown in figure 6(b), is qualitatively similar to the experimentalobservation [4].
5. Conclusions
We presented a comprehensive study of the structure andproperties of tetragonal zirconia at ambient conditions andunder compression up to 50 GPa. Our results strongly suggestthat tetragonal distortions disappear at 37 GPa and the structurecan be described as a fluorite-type cubic modification at higherpressures. The transition manifests itself clearly in the pressuredependence of tetragonal distortion parameters, Born effectivecharges, the dielectric permittivity, and the electronic band gap.The frequency of the A1g mode, the strongest line in the Ramanspectrum at P = 0 GPa, softens under pressure according
9
J. Phys.: Condens. Matter 21 (2009) 485404 V Milman et al
(a) (b)
Figure 7. Pressure dependence of Raman spectra; (a) experiment (reprinted from [4] with permission from Elsevier), (b) present calculation.
to the power law and goes to zero at the transition point; itsintensity also decreases.
The structure remains cubic upon further compression to50 GPa. We have seen no indication for the presence of anadditional intermediate tetragonal phase in the pressure range10–40 GPa that had been suggested earlier [45]. There arequalitative changes in the electronic structure of the tetragonalphase related to the shift of the position of the valence bandmaximum, but this change does not have an apparent effecton measurable physical properties. For example, calculatedoptical properties such as a frequency-dependent refractiveindex that should be sensitive to details of the electronicstructure do not exhibit any qualitative changes over thepressure range 0–50 GPa. Our results do not allow us toexclude definitively the possibility of the presence of such anextra phase (P42/mnm, Z = 4) since there is no displacivepath that connects it to the known tetragonal phase studied here(P42/nmc, Z = 2) and so we could not obtain this structureby simply applying pressure to the known modification. Itsexistence is however rather unlikely since it was deduced onthe basis of an erroneous symmetry analysis of soft modebehaviour and incorrect symmetry assignments [45]. Anattempt to generate such a structure followed by geometryoptimization showed that it spontaneously transforms to cubicsymmetry and thus it is not even a metastable configuration.
One should observe that the agreement of the calculatedphase transition pressure, 35 GPa, with the experimental
estimate of 30 GPa [5] may be slightly fortuitous, or it mightimply that the material inside nanograins represents a nearlyperfect metastable t-ZrO2 with a minimal effect of residualstrain.
In summary, we presented the first ab initio description ofpressure-induced changes in the Raman spectrum of tetragonalzirconia and showed the relationship between these changesand the structural phase transformation.
Appendix
We present here a compilation of experimental and theoreticalresults relating to the structure and elasticity of tetragonalzirconia. The first experimentally reported structure of puret-ZrO2 was recorded at 1250 ◦C using single-crystal x-raydiffraction [11]. The most accurate room temperature x-raydiffraction structure determination of chemically pure t-ZrO2
obtained by the spray-pyrolysis technique was reported in [4].Neutron powder diffraction of pure t-ZrO2 at room temperaturewas used with samples prepared by the alkoxide method [25];the results can be compared to neutron powder diffractionanalysis of yttria-stabilized t-ZrO2 [28]. Neutron diffractionwas used to obtain the structure of nanocrystalline powdersdown to cryogenic temperatures; we included in table A.1 thelowest temperature data obtained at 5 K for samples with thegrain size of 13 nm [27].
10
J. Phys.: Condens. Matter 21 (2009) 485404 V Milman et al
Table A.1. Structure of tetragonal ZrO2 from experiment and DFT. The name of the DFT package is indicated where known. Nk is thenumber of irreducible k-points where the Monkhorst–Pack scheme was used; Ecut is the energy cut-off in eV for plane wave based methods.
Method Nk Ecut a (A) c (A) A dz
Experiment (x-ray diffraction)a 3.5958 5.187 1.020 0.045Experiment (neutron diffraction)b 3.6055 5.1797 1.016 0.041 3Experiment (neutron diffraction)c 3.591 5.169 1.018 0.041Experiment (x-ray diffraction)d 3.64 5.27 1.024 0.065Experiment (neutron diffraction)e 3.574 5.154 1.020 0.047
LDAf 3.57 5.08 1.006 0.029LDAg 6 1360 3.563 5.104 1.013 0.042LDAh 40 3.590 5.227 1.030 0.060LDAi 18 950 3.59 5.15 1.014 0.042LDAj 12 816 3.55 5.09 1.014 0.040LDAk 84 800 3.583 5.140 1.014 0.041LDAl 12 340 3.5567 5.1044 1.014 0.041 8LDAm 2300 3.5645 5.1258 1.017 0.044 1LDAn 30 750 3.5654 5.1259 1.017 0.044 1
GGA0 40 3.654 5.364 1.038 0.050GGAp 216 250 3.645 5.289 1.026 0.054GGAq 12 500 3.642 5.295 1.028 0.054GGAr 75 3.61 5.25 1.028 0.047GGAs 12 3.642 5.275 1.024 0.051 5GGAt 12 1632 3.622 5.284 1.032 0.057 25GGAu 45 476 3.61 5.20 1.019
a Pure nanocrystalline t-ZrO2 [4]. b Yttria doped t-ZrO2 [28]. c Pure t-ZrO2 [25].d Pure t-ZrO2 at high temperature [11]. e Pure t-ZrO2, T = 5 K [27]. f FLAPW [53].g NCP [49]. h USP (VASP) [16]. i NCP (CPMD) [54]. j NCP (ABINIT) [20].k PAW (VASP) [35]. l USP [14]. m NCP (PWSCF) [48]. n NCP, present result.o USP (VASP) [16]. p PAW (VASP) [52]. q PAW (VASP) [8]. r FLAPW (WIEN2k) [51].s USP (CASTEP) [21]. t PAW-USP (ABINIT) [33]. u NCP (SIESTA) [34].
Table A.2. Mechanical properties of tetragonal ZrO2: the bulkmodulus B and its pressure derivative B ′, Poisson’s ratio ν, the shearmodulus G, the Young modulus E .
B(GPa) B ′
G(GPa)
E(GPa) ν
Exp.a 190 80 215 0.316Exp.b 198(7)Exp.c 170(10) 4.3(1.3)
LDAd 200 6.25
LDAe 197 5.0
LDAf 207 5.0
LDAg 196h; 204i 99i 257 0.29
LDAj 200(2)h; 223i 5.5 103i 248–320 0.15–0.59
GGAk 226.1 3.81
a Room temperature ultrasonic measurements on yttriadoped polycrystals [55].b X-ray diffraction using a diamond anvil cell; purenanocrystalline t-ZrO2 [5].c Synchrotron x-ray diffraction using a diamond anvil cell;pure nanocrystalline t-ZrO2 [45].d NCP calculations [56]. e NCP calculations [54].f NCP calculations [48]. g PAW calculations [35].h Extracted from EOS calculations (third-orderBirch–Murnaghan equation).i Polycrystalline Voigt average.j Present results; the values for E and ν are the limits oforientation-dependent single-crystal data.k GGA; all-electron FLAPW calculations [51].
Table A.3. Single-crystal elastic constants of tetragonal ZrO2 (GPa).The bulk modulus, B, is derived from the Cij tensor.
C11 C33 C44 C66 C12 C13 B
Exp.a 327 264 59 64 100 62 149SC-TBb 366 286 78 88 180 80 190PIBc 465 326 101 156 83 49 179GGAd 293 385 51 187 248 111 210GGAe 334 248 9.08 152 211 51.9 172LDAf 382 346 42 167 221 72 204LDAg 401(3) 345(2) 49(3) 174(1) 245(2) 90(5) 212(2)
a Neutron powder diffraction for 12 mol% Ce dopedt-ZrO2 [32].b Self-consistent tight-binding model [57].c Potential-induced breathing model [58].d NCP calculations [34]. e PAW-USP calculations [33].f PAW calculations [35]. g Present results.
Available experimental and DFT results for mechanicalproperties of tetragonal ZrO2 are presented in table A.2. Thebulk modulus values were obtained mostly from high pressurecompressibility experiments, either by using a diamond anvilcell or by using DFT to calculate the equation of state. Thelow quality of the fit for the measured EOSs is illustrated bylarge statistical uncertainties [5, 45], so one still does not havean accurate experimental estimate of the t-ZrO2 bulk modulus.
The theoretical and experimental results for single-crystalelastic constants of t-ZrO2 are summarized in table A.3.Experimental values of elastic constants are the first reported
11

J. Phys.: Condens. Matter 21 (2009) 485404 V Milman et al
results from determining elastic constants of anisotropicmaterials using powder diffraction measurements [32]. Thederivation of the Ci j tensor required strain–stress data aswell as an estimated value of Young’s modulus (taken to be192 GPa).
References
[1] Manicone P F, Iommetti P R and Raffaelli L 2007 J. Dent.35 819–26
[2] Bocanegra-Bernal M H and De la Torre S D 2002 J. Mater. Sci.37 4947–71
[3] Kelly P M and Rose L R F 2002 Prog. Mater. Sci. 47 463–557[4] Bouvier P and Lucazeau G 2000 J. Phys. Chem. Solids
61 569–78[5] Bouvier P, Djurado E, Lucazeau G and Le Bihan T 2000 Phys.
Rev. B 62 8731–7[6] Ohtaka O, Andrault D, Bouvier P, Schultz E and
Mezouar M 2005 J. Appl. Crystallogr. 38 727–33[7] Jaffe J E, Bachorz R A and Gutowski M 2005 Phys. Rev. B
72 144107[8] Kuwabara A, Tohei T, Yamamoto T and Tanaka I 2005 Phys.
Rev. B 71 064301[9] Rignanese G M 2005 J. Phys.: Condens. Matter 17 R357–79
[10] Hahn T 1989 International Tables for Crystallography vol A(Dordrecht: Kluwer)
[11] Teufer G 1962 Acta Crystallogr. 15 1187[12] Clark S J, Segall M D, Pickard C J, Hasnip P J, Probert M I J,
Refson K and Payne M C 2005 Z. Kristallogr. 220 567–70[13] Accelrys 2008 Materials Studio 4.4[14] Zhao X and Vanderbilt D 2002 Phys. Rev. B 65 075105[15] Zhao X and Vanderbilt D 2002 Phys. Rev. B 65 233106[16] Jomard G, Petit T, Pasturel A, Magaud L, Kresse G and
Hafner J 1999 Phys. Rev. B 59 4044–52[17] Rappe A M, Rabe K M, Kaxiras E and Joannopoulos J D 1990
Phys. Rev. B 41 1227–30[18] Ramer N J and Rappe A M 1999 Phys. Rev. B 59 12471–8[19] Monkhorst H J and Pack J D 1976 Phys. Rev. B 13 5188–92[20] Rignanese G M, Detraux F, Gonze X and Pasquarello A 2001
Phys. Rev. B 64 134301[21] Fan Q, Wang F, Zhang H and Zhang F 2008 Mol. Simul.
34 1099–103[22] Birch F 1947 Phys. Rev. 71 809–24[23] Refson K, Tulip P R and Clark S J 2006 Phys. Rev. B
73 155114[24] Porezag D and Pederson M R 1996 Phys. Rev. B 54 7830–6[25] Igawa N, Ishii Y, Nagasaki T, Morii Y, Funahashi S and
Ohno H 1993 J. Am. Ceram. Soc. 76 2673–6[26] Barberis P, Merle-Mejean T and Quintard P 1997 J. Nucl.
Mater. 246 232–43[27] Bouvier P, Djurado E, Ritter C, Dianoux A J and
Lucazeau G 2001 Int. J. Inorg. Mater. 3 647–54
[28] Howard C J, Hill R J and Reichert B E 1988 Acta Crystallogr.B 44 116–20
[29] Djurado E, Bouvier P and Lucazeau G 2000 J. Solid StateChem. 149 399–407
[30] Baldinozzi G, Simeone D, Gosset D and Dutheil M 2003 Phys.Rev. Lett. 90 216103
[31] Milman V and Warren M C 2001 J. Phys.: Condens. Matter13 241–51
[32] Kisi E H and Howard C J 1998 J. Am. Ceram. Soc. 81 1682–4[33] Fadda G, Colombo L and Zanzotto G 2009 Phys. Rev. B
79 214102[34] Natanzon Y, Boniecki M and Lodziana Z 2009 J. Phys. Chem.
Solids 70 15–9[35] Lowther J E 2006 Phys. Rev. B 73 134110[36] Bouvier P, Gupta H C and Lucazeau G 2001 J. Phys. Chem.
Solids 62 873–9[37] Lughi V and Clarke R D 2007 J. Appl. Phys. 101 053524[38] Feinberg A and Perry C H 1981 J. Phys. Chem. Solids
42 513–8[39] Hirata T, Asari E and Kitajima M 1994 J. Solid State Chem.
110 201–7[40] Mirgorodsky A P and Quintard P E 1999 J. Am. Ceram. Soc.
82 3121–4[41] Kroumova E, Aroyo M I, Perez-Mato J M, Kirov A, Capillas C,
Ivantchev S and Wondratschek H 2003 Phase Transit.76 155–70
[42] Pecharroman C, Ocana M and Serna C J 1996 J. Appl. Phys.80 3479–83
[43] Quintard P E, Barberis P, Mirgorodsky A P andMerle-Mejean T 2002 J. Am. Ceram. Soc. 85 1745–9
[44] Howard C J, Hunter B A and Kim D-J 1998 J. Am. Ceram. Soc.81 241–3
[45] Bouvier P, Dmitriev V and Lucazeau G 2003 Eur. Phys. J. B35 301–9
[46] McComb D W 1996 Phys. Rev. B 54 7094–102[47] French R H, Glass S J, Ohuchi F S, Xu Y N and Ching W
Y 1994 Phys. Rev. B 49 5133–41[48] Dash L K, Vast N, Baranek P, Cheynet M-C and
Reining L 2004 Phys. Rev. B 70 245116[49] Kralik B, Chang E K and Louie S G 1998 Phys. Rev. B
57 7027–36[50] Medvedeva J E, Freeman A J, Geller C B and Rishel D M 2007
Phys. Rev. B 76 235115[51] Terki R, Bertrand G, Aourag H and Coddet C 2006 Mater. Sci.
Semicond. Process 9 1006–13[52] Eichler A 2001 Phys. Rev. B 64 174103[53] Jansen H J F 1991 Phys. Rev. B 43 7267–78[54] Stapper G, Bernasconi M, Nicoloso N and Parrinello M 1999
Phys. Rev. B 59 797–810[55] Fukuhara M and Yamauchi I 1993 J. Mater. Sci. 28 4681–8[56] Dewhurst J K and Lowther J E 1998 Phys. Rev. B 57 741–7[57] Fabris S, Paxton A T and Finnis M W 2000 Phys. Rev. B
61 6617–30[58] Cohen R E, Mehl M J and Boyer L L 1988 Physica B+C
150 1–9
12