structural monitoring of wind turbines using …jerlynch/papers/esfnsf2008cambridge.pdf · 1...
TRANSCRIPT
1
Structural Monitoring of Wind Turbines using Wireless Sensor Networks
R. Andrew Swartz1, Jerome P. Lynch2, Bert Sweetman3, Raimund Rolfes4, and Stephan Zerbst5
Abstract: With the importance of alternative energy sources increasing, monitoring and economical design of alternative energy generators becomes more critical. Wind power has tremendous potential to provide renewable energy without reliance on traditional fossil fuel technologies. Conditional monitoring of wind turbines can help to avert unplanned downtime due to component failure. To implement a practical monitoring system, characterization of the dynamic behavior of the structure under consideration is a necessary first step. Acquisition of dynamic output data under a wide variety of conditions can be a time-consuming and costly process. In recent years, low-cost wireless sensors have emerged as an enabling technology for just such monitoring applications. Inexpensive and flexible wireless sensors can be installed within a large structure to measure dynamic response and, using embedded computational abilities collocated with the sensor itself, performing engineering level monitoring algorithms. In this paper, wireless sensor technologies are deployed on two wind turbine structures to provide better models of wind turbine dynamic behavior and response to loading. The information gathered in this study may be used in the future to facilitate more economical design, and to provide the basis for future health monitoring systems.
Keywords: wireless sensors, structural health monitoring, wind energy, modal analysis
Introduction
With the recent increase in public interest in renewable and carbon-neutral energy sources, wind energy is gaining popularity as perhaps the most technologically developed and practical alternative today. Recent studies put the annual wind energy generation capacity of the United States at 11,575 megawatts (Leopold 2007) with a growth rate of 30%, annually (Southern 2007). Technological improvements (e.g. larger, more powerful generation turbines) and federal tax subsidies have increased investment in wind energy technology to the point where 33 states host sizable wind farms, 19 of which are significant with capacities over 100 MW (DOE 2006). Despite those accomplishments, wind energy only accounts for 0.8% of the United State’s total
energy supply (Leopold 2007). This number pales in comparison to other developed nations such as Germany which already realizes a full 7% of its energy supply from wind (Wiser and Bolinger 2007). By substantially increasing its wind power capacity, the United States could drastically reduce its own greenhouse carbon emissions by as much as 2 billion tons by 2050, if it were to generate 20% of its energy by wind (DOE 2006).
Improvements to the cost/benefit ratio of wind turbine construction can come through aggressive pursuit of efficient turbine designs. Longer and lighter blade (and tower) designs using novel materials (e.g. fiberglass composites) will yield better performance (Schulz and Sundaresan 2006). Frequently reversing wind and gravity loads subject the blades to high levels of fatigue that have the potential to cause sudden failure (Pitchford, et al. 2007). Typically, blades experience damage requiring repair or even replacement, on average, five times per year (Rolfes, et al. 2006), a fact that negatively affects the long-term profitability of wind turbines. Undetected damage can propagate into sudden and catastrophic failure. A sheared blade presents a substantial risk to anyone on the ground and unbalances the entire nacelle that might result in damage to internal gears or the energy plant itself (Schulz and
1 Ph.D. Candidate, Department of Civil and Environment Engineering, University of Michigan, Ann Arbor, MI 48109. 2Assistant Professor, Department of Civil and Environment Engineering, University of Michigan, Ann Arbor, MI 48109. 3Assistant Professor, Department of Maritime Systems Engineering, Texas A&M Galveston, Galveston, TX 77553. 4Professor, Institute for Structural Analysis, Leibniz University of Hanover, Germany. 5Dr.-Ing. Candidate, Institute for Structural Analysis, Leibniz University of Hanover, Germany.
SOURCE: Proceedings of the ESF-NSF Workshop on Sensor Networks for Civil Infrastructure Systems, Cambridge, England, April 28-29, 2008.
2
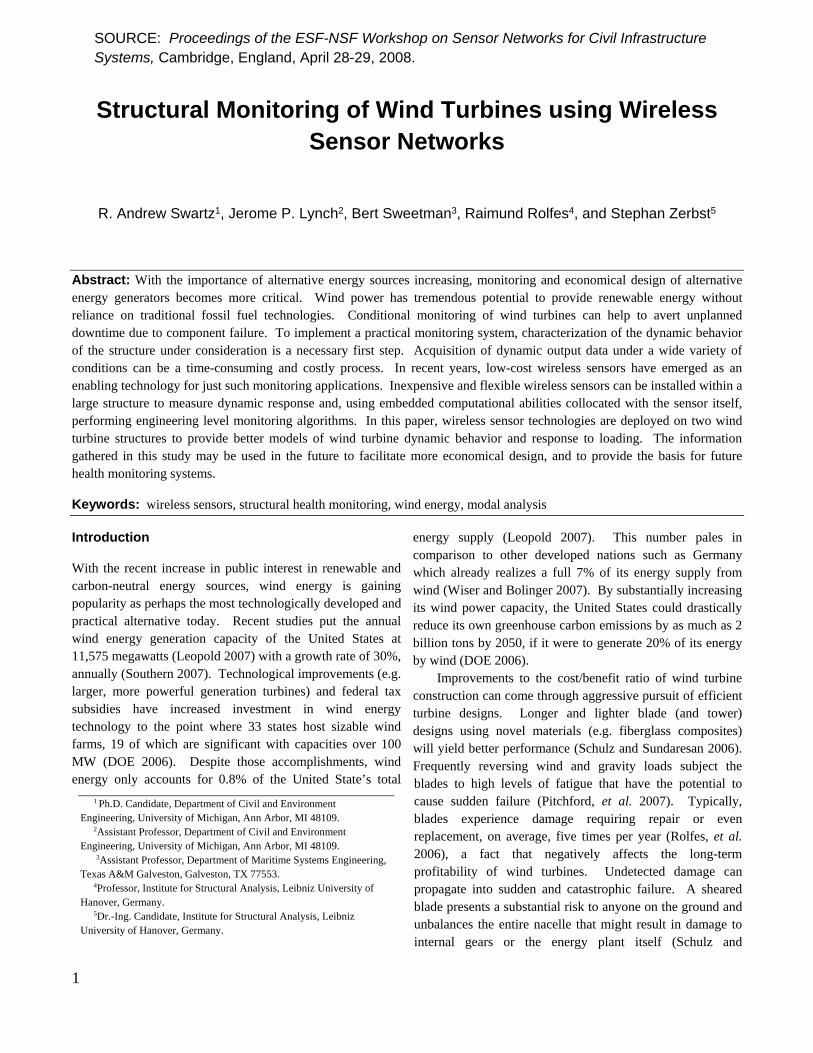
Sundaresan 2006). An on-shore turbine experienced sudden blade failure (Figure 1) in Dunbar, Scotland in 2005 resulting in £1.25 million in repair costs and significant downtime (Tweedie 2005). As future wind farms go off-shore, similar failures might not be noticed as promptly, resulting in greater damage and longer downtime. Besides the potential for downtime, off-shore turbines are susceptible to corrosion as well, increasing the need for vigilant monitoring technologies on these remotely sited structures.
The acquisition of turbine response data for improving wind turbine designs and hence, wind power efficiency, is a multistep process. First, dynamic data must be collected on
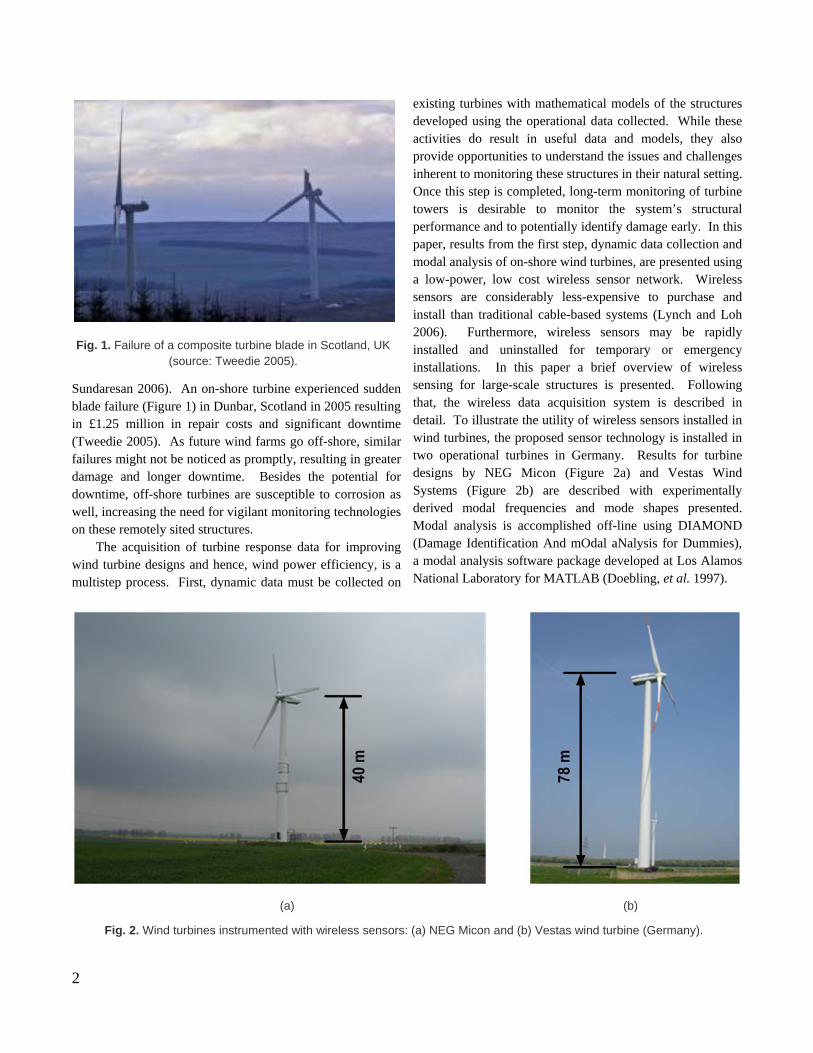
existing turbines with mathematical models of the structures developed using the operational data collected. While these activities do result in useful data and models, they also provide opportunities to understand the issues and challenges inherent to monitoring these structures in their natural setting. Once this step is completed, long-term monitoring of turbine towers is desirable to monitor the system’s structural performance and to potentially identify damage early. In this paper, results from the first step, dynamic data collection and modal analysis of on-shore wind turbines, are presented using a low-power, low cost wireless sensor network. Wireless sensors are considerably less-expensive to purchase and install than traditional cable-based systems (Lynch and Loh 2006). Furthermore, wireless sensors may be rapidly installed and uninstalled for temporary or emergency installations. In this paper a brief overview of wireless sensing for large-scale structures is presented. Following that, the wireless data acquisition system is described in detail. To illustrate the utility of wireless sensors installed in wind turbines, the proposed sensor technology is installed in two operational turbines in Germany. Results for turbine designs by NEG Micon (Figure 2a) and Vestas Wind Systems (Figure 2b) are described with experimentally derived modal frequencies and mode shapes presented. Modal analysis is accomplished off-line using DIAMOND (Damage Identification And mOdal aNalysis for Dummies), a modal analysis software package developed at Los Alamos National Laboratory for MATLAB (Doebling, et al. 1997).
Fig. 1. Failure of a composite turbine blade in Scotland, UK (source: Tweedie 2005).
(a) (b)
Fig. 2. Wind turbines instrumented with wireless sensors: (a) NEG Micon and (b) Vestas wind turbine (Germany).

3
Wireless Monitoring Because wireless sensors are relatively low cost and easy to install, they are gaining popularity for the monitoring of large structures (Lynch and Loh 2006). Recent years have seen a number of successful field validation studies on civil engineering structures (Lynch, et al. 2003; Kurata, et al. 2005; Whelan, et al. 2007; Pakzad, et al. 2008). Wireless sensors are capable of collecting data in lieu of traditional cabled sensors, but do not function as exact replacements. Without wires, wireless sensors are often dependent on
internally stored (battery) power for operation. Inefficient use of wireless sensors will deplete this energy rapidly, necessitating frequent battery replacement that would quickly erode the cost savings realized by using wireless sensors. Because the wireless modem that serves as the link between a wireless sensor and the outside world is the largest user of energy on the sensor, it is often important to be selective about how the wireless communication channel is used. This fact has led to research into parallel and distributed algorithms in which data processing is actually accomplished within the wireless sensor, allowing them to broadcast a relatively small amount of processed data as opposed to a massive amount of high-bandwidth raw data (Straser and Kiremidjian 1998; Tanner, et al. 2002; Lynch, et al. 2004; Clayton, et al. 2005). Distributed processing is possible in wireless sensing because of computational processing power that is collocated with the sensor. Another motivation for distributed processing is bandwidth limitations over the wireless communication channel. Wireless communications are inherently limited by over-the-air transmission rates and the amount of wireless bandwidth available in the crowded unlicensed industrial, scientific, and medical (ISM) bands. This limitation restricts data transfer rates to less than what can be accomplished with a comparable wired system. More recently, network-wide algorithms have been proposed in which wireless sensors exchange limited data between themselves to compute a complete picture of the modal properties of the structure (Zimmerman, et al. 2008).
The wireless sensor utilized in this study is the Stanford WiMMS unit (Wang, et al. 2007) consisting of a printed circuit board (PCB) that hosts the computational core (i.e., microcontroller) and the sensing interface (i.e., analog-to-digital converter) and provides connections for the communications interface (Figure 3). The computational core is responsible for running the operating system (OS), contains the engineering application software, performs embedded data processing, and stores data. It consists of an Atmel ATMega128 microcontroller with an 8-bit integrated circuit architecture and 128 kB of flash memory. An additional 128 kB of static random access memory (SRAM) housed in an external package is added to the core. The sensing interface consists of a Texas Instruments ADS8341, a 4 channel, 16-bit analog-to-digital converter (ADC) responsible for interfacing with the sensors, in this case, MEMS accelerometers (Crossbow CXL01) and metal foil strain gauges (Texas Measurements YFLA-5-5L). The communications interface consists of a MaxStream 24XStream wireless modem that operates within the 2.4 GHz ISM communications band. The radio has a maximum data
Fig. 3. Low-cost WiMMS wireless sensor proposed for structural monitoring of wind turbines.
Fig. 4. Signal conditioning board for amplifying and band-pass filtering of low-amplitude acceleration signals.
4
rate of 192 kbps and is rated for a line-of-site communications range of 5 km. Besides the sensors, a signal conditioning board (Figure 4) is also employed. The signal conditioning circuit serves two functions; it serves as a band-pass (0.03 to 25 Hz) anti-aliasing filter and amplifies the
sensor output voltage by a factor of twenty so as to better utilize the full input range of the ADC. Amplification is especially important when recording the output of accelerometers deployed for ambient response measurements.
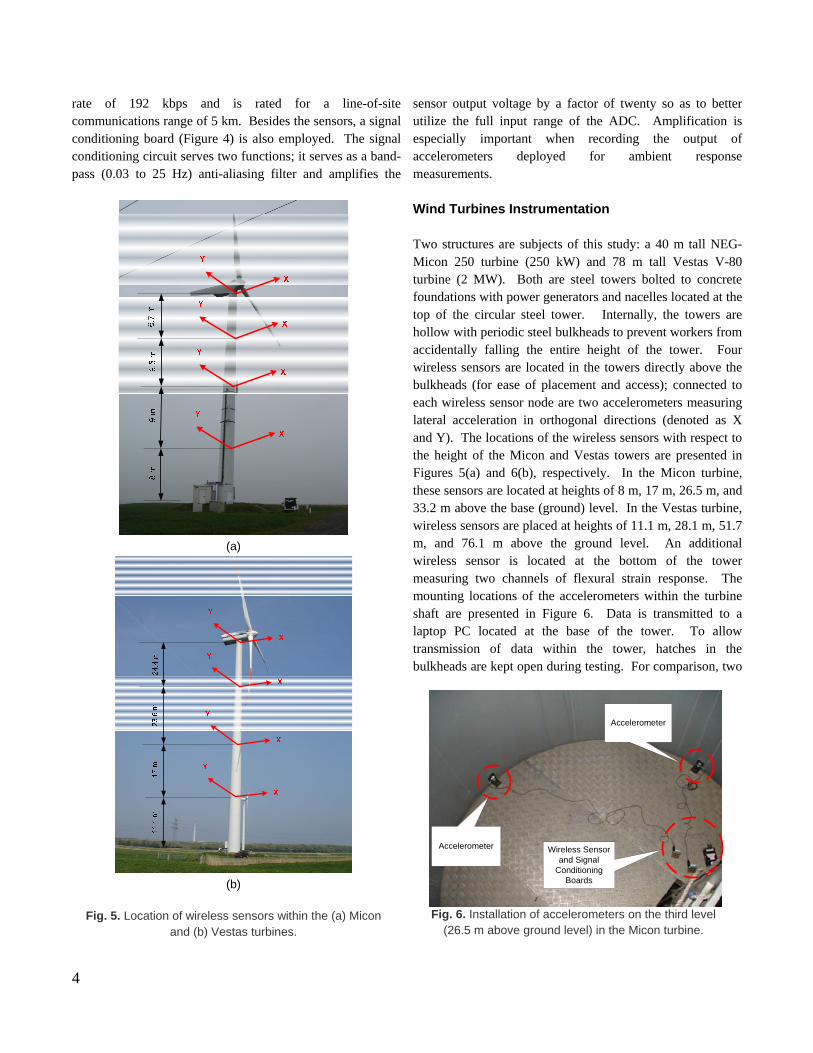
Wind Turbines Instrumentation Two structures are subjects of this study: a 40 m tall NEG-Micon 250 turbine (250 kW) and 78 m tall Vestas V-80 turbine (2 MW). Both are steel towers bolted to concrete foundations with power generators and nacelles located at the top of the circular steel tower. Internally, the towers are hollow with periodic steel bulkheads to prevent workers from accidentally falling the entire height of the tower. Four wireless sensors are located in the towers directly above the bulkheads (for ease of placement and access); connected to each wireless sensor node are two accelerometers measuring lateral acceleration in orthogonal directions (denoted as X and Y). The locations of the wireless sensors with respect to the height of the Micon and Vestas towers are presented in Figures 5(a) and 6(b), respectively. In the Micon turbine, these sensors are located at heights of 8 m, 17 m, 26.5 m, and 33.2 m above the base (ground) level. In the Vestas turbine, wireless sensors are placed at heights of 11.1 m, 28.1 m, 51.7 m, and 76.1 m above the ground level. An additional wireless sensor is located at the bottom of the tower measuring two channels of flexural strain response. The mounting locations of the accelerometers within the turbine shaft are presented in Figure 6. Data is transmitted to a laptop PC located at the base of the tower. To allow transmission of data within the tower, hatches in the bulkheads are kept open during testing. For comparison, two
(a)
(b)
Fig. 5. Location of wireless sensors within the (a) Micon
and (b) Vestas turbines.
Fig. 6. Installation of accelerometers on the third level (26.5 m above ground level) in the Micon turbine.
Accelerometer
Accelerometer
Wireless Sensor and Signal
Conditioning Boards
5
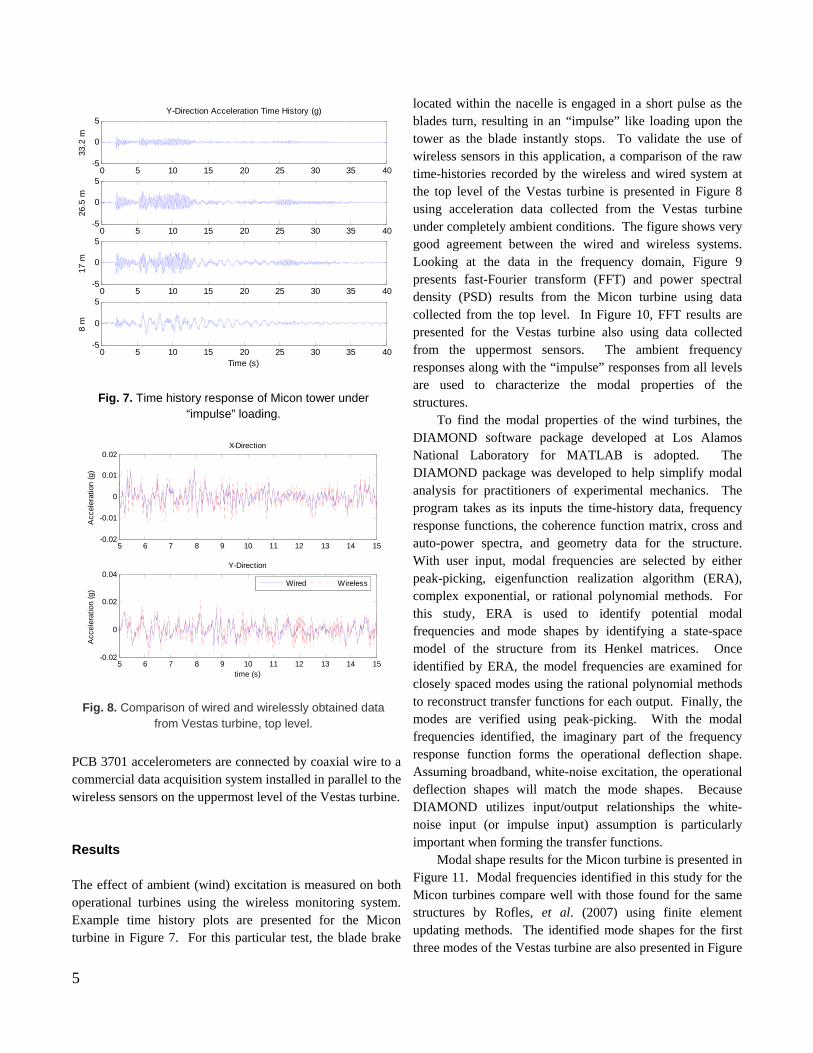
PCB 3701 accelerometers are connected by coaxial wire to a commercial data acquisition system installed in parallel to the wireless sensors on the uppermost level of the Vestas turbine. Results The effect of ambient (wind) excitation is measured on both operational turbines using the wireless monitoring system. Example time history plots are presented for the Micon turbine in Figure 7. For this particular test, the blade brake
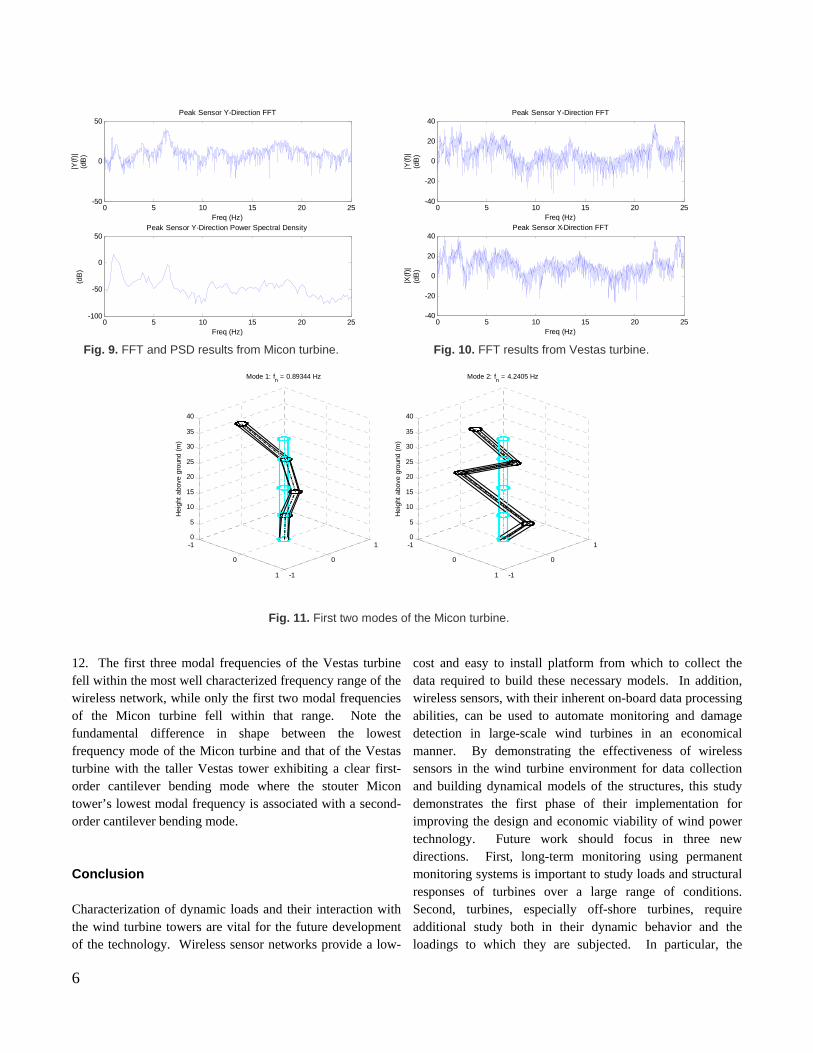
located within the nacelle is engaged in a short pulse as the blades turn, resulting in an “impulse” like loading upon the tower as the blade instantly stops. To validate the use of wireless sensors in this application, a comparison of the raw time-histories recorded by the wireless and wired system at the top level of the Vestas turbine is presented in Figure 8 using acceleration data collected from the Vestas turbine under completely ambient conditions. The figure shows very good agreement between the wired and wireless systems. Looking at the data in the frequency domain, Figure 9 presents fast-Fourier transform (FFT) and power spectral density (PSD) results from the Micon turbine using data collected from the top level. In Figure 10, FFT results are presented for the Vestas turbine also using data collected from the uppermost sensors. The ambient frequency responses along with the “impulse” responses from all levels are used to characterize the modal properties of the structures.
To find the modal properties of the wind turbines, the DIAMOND software package developed at Los Alamos National Laboratory for MATLAB is adopted. The DIAMOND package was developed to help simplify modal analysis for practitioners of experimental mechanics. The program takes as its inputs the time-history data, frequency response functions, the coherence function matrix, cross and auto-power spectra, and geometry data for the structure. With user input, modal frequencies are selected by either peak-picking, eigenfunction realization algorithm (ERA), complex exponential, or rational polynomial methods. For this study, ERA is used to identify potential modal frequencies and mode shapes by identifying a state-space model of the structure from its Henkel matrices. Once identified by ERA, the model frequencies are examined for closely spaced modes using the rational polynomial methods to reconstruct transfer functions for each output. Finally, the modes are verified using peak-picking. With the modal frequencies identified, the imaginary part of the frequency response function forms the operational deflection shape. Assuming broadband, white-noise excitation, the operational deflection shapes will match the mode shapes. Because DIAMOND utilizes input/output relationships the white-noise input (or impulse input) assumption is particularly important when forming the transfer functions.
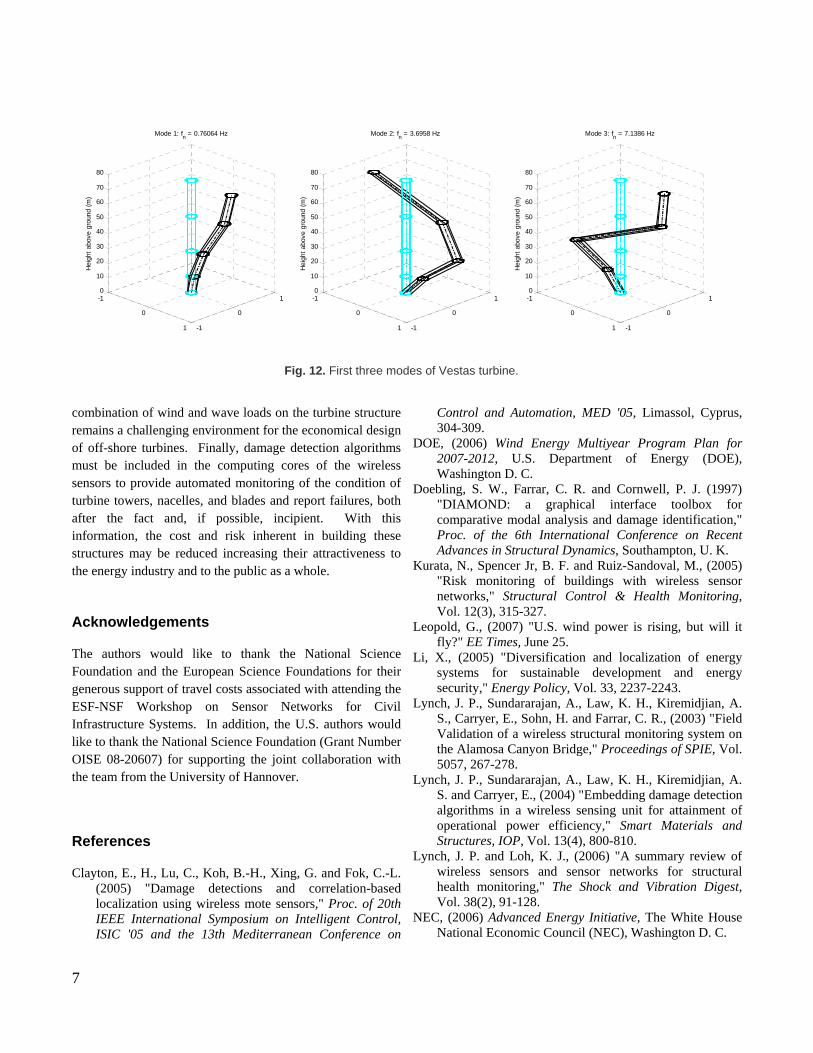
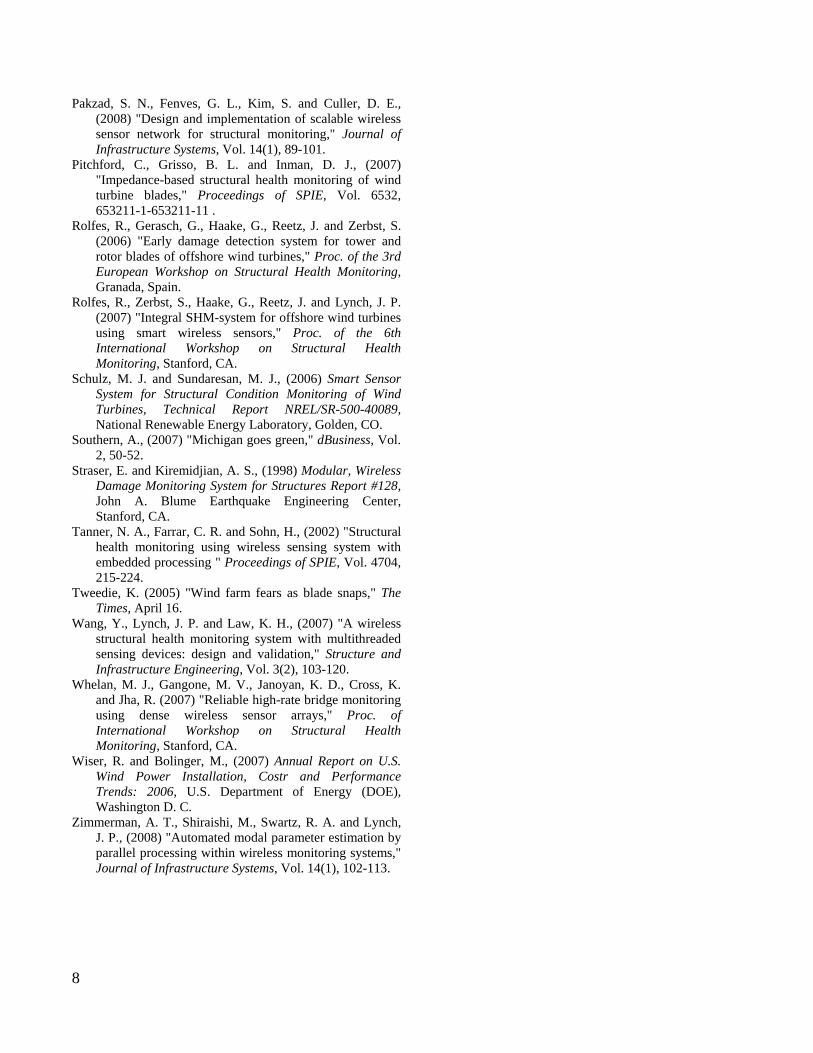
Modal shape results for the Micon turbine is presented in Figure 11. Modal frequencies identified in this study for the Micon turbines compare well with those found for the same structures by Rofles, et al. (2007) using finite element updating methods. The identified mode shapes for the first three modes of the Vestas turbine are also presented in Figure
Fig. 7. Time history response of Micon tower under “impulse” loading.
Fig. 8. Comparison of wired and wirelessly obtained data from Vestas turbine, top level.
0 5 10 15 20 25 30 35 40-5
0
5
8 m
Time (s)
0 5 10 15 20 25 30 35 40-5
0
5
17 m
0 5 10 15 20 25 30 35 40-5
0
5
26.5
m
0 5 10 15 20 25 30 35 40-5
0
5
33.2
m
Y-Direction Acceleration Time History (g)
5 6 7 8 9 10 11 12 13 14 15-0.02
-0.01
0
0.01
0.02X-Direction
Acc
eler
atio
n (g
)
5 6 7 8 9 10 11 12 13 14 15-0.02
0
0.02
0.04
time (s)
Y-Direction
Acc
eler
atio
n (g
)
Wired Wireless
6
12. The first three modal frequencies of the Vestas turbine fell within the most well characterized frequency range of the wireless network, while only the first two modal frequencies of the Micon turbine fell within that range. Note the fundamental difference in shape between the lowest frequency mode of the Micon turbine and that of the Vestas turbine with the taller Vestas tower exhibiting a clear first-order cantilever bending mode where the stouter Micon tower’s lowest modal frequency is associated with a second-order cantilever bending mode. Conclusion Characterization of dynamic loads and their interaction with the wind turbine towers are vital for the future development of the technology. Wireless sensor networks provide a low-
cost and easy to install platform from which to collect the data required to build these necessary models. In addition, wireless sensors, with their inherent on-board data processing abilities, can be used to automate monitoring and damage detection in large-scale wind turbines in an economical manner. By demonstrating the effectiveness of wireless sensors in the wind turbine environment for data collection and building dynamical models of the structures, this study demonstrates the first phase of their implementation for improving the design and economic viability of wind power technology. Future work should focus in three new directions. First, long-term monitoring using permanent monitoring systems is important to study loads and structural responses of turbines over a large range of conditions. Second, turbines, especially off-shore turbines, require additional study both in their dynamic behavior and the loadings to which they are subjected. In particular, the
Fig. 9. FFT and PSD results from Micon turbine.
Fig. 10. FFT results from Vestas turbine.
Fig. 11. First two modes of the Micon turbine.
0 5 10 15 20 25-50
0
50
|Y(f
)|(d
B)
Peak Sensor Y-Direction FFT
Freq (Hz)
0 5 10 15 20 25-100
-50
0
50Peak Sensor Y-Direction Power Spectral Density
Freq (Hz)
(dB
)
0 5 10 15 20 25-40
-20
0
20
40
|Y(f
)|(d
B)
Peak Sensor Y-Direction FFT
Freq (Hz)
0 5 10 15 20 25-40
-20
0
20
40
|X(f
)|(d
B)
Peak Sensor X-Direction FFT
Freq (Hz)
-1
0
1 -1
0
10
5
10
15
20
25
30
35
40
Mode 1: fn = 0.89344 Hz
Hei
ght
abov
e gr
ound
(m
)
-1
0
1 -1
0
10
5
10
15
20
25
30
35
40
Mode 2: fn = 4.2405 Hz
Hei
ght
abov
e gr
ound
(m
)
7
combination of wind and wave loads on the turbine structure remains a challenging environment for the economical design of off-shore turbines. Finally, damage detection algorithms must be included in the computing cores of the wireless sensors to provide automated monitoring of the condition of turbine towers, nacelles, and blades and report failures, both after the fact and, if possible, incipient. With this information, the cost and risk inherent in building these structures may be reduced increasing their attractiveness to the energy industry and to the public as a whole.
Acknowledgements
The authors would like to thank the National Science Foundation and the European Science Foundations for their generous support of travel costs associated with attending the ESF-NSF Workshop on Sensor Networks for Civil Infrastructure Systems. In addition, the U.S. authors would like to thank the National Science Foundation (Grant Number OISE 08-20607) for supporting the joint collaboration with the team from the University of Hannover.
References
Clayton, E., H., Lu, C., Koh, B.-H., Xing, G. and Fok, C.-L. (2005) "Damage detections and correlation-based localization using wireless mote sensors," Proc. of 20th IEEE International Symposium on Intelligent Control, ISIC '05 and the 13th Mediterranean Conference on
Control and Automation, MED '05, Limassol, Cyprus, 304-309.
DOE, (2006) Wind Energy Multiyear Program Plan for 2007-2012, U.S. Department of Energy (DOE), Washington D. C.
Doebling, S. W., Farrar, C. R. and Cornwell, P. J. (1997) "DIAMOND: a graphical interface toolbox for comparative modal analysis and damage identification," Proc. of the 6th International Conference on Recent Advances in Structural Dynamics, Southampton, U. K.
Kurata, N., Spencer Jr, B. F. and Ruiz-Sandoval, M., (2005) "Risk monitoring of buildings with wireless sensor networks," Structural Control & Health Monitoring, Vol. 12(3), 315-327.
Leopold, G., (2007) "U.S. wind power is rising, but will it fly?" EE Times, June 25.
Li, X., (2005) "Diversification and localization of energy systems for sustainable development and energy security," Energy Policy, Vol. 33, 2237-2243.
Lynch, J. P., Sundararajan, A., Law, K. H., Kiremidjian, A. S., Carryer, E., Sohn, H. and Farrar, C. R., (2003) "Field Validation of a wireless structural monitoring system on the Alamosa Canyon Bridge," Proceedings of SPIE, Vol. 5057, 267-278.
Lynch, J. P., Sundararajan, A., Law, K. H., Kiremidjian, A. S. and Carryer, E., (2004) "Embedding damage detection algorithms in a wireless sensing unit for attainment of operational power efficiency," Smart Materials and Structures, IOP, Vol. 13(4), 800-810.
Lynch, J. P. and Loh, K. J., (2006) "A summary review of wireless sensors and sensor networks for structural health monitoring," The Shock and Vibration Digest, Vol. 38(2), 91-128.
NEC, (2006) Advanced Energy Initiative, The White House National Economic Council (NEC), Washington D. C.
Fig. 12. First three modes of Vestas turbine.
-1
0
1 -1
0
10
10
20
30
40
50
60
70
80
Mode 1: fn = 0.76064 Hz
Hei
ght
abov
e gr
ound
(m
)
-1
0
1 -1
0
10
10
20
30
40
50
60
70
80
Mode 2: fn = 3.6958 Hz
Hei
ght
abov
e gr
ound
(m
)-1
0
1 -1
0
10
10
20
30
40
50
60
70
80
Mode 3: fn = 7.1386 Hz
Hei
ght
abov
e gr
ound
(m
)
8
Pakzad, S. N., Fenves, G. L., Kim, S. and Culler, D. E., (2008) "Design and implementation of scalable wireless sensor network for structural monitoring," Journal of Infrastructure Systems, Vol. 14(1), 89-101.
Pitchford, C., Grisso, B. L. and Inman, D. J., (2007) "Impedance-based structural health monitoring of wind turbine blades," Proceedings of SPIE, Vol. 6532, 653211-1-653211-11 .
Rolfes, R., Gerasch, G., Haake, G., Reetz, J. and Zerbst, S. (2006) "Early damage detection system for tower and rotor blades of offshore wind turbines," Proc. of the 3rd European Workshop on Structural Health Monitoring, Granada, Spain.
Rolfes, R., Zerbst, S., Haake, G., Reetz, J. and Lynch, J. P. (2007) "Integral SHM-system for offshore wind turbines using smart wireless sensors," Proc. of the 6th International Workshop on Structural Health Monitoring, Stanford, CA.
Schulz, M. J. and Sundaresan, M. J., (2006) Smart Sensor System for Structural Condition Monitoring of Wind Turbines, Technical Report NREL/SR-500-40089, National Renewable Energy Laboratory, Golden, CO.
Southern, A., (2007) "Michigan goes green," dBusiness, Vol. 2, 50-52.
Straser, E. and Kiremidjian, A. S., (1998) Modular, Wireless Damage Monitoring System for Structures Report #128, John A. Blume Earthquake Engineering Center, Stanford, CA.
Tanner, N. A., Farrar, C. R. and Sohn, H., (2002) "Structural health monitoring using wireless sensing system with embedded processing " Proceedings of SPIE, Vol. 4704, 215-224.
Tweedie, K. (2005) "Wind farm fears as blade snaps," The Times, April 16.
Wang, Y., Lynch, J. P. and Law, K. H., (2007) "A wireless structural health monitoring system with multithreaded sensing devices: design and validation," Structure and Infrastructure Engineering, Vol. 3(2), 103-120.
Whelan, M. J., Gangone, M. V., Janoyan, K. D., Cross, K. and Jha, R. (2007) "Reliable high-rate bridge monitoring using dense wireless sensor arrays," Proc. of International Workshop on Structural Health Monitoring, Stanford, CA.
Wiser, R. and Bolinger, M., (2007) Annual Report on U.S. Wind Power Installation, Costr and Performance Trends: 2006, U.S. Department of Energy (DOE), Washington D. C.
Zimmerman, A. T., Shiraishi, M., Swartz, R. A. and Lynch, J. P., (2008) "Automated modal parameter estimation by parallel processing within wireless monitoring systems," Journal of Infrastructure Systems, Vol. 14(1), 102-113.