student assessmen t i n sc arsd al e s cho o l s · student assessmen t i n sc arsd al e s cho o l...
TRANSCRIPT

STUDENT ASSESSMENT IN SCARSDALE SCHOOLS
Scarsdale embraces the importance of student assessment . It is one of the three, integral facets of the teaching and learning cycle along with curriculum and instruction .
In terms of an organizing structure, the curriculum is written based on learning standards and desired student outcomes. It is the “what” we want students to learn. The teacher then delivers customized instruction to help students master the desired learning outcomes. This is “how” students learn content and develop deep, enduring understanding. Finally, the teacher assesses students to determine whether we were successful. While there are implications for individual students, the real purpose is to inform the teacher. If learning results are less than expected, the teacher uses the assessment data to adjust instruction to elicit more favorable results. Similarly, the assessment data may reveal a misalignment in the curriculum that needs revision. The three elements of curriculum, instruction, and assessment, then, work together to create an iterative learning cycle.
Curriculum: What do we want students to know and be able to do? Instruction: How do we teach the curriculum? Assessment: How do we measure student learning?

PART I:
Assessment Defined
This report contains information about two aspects of student assessment in the Scarsdale Schools: (1) Scarsdale’s approach to student assessment, and (2) various assessment results.
Student assessment in the Scarsdale Schools includes both formal and informal classroom assessments and standardized testing. It is common for people to use “standardized testing” synonymously with “student assessment”; however, these are really not the same thing and do not serve the same purpose. Standardized testing is a snapshot in time of students performance on a given measure. Student assessment is much broader, encompassing a variety of ways to determine how students are progressing along a trajectory of learning over time.
In Scarsdale, student assessment includes authentically evaluating students’ abilities, relative strengths and weaknesses, and their ability to apply knowledge to “the real world.” It is an ongoing, iterative process in every classroom and critical to effective teaching and learning.
Standardized tests, on the other hand, provide summative and somewhat limited information that represent a single point in time. Although we don’t place a lot of value on this for gauging individual student achievement, we recognize that it is important to view results over time and to include this, along with other performance indicators, in evaluating student, program, school, and District performance. Trend data particularly helps to inform our work as we engage in goal-setting and instructional decision-making for the future.
Scarsdale Assessments
Scarsdale teachers evaluate student progress both informally and formally, providing an array of qualitative and quantitative feedback to students and parents.
Purposes of Assessments Assessment [OF] Learning: A summative measure of what a student has learned after instruction has ended, such as: unit test, mid-year exam, final exam. Assessment [AS] Learning: An assessment is the learning activity, such as the 5th grade Capstone project, an activity or project designed to also be a measure of learning. These are also known as performance assessments and typically include a scoring rubric. Assessment [FOR] Learning: A formative measure of what the student already knows and does not know so the teacher may plan future instruction accordingly. Some examples include a pretest on multiplying fractions and the STAR Reading and Math Assessments used as a universal screeners in Kindergarten through 5th grades to identify struggling learners.
1

Types of Assessments
Teacher Informal Assessment Our teachers evaluate students informally on a daily basis, observing their responses to questions, noting classroom contributions and interactions with other peers, evaluating the complexity of discourse, and identifying gaps in knowledge or understanding. The teacher uses these informal observations such as Observations, Questioning, Discussion, Exit/Admit Slips, Learning/Response Logs, Graphic Organizers, Peer/Self Assessments, Practice Presentations, Visual Representations, and Kinesthetic Assessments. These tools are used to answer questions such as: “Are the students learning specific skills?,” and “Have the students understood the concept I was trying to teach?” If the answer is “no,” the teacher looks for another way to illuminate the skill or concept, either for the whole class, identified groups, or individual students. If the answer is “yes,” then the teacher moves on to new material, content, and ideas.
Teacher Formal Assessment (Non-Standardized) Teachers augment informal student assessments with more formal measures. This affirms and deepens the teachers’ understanding of their students’ skills and knowledge both individually and collectively. Teachers use many types of formal assessment, including quizzes, exams, papers, essay questions, projects, math problems, science labs, and art or performance pieces, to name a few. Although formal assessments often mean a single measure, this is not always the case. An alternative type of assessment evaluates students using a variety of indicators and sources of evidence over time, for example:
Performance Assessment is a teacher’s evaluation of the process students use to solve a problem or complete a project demonstrating their knowledge and skills, as well as the evaluation of the product they create.
Portfolio Assessment involves teacher evaluation of a collection of samples of an individual student’s work showing progress over time.
Standardized Tests A standardized test is one that is designed in such a way that the questions, conditions for administering, scoring procedures, and interpretations are consistent, and they are administered and scored in a predetermined, standard manner. When statistically valid and reliable, these allow students in Scarsdale to be compared with students regionally, statewide, and nationally. There are two types of standardized tests:
Norm-referenced Tests (e.g., SATs): these provide a score that compares a student’s performance to that of students in a sample of peers. The goal is to rank students as being better or worse than other students based on the notion that this is a bell-shaped curve distribution of ability among students.
2

Criterion-referenced Tests (e.g. NYS Regents exams): these provide a score that compares a student’s performance to specific standards, or formal definitions of content, regardless of the scores of other examinees. These may also be described as standards-based assessments. Criterion-referenced score interpretations are concerned solely with whether or not this particular student's answer is correct. Under criterion-referenced systems, it is possible for all students to pass the test, or for all students to fail the test.
The current state tests for New York students in grades three through eight create a hybrid of these types causing major concerns about the accuracy and value of this data.
Most of the standardized tests we administer to our students in Scarsdale are required by state mandate. These tests serve a variety of compliance and regulatory purposes. Even so, we understand that they may provide some informative data for our use:
For teachers, parents, and students: this data can provide insight on students’ progress with basic skills and mastery or recall of subject area content.
For teachers: this may help to identify students in need of additional support or who have some specific skill deficiencies.
For administrators and teachers: collective student performance can provide insight on appropriate curriculum and instruction resources, sequencing of instructional units, and appropriate scaffolding and other supports that may be needed.
For the broad school community: this data may demonstrate how Scarsdale students perform relative to students in the region, state, and nation.
Limits of Standardized Tests Caution must be used when interpreting standardized test scores. They should not be the sole evaluation of student achievement or an educational program because these tests are concerned only with certain basic skills and abilities and are not intended to measure total achievement for each subject and grade. According to W. J. Popham (1999), uncritical use of standardized test scores to evaluate teacher and school performance is inappropriate because the students' scores are influenced by three things: what students learn in school, what students learn outside of school, and the students' innate intelligence. The school only has control over one of these three factors.
Value-added modeling (which is what our state tests purport to measure “teacher effectiveness”) has been proposed to cope with this criticism by statistically controlling for innate ability and out-of-school contextual factors. In a value-added system of interpreting test scores, analysts estimate an expected score for each student, based on factors such as the student's own previous test scores, primary language, or socioeconomic status. The difference between the student's expected score and actual score is presumed to be due primarily to the teacher's efforts. This results in student scores that have been mathematically altered through various algorithms further diluting individual and collective student scores.
3

Moreover, Education theorist, Bill Ayers (1993), has commented on the limitations of the standardized test saying, "Standardized tests can't measure initiative, creativity, imagination, conceptual thinking, curiosity, effort, irony, judgment, commitment, nuance, good will, ethical reflection, or a host of other valuable dispositions and attributes. What they can measure and count are isolated skills, specific facts and function, content knowledge, the least interesting and least significant aspects of learning."
Not only are these efforts often misplaced, but, “The overemphasis on standardized testing has caused considerable collateral damage in too many schools, including narrowing the curriculum, teaching to the test, reducing love of learning, pushing students out of school, driving excellent teachers out of the profession, and undermining school climate.” (Board of Education, 2013.)
Therefore, as a district, we believe that the best assessment of a student’s achievement is still classroom performance as judged by a teacher who sees the student’s work in a variety of situations over the course of a school year.
4

Part 2:
Scarsdale’s Approach to Student Assessment
1. What are our goals? We are a District where virtually every graduate goes to college, so we aim to provide an exceptional academic preparation. A handful of our graduates go directly to career training or careers, sometimes in workshop settings. To succeed and to lead after they leave us, our graduates should also possess certain related skills and abilities. Among the most important are initiative, perseverance, resourcefulness, inventiveness, and an ability to work with others. We also believe it’s important for our graduates to realize their potential in a full range of human endeavors, to become fulfilled, contributing human beings who learn throughout their lives. 2. How do we know if we’re successful? First, we look at end results both in terms of college acceptances and on graduates’ reports on their successes after they leave Scarsdale. College acceptance results have always been excellent and have grown even stronger over the last two decades.
In 2016, 98% of graduates are attending college, 97% to 4 year colleges. 63% of graduates were accepted at colleges and universities ranked “most competitive” in the U.S. These statistics compare with 61% in 2010, and 57% in 2005.
We do not know of another comprehensive, non-selective, public school district whose students achieve stronger results.
Graduates are overwhelmingly positive about the quality of the academic preparation they received in Scarsdale. In the most recent graduate survey conducted in 2012 by Futuristics Research, Inc., which surveyed the Classes of 2007 and 2010, 98.9 % of graduates reported that they either felt better prepared (76%) or as prepared (22.8%) as other students at that college while 1.1% felt not as well prepared. Graduates also provided positive feedback about their readiness in non-cognitive areas. The clear majority of respondents felt that they were able to pursue their passions in extracurricular activities (93.3%) The largest percentage of respondents felt that participation in extracurricular activities at SHS
5

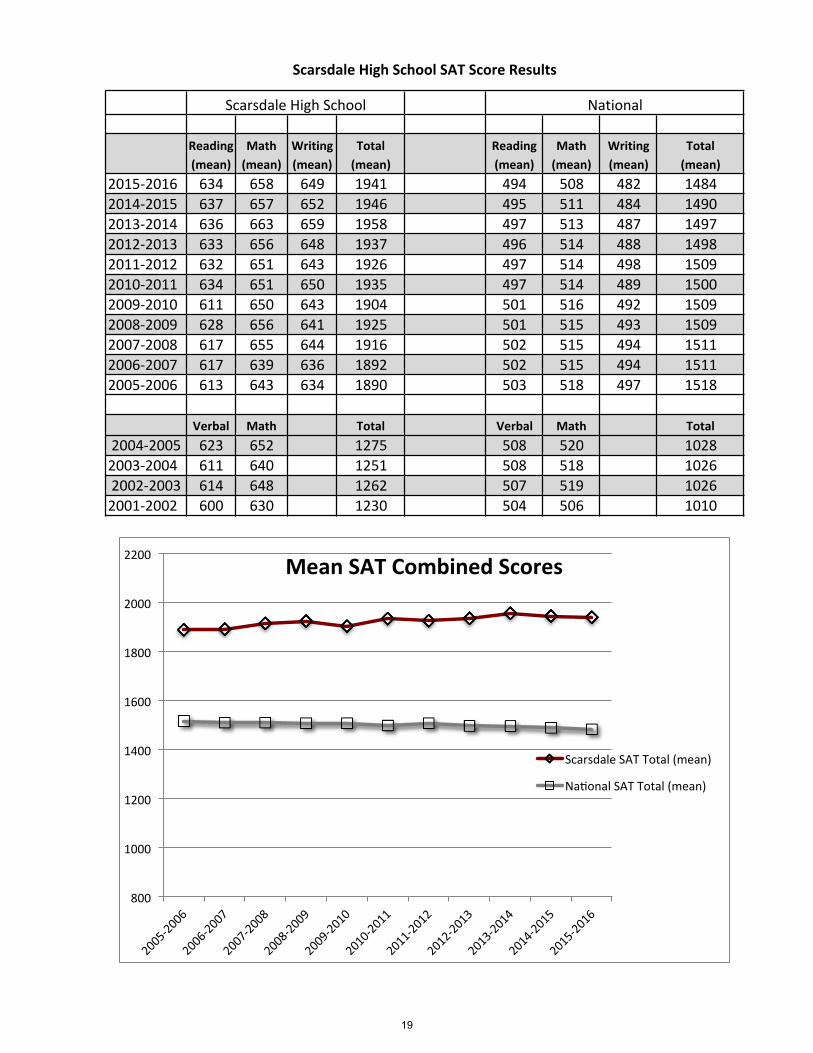
was impactful in the development of the areas of time management (83.7%), perseverance (81%), work ethic (87.2%), and resilience (84.9%). You cannot have strong graduate outcomes without a strong K-12 system. Decades-worth of data illustrate that the system produces strong results. SAT and AP Exams Our students take Advanced Placement and SAT examinations in grades 11 and 12. Historically, Scarsdale’s SAT results have been in the top 1% of the top 1% nationally. AP participation rates are not as high as in some comparable districts because Scarsdale does not have open enrollment in its college level high school courses. For the most part, these tests don’t give us results that help us understand teaching and learning, but they do provide us an independent external benchmark, so we can understand how our students fare in relation to others. (See appendix p. 19, 20, & 22)
In 2015-16, the most meaningful SAT and AP results were as follows: Scarsdale’s Mean Combined SAT Score Results continue to be the highest among
comparable districts in our region The percent of students receiving scores of 3,4,5 on AP Exams
is 98%, continuing the trend from 2006
In 2015-16, the most meaningful ACT results were as follows: English Math Reading Science Composite
Scarsdale mean 29.9 28.5 29.2 28.6 29.2
NYS mean 23.2 23.9 24.4 23.7 23.9
Scarsdale Common Assessment In addition to the assessments individual teachers develop for use in their classes, we have systematically developed “common” assessments of student growth in each grade/department/subject (See appendix p. 3, 4, & 7). In general, we are less interested in the numerical results of these measures than in the textured information they give us. It’s how we understand what students are learning (or not) and how to improve curriculum and teaching.
6

In 2015-16, the five most important conclusions from these measures were: Students are strengthening their skills to collaborate to solve complex problems; Students are more apt to persevere when student choice is embedded in performance based
assessments; Students benefit when teachers are able to monitor student progress closely and modify
instruction immediately as needed; Students fosters deeper learning with timely feedback from assessments; and Students consistently demonstrate that the alignment of instruction to assessment is
essential in measuring what is actually taught. Again, the main value of these measures is that they help us to understand what our students are learning and how can continue to improve curriculum and teaching.
We also use some third party publishers’ assessments, when they are appropriate and superior to measures we could produce on our own (e.g. STAR Assessment System, Developmental Reading Assessment [DRA], Lexia, and Fountas & Pinnell Benchmark Assessment System - currently in pilot stage).
International Comparisons: Global Learning Alliance The Global Learning Alliance (GLA) was co-founded in 2012 by the Scarsdale Public Schools, Teachers College at Columbia University, and Hwa Chong Institution (HCI) in Singapore .
Before that, in 2009, the Scarsdale Public Schools entered a partnership with a research team at Teachers College (TC) to explore what “world class” learning actually is. Prior to this endeavor, we could only speculate from our own anecdotal experience what the highest caliber student work in the world looks like, and how schools and teachers enable their students to produce it. To investigate this question in a systematic way, our research team identified core capacities that are important for students to acquire to be prepared for the challenges of the 21st century, and developed a research framework based on these capacities. Our interest in identifying global, exemplar student work led our TC research partners to arrange site visits to international schools that are acknowledged leaders in their countries, including Hwa Chong Institution.
The first GLA Summit hosted in Singapore in 2012 by HCI, brought together representatives from those schools and associated universities to consider the information/\ and findings gathered by the TCt researchers, and to gauge the level of interest in continuing our association beyond that meeting. The Summit was a great success, with much information shared by the participants, and there was indeed an outpouring of interest to support a second GLA Summit, which took place in Scarsdale in 2014. At this event participants provided an update of their work in fostering students’ core capacities. They also discussed developing a pilot assessment of students’ ability to solve non-standard, complex, global problems in collaborative groups. The first such problem selected was “The Global Warming Challenge: Keeping global warming below 2°C.” A review of the resulting global project was a highlight of the third GLA Summit in August, 2016, and is reflective of its theme: Educating Students for a Global
7

Tomorrow. An overview, background, and list of participants in the third summit can be found in the Appendix pages 27-28.
Standardized Tests We give standardized state assessments at each grade, 3-8, and in Regents courses at the High School. Testing results do not inform instruction as teachers get a score from the spring tests in the beginning of the next school year, too late to make any instructional changes. By then, students have moved on to new teachers. Furthermore, the New York State assessments do not provide valuable information to allow districts to analyze trend lines because the state has changed the tests every few years. In fact, the 3-8 state tests were revised in 2010 and 2013. The data displays in the Appendix, pages 9 to 17 show significant dips in students scores in those years, affecting not only Scarsdale scores, but those in comparable districts, the Lower Hudson region, and statewide.
Prior to the early 2000’s, Scarsdale administered other standardized tests (Educational Records Bureau [ERB]) that were more useful for evaluating what individual students knew and could do, that provided superior information for possible adaptations in curriculum and teaching, and that enabled the District to compare performance with performance in a universe of high-performing public schools and with selective independent schools. We discontinued use of these tests due to the number and intrusiveness of the state exams.
In 2015-16, an analysis of state test results led to the following main conclusions:
Overall, school-to-school differences in elementary students’ scores were not significant As in past years, Middle School scores inconsistently predicted student High School performance
on Regents examinations, which continued to be strong Overall, test scores were among the strongest in New York State and in the same range as those in
a selected group of comparable districts The most important information is that which is gathered by teachers daily in the classroom, and how that information is used to drive instruction. Testing results do not inform instruction as teachers get a score from the spring tests in the beginning of the next school year, too late to make any instructional changes. By then, students have moved on to new teachers.
Non-Cognitive Areas Finally, we use a number of measures to evaluate student achievement and/or growth in important non-cognitive areas. Of necessity, these are often proxy, as distinct from direct, measures. Data for the Class of 2015-2016:
8

Percentage of total 2015-16 student enrollment that took advanced math (calculus/pre-calculus): 39.5%.
Percentage of total student enrollment involved in extracurricular activities other than athletics: approximately 75%
Percent participation in athletics: Fall (501/1525 [33%]); Winter (374/1525 [25%]); Spring (450/1525 [27%]) = All three seasons without duplication (867/1525 [57%]).
Special Services
Special Education We also specifically evaluate the performance of Scarsdale students in our special education programs and have delivered extensive reports on the results in the past. For the present, however, we report that as a group, special education students in Scarsdale outperformed the average American student in the regular education population, and that career preparation/placement for those not pursuing a college education was strong. Academic Intervention Services (AIS) - Local Effort Individual teachers monitor test score data for areas of concern with students. These students are brought to Child Study Team (CST) in each building where a group of professionals investigate all areas of a student's performance. Scarsdale’s 2016 AIS plan, approved by the School Board in October, 2016, can be found here. Recent Articles The Test is Tricky: New York Times - Aug, 10, 2015 Test Scores Under Common Core Show That ‘Proficient’ Varies by State: New York Times - Oct, 6, 2015
Gov Cuomo Creates Committee to Review Common Core and the Tests: September 28, 2015 - Albany, NY The Opt Out Movement in Numbers: New York Times - Aug 12, 2015 Inflated Test Scores: Measuring Up: What Educational Testing Really Tells Us by Daniel Koretz - Ch. 10
9

Appendix Table of Contents
Standardized Testing in Scarsdale ..................................................................................... 2 Overview of K-5 Assessments ............................................................................................ 3 SMS Overview of Grades 6 - 8 Assessments ..................................................................... 4 Scarsdale High School Common Final Assessments ......................................................... 7 Elementary & Middle School Reports – NYS 3-8 Testing Program (Data derived from NYSED Public Access Data Site)
NYS ELA Proficiency Rate ....................................................................................... 9 NYS MATH Proficiency Rate ................................................................................... 10 Elementary ELA Percent Proficient .......................................................................... 11 Elementary MATH Percent Proficient ...................................................................... 12 Middle School ELA Percent Proficient ..................................................................... 13 Middle School MATH Percent Proficient .................................................................. 14 ELA Grades 3-8 Percent Proficient Comparison Chart ............................................ 15 MATH Grades 3-8 Percent Proficient Comparison Chart ........................................ 16 ELA & MATH Elementary School Historical Chart ................................................... 17 Median Scale Scores Between Level 2 & Level 3 (for AIS) ..................................... 18
High School Reports
Scarsdale High School SAT Score Results ............................................................. 19 Mean Combined SAT Scores of Comparable Districts ............................................ 20 Scarsdale Schools ACT Report ............................................................................... 21 Scarsdale High School Advanced Placement Exam Score Results ........................ 22 Scarsdale High School Regents Report .................................................................. 23 Scarsdale Graduates to College .............................................................................. 24 Percent Accepted to Most Selective Colleges ......................................................... 24 Students Named National Merit Semifinalists .......................................................... 25 Students Who Received National Merit Letters of Commendation .......................... 25 SAT Subject Test Mean Scores ............................................................................... 26
The Global Learning Alliance .............................................................................................. 27 Response to Intervention (RTI) ........................................................................................... 30 STAR Digital Assessment System ...................................................................................... 31

Standardized Testing in Scarsdale
Test TO EVALUATE GRADE TEST GIVEN
RESULTS AVAILABLE
NYS Tests ELA, Math Science Grades 38 Grades 4 & 8
April, May & June August
NYS Regents Algebra, English, U.S. History & Gov't., Global History, Living
Environment
Grades 811 August, January & June
August, January & June
* PSAT Critical Reading & Math
Primarily Grade 11 (with a few
10s)
October December
* ACT or SAT Critical Reading, Math & Writing
Grades 1112 Throughout the year
Two to four weeks after the student takes the test
*SAT Subject Tests
Academic Subjects Grades 912 Throughout the year
Two to four weeks after the student takes the test
*Advanced Placement Test (AP)
Academic Subjects Grades 912 Throughout the year
Two to four weeks after the student takes the
test
**NYSESLAT English Proficiency K12 AprilMay Late summer
**NYSITELL English Proficiency Diagnostic for
Course Placement
K12 Upon the ELL student's entry into
the district
Shortly after completion of the
exam
* Students have the opportunity to take these standardized tests depending on their particular experiences and educational plans ** Limited English Proficiency (LEP) only.
2

Overview of K-5 Assessments
1st 2nd 3rd
Trimester Trimester Trimester
Sept. Sept.
Jan. Jan.
May May
SCIENCENYS ELA
MATHNYSMath
ELASTAR Math
May
May Nov.Jan. -
Multiplication
Feb. - Fractions
June
Nov.
Nov. March June
STAR Reading
K One rubric can be applied to all units to measure growth
Fall Assessment to be completed by end of second marking period. Spring Assessment - JuneFall Assessment to be completed by end of second marking period. Spring Assessment - JuneFall Assessment to be completed by end of second marking period. Spring Assessment - June
Fall Assessment to be completed by end of first marking period. Spring Assessment - June
SOCIALSTUDIES
1
NarrativeAssessments*
InformationalOn Demand Assessment*
Fall Spring
March
4 March
Plants unit rubric-fall Chicks unit rubric- April/May
Adaptations Unit- (Embedded in Animal units throughout the year) October - May
Plants UnitMay/June
May
Spring Capstone Project April - June
Effervescent Launchers Unit and Mixtures and Solutions Unit (use Process Skills rubric)
Nov. March June
"Open Style" Tasks Nov. - Numeration
Dec. - MeasurementFeb. - Multiplication
May - Fractions
* Genre assessment determined by school curriculum calendar
Fall Assessment to be completed by the end of the first marking period
Fall Explorers Assessment to be completed by the end of second marking period. Spring Assessment - June
Ecosystems - (Embedded assessments throughout year)
NYS Science Performance May - JuneWritten - June
2
3 March
5
Jan - FractionsMarch - Area &
Perimeter
June
"Open Style" Tasks
Jan - FractionMarch - Volume
3

SMS Overview of Grades 6 - 8 Assessments (Common/N.Y.S.)
Grade 6 Grade 7 Grade 8 Grade 6 Grade 7 Grade 8
Speech Unit
Speech Unit; Romeo &
Juliet/benchmark essay
NYS ELA NYS ELA NYS ELA
Cumulative Assessment
NYS Math NYS Math NYS Math
Writing Benchmark
8th grade end of the year project Final Exam Gr. 8 Final
Exam
Speeches grammar post-test Algebra Regents
September
English Math
December
January
November
pre-assessment benchmark
grammar pre-test Inventory
Character trait paragraph
Literary essay (ongoing
throughout the year)
October
February
March
April
May
June
Literary essay (ongoing
throughout the year)
Julius Caesar benchmark
essay
theme essay
Writing about conflict (time of year varies
by house)
4

SMS Overview of Grades 6 - 8 Assessments (Common/N.Y.S.)
Grade 6 Grade 7 Grade 8 Grade 6 Grade 7 Grade 8Pre -
assessment SLO
Density Cube Lab
Mid-year assessment/re
flection
Natural Selection
Simulation
Final Exam NYS Written 6/5
Post Assessment
SLO
8th grade end of the year project
Science Social Studies
Pre - assessment
SLO
Pre - assessment
SLO
Country Project
7th grade social studies e-portfolio
(throughout the school year)
Thematic DBQ (throughout the
school year)
Scientific Method/Measu
rement Assessment
Solar Home Stem Project
Thematic DBQ
Human Rights e-portfolio and
PSA
Post Assessment
SLO
NYS Performance
5/24
Flower Forensics Lab
Revolutionary Rally iMovie
Ideal Civilization
Project
Civil War Museum
8th grade end of the year project
5

SMS Overview of Grades 6 - 8 Assessments (Common/N.Y.S.)
Grade 6 Grade 7 Grade 8
Sp 6 aural/oral Sp 7 Chapter 3 Sp 8 Chapter 9
Fr 6 introductory topics Fr 7 Chapter 1, 2 Fr 8 Chapters 9, 10
Sp 6 Mini Unit 1 Sp 7 Chapter 4
Fr 6 Classroom and Useful expressions Fr 7 Chapter 3
Sp 6 Mini Unit 2 Sp 7 Chapter 5 Sp 8 Chapter 10
Fr 6 Residence, Numbers, weather Fr 7 Chapter 4 Fr 8 Chapter 13
Sp 6 Mini Unit 4 Sp 7 Chapter 6 Sp 8 Chapter 11
Fr 6 Classroom, time, colors
Fr 7 Human Rights Project
Fr 8 Chapter 12, Human Rights project
Sp 6 Mini Unit 4 Sp 7 Capítulo Puente Sp 8 Chapter 12, Madrid Project
Fr 6 Café and Jardin French 7, Chapter 5, Country Project Fr 8 Chapter 17
Sp 6 Mini Units 5,6 Sp 7 Chapter 7, Country Project Sp 8 Unidad 1 Etapa 2
Fr 6 Shopping and the market Fr 7 Chapter 6 Fr 8 Chapter 14, Paris
Project
Sp 6 Mini Unit 7 Sp 8 unidad 1 Etapa 3
Fr 6 Sports Fr 8 Chapter 15
Sp 6 Mini Unit 8 Sp 7 Chapter 8 Sp 8 Intro to Imperfect.
Fr 6 Likes and Dislikes Fr 7 Chapter 8 Fr 8 Chapter 16, 17
World Language
Spanish 6 common diagnostic
Common Diagnostic Common Diagnostic
Final Exam
Fr 8 Chapter 11
Aural/Oral Assessment Final Exam
6

Scarsdale High School Common Assessments, 2016-17 Members of each department at Scarsdale High School work together to establish common course goals, devise approaches to teaching material, and create final assessments. The following table identifies each department’s common assessments. Arts Ninth grade art classes participate in a Cooper Hewitt Museum project and a required final art project, which is posted on Schoolwires. English Ninth grade: Shakespeare Festival; essays of literary analysis Tenth grade: essays of literary analysis; digital argumentation Eleventh grade: literary research paper; essays of literary analysis; New York State Regents Exam Twelfth grade: research paper; essays of literary analysis Mathematics Grades 9-12: At monthly course meetings, teachers share lessons, unit tests and quarterly tests with each other, so the assessments are not exactly the same, but the formats and questions are similar. Each course culminates in a common final exam. AT Statistics: Juniors in AT Statistics do a year-end project for which the requirements and grading rubric are common to all sections of the course. The students formulate and analyze a research question using the Adolescent Heath Database from the University of North Carolina Population Center. This project is funded by the National Science Foundation, and students use Google Hangouts to communicate with Wesleyan University students who help students to learn the software program “R” and develop techniques for analyzing their data. This project is in addition to a common final exam. Performing Arts Assessments for performing ensembles include individual evaluations of prepared selections, live or recorded performances, and winter and spring concerts or performances. In academic music classes, such as AT Music Theory, Digital Music, and Music Appreciation, students may compose a piece or write music for a film clip or make presentations in which they connect aural and multi-media materials to an issue, style, or concept.
7

Physical Education During each quarter students participate in skills performance assessments, often in both of the two units that are covered. Assessments can be live action viewing, video playback self-assessment, peer-assessment, or teacher-assessment. Each has its own rubric. A quarterly cognitive assessment piece takes the form of either a formal written test or a variety of writing assignments developed by the department (i.e., a review of a fitness-based app, a self-designed workout plan for a specific fitness goal, etc.). Science All ninth-graders take the New York State Living Environment Regents exam. Chemistry 513 students take the New York State Chemistry Regents exam. All other students take a local final exam that grows out of collaborations among teachers of each course. For the last two or three years, Environmental Science has concluded with presentations of research or culminating projects. Social Studies 9th Grade World History: World Cities Project 10th Grade World History
• document-based question on globalization • multi-step, process-oriented research paper project • New York State Regents Exam in Global History
Eleventh grade
• multi-step, process-oriented research paper project • New York State Regents Exam in United States History
Twelfth grade
• multi-step, process-oriented research paper project Advanced Topics courses (AT U.S. History, AT U.S. Constitutional Law, AT American Government, AT International Politics, AT Psychology, AT Macroeconomics): common final exam in each course World Languages Common assessments in World Languages are designed by the teachers within each course team (e.g., Spanish 323, French 344, etc.). All common assessments evaluate the four skills of language. In Spanish AT Language & Culture, a portfolio of student work serves as the final assessment.
8

ELA
Grade Level 2006 2007 2008 2009 2010 2011 2012 2013 2014 2015 20163 92% 91% 96% 95% 78% 88% 87% 64% 70% 58% 87%4 96% 93% 93% 97% 85% 89% 87% 66% 55% 70% 83%5 97% 94% 99% 95% 81% 82% 90% 73% 69% 55% 71%6 91% 94% 95% 97% 86% 87% 88% 74% 60% 63% 56%7 94% 90% 93% 98% 87% 88% 85% 67% 64% 65% 66%8 86% 95% 92% 93% 88% 87% 88% 70% 75% 72% 80%
Avg 3-‐8 93% 93% 95% 96% 84% 87% 87% 69% 66% 64% 74%
Grade 2008 2009 2010 2011 2012 2013 2014 2015 20163 98% 100% 85% 96% 77% 66% 62% 65% 83%4 91% 95% 86% 91% 85% 63% 51% 62% 84%5 100% 93% 72% 77% 91% 65% 66% 59% 63%Avg 96% 96% 81% 88% 84% 65% 60% 62% 77%
Grade 2008 2009 2010 2011 2012 2013 2014 2015 20163 95% 99% 79% 92% 93% 59% 65% 52% 96%4 97% 93% 91% 93% 97% 73% 46% 69% 84%5 99% 96% 83% 90% 90% 80% 72% 45% 67%Avg 97% 96% 85% 92% 93% 71% 61% 56% 82%
Grade 2008 2009 2010 2011 2012 2013 2014 2015 20163 97% 89% 88% 93% 89% 71% 63% 46% 74%4 88% 100% 77% 96% 86% 75% 50% 77% 78%5 100% 91% 90% 72% 94% 77% 79% 60% 80%Avg 95% 93% 85% 87% 90% 74% 64% 61% 77%
Grade 2008 2009 2010 2011 2012 2013 2014 2015 20163 94% 97% 67% 78% 86% 58% 76% 63% 100%4 95% 97% 84% 77% 88% 59% 72% 74% 78%5 95% 99% 78% 85% 82% 70% 71% 60% 72%Avg 94% 97% 76% 80% 85% 62% 73% 66% 83%
Grade 2008 2009 2010 2011 2012 2013 2014 2015 20163 97% 92% 70% 81% 88% 65% 82% 68% 82%4 94% 100% 86% 90% 80% 59% 55% 70% 91%5 100% 96% 86% 83% 92% 72% 56% 57% 71%
97% 96% 80% 85% 87% 65% 64% 65% 81%
Grade 2008 2009 2010 2011 2012 2013 2014 2015 20166 95% 97% 86% 87% 88% 74% 60% 63% 56%7 93% 98% 88% 88% 85% 67% 64% 65% 66%8 93% 94% 88% 87% 88% 70% 75% 72% 80%Avg 93% 96% 87% 87% 87% 70% 66% 67% 67%
Quaker Ridge
Middle School
NYS ELA Proficiency Rate (Level 3 and 4) 2006-‐2016
Edgewood
Fox Meadow
Greenacres
Heathcote
Historical Comparison of Scarsdale's Proficiency Rate
9

Math
GradeLevel 2006 2007 2008 2009 2010 2011 2012 2013 2014 2015 20163 96% 96% 98% 99% 83% 91% 89% 65% 78% 72% 83%4 98% 96% 97% 98% 93% 92% 95% 75% 73% 80% 84%5 93% 97% 97% 97% 87% 93% 95% 69% 79% 73% 80%6 89% 88% 96% 94% 83% 89% 92% 75% 73% 80% 76%7 87% 87% 93% 97% 78% 90% 94% 63% 68% 73% 78%8 93% 90% 91% 96% 80% 92% 95% 61% 59% 71% 81%
Avg3-8 93% 93% 95% 97% 84% 91% 93% 68% 72% 75% 80%
Grade 2008 2009 2010 2011 2012 2013 2014 2015 20163 99% 100% 94% 92% 86% 75% 78% 72% 77%4 100% 99% 97% 94% 98% 64% 76% 81% 82%5 93% 100% 92% 95% 99% 70% 72% 74% 79%Avg 97% 100% 95% 94% 94% 70% 75% 76% 79%
Grade 2008 2009 2010 2011 2012 2013 2014 2015 20163 99% 100% 94% 92% 86% 75% 78% 72% 97%4 100% 99% 97% 94% 98% 64% 76% 81% 89%5 93% 100% 92% 95% 99% 70% 72% 74% 79%Avg 97% 100% 95% 94% 94% 70% 75% 76% 88%
Grade 2008 2009 2010 2011 2012 2013 2014 2015 20163 100% 98% 89% 93% 90% 66% 68% 69% 67%4 90% 100% 85% 97% 97% 89% 74% 94% 80%5 100% 92% 87% 84% 97% 77% 91% 82% 88%Avg 97% 96% 87% 91% 95% 77% 78% 82% 78%
Grade 2008 2009 2010 2011 2012 2013 2014 2015 20163 94% 98% 65% 89% 94% 60% 86% 64% 89%4 99% 92% 93% 77% 91% 79% 74% 78% 80%5 96% 99% 84% 94% 87% 68% 78% 74% 78%Avg 96% 96% 81% 87% 91% 69% 79% 72% 82%
Grade 2008 2009 2010 2011 2012 2013 2014 2015 20163 99% 100% 74% 83% 83% 57% 81% 81% 85%4 100% 100% 94% 96% 93% 69% 78% 77% 91%5 98% 100% 82% 95% 93% 56% 65% 78% 75%
Avg 99% 100% 83% 91% 90% 61% 75% 78% 83%
Grade 2008 2009 2010 2011 2012 2013 2014 2015 20166 96% 94% 83% 89% 92% 75% 73% 80% 76%7 92% 97% 78% 90% 94% 63% 68% 73% 78%8 91% 96% 80% 93% 95% 61% 59% 71% 81%Avg 93% 96% 80% 91% 94% 66% 67% 75% 79%
QuakerRidge
MiddleSchool
NYSMATHProficiencyRate(Level3and4)2006-2016
Edgewood
FoxMeadow
Greenacres
Heathcote
HistoricalComparisonofScarsdale'sProficiencyRate
10

Percent Proficient (Level 3 and 4)
Gr Scarsdale Edgemont BronxvilleGreatNeck
ChappaquaRye City
Mam'kByramHills
ArdsleyBlind Brook-‐
Rye3 87 84 87 76 82 74 65 62 71 704 83 72 79 81 76 67 69 68 63 655 70 78 64 66 60 56 62 63 47 44Avg 80 78 77 74 73 66 65 64 60 60
Gr Edgemont Bronxville ChappaquaGreatNeck
Scarsdale ByramHills
Mam'kRye City
ArdsleyBlind Brook-‐
Rye3 61 66 60 65 58 58 59 52 44 444 77 68 71 63 70 65 61 53 48 485 71 60 60 59 55 59 58 49 45 45Avg 70 65 64 62 61 61 59 51 46 46
Gr Bronxville Chappaqua Scarsdale Byram Hills
Edgemont Mam'kGreat Neck
RyeCity
Blind Brook-‐Rye
Ardsley
3 78 73 70 65 74 59 66 57 55 494 67 74 54 58 56 62 57 48 54 455 73 62 69 68 59 63 57 60 50 49Avg 73 70 64 64 63 61 60 55 53 48
Gr Bronxville Chappaqua Scarsdale Rye City
Blind Brook-‐ Rye
EdgemontGreat Neck
Mam'k ArdsleyByram Hills
3 72 75 64 55 80 61 63 67 53 534 75 66 65 68 60 56 61 53 65 605 65 71 73 71 51 73 61 59 55 54Avg 71 71 67 65 64 63 62 60 58 56
Gr BronxvilleBlind Brook-‐
RyeRye City
Chappaqua Scarsdale EdgemontByram Hills
Mam'k ArdsleyGreat Neck
3 93 92 90 83 87 80 82 81 83 834 92 87 91 91 86 88 86 86 82 785 94 86 84 89 89 89 85 83 81 83Avg 93 88 88 88 87 86 84 83 82 81
2015 ELA Performance of Comparable Districts
2014 ELA Performance of Comparable Districts
2013 ELA Performance of Comparable Districts
2012 ELA Performance of Comparable Districts
Elementary ELA2016 ELA Performance of Comparable Districts
11

Percent Proficient (Level 3 and 4)
Gr Bronxville ScarsdaleGreat Neck
EdgemontBlind Brook-‐
RyeChappaqua Mam'k
Byram Hills
ArdsleyRye City
3 87 83 79 80 81 74 70 63 69 654 85 84 87 80 79 75 75 78 66 665 82 79 79 83 61 71 67 70 71 74Avg 85 82 82 81 74 73 71 70 69 68
Gr Bronxville EdgemontGreat Neck
ScarsdaleBlind Brook-‐
RyeChappaqua
Byram Hills
Mam'kRye City
Ardsley
3 81 78 77 72 77 71 74 71 56 664 84 83 74 80 70 74 74 70 78 655 71 71 77 73 78 76 68 75 67 68Avg 79 77 76 75 75 74 72 72 67 66
Gr Bronxville Scarsdale Edgemont Great Neck Mam'k ChappaquaByram Hills
Blind Brook-‐Rye
Rye City
Ardsley
3 89 79 77 70 73 75 76 74 66 634 72 72 70 72 71 74 66 72 59 535 78 79 72 76 73 68 73 68 74 76Avg 80 77 73 73 72 72 72 71 66 64
Gr Bronxville Rye City Scarsdale Blind Brook-‐Rye
EdgemontGreat Neck
Mam'k ChappaquaByram Hills
Ardsley
3 65 63 66 87 60 69 67 66 56 444 82 74 75 68 68 70 71 65 72 665 66 76 70 52 76 61 56 64 65 66Avg 71 71 70 69 68 67 65 65 64 59
Gr Bronxville Rye City Scarsdale Byram Hills
Mam'k ChappaquaGreat Neck
Blind Brook-‐Rye
Edgemont Ardsley
3 96 93 89 88 85 82 88 91 83 854 97 95 96 90 92 97 91 89 96 905 93 97 95 95 93 91 90 91 89 90Avg 95 95 93 91 90 90 90 90 89 88
2015 MATH Performance of Comparable Districts
2014 MATH Performance of Comparable Districts
2013 MATH Performance of Comparable Districts
2012 MATH Performance of Comparable Districts
Elementary MATH2016 MATH Performance of Comparable Districts
12

Percent Proficient (Level 3 and 4)
Gr Byram Hills
EdgemontGreat Neck
Chappaqua Bronxville Scarsdale Ardsley Mam'kRye City
Blind Brook-‐Rye
6 87 69 62 64 65 56 69 64 62 527 71 63 73 69 66 66 60 65 62 598 67 83 80 80 74 80 73 65 68 56
avg 6-‐8 75 72 72 71 68 67 67 65 64 56
Gr Byram Hills
Chappaqua Scarsdale BronxvilleRye City
Great Neck
Edgemont Mam'k ArdsleyBlind Brook-‐
Rye6 76 58 63 68 64 63 64 57 58 497 56 68 65 62 66 66 70 60 45 468 83 77 72 71 71 70 58 68 57 62
avg 6-‐8 72 68 67 67 67 66 64 62 53 52
Gr Bronxville Chappaqua ScarsdaleRye City
Byram Hills
Mam'k EdgemontGreat Neck
ArdsleyBlind Brook-‐
Rye6 n/a 75 60 62 67 57 68 54 46 377 67 73 63 66 57 65 58 54 56 398 74 65 75 71 72 64 59 63 68 68
avg 6-‐8 71 71 66 66 65 62 62 57 57 48
Gr Scarsdale Chappaqua Byram HillsRye City
Edgemont Bronxville ArdsleyBlind Brook-‐
RyeGreat Neck
Mam'k
6 75 68 76 71 72 69 57 50 61 587 68 70 61 69 66 64 71 61 59 588 70 72 74 63 62 66 67 71 64 61
avg 6-‐8 71 70 70 68 67 66 65 61 61 59
Gr Rye City
Scarsdale Byram Hills Bronxville Chappaqua Edgemont ArdsleyBlind Brook-‐
RyeGreat Neck
Mam'k
6 90 87 90 88 85 88 81 79 80 817 91 86 81 83 86 84 85 79 78 778 84 89 89 89 86 85 85 84 78 73
avg 6-‐8 88 87 87 87 86 86 84 81 79 77
2015 Performance of Comparable Districts
2014 ELA Performance of Comparable Districts
2013 ELA Performance of Comparable Districts
2012 ELA Performance of Comparable Districts
Middle School ELA2016 Performance of Comparable Districts
13

Percent Proficient (Level 3 and 4)
Gr Chappaqua Edgemont Scarsdale BronxvilleGreat Neck
ArdsleyByram Hills
Rye City
Blind Brook-‐Rye
6 89 84 76 69 75 72 88 70 637 83 69 78 84 85 74 83 81 718 88 84 81 62 57 67 43 61 73
avg 6-‐8 87 79 78 72 72 71 71 71 69
Gr Chappaqua Scarsdale EdgemontRye City
BronxvilleByram Hills
ArdsleyGreat Neck
Blind Brook-‐Rye
6 82 80 78 75 78 86 80 80 587 82 73 78 79 69 77 71 73 668 83 71 66 67 70 52 59 53 63
avg 6-‐8 82 75 74 74 72 72 70 69 62
Gr ChappaquaRye City
Byram Hills
EdgemontGreat Neck
Scarsdale Ardsley Bronxville Mamaroneck
6 91 75 83 83 74 72 69 61 707 79 68 76 68 74 68 70 66 698 81 73 48 57 57 59 60 66 33
avg 6-‐8 84 72 69 69 68 66 66 64 57
Gr ChappaquaRye City
Byram Hills
Ardsley ScarsdaleGreat Neck
EdgemontBlind Brook-‐
RyeMamaroneck
6 83 80 78 73 75 67 70 49 597 71 78 71 70 62 61 66 61 628 75 59 68 61 61 59 48 70 55
avg 6-‐8 76 72 72 68 66 62 61 60 59
Gr Ardsley ScarsdaleByram Hills
ChappaquaRye City
Blind Brook-‐Rye
Bronxville EdgemontGreat Neck
6 96 92 95 93 94 94 90 93 917 93 94 91 92 94 93 95 89 928 96 95 96 96 95 95 91 93 89
avg 6-‐8 95 94 94 94 94 94 92 92 91
2015 MATH Performance of Comparable Districts
2014 MATH Performance of Comparable Districts
2013 MATH Performance of Comparable Districts
2012 MATH Performance of Comparable Districts
Middle School MATH2016 MATH Performance of Comparable Districts
14

Percent Proficient (Levels 3 and 4)
ELA grades 3‐8 2012 2013 2014 2015 2016
Scarsdale 87% 69% 66% 64% 64%
Comparable Districts* 85% 64% 61% 61% 60%
Lower Hudson Region 68% 42% 38% 39% 46%
NY State 55% 31% 31% 31% 38%
Scarsdale vs State difference 32% 38% 35% 33% 26%
Scarsdale vs LHR difference 20% 27% 28% 26% 18%
Scarsdale vs Comp Dist diff 2% 5% 5% 3% 4%
* Ardsley, Blind Brook‐Rye, Bronxville, Byram Hills, Chappaqua, Edgemont,
Great Neck, Mamaroneck, and Rye City
0%
10%
20%
30%
40%
50%
60%
70%
80%
90%
100%
2012 2013 2014 2015 2016
ELA Gr. 3-8 Percent Proficient
Scarsdale
ComparableDistricts*
Lower HudsonRegion
NY State
15

PercentProficient(Levels3and4)
MATHgrades3-8 2012 2013 2014 2015 2016Scarsdale 93% 68% 72% 75% 80%ComparableDistricts* 92% 66% 69% 72% 75%LowerHudsonRegion 73% 39% 42% 45% 46%NYState 65% 31% 36% 38% 39%ScarsdalevsStatedifference 28% 37% 36% 37% 41%ScarsdalevsLHRdifference 20% 29% 30% 30% 35%ScarsdalevsCompDistdiff 1% 2% 3% 3% 5%
*Ardsley,BlindBrook-Rye,Bronxville,ByramHills,Chappaqua,Edgemont,GreatNeck,Mamaroneck,andRyeCity
0%
10%
20%
30%
40%
50%
60%
70%
80%
90%
100%
2012 2013 2014 2015 2016
MATH Gr. 3-8 Percent Proficient
Scarsdale
Comparable Districts*
Lower Hudson Region
NY State
16

17

Grade NYS Level 1 NYS Level 2 NYS Level 3 NYS Level 4Median Scale Score between Level 2 and
Level 33 177-‐290 291-‐319 320-‐357 358-‐414 3054 172-‐286 287-‐319 320-‐342 343-‐410 3035 112-‐288 289-‐319 320-‐345 346-‐415 3046 128-‐282 283-‐319 320-‐337 338-‐419 3017 147-‐286 287-‐317 318-‐346 347-‐413 3028 130-‐283 284-‐315 316-‐342 343-‐395 300
Grade NYS Level 1 NYS Level 2 NYS Level 3 NYS Level 4Median Scale Score between Level 2 and
Level 33 137-‐284 285-‐313 314-‐339 340-‐401 2994 143-‐282 283-‐313 314-‐340 341-‐405 2985 153-‐293 294-‐318 319-‐345 346-‐416 3066 132-‐283 284-‐317 318-‐339 340-‐423 3017 150-‐292 293-‐321 322-‐347 348-‐409 3078 132-‐286 287-‐321 322-‐348 349-‐407 304
Students who score below the median scale score between level 2 and level 3 (see shaded column in charts below) or referred by their teacher or parent are reviewed by the school Child Study Team (CST).
Grades 3-‐8 ELA Scale Score Ranges by Performance Level andMedian Scale Score between Level 2 and Level 3
Grades 3-‐8 Mathematics Scale Score Ranges by Performance Level andMedian Scale Score between Level 2 and Level 3
Academic Intervention Services (AIS)Median Scale Scores Between Level 2 and Level 3
18
Crit. Reading(mean)
Math(mean)
Writing(mean)
Total(mean)
Crit. Reading(mean)
Math(mean)
Writing(mean)
Total(mean)
2015-‐2016 634 658 649 1941 494 508 482 14842014-‐2015 637 657 652 1946 495 511 484 14902013-‐2014 636 663 659 1958 497 513 487 14972012-‐2013 633 656 648 1937 496 514 488 14982011-‐2012 632 651 643 1926 497 514 498 15092010-‐2011 634 651 650 1935 497 514 489 15002009-‐2010 611 650 643 1904 501 516 492 15092008-‐2009 628 656 641 1925 501 515 493 15092007-‐2008 617 655 644 1916 502 515 494 15112006-‐2007 617 639 636 1892 502 515 494 15112005-‐2006 613 643 634 1890 503 518 497 1518
Verbal Math Total Verbal Math Total2004-‐2005 623 652 1275 508 520 10282003-‐2004 611 640 1251 508 518 10262002-‐2003 614 648 1262 507 519 10262001-‐2002 600 630 1230 504 506 1010
NationalScarsdale High School
Scarsdale High School SAT Score Results
800
1000
1200
1400
1600
1800
2000
2200 Mean SAT Combined Scores
Scarsdale SAT Total (mean)
NaBonal SAT Total (mean)
19

District Scarsdale ChappaquaBlind Brook(Rye Brook)
BronxvilleByramHills
Rye Great NeckNorth
Edgemont
Crit Reading 634 627 623 607 599 592 583 494Math 658 637 638 635 638 614 630 508Writing 649 649 634 613 601 618 590 482Total 1941 1913 1895 1855 1838 1824 1803 1484
District Scarsdale Chappaqua BronxvilleBlind Brook(Rye Brook)
ByramHills
Edgemont Rye Great NeckNorth
Crit Reading 637 618 612 624 602 595 603 566Math 657 633 630 612 623 623 602 596Writing 652 636 623 617 608 606 613 583Total 1946 1887 1865 1853 1833 1824 1818 1745
District Scarsdale Chappaqua Bronxville EdgemontByramHills
Great NeckSouth
Blind Brook(Rye Brook)
Great NeckNorth
Crit Reading 636 618 618 608 600 593 595 557Math 663 641 626 631 625 635 594 599Writing 659 634 633 626 624 620 604 588Total 1958 1893 1877 1865 1849 1848 1793 1744
District ScarsdaleBlind Brook(Rye Brook)
ChappaquaByramHills
Edgemont Bronxville Ardsley Hastings Rye
Crit Reading 633 627 618 598 591 605 593 610 587Math 656 645 641 634 633 601 607 587 600Writing 646 639 634 620 615 615 612 611 608Total 1935 1911 1893 1852 1839 1821 1812 1808 1795
Mean Combined SAT Scores of Comparable Districts
2012-‐2013 Mean Combined SAT Scores of Comparable Districts
2013-‐2014 Mean Combined SAT Scores of Comparable Districts
2015-‐2016 Mean Combined SAT Scores of Comparable Districts
2014-‐2015 Mean Combined SAT Scores of Comparable Districts
20

2011-‐2016 ACT Report
English Math Reading Science Composite2016 29.9 28.5 29.2 28.6 29.22015 29.1 27.8 28 27.3 28.22014 29.2 28.3 28.3 27 28.32013 28.4 28.3 27.4 26.3 27.72012 28.9 28.9 27.7 26.9 28.32011 29.1 29 28 26.9 28.4
English Math Reading Science Composite2016 23.2 23.9 24.4 23.7 23.92015 23 23.8 23.9 23.5 23.72014 22.7 23.8 23.6 23.2 23.42013 22.6 23.8 23.7 23.1 23.42012 22.7 23.7 23.4 23.1 23.32011 22.7 23.8 23.5 23 23.4
Percent of ACT-‐Tested Students Ready for College-‐Level Coursework
Scarsdale School District Average ACT Scores
NYS Average ACT Scores
21

Year Total ExamsMean
Test Score% Exam Scores
4, 5% Exam Scores
3, 4, 52015-‐2016 392 4.41 85% 98%2014-‐2015 356 4.31 81% 97%2013-‐2014 428 4.35 83% 97%2012-‐2013 375 4.36 82% 94%2011-‐2012 428 4.42 86% 98%2010-‐2011 509 4.28 81% 97%2009-‐2010 515 4.23 81% 94%2008-‐2009 566 4.17 78% 94%2007-‐2008 650 4.12 76% 94%2006-‐2007 856 3.98 71% 90%2005-‐2006 841 4.06 72% 93%2004-‐2005 731 3.8 63% 89%2003-‐2004 756 3.89 67% 89%2002-‐2003 733 3.8 61% 86%2001-‐2002 694 3.77 62% 89%
Scarsdale High School Advanced Placement Exam Score Results
0
20
40
60
80
100
120
Advanced Placement Exam Score Results
Percent Exam Scores 3, 4, 5
Percent Exam Scores 4, 5
22

Scarsdale High School Regents Report
Regents Exam 2010-‐11 2011-‐12 2012-‐13 2013-‐14 2014-‐15 2015-‐16
Integrated Algebra I 99%1 99%1 99%1 99%1 88%2 84%2
Common Core Algebra not offered not offered not offered 97%1 95%1 100%1
Common Core ELA not offered not offered not offered not offered not offered 100%
Comprehensive English 99% 97% 98% 100% 99% 82%3
Living Environment (Biology) 99% 100% 99% 99% 99% 98%
Global History 97% 99% 99% 99% 98% 98%
U.S. History and Government 99% 99% 99% 100% 99% 100%
Between 330 and 420 students took each exam, with the exception of the 2014-‐15 and 2015-‐16 Algebra I exams (34 students and 6 students, respectively) and the 2015-‐16 Comprehensive English exam (17 students). The Algebra I exam is no longer being offered by NYSED. For each of these exams in each of these years, a handful of students classified by the Committee on Special Education passed with scores in the 55% to 64% range. The figures above do not include that population, since the LHRIC report on passing rates does not differentiate between classified and non-‐classified students who scored below 65%.
1 Includes all Scarsdale Middle School and Scarsdale High School students who took these exams.
2 This exam was taken only by Scarsdale High School students-‐-‐those who did not take algebra while students in the Middle School.
Annual Percentage of Students Scoring 65-‐100%
3 2015-‐16 was the final year in which the Comprehensive English Regents was offered, and only to students who entered high school prior to 2013. At Scarsdale High School in 2015-‐2016, 17 students qualified to take the Comprehensive English exam, and 14 of them (82%) earned passing scores. Those students took it because they had either failed it in the past or were classified students who passed it with a score under 65% but wanted to try for a score higher than 65, so that they could earn a Regents diploma rather than a local diploma.
All other students (approximately 375) who took a Regents exam in English during 2015-‐16 took the Common Core English Regents (our first administration of that exam), and 100% of them passed it.
23

Year Percent tocollege
Percent to 4-‐year college
2015-‐2016 98% 97%2014-‐2015 99% 97%2013-‐2014 99% 97%2012-‐2013 99% 98%2011-‐2012 97% 95%2010-‐2011 99% 98%2009-‐2010 98% 96%2008-‐2009 98% 96%2007-‐2008 99% 97%2006-‐2007 99% 97%2005-‐2006 99% 96%2004-‐2005 97% 94%
Year Percentage2015-‐2016 63%2014-‐2015 64%2013-‐2014 68%2012-‐2013 64%2011-‐2012 59%2010-‐2011 62%2009-‐2010 61%2008-‐2009 58%2007-‐2008 58%2006-‐2007 58%2005-‐2006 55%2004-‐2005 57%2003-‐2004 55%
Percent Accepted to Most Selective Colleges (According to Barron's Guide)
Scarsdale Graduates to College
24

Year Number of Students
Percent ofStudents
2015-‐2016 26 7%2014-‐2015 16 4%2013-‐2014 27 7%2012-‐2013 19 6%2011-‐2012 22 6%2010-‐2011 22 6%2009-‐2010 15 4%2008-‐2009 21 6%2007-‐2008 20 5%2006-‐2007 28 8%2005-‐2006 21 6%
Year Number of Students
Percent ofStudents
2015-‐2016 34 9%2014-‐2015 52 14%2013-‐2014 44 12%2012-‐2013 34 10%2011-‐2012 34 11%2010-‐2011 62 16%2009-‐2010 66 18%2008-‐2009 43 12%2007-‐2008 35 9%2006-‐2007 45 13%2005-‐2006 30 9%
Students Who Received National Merit Letters of Commendation
Students Named National Merit Semifinalists
25

Test 2016 2015 2014 2013 2012 2011 2010 2009Math Level 1 684 669 686 671 688 670 675 682Math Level 2 748 728 748 744 732 737 735 726U.S History 694 703 689 702 725 692 684 703French 699 692 723 748 730 713 732 758Spanish 711 684 716 671 698 684 620Chemistry 725 720 728 722 731 718 723 696Biology-‐E 714 703 673 697 682 712 659 657Biology-‐M 713 718 709 704 683 711 674 673Physics 714 704 711 728 710 719 739 721Literature 687 688 663 708 679 685 676 678World History 608 684 643 665 646 706 700 749Japanese 702 708 765
SAT Subject Test Mean Scores
26

The Global Learning Alliance A School and University Partnership
for High International Standards and Deep Learning Overview The Global Learning Alliance is a professional community with three goals:
To promote transformative teaching and learning; To empower youth to meet the challenges of their century; To realize the benefits of these efforts for children and youth around the world.
We believe that individuals, schools and nations each grow and prosper when all do. We hope to support the transition from today’s world of international competition to a tomorrow in which human beings contribute to and participate in the good of a global community. A partnership among schools and universities in Asia and Australia, the Americas and Europe, the Alliance supports leading edge research and builds knowledge about how to promote the best learning in the world. Through real and virtual contacts, partners examine student work and teaching materials that meet a high international standard in measurable terms. As a result, they promote exemplary methods and foster individual and institutional growth. They are mindful of the need to reproduce effective practices in a broad crosssection of schools, worldwide. Background Those who graduate from school in the 2000’s must become contributing world citizens who think critically and creatively, who solve problems that transcend traditional boundaries, and who are grounded by an ethical concern for global issues. Today, however, neither government policies nor schoolbased initiatives adequately address the challenges involved in fostering global citizens. National and state reforms fail to recognize differences among schools and promote changes that may be replicable but are shallow and often counterproductive. Meanwhile, individual schools and districts pursue improvement strategies whose benefits fail to transfer consistently or effectively. Terms like “world class learning” and “Twentyfirst Century learning” are clichés, furthermore, nobody really knows what they mean. International measures are limited to tests like PISA and to programs like the IB or Cambridge PreU. Some set a bar without helping students or teachers understand how to reach it. Others mandate a specific curriculum that may or may not represent the best student work in the world’s top performing nations. Additionally, current measures don’t effectively assess a number of capacities that will be important in the future. Meanwhile, existing international school networks typically lack a sustained focus on international benchmarks, measurement, curriculum or instruction. Neither do they have the benefits of robust schooluniversity linkages
27

nor are they structured to promote collaborative work on improving institutional and individual capacity. The Global Learning Alliance moves beyond these problems by modeling world class learning and practice and by providing a structured process for their replication. The Alliance sponsors future contributors, citizens and leaders through:
Organic professional exchanges through which educators understand and create Twentyfirst century curriculum, instruction and assessment;
Innovative and original research and practices that lead thinking and action in the field; Efforts to adapt or replicate effective practices that intentionally improve teaching and learning.
Additional Information The links below provide more detailed information about the Global Learning Alliance.
GLA Timeline 2009 2016
GLA Summit 2012 Global Capacities Framework
Scarsdale Presentation GLA 2012
GLA Status Report November, 2012
Why Cross Border Collaboration is More than PISA
Pilot Assessment 2016
Research Proposal Coding Framework
2016 Summit III Brochure
28

Who is in the Alliance?
29
Response to Intervention (RTI)
What is RTI? Effective July 1, 2012, every school district in New York State is required to implement a Response to Intervention model in the elementary school grades. Response to Intervention (RTI) is a multitiered, problemsolving approach that identifies general education students in grades K5 who are struggling in the academic areas of reading and mathematics. Through ongoing assessments, identified students are provided with targeted instruction at varying levels of intensity. The progress that students make at each level is closely monitored and used in further decisions regarding their instructional program. Scarsdale’s Model For years Scarsdale used a Local Effort Service program that supported struggling students. Conceptually, the Local Effort program is similar to the RTI model as they both focus on addressing students’ learning needs prior to recommending special education services. Building on the successful Local Effort program, the District reformatted it to comply with the state mandates of RTI. The RTI model is a threetiered approach: • Tier 1 takes place in the student’s classroom and is conducted by the primary teacher. • Tier 2 (previously Local Effort Services) calls for supplemental instruction provided by the Learning Center teacher. • Tier 3 calls for the student to receive an increased amount of supplemental services by the LRC teachers or be referred to the CSE for a special education evaluation. A referral to CSE will be considered for students who have a history of receiving Tier II or Tier III
At any time, a parent may refer his/her child to the CSE for an initial evaluation. The RTI process may not be used to delay or deny acting on the parent request.
30

STAR Digital Assessment System Scarsdale Elementary Schools have adjusted the way they screen and identify students who may be in need of additional academic support. School districts are required to use a Response to Intervention model and this model requires the use of a Universal Screening Tool and a Progress Monitoring System for all K5 students three times per year: fall, winter, and spring. We are using the STAR digital assessment system as our Universal Screening Tool and Progress Monitoring System.. It will replace the Developmental Reading Assessment (DRA), used previously for reading only. STAR assesses current levels of performance in reading and math. It is administered three times per year and is given to identify or predict students who may be at risk for poor learning outcomes. STAR is a computer administered multiple choice test given to all students. The entire test takes approximately 40 minutes. We are hopeful STAR will provide teachers with valuable information about student learning needs. This will serve to help identify those in need of additional support and also inform whole class instruction. These assessments are formative in nature. They present a picture of what a child has learned and let the teacher know which skills are most important to address. Please feel free to visit the STAR website if you have questions about its validity or reliability. As has been our past practice, during fall conferences, teachers will share information with parents about student learning progress based upon multiple sources of information. Since 2012, Scarsdale has used a Response to Intervention (RTI) plan to support struggling learners. Here is a link to our current plan , which is being revised to reflect the use of STAR data in our process.
31