student media usage patterns and non-traditional learning ... · student media usage patterns and...
TRANSCRIPT

136
International Review of Research in Open and Distributed Learning Volume 16, Number 2
April – 2015
Student Media Usage Patterns and Non-Traditional Learning in Higher Education
Olaf Zawacki-Richter1, Wolfgang Müskens1, Ulrike Krause1, Uthman Alturki2, and Ahmed Aldraiweesh2 1Carl von Ossietzky University of Oldenburg, Germany, 2King Saud University, Saudi Arabia
Abstract
A total of 2,338 students at German universities participated in a survey, which investigated media usage patterns of so-called traditional and non-traditional students (Schuetze & Wolter, 2003). The students provided information on the digital devices that they own or have access to, and on their usage of media and e-learning tools and services for their learning. A distinction was made between external, formal and internal, informal tools and services.
Based on the students’ responses, a typology of media usage patterns was established by means of a latent class analysis (LCA). Four types or profiles of media usage patterns were identified. These types were labeled entertainment users, peripheral users, advanced users and instrumental users. Among non-traditional students, the proportion of instrumental users was rather high. Based on the usage patterns of traditional and non-traditional students, implications for media selection in the instructional design process are outlined in the paper.
Keywords: Media usage patterns; media usage typology; non-traditional students; instructional design; media selection
Acknowledgement: The authors would like to extend their sincere appreciation to the Deanship of Scientific Research at King Saud University for funding this Research group NO RG #-1435-003.

Student Media Usage Patterns and Non-Traditional Learning in Higher Education Zawacki-Richter, Müskens, Krause, Alturki, and Aldraiweesh
This work is licensed under a Creative Commons Attribution 4.0 International License.
137
Introduction During the 1960s and 1970s, society acknowledged the value of education in creating wealth. However, this educational interest was politically-based and focused on non-traditional studies (Gould & Cross, 1977).
In this context, universities began to attract non-traditional target groups as a way of harnessing education. Initially, the traditional student was under 25 years of age, male and financially independent (Garz, 2004). In fact, traditional students were known to study full-time and usually got admitted to the university level after undergoing high school education (Guri-Rosenblit, 2005).
In recent times, increased diversification in higher education is a common feature. For example, the current post-secondary education population in the United States has 40% of the students being adults (Ke, 2010). In addition, research by Knapp, Kelly-Reid and Ginder (2011) reveals that the National Center for Education Statistics in the USA has a statistical record on the country’s education. The records imply that 39% of the 21 million undergraduate and graduate students in the USA are over 25 years of age, and 11% are older than 40 years. The same trend can be observed in German higher education institutions (Hanft & Brinkmann, 2013).
Traditional students were known to study full-time and usually got admitted to the university level after undergoing high school education (Guri-Rosenblit, 2005).
The increased diversity of student profiles, as well as the increase of non-traditional students, is challenging. According to Moore and Kearsley (2011), educational challenges are evidenced in university curricula, delivery modes and student support systems. Precisely, universities are not in a position to address the diverse issues and needs exhibited by students. From this perspective, education researchers have examined various solutions to the above problem. Establishing e-learning and distance learning has been sighted as one possible solution towards solving the diverse needs among students. Thus online distance education has moved from the periphery into mainstream higher education (Allen & Seaman, 2011).
Over the last decade, e-learning and distance education have widened access to higher education. In recent times, almost every institution of higher education blends e-learning programs with the usual curriculum (Zawacki-Richter, 2011). Alternatively, higher education institutions have increased learning centers, facilities, campuses and laboratories to facilitate e-learning and distance learning.
It is important to focus on how the media reaches the target group and addresses the needs of the students. To design appropriate e-learning environments and to avoid failure and dropout, it is essential to give attention to the context, characteristics, motivation, abilities, prior knowledge, experience, etc. of the learners. Therefore, learner and context analysis are the first fundamental

Student Media Usage Patterns and Non-Traditional Learning in Higher Education Zawacki-Richter, Müskens, Krause, Alturki, and Aldraiweesh
This work is licensed under a Creative Commons Attribution 4.0 International License.
138
steps in the instructional design process (Morrison et al., 2011). Another important aspect in instructional design is to understand media behavior. It is important to focus on how the media reaches the target group and addresses the needs of the students. Understanding media usage patterns, evaluating and measuring modes of media usage is an important procedure in instructional design.
Based on a comparative meta-analysis of 22 media usage typologies published between 2000 and 2009, Brandtzaeg (2010) proposed a media-user typology that consists of eight different user types reflecting different types of media usage behavior. However, in most cases the studies proposed typologies of the ways young people are using the Internet outside formal educational settings (Eynon & Malmberg, 2011). The focus is placed on new media use in general (TV, computers, Internet, game consoles, mobile phones, online shopping), the Internet in general and online communities or social networking sites in particular. Only a single study of the 22 media use typologies explored by Brandtzaeg (2010) was dealing with Internet usage patterns of students in the USA (Johnson & Kulpa, 2007). At this stage, it is not clear how students in higher education use media, tools and web-based services for their learning and not just for entertainment.
This paper presents first results of a study that investigated media usage patterns of students in higher education (N=2,338 with a special emphasis on non-traditional students (N=789). The study was part of the research project STEM-Online funded by the German Ministry of Education and Research (BMBF) in the “Open University” program (2011-2015).
The concept of non-traditional students (NTS) was operationalized according to the definition by Teichler and Wolter (2003; see Chapter 2).
Profiles of Non-Traditional Students
There are various definitions of how this group of so-called non-traditional students can be described (Horn & Carroll, 1996). The term “non-traditional student” (Ely, 1997, p. 1) has sparked a debate in the Anglo-American region, as well as in Germany (Wolter 2002). According to Johnston and Merrill (2002), a non-traditional student is defined as a mature learner with no previous higher education qualifications. In this regard, the non-traditional learner is exceptionally aged unlike other students undergoing higher education.
Based on case studies in ten OECD countries, Schuetze and Slowey (2012) profile non-traditional students under six subcategories of "lifelong learners" ("second chance learners", "deferrers", "recurrent learners", "returners", "refreshers" and "learners in later life"). The first category is referred as second chance learners. Lifelong learners pursue higher education out of compassion and desire to acquire knowledge. Lifelong learners voluntarily engage in education as an ongoing process. Deferrers form the second category of non-traditional students. Deferrers include students who do not get admitted to an institution of higher education in their initial application

Student Media Usage Patterns and Non-Traditional Learning in Higher Education Zawacki-Richter, Müskens, Krause, Alturki, and Aldraiweesh
This work is licensed under a Creative Commons Attribution 4.0 International License.
139
due to low grades or lack of proper recommendation documents. Recurrent learners are students who repeatedly resume education after dropping out of the academic year due to lack of fees, low grades or work-related reasons. Returners are students who want to extend their university accommodation irrespective of not being first years. Refreshers are categorized as students who undertake short courses to improve on their careers. Refresher courses are developed for such students who have careers in disciplines like nursing, teaching or information technology, and require constant updates on new career practices. Learners in later life are considered the sixth subcategory of lifelong students. Individuals who resume higher education after the retirement age for reasons such as fun and new discoveries are known as learners in later life.
A general profile of non-traditional students follows the following three characteristics (Pituch & Lee, 2006). Non-traditional students enroll into higher education through unconventional means. In most cases, non-traditional students do not fulfill the required entrance qualifications for higher education. Finally, non-traditional students insist on studying part-time and distance learning.
In the German discussion a definition by Teichler and Wolter (2004) has become established (Alheit et al., 2008; Hanft 2008; Schuetze & Slowey, 2002). In this definition, three characteristics are viewed as central (Teichler & Wolter, 2004): It concerns students
1. who have not come to a higher education institution on a straight path or in the dominating timely fashion (e.g., students who start their academic studies after an apprenticeship/job),
2. who do not fulfill the general entrance qualifications for higher education institutions acquired in school (e.g., students without general qualification for university entrance [Germany: Abitur]) and/or
3. who do not study full-time and on campus (e.g., part-time students or distance education students).
Dealing with this target group always means a demarcation of “traditional” students, whose image has drastically changed since the 1950s (Garz, 2004). Diversification of student profiles (both of traditional and non-traditional students) has progressed continuously over the years (Guri-Rosenblit, 2011; Schuetze & Slowey, 2002; Wolter 2012), so that an increasing heterogeneity can be assumed. For some countries this is not a recent development. In the USA for example these changes have been observed since the 1970s (Gould & Cross, 1972; Wedemeyer, 1981).
Recent empirical studies have been trying to give a more exact description of the group of NTS as well as a depiction of the changing terms of studying for “regular students”. Based on 112 qualitative interviews, Alheit et al. (2008) identified four different types of students (“patchwork”, “promotion”, “career” and “integration” type). A project group with a focus on the

Student Media Usage Patterns and Non-Traditional Learning in Higher Education Zawacki-Richter, Müskens, Krause, Alturki, and Aldraiweesh
This work is licensed under a Creative Commons Attribution 4.0 International License.
140
compatibility of studying and working conducted a survey with 3,687 students in order to find out to what degree they deviated from the “model type” of a traditional student (Wilkesmann et al., 2012). Especially the impact of increasing job commitments was viewed critically and resulted in an impulse to extend the percentage of e-learning offers also in the field of undergraduate studies in order to provide a greater flexibility regarding time and space (ibid, p. 74 ff.).
For the present study, those students are characterized as "non-traditional" who are enrolled in a distance education or online program, study part-time, work more than 19 hours a week or are more than 30 years old.
Typology of Students’ Media Usage Behavior
Typologies classify individuals or objects based on their typical behavior or other patterns (Barnes, Bauer, Neumann & Huber, 2007). According to Brandtzaeg (2010),
the term user typology is defined as a categorization of users into distinct user types that describe the various ways in which individuals use different media, reflecting a varying amount of activity/content preferences, frequency of use and variety of use. (p. 941)
The typology description of media usage behavior is necessary for understanding the concepts of higher education pedagogy, the design and development of media based teaching (Moore, 1993; Zawacki-Richter 2011). Analyzing of the target group in terms of specific needs, motivations and patterns of action is paramount during the instructional design and media selection processes (Morrison, et al., 2011).
In a meta-study conducted by Brandtzaeg (2010), eight types of users were analyzed from 22 media usage typologies. Precisely, the eight types include non-users, sporadics, debaters, entertainment users, socializers, lurkers, instrumental users and advanced users. Another dimension to study the typology of students’ media usage behavior focuses on the use of media, the Internet, social networks, online shopping and computer games. According to Johnson and Kulpa (2007) three important aspects of students’ media usage behavior are evidenced and include sociability, utility and reciprocity. Sociability is described as the human connection motives that result from using the internet as media for learning. In this regard, students derive skills and tendencies that harness their human interactions with others. On the other hand, utility is described in terms of instrumental orientation. In this context, students aspire to achieve higher grades by utilizing the internet in acquiring additional learning resources. Moreover, reciprocity is described from a cognitive stimulation and active involvement perspective. In this regard, students use media or the internet as a way of improving their cognitive abilities such as communication, comprehension, reading and critical thinking.

Student Media Usage Patterns and Non-Traditional Learning in Higher Education Zawacki-Richter, Müskens, Krause, Alturki, and Aldraiweesh
This work is licensed under a Creative Commons Attribution 4.0 International License.
141
Non-users is the largest group of non-traditional students who do not utilize any form of media as a learning platform (Brandtzaeg, 2010). The disinterest with media-based learning is promoted by lack of internet access. Also, there are a large number of students who cannot utilize internet technology in learning due to various forms of disabilities. In this regard, non-users prefer conventional methods of learning.
Sporadic do not exhibit active behavior in usage of media-based technologies. In most cases, they access the internet to check on emails from friends or assignments from lecturers. Yet, they do not perceive any media as a meaningful learning tool. Non-traditional students are busy individuals who rarely use the media passively. Sporadic constitute at least 19% of non-traditional students using the internet in any institution (Brandtzaeg, 2010).
Debaters are highly social and frequently engage in discussions with fellow students. The level of contribution by debaters in terms of readings and writings is high. However, the level of interaction and sociability exhibited by debaters is either formal or informal. They depend on the internet to access information that is used in discussions. However, they are not ardent users of video contributions and prefer using texts and pictures.
Entertainment users exhibit an interesting media usage behavior where the rate of using the internet, radio and television is high. Entertainment users are focused on downloading music, videos and games.
Socializers use the internet as a platform to engage in recreational activities. In this context, the focus of using the internet is to write messages, maintain social contacts and look for new friends, rather than using social media in exchanging educational ideas. Most of the socializers are teenage girls aged between 14 - 20 years (Brandtzaeg, 2010).
Lurkers are considered the largest internet user group, who use the internet for recreational purposes and other activities. They participate on social media sites passively.
Instrumental users do not use the internet and related media for entertainment and socialization. They prefer using the internet to access important information on goal-oriented activities such as business, services and education.
Advanced users prefer using the internet in varied ways. In fact, this category exhibits diverse media usage behaviors since users utilize the internet for utility or instrumental activities. Although the category uses internet passively for entertainment, accessing information on goal-oriented activities is the group’s focus.
Another dimension to study the typology of students’ media usage behavior focuses on the use of media, the Internet, social networks, online shopping and computer games. In this regard,

Student Media Usage Patterns and Non-Traditional Learning in Higher Education Zawacki-Richter, Müskens, Krause, Alturki, and Aldraiweesh
This work is licensed under a Creative Commons Attribution 4.0 International License.
142
sociability, utility and reciprocity are the basis for underrating media usage behavior (Johnson & Kulpa, 2007).
Sociability is described as the human connection that results from using the internet as a media for learning. In this regard, students derive skills and tendencies that harness their human interactions with others. The use of social networks by students has seen increased interests on platforms such as Facebook or Google+. Educationists claim that the internet platform is challenging the conventional understanding of social issues.
In addition, utility is described in terms of instrumental orientation, whereas students aspire to achieve higher grades by utilizing the internet in acquiring additional learning resources. Elements of self-disclosure and improvement are evidenced when students utilize media-oriented platforms. Research indicates that non-traditional students perceive social, interaction, self-image and information as important aspects in the learning process.
Moreover, reciprocity is described from a cognitive stimulation and active involvement perspective. In this regard, students use media as a way of improving their cognitive abilities such as communication, comprehension, reading and critical thinking.
By and large, quantitative research regarding media usage typologies is predominant. An exception is a qualitative study with over 100 interviews of Davies and Good (2009), which also was not focused on the media usage behavior of students but of the age group of 8- to 19-year-olds. Eynon and Malmberg (2011) also find that media usage typologies are mostly focused on free time usage (game consoles, TV, online shopping etc.) and rarely examine their use for formal and informal learning processes, especially in the higher education sector: “Yet there is a need for more empirical research that provides a better understanding of the complex ways in which young people are using new technologies and what this may mean for teachers, librarians and parents" (p. 585).
However, further studies, which are rather descriptive and do not aim at general media usage typologies in university, still reveal interesting results. For example, a representative longitudinal study on the technology usage of undergraduate students in the USA has been conducted by the Educause Center for Applied Research (ECAR) since 2004. Students in the USA have very good access to digital media and devices. About three quarters of students send and receive 25 emails and 84 text messages on average per day. The study also sheds light on the usage of social networks and mobile devices (smartphones, tablet computers) in the academic environment (Dahlstrom et al., 2011).
In Germany the studies of the "Medienpädagogischer Forschungsverbund Südwest" [Media-Pedagogical Research Network Southwest] on the media, computer, Internet and multimedia usage of children and teenagers stand out (JIM, 2010; KIM, 2010), but unfortunately they also do not provide enough information on the media usage and acquisition processes in university. The

Student Media Usage Patterns and Non-Traditional Learning in Higher Education Zawacki-Richter, Müskens, Krause, Alturki, and Aldraiweesh
This work is licensed under a Creative Commons Attribution 4.0 International License.
143
same holds true for the 16th Shell youth study (Albert et al., 2011), which also found different Internet user types in teenagers (25% gamers, 24% networkers, 17% functional users, 34% multi-users). Interestingly, there seems to be a strong connection between the type of Internet usage and age, gender and social background. The representative study (N=4,400) by Kleimann et al. (2008) is an exception, putting an emphasis on the usage of Web 2.0 applications in university (e.g., wikis, blogs, social networks). Students use the Internet intensively for information and communication processes, but also for consumption and entertainment. 23% actively use the Internet for four to six hours per day. Social networks are frequently used and 34% stated that they use them to exchange on academic matters too. A great potential for active media usage in higher education is attributed to so-called Web 2.0 tools (or “social software” like wikis, blogs and social communities) (e.g., Alexander, 2006; Rollet et al., 2007). On the other hand, different studies indicate that the idea of the “participation net”, in which the passive-receiving usage behavior is replaced by a more active participation in e-learning, can be challenged (Grell & Rau, 2011; Schulmeister, 2009). However, many students state that they use for example social networks for study related activities (Kleimann et al., 2008).
The present study investigates to what extent students use e-learning and Web 2.0 tools and what usage patterns can be identified.
Research Questions
The study addresses the following research questions:
• What kind of digital devices do the students own or have access to?
• Which media and e-learning tools and services are used for learning, how often are they used and what is their added value?
• How are Web 2.0 applications and social networking sites in particular used for learning?
• What are the differences between traditional and non-traditional students regarding the acceptance of media, tools and services for their learning and regarding their demand for e-learning?
• What kind of different media usage types can be identified and how do these profiles relate to individual and contextual factors associated with the students (e.g., gender, social status, employment status, childcare etc.)?

Student Media Usage Patterns and Non-Traditional Learning in Higher Education Zawacki-Richter, Müskens, Krause, Alturki, and Aldraiweesh
This work is licensed under a Creative Commons Attribution 4.0 International License.
144
Method
Sample and Instrument
Between April 25 and June 18, 2012 an online questionnaire with 246 items was administered. Scales focused on the access to media and mobile devices, on the frequency and perceived value of media use, on tools and services for learning, on the technophilia of students, the compatibility of studying and working, on the social background of the parents and further sociodemographic variables.
The questionnaire was developed along the dimensions of Johnson-Smaragdi (1994) and Bonfadelli’s (1993) model of media usage: (1) environment (media and learning environment), (2) socialisation (education and media relevant sociodemographic dimensions), (3) behavior (media usage and learning behavior) and (4) personality (education and media relevant dispositions). In total, 49 media, tools and services were classified according to the typology of Grosch and Gidion (2011) as (1) printed and digital text media, (2) general web tools and services and (3) e-learning tools and services.
In total, 2,339 students (61% female, 39% male) from German universities and universities of applied sciences participated in the survey; participation was voluntary. Of those, 789 (34%) can be classified as non-traditional students (NTS), meaning that they are enrolled in a distance education or online program, study part-time, work more than 19 hours a week or are more than 30 years old. At least one of those NTS criteria had to be matched for a person to be classified as a non-traditional student. The other participants will be referred to as "traditional students". The average age of all students is 25 years (N=2,310) with a standard deviation of seven years. NTS are significantly older than traditional students (22 years; s = 9.6), being 30 years old on average (s = 2.5), t=-23.2, df=837, p< .001. All of the traditional students (N=1,524) are younger than 30 years of age, while 55% (N=433) of NTS are under and 45% (N=352) are over 30 years old. The total range is between 18 and 75 years of age. The participants (N=2,279) have studied on average for 4.8 semesters (including the current semester) with a standard deviation of 3.4 semesters. A 45-year-old woman has been enrolled for the longest time period (37 semesters).
The distribution of the studied semesters of NTS and traditional students show significant differences. As expected, the amount of semesters studied is distributed more heterogeneously within the group of NTS. On average, traditional students have studied for 4 semesters (s=2.8), while NTS have studied on average for 6 semesters (s=4.1), t=-7.2, df=1,155. Almost a quarter (25.7%) of the non-traditional students have children, 4.6% are single parents.
76.4% of the students are enrolled in on campus programmes, 8.1% in blended learning programmes, 3.2% in online programmes, 12.3% in integrated vocational study programmes.

Student Media Usage Patterns and Non-Traditional Learning in Higher Education Zawacki-Richter, Müskens, Krause, Alturki, and Aldraiweesh
This work is licensed under a Creative Commons Attribution 4.0 International License.
145
The sample shows a wide variety of subjects (classification of subjects according to the Higher Education Information System (Hochschulinformationssystem [HIS], cf. Isserstedt et al. 2010). Most students are majoring in engineering sciences, business sciences, mathematics and sciences.
Table 1
Distribution of Subjects, Major (N=2,051)
Subject N %
Engineering Sciences 376 18.3
Business Sciences 340 16.6
Mathematics, Sciences 315 15.4
Sociology 296 14.4
Psychology, Educational Sciences 184 9.0
Language and Culture Sciences 182 8.9
Agricultural, Forestry or Nutrition Sciences 104 5.1
Law 74 3.6
Medicine, Health Sciences 52 2.5
Special Education, 50 2.4
Industrial Engineering 37 1.8
Art, Music 29 1.4
Sports Sciences, Physical Education 12 0.6
Total 2,051 100.0
Information regarding the employment (hours worked per week on average during enrollment) shows statistically significant variations between non-traditional and traditional students. NTS work over five times as many hours per week (M=18.1, s=16.1) as traditional students (M=3.4, s=5.0), t=24.4. It can be assumed that this also has an impact on their media usage behavior.

Student Media Usage Patterns and Non-Traditional Learning in Higher Education Zawacki-Richter, Müskens, Krause, Alturki, and Aldraiweesh
This work is licensed under a Creative Commons Attribution 4.0 International License.
146
Limitations
As the variety of existing definitions and descriptions of the non-traditional student shows, the application of this construct is problematic. A precise definition is not possible, as some students can be classified as traditional in certain aspects and as non-traditional in others. There is therefore no dichotomy by which we can unambiguously classify students into one or the other group. In this context, Kerres, Hanft, Wilkesmann and Wolff Bendik (2012) speak of a heterogeneous student body. For this work, we have used a widely recognized definition from Teichler and Wolter (2004). This definition, highly applicable within the German context, incorporates characteristics such as the student’s older age, occupation at the time of study, and special study formats (part-time, distance, and online learning). The results in Table 2 must therefore be interpreted with caution and only with respect to the selected attributes used to describe the target group.
Data Analysis
A latent class analysis (LCA) (McCutcheon, 1987) was performed to establish a typology of media usage patterns of students. As well as the explorative factor analysis, the LCA is one of the structure-giving statistical methods. Contrary to factor analysis the latent variables in LCA models are discrete instead of metric.
The LCA was carried out by means of Latent Gold 4.0 software. This software allows the analysis of latent class models based on nominal, ordinal and metric manifest variables. Latent Gold utilizes maximum likelihood and posterior mode methods to estimate the parameters of class models.
With Latent Gold it is possible to calculate goodness of fit statistics in order to compare and select competing class models (chi-squared statistic L2 and the model information criteria AIC (LL), BIC (LL) and CAIC (LL)). These information measures weight the fit and the parsimony of a model (Vermunt & Magidson, 2005).
The model with the lowest IC-values should be selected for further analyses. The latent class analysis was based on four scales:
• Application - e-learning tools
• Recreational use internet
• Acceptance - office software
• Application – social networks for learning

Student Media Usage Patterns and Non-Traditional Learning in Higher Education Zawacki-Richter, Müskens, Krause, Alturki, and Aldraiweesh
This work is licensed under a Creative Commons Attribution 4.0 International License.
147
The scale “application – e-learning tools” was established as a sum scale of 16 items regarding the frequency of use of several digital learning formats (virtual seminars, web-based trainings, e-portfolios, virtual labs, lecture recordings, online-tests, podcasts, etc.). The frequency of use of each tool was assessed by means of a five-step Likert-scale (1= very often, …, 5 = never).
The scale “recreational use internet” was established as a sum scale of nine items. Six of these items assessed the frequency of use of several online-media (chats, music download/streaming, social networks, wikis, search engines, etc.). These items were assessed by means of five-step Likert-scales (1=several times daily, …, 5=never). The remaining three items related to the subjective benefits of various online-media. These items were also assessed by means of five-step Likert scales (1=very useful, …, 5= not useful at all).
The scale "acceptance – office software" was established as a sum scale of five items with 5-step response scales, including three items regarding the frequency of use of office software (text processing, spreadsheets, and presentations software) and two items assessing the subjective benefits of text processing and presentations software.
The scale “application – social networks for learning” is a sum scale aggregating eight dichotomous “yes/no”-items. These items assess various aspects regarding the use of social networks for learning (e.g., establishing and keeping contact, forming study groups, exchange of documents and literature, preparing for exams).
The scales “application – e learning tools“, “recreational use internet“, and “acceptance office software“ were established based on the results of a principal components analysis of all items of the survey regarding the frequencies and benefits of use of the various tools and services. Because of their differing response format those items, which were aggregated to the scale “application – social networks for learning” were not included in this principal components analysis.
Results
What kind of digital devices do the students own or have access to?
Overall, the students are very well equipped with digital devices. A third of the students own even more than six different gadgets. Notebooks/laptop computers (84%) continue to replace stationary desktop computers (47%). 52% of the students own a smartphone with Internet access. More NTS own a tablet computer and an e-book reader than traditional students: 11% vs. 6% and 11% vs. 4%. Over 99% of the participating students have Internet access at home, which shows a complete expansion of the Internet among students.

Student Media Usage Patterns and Non-Traditional Learning in Higher Education Zawacki-Richter, Müskens, Krause, Alturki, and Aldraiweesh
This work is licensed under a Creative Commons Attribution 4.0 International License.
148
Which media and e-learning tools and services are used for learning, how often are they used and what is their added value?
The students (N=2,263) state that they spend on average 3.8 hours (s=2.8) actively online per day: 54% are actively online for 1-3 hours daily, 38% for 4-6 hours and 8% for over 6 hours. Compared to the survey by the HIS with 4,400 students (Kleimann et al. 2008) the percentage of students that are online 4-6 hours a day is significantly higher (38% vs. 23% in 2008).
The acceptance values for the 49 media, tools and services result from the averaged ratings of the frequency regarding the use of the media in university (5= almost every day; 4=a few times a week; 3=between once a week and once a month; 2=less than once a month; 1=never) and the perceived usefulness of the media for academic purposes (5=very useful; 1=not useful at all). Cases where “I’m not familiar with that” or “I don’t know” were chosen, were defined as missing values.
As expected, the mean values of the media use frequency and the perceived usefulness correlate (r=0.83, p<0.01).
Table 1 in the Appendix lists the acceptance values of media, tools and services according to their ranking. Internet based learning platforms (M=4.28, s=.89) are as accepted as printed texts (M=4.26, s=.72). Virtual worlds (M=1.13), like Second Life for example (Ojstersek & Kerres 2008) have become irrelevant.
How are Web 2.0 applications and social networking sites in particular used for learning?
In our study 80.2% of the students stated that they are active in social networks, 43.5% several times a day (N=2,296). Most important is the social exchange and communication with friends and acquaintances (95%). On average these students have 199 “friends” (s=142) in the contact list of their most frequently used community (usually Facebook). Social networks are significantly used more often by traditional students than by NTS (see Table 2). These networks are also used for study purposes: 82% stated that they also exchange on academic matters. The following activities were given (see Figure 1).

Student Media Usage Patterns and Non-Traditional Learning in Higher Education Zawacki-Richter, Müskens, Krause, Alturki, and Aldraiweesh
This work is licensed under a Creative Commons Attribution 4.0 International License.
149
Figure 1. Social networks in university (multiple responses, distribution in percent).
What are the differences between traditional students and NTS regarding the acceptance of media, tools and services for their learning and regarding their demand for e-learning?
The differences regarding the acceptance of frequently used and perceived useful media, tools and services among NTS compared to traditional students are depicted in Table 2.

Student Media Usage Patterns and Non-Traditional Learning in Higher Education Zawacki-Richter, Müskens, Krause, Alturki, and Aldraiweesh
This work is licensed under a Creative Commons Attribution 4.0 International License.
150
Table 2
Acceptance Of Media, Tools and Services in Comparison
Type of medium Significantly higher acceptance among NTS
Significantly higher acceptance among traditional students
Text media • Electronic texts (e-books, pdfs)*
General web tools and services
• Skype (conference call)**
• Skype (1:1 call)**
• Micro blogging (e.g. Twitter)*
• Blogs**
• Business networks**
• Photo communities*
• Rss feeds*
• Presentation sharing (e.g. Slideshare)*
• Geotagging (e.g. Layar)*
• Forums/newsgroups*
• University email account**
• Wikis*
• Social networks**
• Videos (e.g. On youtube)**
• Music (e.g. On itunes)**
• Chat/instant messaging**
E-learning tools and services
• Online library services*
• E-portfolios*
• Multimedia software of the university**
• Free multimedia learning software on the internet**
• Podcasts/vodcasts (e.g. On itunes)**
• Internal university forums**
• Virtual seminars/webinars, synchronal**
• Reference management
• Internet based learning platforms**
• File storage/file sharing (internal)**
• File storage/file sharing (external)**
• Computer terminals on campus**

Student Media Usage Patterns and Non-Traditional Learning in Higher Education Zawacki-Richter, Müskens, Krause, Alturki, and Aldraiweesh
This work is licensed under a Creative Commons Attribution 4.0 International License.
151
software**
• Online exams /tests**
• Virtual labs**
• Simulations or learning games (serious games)**
• Presentation software**
• Word processing software**
• Spreadsheet software**
• Statistical software**
• Software for qual. Text analysis**
• Graphics software**
• Audio software**
• Video software*
*significant (2-sided) on 5 % level; **significant (2-sided) on 1 % level
The students were also asked how important the use of digital teaching and learning approaches is to them in their relevant field of study (1=not important at all through 5=very important). It stands out that the values for the desired digital learning formats are not as high as the actual values, so there is a gap between demand and supply.
The largest demand concerns the provision of materials on a university platform (e.g., Blackboard or Moodle) throughout courses, and is widely fulfilled (see Table 3).
The highest differences between desired values and actual values exist regarding web based trainings / self-study courses on the intranet or Internet, online exams and exercises / e-assessment as well as the supply of lectures as podcasts or vodcasts.

Student Media Usage Patterns and Non-Traditional Learning in Higher Education Zawacki-Richter, Müskens, Krause, Alturki, and Aldraiweesh
This work is licensed under a Creative Commons Attribution 4.0 International License.
152
Table 3
Demand For Digital Teaching and Learning Approaches
Desired Actual ∆M
N M s N M s
Materials accompanying courses 2199 4.56 .87 2247 4.29 1.19 0.27
Interactive multimedia 2076 3.61 1.24 2051 2.46 1.34 1.15
Virtual seminars/tutorials with distance collaboration
1875 2.76 1.38 2051 1.55 .98 1.21
Lectures as podcasts or vodcasts 1940 2.95 1.51 2105 1.67 1.06 1.28
Virtual internships and labs 1632 2.26 1.31 1919 1.26 .72 1.00
Online exams and exercises 2022 3.22 1.32 2068 1.81 1.08 1.41
Wbts / courses on the intranet or Internet 1803 2.99 1.36 1920 1.44 .88 1.55
E-Portfolios/learning logs on the Intranet or Internet
1598 2.57 1.36 1842 1.40 .90 1.17
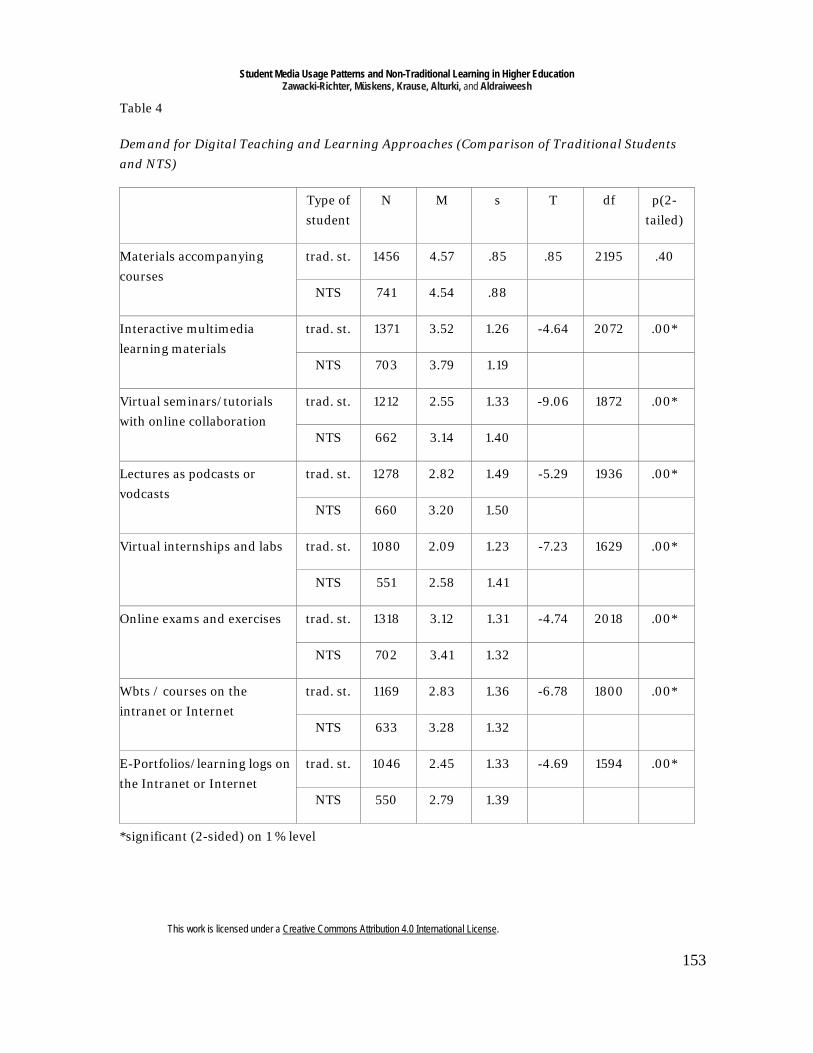
The following analysis shows that the expressed demand for digital teaching and learning approaches is significantly higher among NTS than among traditional students. Only the demand for the provision of course materials on a learning platform (Moodle, Blackboard etc.) does not show any significant differences.
Student Media Usage Patterns and Non-Traditional Learning in Higher Education Zawacki-Richter, Müskens, Krause, Alturki, and Aldraiweesh
This work is licensed under a Creative Commons Attribution 4.0 International License.
153
Table 4
Demand for Digital Teaching and Learning Approaches (Comparison of Traditional Students and NTS)
Type of student
N M s T df p(2-tailed)
Materials accompanying courses
trad. st. 1456 4.57 .85 .85 2195 .40
NTS 741 4.54 .88
Interactive multimedia learning materials
trad. st. 1371 3.52 1.26 -4.64 2072 .00*
NTS 703 3.79 1.19
Virtual seminars/tutorials with online collaboration
trad. st. 1212 2.55 1.33 -9.06 1872 .00*
NTS 662 3.14 1.40
Lectures as podcasts or vodcasts
trad. st. 1278 2.82 1.49 -5.29 1936 .00*
NTS 660 3.20 1.50
Virtual internships and labs trad. st. 1080 2.09 1.23 -7.23 1629 .00*
NTS 551 2.58 1.41
Online exams and exercises trad. st. 1318 3.12 1.31 -4.74 2018 .00*
NTS 702 3.41 1.32
Wbts / courses on the intranet or Internet
trad. st. 1169 2.83 1.36 -6.78 1800 .00*
NTS 633 3.28 1.32
E-Portfolios/learning logs on the Intranet or Internet
trad. st. 1046 2.45 1.33 -4.69 1594 .00*
NTS 550 2.79 1.39
*significant (2-sided) on 1 % level

Student Media Usage Patterns and Non-Traditional Learning in Higher Education Zawacki-Richter, Müskens, Krause, Alturki, and Aldraiweesh
This work is licensed under a Creative Commons Attribution 4.0 International License.
154
What kind of different media usage types can be identified and how do these profiles relate to individual and contextual factors associated with the students (e.g. gender, social status, employment status, childcare etc.)?
The selected scales ("application – social networks for learning", "acceptance – office software", "application – e-learning tools" and "recreational use internet") were included in the latent class analysis as manifest variables. The scales’ raw values were grouped as quartiles.
We calculated 1- to 6-Cluster solutions (Table 2 in the Appendix). The information criterion BIC (LL) reaches its minimum at the 4-Cluster solution. However, the p-value shows that the chosen model is significantly different from the existing data. Thus, we repeated the analysis using the Bootstrap procedure. This resulted in a non-significant p-value of 0.168. The Bootstrap analysis included all cases (N=1,715), which differs from the Latent Gold’s default settings.
Media usage typology.
In order to interpret the clusters the class means of the 0-1-rescaled initial scales were calculated (Figure 2).
The mean class probability of the first cluster was 51.6%. On the scales “recreational use internet” and “application – social networks for learning” relatively high values were achieved. However, the mean values of the scales “acceptance – office software” and “application – e-learning-tool” of this cluster were low. Because of the relatively high values of the scale “recreational use internet” this cluster is called “entertainment users”.
The second cluster with a mean class probability of 20.1% shows the lowest mean scale values on all of the four scales. Because of the relatively low application and acceptance of all media, tools and services this cluster is called “peripheral users”.
The mean class probability of the third cluster is 20.4%. On three of the four scales this cluster achieves the highest scale means. Only on the scale “acceptance – office software” a moderate high scale value is attained. Because of the high scale values this cluster is called “advanced users”.
The mean class probability of the fourth and smallest cluster is 7.6%. The scales profile is almost reverse to cluster one. High scale means were achieved on the scales “acceptance – office software” and “application – e-learning-tools”, lower means were achieved on the other two scales. This cluster is therefore called “instrumental users”.

Student Media Usage Patterns and Non-Traditional Learning in Higher Education Zawacki-Richter, Müskens, Krause, Alturki, and Aldraiweesh
This work is licensed under a Creative Commons Attribution 4.0 International License.
155
Figure 2. Profiles of the class-specific means.
Sub-groups.
For several sub-groups we calculated and compared the mean class probabilities for the four classes (Table 3 in the Appendix). We assigned any student to the class with the highest classification probability (modal assignment). Then we compared the sub-groups due to their shares of class assignments.
The results showed several significant differences between the subgroups’ mean class probabilities.
Women had a significantly greater mean class probability for the “entertainment users” class, but a significantly lower mean class probability for the “advanced users” class.
NTS had a much greater mean class probability for the “instrumental users” class than TS. For the “peripherals” class the mean class probability of the NTS was significantly higher, too. However, the NTS had significantly smaller mean class probabilities than traditional students with regard to the classes “entertainment users” and “advanced users”.
Significant differences also existed between the types of student (on campus/blended learning/online/integrated vocational). On campus students and integrated vocational students with .54 and .58 resp. achieved the highest mean class probabilities with regard to the

Student Media Usage Patterns and Non-Traditional Learning in Higher Education Zawacki-Richter, Müskens, Krause, Alturki, and Aldraiweesh
This work is licensed under a Creative Commons Attribution 4.0 International License.
156
“entertainment users” class. This is contrasted with the moderate mean class probabilities of online- and blended-learning-students (.26 each).
A similar distribution of mean class probabilities can be seen for the “advanced users”. On campus students (.23) and integrated vocational students (.17) had much greater mean class probabilities for this class than online students (.07) and blended learning students (.09).
Contrary to the “peripherals” class, online- and blended learning-students had higher mean class probabilities (.37 each) than on campus and integrated vocational students (.19 each).
Also for the “instrumental users” class, online- and blended learning-students achieved higher mean class probabilities (.28 and .30 resp.) than on campus- and integrated vocational-students (.05 and .06 resp.).
All in all, systematic differences between on campus- and integrated vocational students on the one hand and online- and blended-learning students on the other hand were found: While on campus- and integrated vocational-students had increased mean class probabilities for the “advanced users” and “recreational users” classes, online- and blended learning-students instead had increased mean class probabilities for the “peripherals” and “instrumentals users” classes.
Students with children had significantly higher mean class probabilities (.37 and .23 resp.) than students without children (.19 and .06 resp.) for the “peripherals” and “instrumental users” classes. However, students without children had significantly increased mean class probabilities for the “entertainment users” and “advanced users” classes (.54 and .21 resp.).
Significant correlations were also found between the social status of the students’ parents and their mean class probabilities for the four classes. While for the “entertainment users” class those students, whose parents had a low social status, achieved the highest mean class probabilities (.56), for the “peripherals” class the students with parents with high social status had a higher mean class probability (.30) than the other students.
“Friends” in social networks.
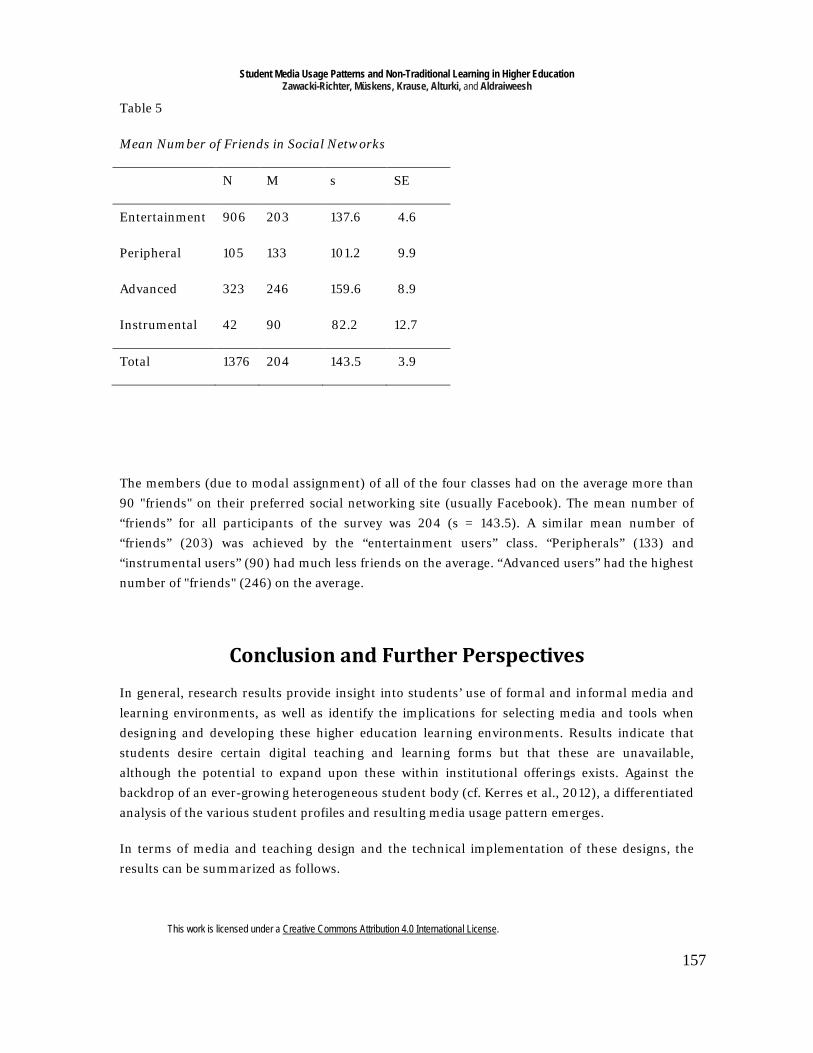
We compared the mean number of “friends” in social networks of the members of the four classes (due to modal assignment). An ANOVA showed highly significant differences (F=28.11; p<0.001; η2=0.06) between the classes.
Student Media Usage Patterns and Non-Traditional Learning in Higher Education Zawacki-Richter, Müskens, Krause, Alturki, and Aldraiweesh
This work is licensed under a Creative Commons Attribution 4.0 International License.
157
Table 5
Mean Number of Friends in Social Networks
N M s SE
Entertainment 906 203 137.6 4.6
Peripheral 105 133 101.2 9.9
Advanced 323 246 159.6 8.9
Instrumental 42 90 82.2 12.7
Total 1376 204 143.5 3.9
The members (due to modal assignment) of all of the four classes had on the average more than 90 "friends" on their preferred social networking site (usually Facebook). The mean number of “friends” for all participants of the survey was 204 (s = 143.5). A similar mean number of “friends” (203) was achieved by the “entertainment users” class. “Peripherals” (133) and “instrumental users” (90) had much less friends on the average. “Advanced users” had the highest number of "friends" (246) on the average.
Conclusion and Further Perspectives In general, research results provide insight into students’ use of formal and informal media and learning environments, as well as identify the implications for selecting media and tools when designing and developing these higher education learning environments. Results indicate that students desire certain digital teaching and learning forms but that these are unavailable, although the potential to expand upon these within institutional offerings exists. Against the backdrop of an ever-growing heterogeneous student body (cf. Kerres et al., 2012), a differentiated analysis of the various student profiles and resulting media usage pattern emerges.
In terms of media and teaching design and the technical implementation of these designs, the results can be summarized as follows.

Student Media Usage Patterns and Non-Traditional Learning in Higher Education Zawacki-Richter, Müskens, Krause, Alturki, and Aldraiweesh
This work is licensed under a Creative Commons Attribution 4.0 International License.
158
1. Regardless of the type of student, it can be assumed that there is a very high penetration of digital media. Nearly 100% of students have at-home access to the Internet, more than half have a mobile phone with Internet access (smartphones), and over a third have more than six different devices (e.g., laptop, smartphone, iPad, e-book reader, printer etc.). So, at least in Germany, it cannot be assumed that part of the target group is excluded due to restricted access to the Internet and the necessary hardware.
2. Mobile devices are tremendously popular. Although expensive tablet PCs such as the iPAD are not yet widespread amongst students, smartphones are already being used for many learning activities. With a further drop in prices, mobile device usage is expected to spread further. As mobile device technology continues to develop and spread, media, tools, and services will begin to converge, and a distinction between online learning and mobile learning no longer seems necessary (see Brown, 2004; Ally, 2009).
Web-based learning environments need to be mapped onto smaller screens that use popular operating systems for mobile devices (e.g., Android, Apple iOS). Smartphone learning environments should focus on synchronous communication tools, while tablet PCs can be used for presenting content (e.g., interactive multimedia self-learning modules, study materials or articles in e-book format).
3. High frequency of use and perceived benefits testify to a high acceptance level of the various media, tools, and services used in the study. In comparison to younger, traditional students, non-traditional students use significantly and markedly more different media, tools, and services (see Table 4). It is also interesting that the Internet-based learning platform (e.g., Moodle or StudIP) and printed and digital text have similarly high acceptance values. For this reason, delivery of printed study materials in online or blended learning courses should not be abandoned. Rather, content and communications on different channels and devices should be incorporated to allow for flexible access and participation from home, at work, and on the move.
4. As expected, non-traditional students, due to their work and family responsibilities, have a greater need for flexible study in terms of time and space. They are five times more likely to be gainfully employed while studying than "normal students". Non-traditional students also have a correspondingly higher expectation of the range of digital/virtual teaching-learning methods used. Offering blended learning courses would largely accommodate this target group, improving access as well as providing a permeable system in the sense of an "open university" (Hanft & Brinkmann, 2013; Zawacki-Richter, 2013). Self-paced learning - independent of space and time - and the possibility of direct social interaction during residency can then be combined in a didactically meaningful way. Furthermore, the results of the latent class analysis made clear that NTS (in particular part-time-students, students with children, students in online or blended learning programs) have much higher mean class probabilities for the “instrumental users” class than traditional students. NTS use a broad range of media, tools and services efficiently in order

Student Media Usage Patterns and Non-Traditional Learning in Higher Education Zawacki-Richter, Müskens, Krause, Alturki, and Aldraiweesh
This work is licensed under a Creative Commons Attribution 4.0 International License.
159
to gain access to higher education and to reach their study goals. On the other hand, they spent less time in social networks and for entertainment.
5. The results also show that the university’s internal media offerings (e.g., the learning platform) are used more intensively than external media, tools, and services. On the other hand, social networks (e.g., Facebook) are very widespread among students and are also used for study, in the form of learning groups and for interacting with fellow students. However, it does not seem to make sense to duplicate these informal networks within the formal higher education system. At the same time, a university’s technological infrastructure should include interfaces to Web 2.0 applications and social networks. Web 2.0 tools that enable collaborative learning and collaborative work (e.g., in creating presentations or text documents) should be integrated into the web-based learning environment (e.g., wikis, etherpads).
Based on the media usage typology presented in this study, interviews with selected students, who have high class probabilities of assignment to a particular type (representive cases), could be carried out in further studies in order to identify student media preferences and uses for learning. The results of such a qualitative analysis could broaden or deepen the findings from the quantitative study. In this case, the "internal views" are of particular interest in order to identify the concrete experiences, needs, and patterns of choice by participants (cf. Ehrenspeck & Geimer, 2010). This information would also provide additional insight into how empirical findings can be used for didactic purposes.
A replication of the survey is planned for the second phase of the STEM-Online project of the BMBF "Open University” program (2015-2018). This longitudinal approach will outline trends in students’ media usage behavior in light of the dynamic nature of technological development.

Student Media Usage Patterns and Non-Traditional Learning in Higher Education Zawacki-Richter, Müskens, Krause, Alturki, and Aldraiweesh
This work is licensed under a Creative Commons Attribution 4.0 International License.
160
References Albert, M., Hurrelmann, K., Quenzel, G. & TNS Infratest Sozialforschung (eds.). (2011). 16. Shell
Jugendstudie - Jugend 2010 (2nd ed.). Frankfurt a. M.: Fischer Taschenbuchverlag.
Alexander, B. (2006). Web 2.0 - A new wave of innovation for teaching and learning? EDUCAUSE Review (March/April), 32–44.
Alheit, P., Rheinländer, K. & Watermann, R. (2008). Zwischen Bildungsaufstieg und Karriere Studienperspektiven „nicht-traditioneller Studierender“, Zeitschrift für Erziehungswissenschaft 11 (4), 577–606.
Allen, E., & Seaman, J. (2011). Going the distance: Online education in the United States 2011. Retrieved from http://www.onlinelearningsurvey.com/reports/goingthedistance.pdf
Ally, M. (2009). Mobile learning - Transforming the delivery of education and training. Athabasca: Athabasca University Press.
Attwell, G. (2007). Personal learning environments - the future of eLearning? eLearning Papers 2 (1).
Barnes, S. J., Bauer, H., Neumann, M. & Huber, F. (2007). Segmenting cyberspace: A customer typology for the Internet. European Journal of Marketing, 41(1), 71–93.
Bonfadelli, H. (1993). Lesesozialisation - Leseerfahrungen und Lesekarrieren. Gütersloh: Verlag Bertelsmann-Stiftung.
Brandtzaeg, P. (2010). Towards a unified media-user typology (MUT): A meta-analysis and review of the research literature on media-user typologies. Computers in Human Behaviour, 26(5), 940–956. doi:Article
Brown, T. (2004). The role of m-learning in the future of e-learning in Africa. In D. Murphy, R. Carr, J. Taylor & W. Tat-meng (eds.), Distance education and technology: Issues and practice (197-216). Hong Kong: Open University of Hong Kong Press,.
Dahlstrom, E., De Boor, T., Grundwald, P. & Vockley, M. (2011). ECAR 2011 - National study of undergraduate students and information technology. Boulder: EDUCAUSE. Retrieved from http://www.educause.edu/ecar
Davies, C. & Good, J. (2009). Choosing to use technology: How learners construct their learning lives in their contexts. Coventry/UK: Becta.

Student Media Usage Patterns and Non-Traditional Learning in Higher Education Zawacki-Richter, Müskens, Krause, Alturki, and Aldraiweesh
This work is licensed under a Creative Commons Attribution 4.0 International License.
161
EDUCAUSE (2011). The Horizon Report 2011. Boulder: EDUCAUSE Learning Initiative and The New Media Consortium.
Ehrenspeck, Y., & Geimer, A. (2010). Qualitative Filmanalyse in der Sozial- und Erziehungswissenschaft. In B. Friebertshäuser, A. Prengel, & A. Langer (Eds.), Handbuch Qualitative Forschungsmethoden in der Erziehungswissenschaft (3. Ed., p. 589–599). Weinheim: Juventa Verlag.
Ely, E. E. (1997). The non-traditional student. Anaheim: CF.
Eynon, R. & Malmberg, L.-E. (2011). A typology of young people’s internet use: implications for education. Computers & Education, 56(3), 585–595.
Garz, D. (2004). Studium als biographische Entwicklungschance. sozialer sinn: Zeitschrift für hermeneutische Sozialforschung, (3), 387–412.
Gould, S. B. & Cross, K. P. (eds.), (1977). Explorations in non-traditional study. San Francisco: Jossey-Bass.
Grell, P. & Rau, F. (2011). Partizipationslücken – Social Software in der Hochschullehre, MedienPädagogik - Zeitschrift für Theorie und Praxis der Medienbildung (21), 1–23.
Grosch, M. & Gidion, G. (2011). Mediennutzungsgewohnheiten im Wandel. Karlsruhe: KIT Scientific Publishing. Retrieved from http://uvka.ubka.uni-karlsruhe.de/shop/download/1000022524
Guri-Rosenbilt, S. & Gros, B. (2011). E-Learning: Confusing terminology, research gaps and inherent challenges. Journal of Distance Education/Revue de l’enseignement à distance 25( 1).
Hanft, A. (2008). Bildungs- und Wissenschaftsmanagement. München: Vahlen.
Hanft, A. & Brinkmann, K. (eds.). (2013). Offene Hochschulen - Die Neuausrichtung der Hochschulen auf Lebenslanges Lernen. Münster: Waxmann.
Horn, L. J. & Carroll, C. D. (1996). Nontraditional undergraduates: Trends in enrollment from 1986 to 1992 and persistence and attainment among 1989-90 beginning postsecondary students. Washington D.C.: National Center for Education Statistics.
Isserstedt, W., Middendorff, E., Kandulla, M., Borchert, L. & Leszczensky, M. (2010). Die wirtschaftliche und soziale Lage der Studierenden in der Bundesrepublik Deutschland 2009. 19. Sozialerhebung des Deutschen Studentenwerks. Hannover: Hochschul-

Student Media Usage Patterns and Non-Traditional Learning in Higher Education Zawacki-Richter, Müskens, Krause, Alturki, and Aldraiweesh
This work is licensed under a Creative Commons Attribution 4.0 International License.
162
Informations-System (HIS). Retrieved from http://www.studentenwerke.de/pdf/Hauptbericht19SE.pdf
JIM (2010). JIM-Studie 2010 - Jugend, Information, (Multi-)Media. Stuttgart: Medienpädagogischer Forschungsverbund Südwest.
Johnson, G. M. & Kulpa, A. (2007). Dimensions of online behavior: toward a user typology. CyberPsychology & Behavior, 10(6), 773–779.
Johnsson-Smaragdi, U. (1994). Models of change and stability in adolescents’ media use. In K. E. Rosengren (ed.), Media effects and beyond. London: Routledge, 89-116.
Johnston, R. & Merrill, B. (2002). Enriching higher education: Learning and teaching with non-traditional adult students. LIHE.
Ke, F. (2010). Examining online teaching, cognitive, and social presence for adult students. Computers & Education, 55(2), 808–820.
Kerres, M., Hanft, A., Wilkesmann, U. & Wolff-Bendiik, K. (eds.) (2012). Studium 2020 - Positionen und Perspektiven zum lebenslangen Lernen an Hochschulen. Münster: Waxmann.
Kerres, M., Hölterhof, T. & Nattland, A. (2011). Zur didaktischen Konzeption von «Sozialen Lernplattformen» für das Lernen in Gemeinschaften, MedienPädagogik - Zeitschrift für Theorie und Praxis der Medienbildung, 1–22.
KIM (2010). KIM-Studie 2010 - Kinder + Medien, Computer + Internet. Stuttgart: Medienpädagogischer Forschungsverbund Südwest.
Kleimann, B., Özkilic, M. & Göcks, M. (2008). Studieren im Web 2.0 - Studienbezogene Web- und E-Learning-Dienste. Hannover: Hochschul-Informations-System (HIS). Retrieved from https://hisbus.his.de/hisbus/docs/hisbus21.pdf
Knapp, L. G., Kelly-Reid, J. E. & Ginder, S. A. (2011). Enrollment in postsecondary institutions, fall 2009; graduation rates, 2003 & 2006 cohorts; and financial statistics, fiscal year 2009. Washington, D.C.: National Center for Education Statistics.
McCutcheon, A.L. (1987). Latent class analysis. Quantitative Applications in the Social Sciences Series 64. Thousand Oaks/California: Sage Publications.
Moore, M. G. (1993). Theory of transactional distance. Theoretical principles of distance education, 1, 22-38.

Student Media Usage Patterns and Non-Traditional Learning in Higher Education Zawacki-Richter, Müskens, Krause, Alturki, and Aldraiweesh
This work is licensed under a Creative Commons Attribution 4.0 International License.
163
Moore, M. G., & Kearsley, G. (2011). Distance education: A systems view of online learning. Boston, MA: Cengage Learning
Morrison, G. R., Ross, S. M., Kalman, H. K. & Kemp, J. E. (2011). Designing effective instruction. (6th ed.). Hoboken/NJ: Wiley.
Ojstersek, N. & Kerres, M. (2008). Lernen in Second Life betreuen. Handbuch E-Learning. 25. Ergänzungslieferung, Juli.
Pituch, K. A., & Lee, Y. K. (2006). The influence of system characteristics on e-learning use. Computers & Education, 47(2), 222-244.
Rollett, H., Lux, M., Strohmaier, M., Dosinger, G. & Tochtermann, K. (2007). The Web 2.0 way of learning with technologies. International Journal of Learning Technology, 3(1), 87–107.
Schuetze, H. G. & Slowey, M. (2003). Higher education, non-traditional students and lifelong learning in industrialized countries- development and perspectives, Das Hochschulwesen, 51(5), 183-189.
Schuetze, H. G. & Slowey, M. (eds.), (2012). Global perspectives on higher education and lifelong learners. London: Routledge.
Schuetze, H. G. & Wolter, A. (2003). Higher education, non-traditional students and lifelong learning in industrialized countries - developments and perspectives. Das Hochschulwesen, 51(5), 183–189.
Schulmeister, R. (2009). Studierende, Internet, E–Learning und Web 2.0. In N. Apostolopoulos, H. Hoffmann, V. Mansmann & A. Schwill (eds.), E– Learning 2009: Lernen Im Digitalen Zeitalter. Münster: Waxmann, 129–140.
Teichler, U. & Wolter, A. (2004). Zugangswege und Studienangebote für nicht-traditionelle Studierende. Die Hochschule (2), 64–80.
Vermunt, J.K. & Magidson, J. (2005). Technical guide for Latent GOLD 4.0: Basic and advanced. Belmont Massachusetts: Statistical Innovations Inc.
Wilkesmann, U., Virgillito, A., Bröcker, T. & Knopp, L. (2012). Empirische Untersuchungen zur Hochschulwirklichkeit. In M. Kerres, A. Hanft, U. Wilkesmann & K. Wolff-Bendik (eds.), Studium 2020 - Positionen Und Perspektiven Zum Lebenslangen Lernen an Hochschulen. Münster: Waxmann, 59–81.

Student Media Usage Patterns and Non-Traditional Learning in Higher Education Zawacki-Richter, Müskens, Krause, Alturki, and Aldraiweesh
This work is licensed under a Creative Commons Attribution 4.0 International License.
164
Wolter, A. (2002). Lebenslanges Lernen und ‚non-traditional’ students. In U. Strate & M. Sosna (eds.), Lernen ein Leben lang – Beiträge der wissenschaftlichen Weiterbildung. Regensburg: AUE, 138–152.
Zawacki-Richter, O. (2013). Instruktionsdesign für berufstätige Zielgruppen. In A. Hanft & K. Brinkmann (eds.), Offene Hochschulen - Die Neuausrichtung Der Hochschulen Auf Lebenslanges Lernen. Münster: Waxmann, 192–207.
Zawacki-Richter, O. (Ed.). (2011). E-Learning und Fernstudium an Hochschulen. Innsbruck: StudienVerlag.

Student Media Usage Patterns and Non-Traditional Learning in Higher Education Zawacki-Richter, Müskens, Krause, Alturki, and Aldraiweesh
This work is licensed under a Creative Commons Attribution 4.0 International License.
165
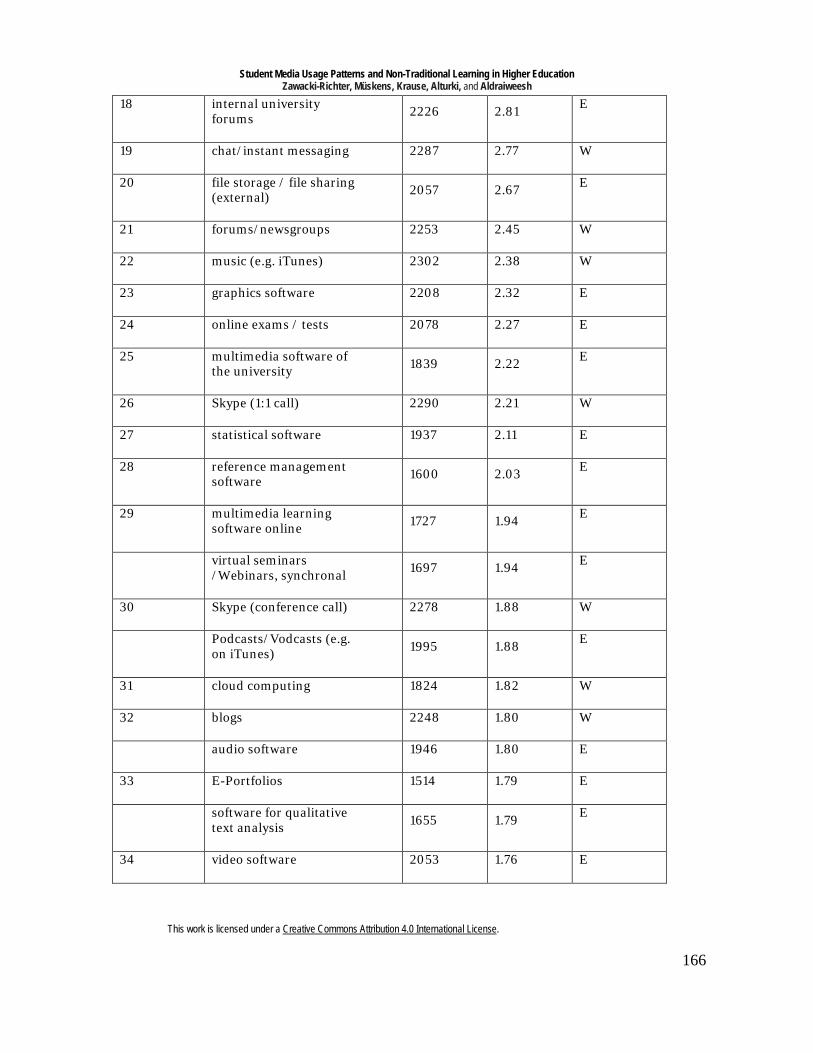
Appendix Table 1
Ranking According to Acceptance of Media Tools and Services for Learning in Higher Education
Rank N M Type1
1 search engines 2324 4.64 W
2 computer terminals outside of the university 2287 4.42 E
3 email account (external) 2319 4.39 W
4 Internet based learning platform 2285 4.28 E
5 printed texts 2323 4.26 T
6 word processing software 2307 4.17 E
7 electronic texts (e-books, PDFs) 2315 3.78 T
8 presentation software 2303 3.67 E
9 university email account 2216 3.48 W
spreadsheet software 2306 3.48 E
10 online library services 2302 3.39 E
11 lecture recordings 2231 3.38 E
12 mailing lists for courses 2258 3.34 E
13 social networks 2314 3.29 W
14 computer terminals on campus 2268 3.27 E
15 wikis 2226 3.16 W
16 file storage / file sharing (internal) 2140 3.04 E
17 videos (e.g. on YouTube) 2315 2.87 W
Student Media Usage Patterns and Non-Traditional Learning in Higher Education Zawacki-Richter, Müskens, Krause, Alturki, and Aldraiweesh
This work is licensed under a Creative Commons Attribution 4.0 International License.
166
18 internal university forums 2226 2.81 E
19 chat/instant messaging 2287 2.77 W
20 file storage / file sharing (external) 2057 2.67 E
21 forums/newsgroups 2253 2.45 W
22 music (e.g. iTunes) 2302 2.38 W
23 graphics software 2208 2.32 E
24 online exams / tests 2078 2.27 E
25 multimedia software of the university 1839 2.22 E
26 Skype (1:1 call) 2290 2.21 W
27 statistical software 1937 2.11 E
28 reference management software 1600 2.03 E
29 multimedia learning software online 1727 1.94 E
virtual seminars /Webinars, synchronal 1697 1.94 E
30 Skype (conference call) 2278 1.88 W
Podcasts/Vodcasts (e.g. on iTunes) 1995 1.88 E
31 cloud computing 1824 1.82 W
32 blogs 2248 1.80 W
audio software 1946 1.80 E
33 E-Portfolios 1514 1.79 E
software for qualitative text analysis 1655 1.79 E
34 video software 2053 1.76 E

Student Media Usage Patterns and Non-Traditional Learning in Higher Education Zawacki-Richter, Müskens, Krause, Alturki, and Aldraiweesh
This work is licensed under a Creative Commons Attribution 4.0 International License.
167
35 simulations or learning games 1804 1.64 E
36 presentation sharing (z. B. Slideshare) 1722 1.62 W
37 virtual labs 1652 1.60 E
38 RSS feeds 1719 1.53 W
39 business networks 2033 1.47 W
40 photo communities 1953 1.30 W
41 micro blogging (e.g. Twitter) 2253 1.27 W
42 social bookmarking 1647 1.22 W
43 geo tagging (e.g. Layar) 1532 1.19 W
44 virtual worlds (e.g. Second Life) 2051 1.13 W
1) types of media according to Grosch & Gidion (2011): T= text media, W= general web tools and services, E= e-learning tools and services

Student Media Usage Patterns and Non-Traditional Learning in Higher Education Zawacki-Richter, Müskens, Krause, Alturki, and Aldraiweesh
This work is licensed under a Creative Commons Attribution 4.0 International License.
168
Table 2
Overview 1- to 6-Cluster LCA
LL BIC(LL) Npar L² df p Class. Err.
Model 1 1-Cluster -9453.86 18997.09 12 952.32 243 1.4e-84
0.0000
Model 2 2-Cluster -9185.32 18497.25 17 415.24 238 9.1e-12
0.0996
Model 3 3-Cluster -9129.37 18422.58 22 303.34 233 0.0013
0.1840
Model 4 4-Cluster -9110.39 18421.85 27 265.38 228 0.045 0.2112
Model 5 5-Cluster -9101.12 18440.55 32 246.84 223 0.13 0.2308
Model 6 6-Cluster -9094.48 18464.50 37 233.56 218 0.22 0.2488

Student Media Usage Patterns and Non-Traditional Learning in Higher Education Zawacki-Richter, Müskens, Krause, Alturki, and Aldraiweesh
This work is licensed under a Creative Commons Attribution 4.0 International License.
169
Table 3
Mean Class Probabilities and Class Proportions of Sub-Groups
N Mean class probability Percent classification by modal assignment
p (χ2)
ente
rtain
men
t
perip
hera
l
adva
nced
Inst
rum
enta
l
ente
rtain
men
t
perip
hera
l
adva
nced
Inst
rum
enta
l
female 991 .54 .20 .17 .08 57.3 20.2 15.8 6.7 <0.01
male 710 .48 .21 .25 .06 51.3 19.9 23.0 5.9
p (2-tailed) <0.001 n.s. <0.001 <0.05
traditional 1149 .56 .18 .21 .05 59.1 17.9 20.1 2.9 <0.001
NTS 566 .44 .25 .18 .14 45.6 24.4 16.6 13.4
p (2-tailed) <0.001 <0.001 <0.05 <0.001
full time 1513 .54 .19 .22 .05 57.8 18.4 20.1 3.8 <0.001
part time 185 .29 .36 .10 .28 29.2 34.1 9.7 27.0
p (2-tailed) <0.001 <0.001 <0.001 <0.001
on campus 1308 .54 .19 .23 .05 56.9 18.4 21.3 3.4 <0.001
blended learning
117 .26 .37 .09 .28 27.4 32.5 8.5 31.6
online 54 .26 .37 .07 .30 22.2 35.2 7.4 35.2
Integrated vocational
217 .58 .19 .17 .06 61.8 20.3 14.7 3.2
p (2-tailed) <0.001 <0.001 <0.001 <0.001
children 142 .31 .37 .09 .23 31.7 36.6 7.7 23.9 <0.001

Student Media Usage Patterns and Non-Traditional Learning in Higher Education Zawacki-Richter, Müskens, Krause, Alturki, and Aldraiweesh
This work is licensed under a Creative Commons Attribution 4.0 International License.
170
no children 1549 .54 .19 .21 .06 56.9 18.5 19.8 4.9
p (2-tailed) <0.001 <0.001 <0.001 <0.001
social status of parents – low
649 .56 .19 .27 .16 62.7 17.9 13.9 5.5 <0.001
medium 570 .52 .20 .30 .16 55.3 20.5 18.6 5.6
medium high
353 .44 .19 .35 .17 40.8 19.8 32.6 6.8
high 143 .47 .30 .25 .19 49.7 28.7 9.8 11.9
p (2-tailed) <0.001 <0.01 <0.001 n.s.
© Zawacki-Richter, Müskens, Krause, Alturki, and Aldraiweesh