students with disabilities outcomes and improvement strategies patricia j. geary coordinator,...
TRANSCRIPT
Students with Disabilities Outcomes and Improvement Strategies
Patricia J. GearyCoordinator, Special Education Policy and Professional Development
Higher Education Task Force Meeting October 2007

We’re making progress….
Achievement is up in Grades 3-8 in English Language Arts and Mathematics
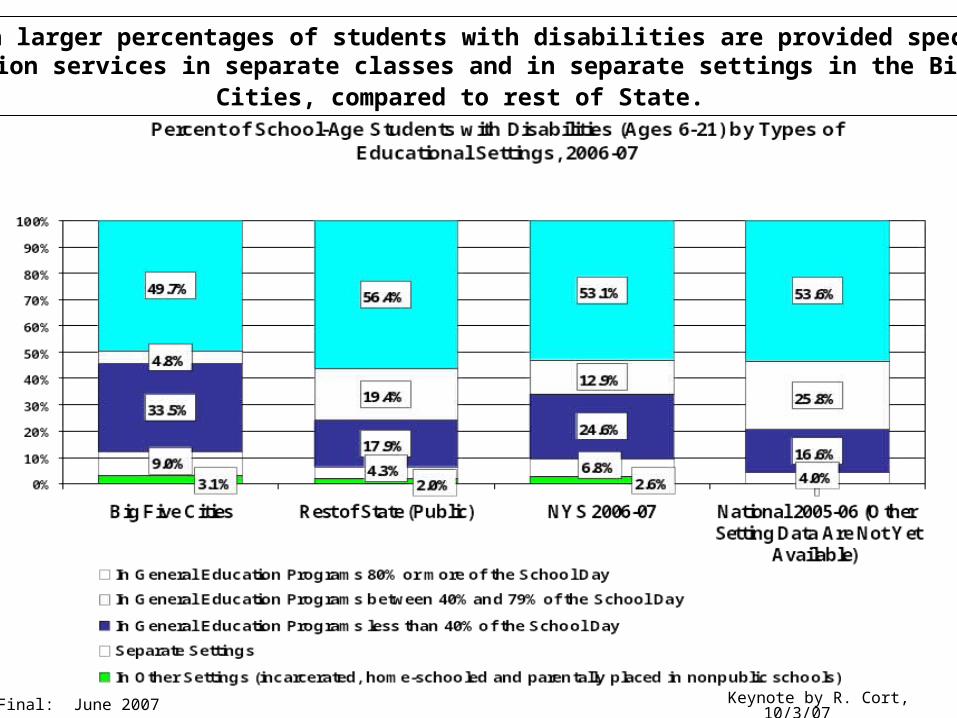
Few students are educated in separate settings
More take and pass Regents exams every year
More graduate every year
More earn Regents diplomas
More attend college than a decade ago

But Achievement and Graduation Rates Remain Far Too Low Black students are disproportionately classified.
Too few students with disabilities are in general education settings in the Big Five Cities.
Achievement in Grades 3-8 is a fraction of what it should be.
Successful outcomes (graduation) are too low.
Too many students are dropping out of school.
Final: June 2007
Much larger percentages of students with disabilities are provided specialeducation services in separate classes and in separate settings in the Big Five
Cities, compared to rest of State.
Keynote by R. Cort, 10/3/07

• The percentage of students with disabilities in serious academic difficulties decreased in every category.
• Gap: Students in Large City Districts were 4 times as likely as those in Low Need Districts to score at Level 1.
2006 & 2007 English Language Arts (ELA) by Need/Resource Categories:
Percentages of Students with Disabilities at Level 1
Keynote by R. Cort, 10/3/07

9,7678,424
7,226
8,305
5,675
6,790
2,832
4,9694,154
2,499
13,07912,144
9,68011,194
8,60610,461
4,175
7,545
9,514
3,414
20,08118,949
16,30914,101
17,321
15,366
13,51812,607
5,6474,419
1997 1998 1999 2000 2001 2002 2003 2004 2005 2006
Number with Score of 65-100Number with Score of 55-100Number Tested
• Since 1997, there has been more than 354% increase in the number of students with disabilities tested.
• Of the students tested in 2006, 65% achieved a score between 55-100.
Regents English Examination and Students with Disabilities
Public Schools-Including Charter Schools, Final April 2007 Keynote by R. Cort, 10/3/07
Student Group Cohort
Enrollment
Regents/
Local Diploma
IEP Diploma & Other
Still Enrolled
Transfer
to GED
Dropout
2001 Total Cohort After 4 Years
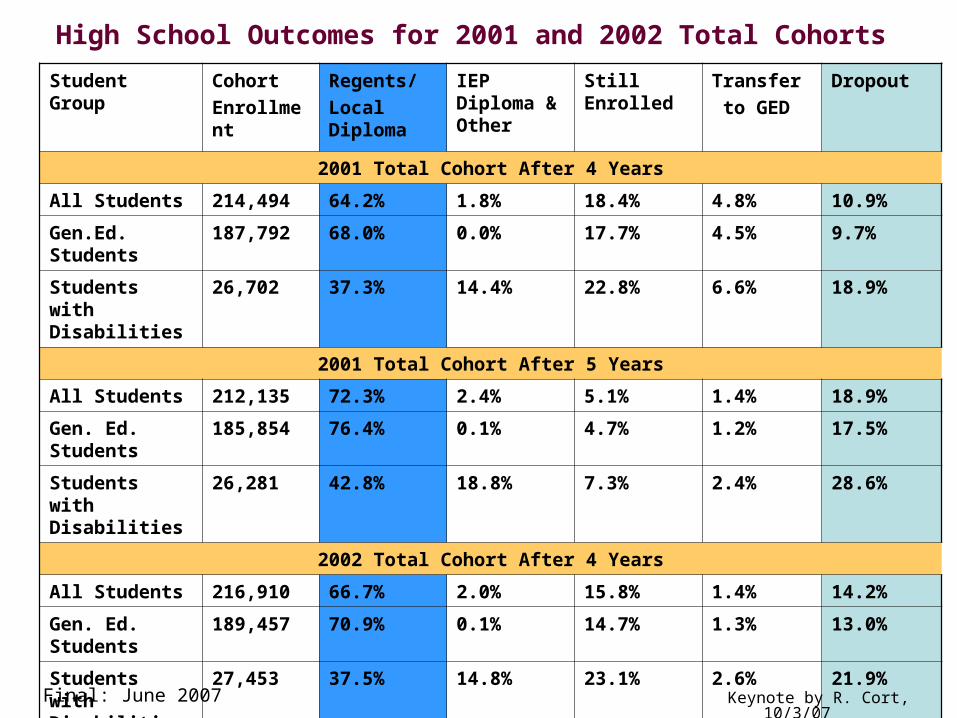
All Students 214,494 64.2% 1.8% 18.4% 4.8% 10.9%
Gen.Ed. Students
187,792 68.0% 0.0% 17.7% 4.5% 9.7%
Students with Disabilities
26,702 37.3% 14.4% 22.8% 6.6% 18.9%
2001 Total Cohort After 5 Years
All Students 212,135 72.3% 2.4% 5.1% 1.4% 18.9%
Gen. Ed. Students
185,854 76.4% 0.1% 4.7% 1.2% 17.5%
Students with Disabilities
26,281 42.8% 18.8% 7.3% 2.4% 28.6%
2002 Total Cohort After 4 Years
All Students 216,910 66.7% 2.0% 15.8% 1.4% 14.2%
Gen. Ed. Students
189,457 70.9% 0.1% 14.7% 1.3% 13.0%
Students with Disabilities
27,453 37.5% 14.8% 23.1% 2.6% 21.9%
High School Outcomes for 2001 and 2002 Total Cohorts
Final: June 2007 Keynote by R. Cort, 10/3/07
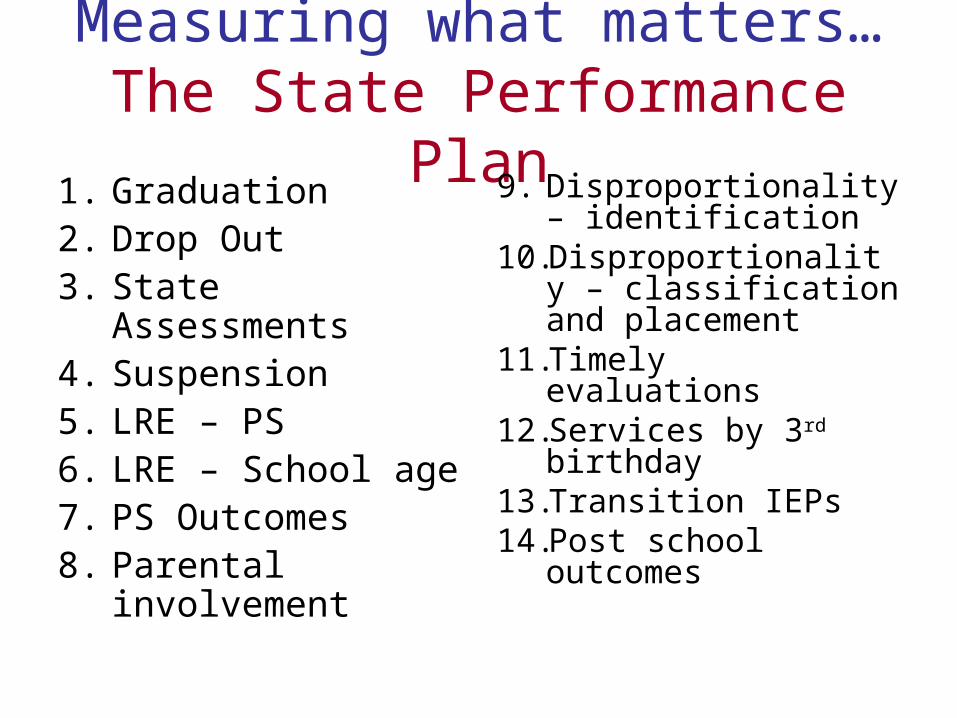
Measuring what matters…The State Performance Plan
1. Graduation2. Drop Out3. State Assessments4. Suspension5. LRE – PS6. LRE – School age7. PS Outcomes8. Parental
involvement
9. Disproportionality – identification
10.Disproportionality – classification and placement
11.Timely evaluations12.Services by 3rd
birthday13.Transition IEPs14.Post school
outcomes

State and District Results
• State’s Annual Performance Report
• Special Education School District Data Profile
http://www.vesid.nysed.gov/specialed/spp/home.html

Strategies for Improving Student Performance in
the P-16 Initiative
Keynote by R. Cort, 10/3/07

VESID Key Actions for 2007-08 Annual targets for improvement
Identification of districts in need of assistance and in need of intervention
Direct TA resources to IDEA-identified districts
Contracts for Excellence prioritize students in greatest need, including students with disabilities
Focus TA on improving core instructional practices
Identify successful schools
Establish statewide Response to Intervention (RtI) Technical Assistance Center (TAC)
Provide grants to districts to implement RtI programs
Explore the development of Career and Technology Education (CTE) program options for students with disabilities to decrease dropout rates
Quality Indicator Assessment and Resource Guides Literacy
Early literacy Middle level High school Specially Designed Intensive Systemic Supports
Behavioral supports and interventions School-wide positive behavioral supports Classroom management Small group intensive Intensive, individualized interventions
Delivery of special education services Instructional environment and practice CSE process IEP development

III Indicator 1: School InfrastructureQuestion: Does the school have a consistent effective school-wide discipline system, with sufficient allocation of resources that includes a clear, efficient system for addressing the needs of students with severe or chronic behavioral problems?
Component 1a: School-wide Support
Quality Indicators Look Fors Comments
There is a school-wide system for addressing discipline that includes:oincreasingly intensive interventions; oon-going assessment to determine student need for intervention; and ouse of a data-drive problem-solving process.
Principal provides oversight of system, including process for implementing individualized interventions, to ensure it is being delivered as designed
Meeting rosters, memos
The principal is an active participant in planning and implementing intensive individualized interventions
Records of classroom visits
Adequate resources and programmatic flexibility are provided to implement individualized interventions with fidelity
Budgets, schedules,job descriptions
Access to school-based intensive interventions is rapid and efficient
BOE minutes,newsletters/website

Indicator 4: Developing intensive individualized interventions: FBA Question: Do teams identify problem behavior(s) in concrete, measurable terms, and determine why the student engages in problem behaviors that impede learning and how the environment is related to the behavior(s)?Component 4C: Baseline is established
Quality Indicators Look Fors Comments
Baseline measures were taken to determine occurrence/non-occurrence of problem behavior across:
oactivitiesosettings opeople otimes of day
Copies of data collection tools/summary of data
Baseline measures include frequency, duration, intensity and/or latency (how long it takes a student to respond)
Copies of data collection tools/summary of data
Behavioral needs are documented in Present Levels of Performance in the IEP
IEP
Component 1D: Contextual Factors: Factors Influencing Behavior
Factors that increase the likelihood of the behavior are identified (such as problems at home, on the bus, classroom activities, tasks).
FBA
Relationships between antecedents (people, events, activities that occur before the problem behavior) and the problem behavior are identified
FBA
Sequences of student behavior that consistently precede target behavior are identified
FBA
Important Policy and Monitoring Changes to Improve Results
High standards for behavioral assessments and interventions
Response-to-Intervention Programs – LD, Screening, Contracts for Excellence Regulations
New criteria for determining students with learning disabilities
Continuum of service options to meet individuals student needs
Educational benefit reviews
Behavioral Assessments and Interventions8 NYCRR Section 200.22
Functional behavioral assessments
Behavioral intervention plansUse of Time Out RoomsEmergency Interventions
The FBA must include, but is not limited to:
identification of the problem behavior; definition of the behavior in concrete terms; identification of the contextual factors that
contribute to the behavior (including cognitive and affective factors); and
formulation of a hypothesis regarding the general conditions under which a behavior usually occurs and probable consequences that serve to maintain it.

Functional Behavioral Assessment (con’t.)
The FBA: Must be based on multiple sources of data Cannot be based solely on student’s history of
presenting problem behaviors Must provide a baseline of student’s problem
behaviors Include sufficient detail to form the basis for a
behavioral intervention plan (BIP)
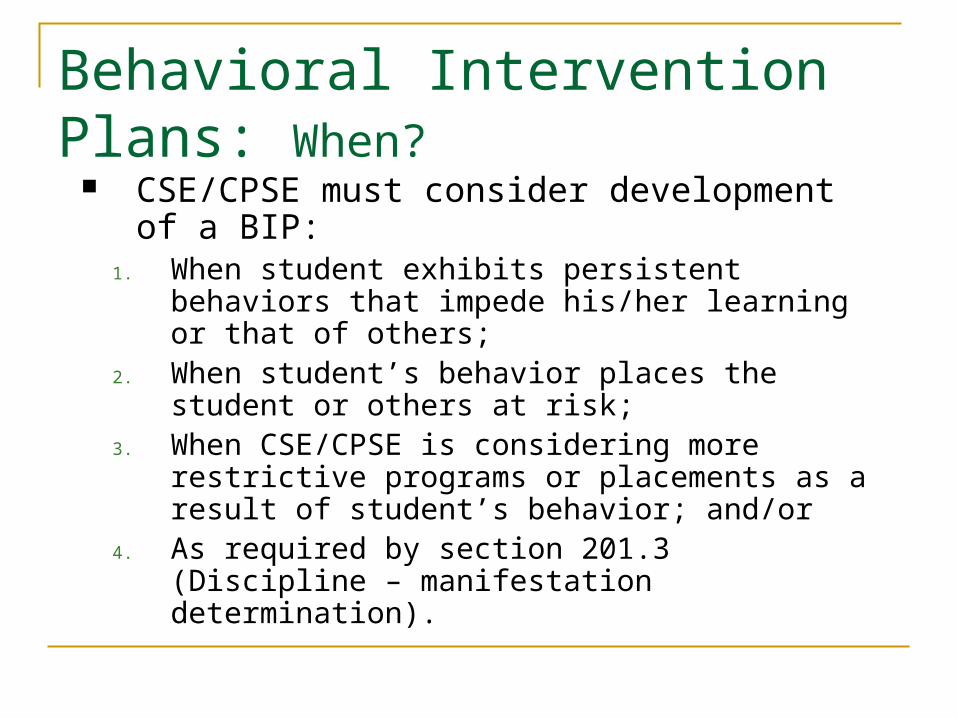
Behavioral Intervention Plans: When?
CSE/CPSE must consider development of a BIP:
1. When student exhibits persistent behaviors that impede his/her learning or that of others;
2. When student’s behavior places the student or others at risk;
3. When CSE/CPSE is considering more restrictive programs or placements as a result of student’s behavior; and/or
4. As required by section 201.3 (Discipline – manifestation determination).

Behavioral Intervention Plans
BIP must identify: Baseline measure of problem behavior,
including frequency, duration, intensity and or latency of targeted behaviors
Intervention strategies for targeted inappropriate behavior
Schedule to measure effectiveness of the interventions

Progress Monitoring
Implementation of BIP must include progress monitoring of frequency, duration and intensity of behavior Done at scheduled intervals as specified in the
BIP and on student’s IEP Results reported to student’s parents and to
CSE/CPSE Considered in determination to revise a
student’s BIP or IEP

Learning Disabilities
Response to Intervention Programs
State criteria for LD determinations

RtI Programs §100.2(ii)
Minimum requirements Appropriate instruction in general education class
Appropriate instruction in reading means scientific research-based reading programs that include instruction in: Phonemic awareness Phonics Vocabulary development Reading fluency and Reading comprehension strategies
Screenings Levels of targeted intervention
Repeated assessments Application of information to make educational
decisions Written notification to parents
Student performance data collected and general education services to be provided
Strategies for increasing rate of learning Parents’ right to request an evaluation

School selects structure and components Criteria for determining levels of intervention Types of interventions Amount and nature of performance data to be
collected Manner and frequency for progress monitoring
Ensure fidelity of implementation Staff knowledge and skills to implement RtI Program is implemented consistent with the RtI
structure and components selected
Referrals when using RtI
School district must initiate a referral and promptly request parent consent to evaluate a student who: has not made adequate progress after an
appropriate period of time when provided instruction in a “response-to-intervention” process (§100.2(ii))

Learning Disabilities (LD) § 200.4(j) May not rely on any single procedure Must include observation of student’s academic performance in
the regular classroom Before referral With parent consent, after the referral Must be conducted by CSE member
Q: If you use an RtI process, must you still conduct a complete individual evaluation?
A: Yes

Are learning problems the result of lack of appropriate instruction in math and reading? Data that demonstrates that prior to, or as part of,
the referral process, the student was provided appropriate instruction in regular education settings, delivered by qualified personnel;
Data-based documentation of repeated assessments of achievement at reasonable intervals, reflecting formal assessment of student progress during instruction Information must have been provided to parents
prior to referral

Who makes the LD determination?
CSE Must include student’s regular education
teacher; and At least one person qualified to conduct
individual diagnostic examinations (e.g., school psychologist, speech/language pathologist, reading teacher)
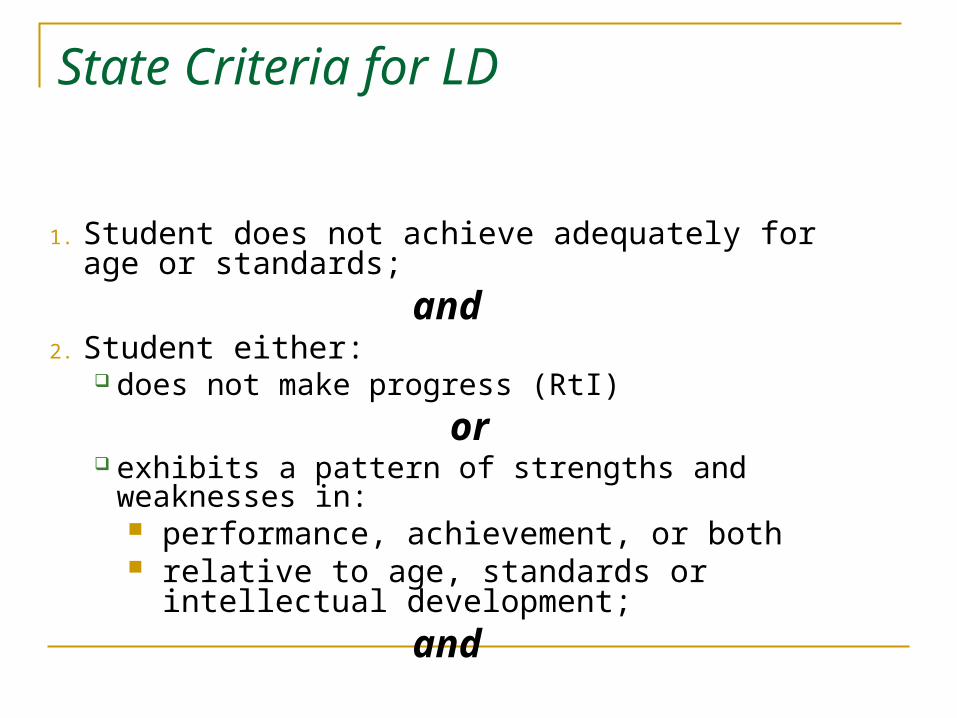
State Criteria for LD
1. Student does not achieve adequately for age or standards;
and2. Student either:
does not make progress (RtI)
or exhibits a pattern of strengths and weaknesses in:
performance, achievement, or both relative to age, standards or intellectual
development;
and

3. Not result of: visual, hearing or motor disability; mental retardation; emotional disturbance; cultural factors; environmental or economic disadvantage; or limited English proficiency

Use of significant discrepancy State does not prohibit its use Except that effective on or after July 1, 2012
(5 years), a school district shall not use the severe discrepancy criteria for: LD determination in reading for students in
grades K-4.

Written report of LD Determination
1. Does student have a LD?
2. Basis for making the determination?
3. Relevant behavior noted during the observation and the relationship of the behavior to the student’s academic functioning
4. Educationally relevant medical findings
5. Does the student meet the State’s criteria?
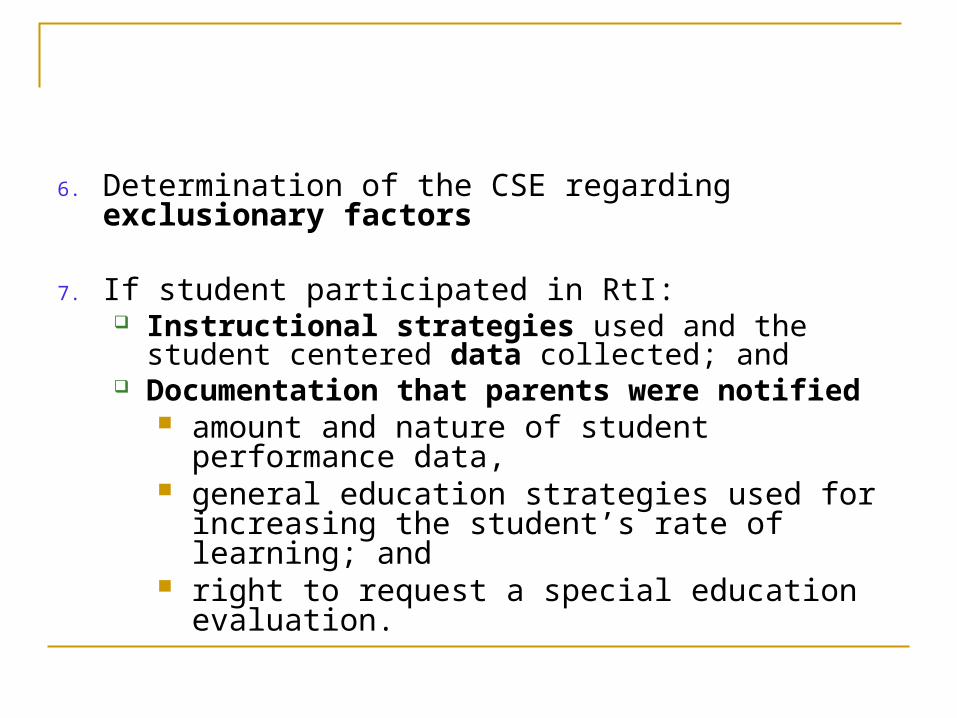
6. Determination of the CSE regarding exclusionary factors
7. If student participated in RtI: Instructional strategies used and the student
centered data collected; and Documentation that parents were notified
amount and nature of student performance data,
general education strategies used for increasing the student’s rate of learning; and
right to request a special education evaluation.

Proposals to Advance RtI Implementation
RtI Technical Assistance Center (RtI-TAC) Connect to new federally-funded National RtI
Center Grants to schools to implement RtI
Selected schools throughout NYS

Continuum of Services
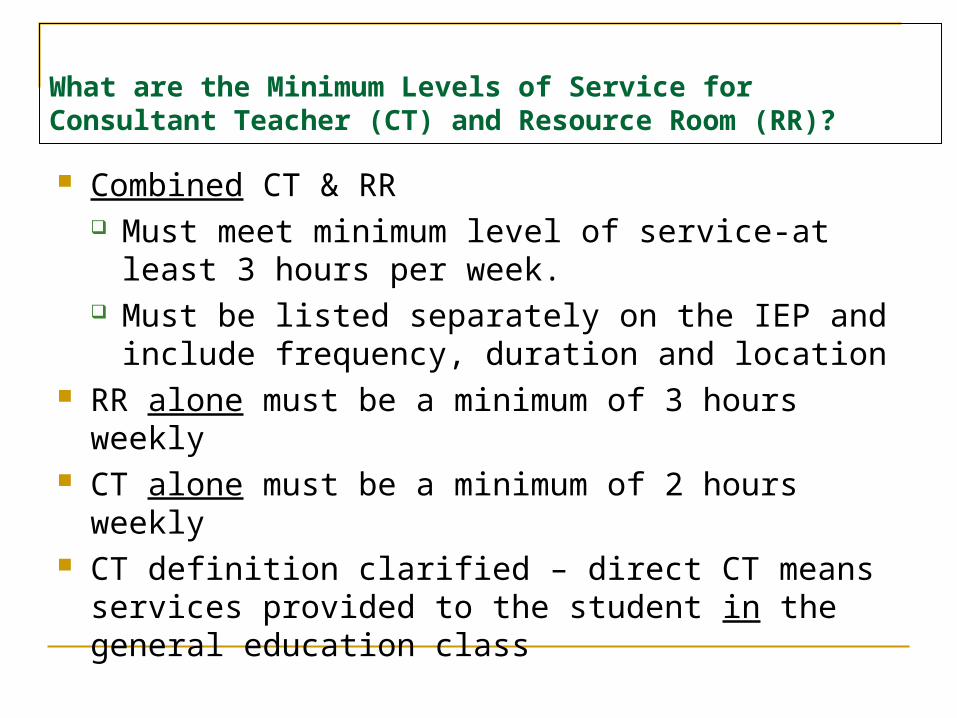
What are the Minimum Levels of Service for Consultant Teacher (CT) and Resource Room (RR)?
Combined CT & RR Must meet minimum level of service-at least 3
hours per week. Must be listed separately on the IEP and include
frequency, duration and location RR alone must be a minimum of 3 hours weekly CT alone must be a minimum of 2 hours weekly CT definition clarified – direct CT means services
provided to the student in the general education class
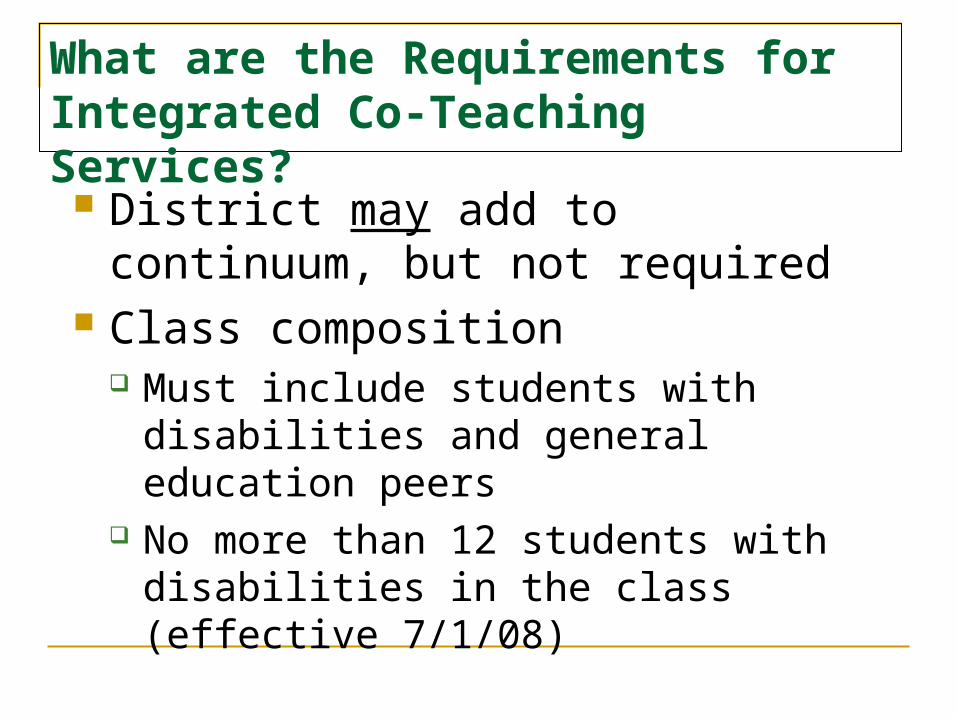
What are the Requirements for Integrated Co-Teaching Services?
District may add to continuum, but not required
Class composition Must include students with disabilities and
general education peers No more than 12 students with disabilities
in the class (effective 7/1/08)
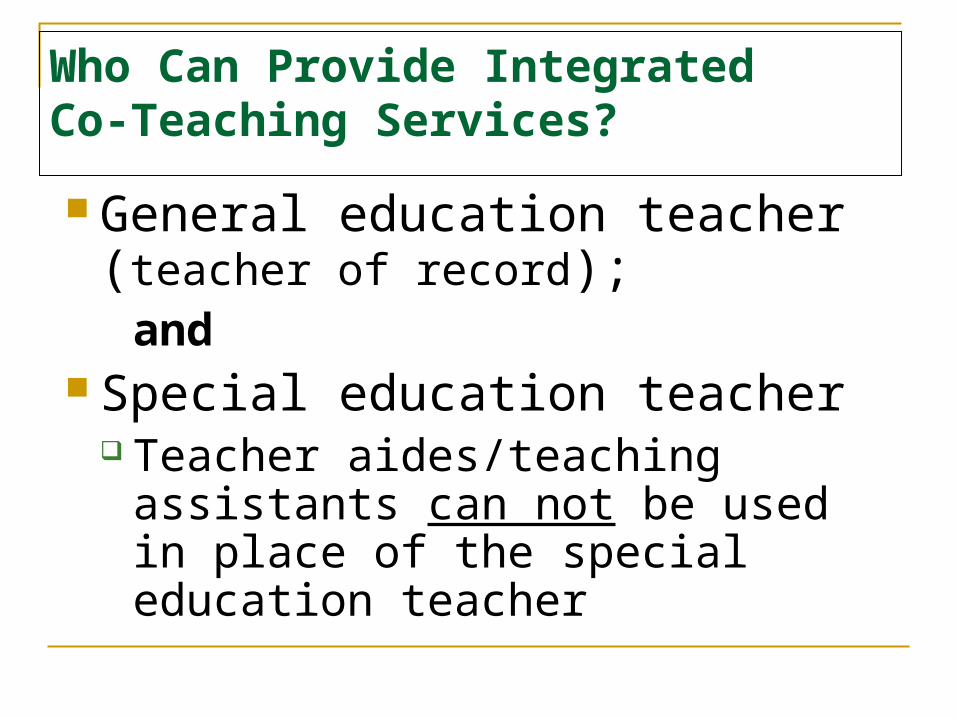
Who Can Provide IntegratedCo-Teaching Services?
General education teacher (teacher of record);
and Special education teacher
Teacher aides/teaching assistants can not be used in place of the special education teacher

Who Can Provide IntegratedCo-Teaching Services?
General education teacher (teacher of record);
and Special education teacher
Teacher aides/teaching assistants can not be used in place of the special education teacher

Educational Benefit

Free Appropriate Public Education (FAPE) Intent is to design individualized
instruction
With sufficient supports and services to
Enable student to receive educational benefit

Rowley Standard
U.S. Supreme Court in Board of Education v. Rowley (1982) defined two-pronged test
Used to determine if IEP appropriately developed Does IEP meet procedural compliance? Was IEP reasonably calculated to enable child to
receive educational benefit?

Reasonable Calculation
Based on procedural requirements of IDEA 2004 IEP identifies needs related to:
Child’s disability Involvement & progress in general curriculum
Annual Goals established in each need area Services planned to support:
Progress toward all goals Progress in general curriculum Participation in extracurricular & other nonacademic activities Education with disabled & nondisabled children
Child’s IEP adjusted if progress not made and/or to address anticipated needs

Educational Benefit
Can be measured in a variety of ways Achieving passing marks Advancing from grade to grade Making progress toward meeting annual goals Improving scores on statewide/district wide assessments &
alternate assessment measures Graduating with a regular diploma Passing High School exit exams such as Regents and RCT

Educational Benefit Activity
Determine whether design of IEP is reasonably calculated for student to receive educational benefit

Components
Reviewing IEP documentation and annual goals progress for a 3-year cycle
Analyzing the relationship among needs, annual goals, and services
Comparing progress across consecutive IEPs
Looking for patterns in IEP development process
Determining if IEP was reasonably calculated to result in educational benefit