studies on digital watersheds studies on digital watersheds … · 2020. 2. 6. · work can be done...
TRANSCRIPT

Studies on Digital Watersheds Studies on Digital Watersheds Extraction in ChinaExtraction in China
Songcai YOUSongcai YOU
Institute of Geographic Sciences and Natural Resources ResearchInstitute of Geographic Sciences and Natural Resources ResearchChinese Academy of SciencesChinese Academy of Sciences
12th AIM Workshop, 1912th AIM Workshop, 19--21, February, 2007, NIES, Japan21, February, 2007, NIES, Japan
PurposesPurposes
For study of hydrological parameters in each of For study of hydrological parameters in each of main watershedsmain watershedsFor to calculate the area of each of main For to calculate the area of each of main watershedswatershedsThere exists no digital watershed map with There exists no digital watershed map with coordination and projection at coordination and projection at ““digitaldigital”” era. era.
Data SourcesData Sources
SRTM30: resolution is 1km by 1kmSRTM30: resolution is 1km by 1kmGTOPO30: resolution is 1km by 1kmGTOPO30: resolution is 1km by 1kmChina 1:1M DEM: created from 1:1M contour China 1:1M DEM: created from 1:1M contour lineslinesChina 1:250,000 DEM: created from 1:250,000 China 1:250,000 DEM: created from 1:250,000 contour linescontour lines

Methods and OutputsMethods and Outputs
D8 algorithm is applied to calculate the flow D8 algorithm is applied to calculate the flow direction direction
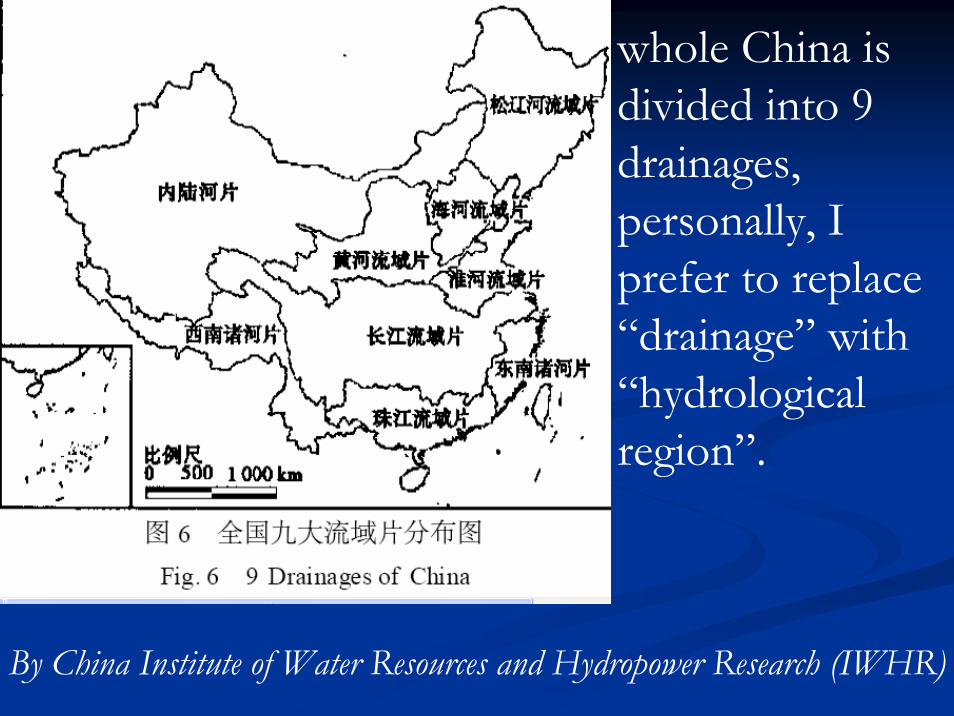
whole China is divided into 9 drainages, personally, I prefer to replace “drainage” with “hydrological region”.
By China Institute of Water Resources and Hydropower Research (IWHR)
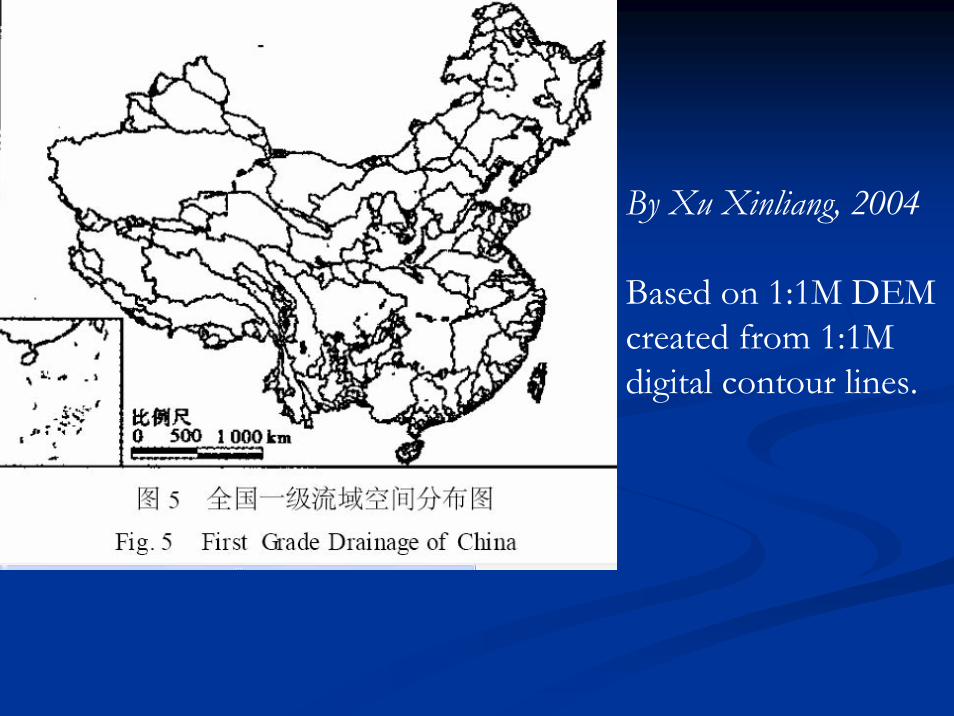
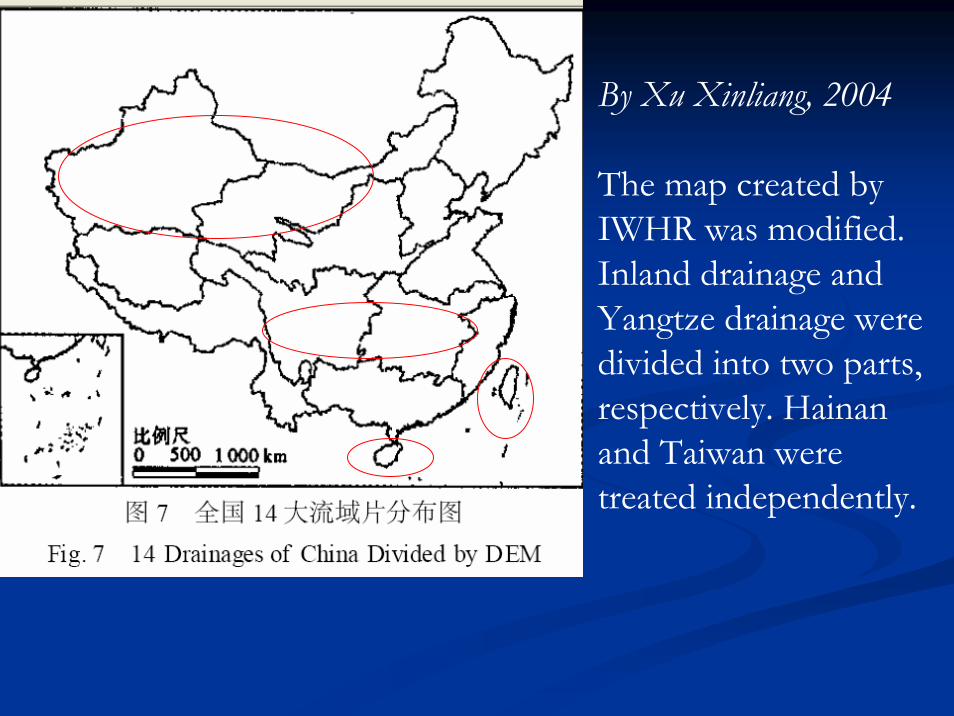
By Xu Xinliang, 2004
Based on 1:1M DEM created from 1:1M digital contour lines.
By Xu Xinliang, 2004
The map created by IWHR was modified. Inland drainage and Yangtze drainage were divided into two parts, respectively. Hainan and Taiwan were treated independently.
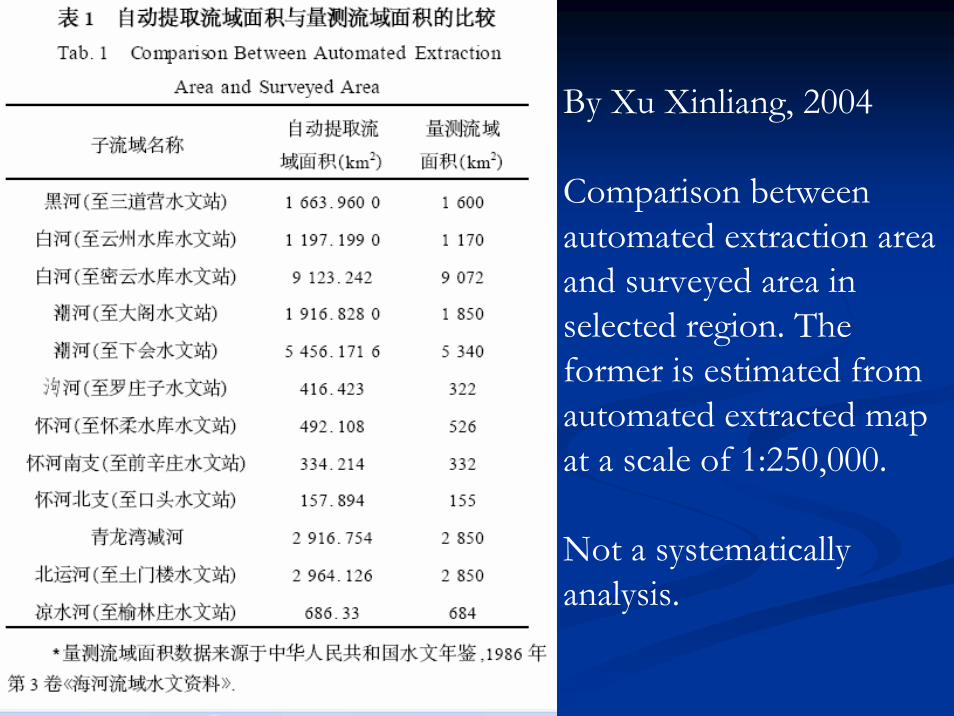
By Xu Xinliang, 2004
Comparison between automated extraction area and surveyed area in selected region. The former is estimated from automated extracted map at a scale of 1:250,000.
Not a systematically analysis.
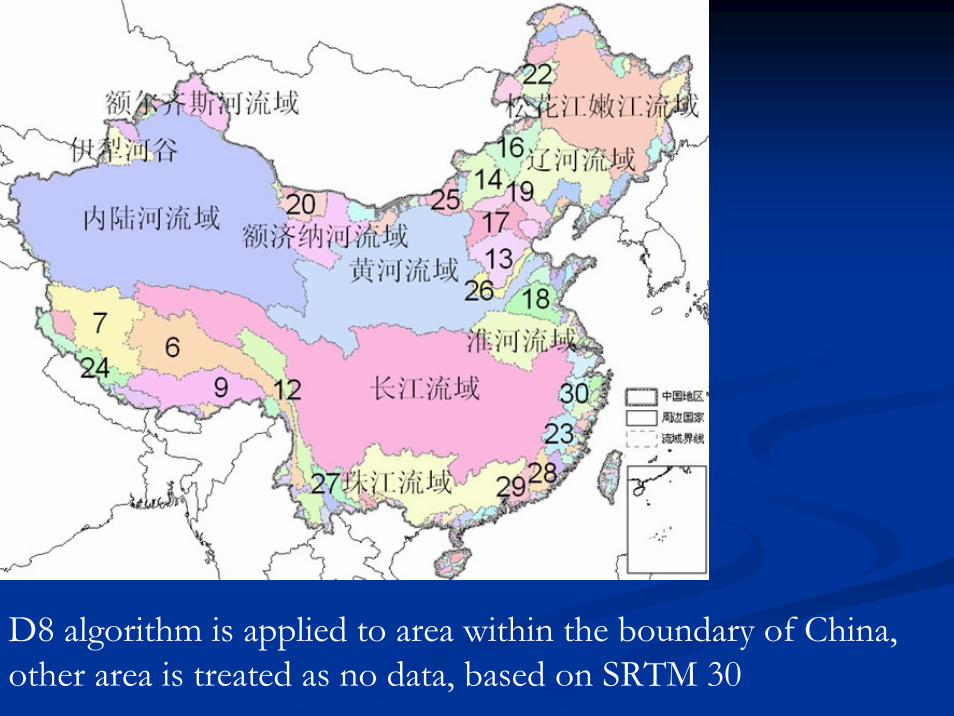
D8 algorithm is applied to area within the boundary of China, other area is treated as no data, based on SRTM 30

D8 algorithm is applied to rectangle area between 70-140E and 15-55N, which covers whole China and its neighboring regions, based on SRTM 30

D8 algorithm is applied to rectangle area between 70-140E and 15-55N, based on GTOPO30
The outlet of Yellow River should be here (pointed by red arrow),

Id Name Area(Km2) %#1 Inland Rivers 1,865,198 19.85# 2 Yangtze River 1,839,084 19.57# 3 Yellow River 980,060 10.43# 4 Songhuajiang & Nenjiang River 545,037 5.80# 5 Zhujiang River 386,265 4.11# 6 6 324,912 3.46# 7 7 247,221 2.63# 8 Liaohe River 222,697 2.37# 9 9 190,038 2.02# 10 Huaihe River 183,563 1.95# 11 Ejina River 158,771 1.69# 12 12 145,367 1.55# 13 13 101,347 1.08# 14 14 91,201 0.97# 15 Eerqisi River 84,820 0.90# 16 16 83,205 0.89# 17 17 74,877 0.80# 18 18 74,302 0.79# 19 19 64,194 0.68# 20 20 56,467 0.60# 21 Ili Valley 54,888 0.58# 22 22 54,466 0.58# 23 23 52,340 0.56
Sum 7,880,330 83.86

Future workFuture work
Potentially, we can use TM/ETM+ images to Potentially, we can use TM/ETM+ images to check the boundary of watershed. Currently, this check the boundary of watershed. Currently, this work can be done in Google Earth, we may do it work can be done in Google Earth, we may do it next year when we finish the mosaic of next year when we finish the mosaic of TM/ETM+ for whole China.TM/ETM+ for whole China.Extraction of subExtraction of sub--watersheds in each first level watersheds in each first level watershed.watershed.