study abroad decision survey ciee
DESCRIPTION
ÂTRANSCRIPT
STUDY ABROAD DECISION MAKING SURVEY
STUDY ABROAD
January 2015
CIEE Spring 2015 Participants
Patrick Moran, Director, Research and Business Development Jillian Foley, Research Analyst

Background & Methodology
• A 10-minute online survey was sent to all Spring 2015 participants of the Study Abroad program shortly before their departure to evaluate the resources they used to make their decision to study abroad with CIEE.
• Fielding resulted in a total of 1,311 completed responses for a 54% response rate. Responses were received from students from 249 out of the 307 (81%) sending schools.
• Statistical significance between subgroups was calculated at the 95% confidence level as noted throughout.
2
Spring 2015
Dates in field 12/15/14-01/02/15
Invites 2,437
Completes 1,311
Response Rate 54%
Margin of Error +/- 1.84%

EXECUTIVE SUMMARY
3

Executive Summary
• For the most part, students’ pathways to studying abroad with CIEE for Spring 2015 were very traditional. Many came to CIEE through their school’s study abroad office or their home university website.
• CIEE Students study abroad largely because they want to see the world and travel, learn about a different culture, or for personal development and two-thirds chose CIEE because of the destinations offered.
• One-fifth of CIEE students did not consider any other study abroad program option. However, 50% considered a program with another 3rd party provider, and 42% considered a program offered through their home university.
• Among the organizations tested, IES, and SIT are the biggest competitors, however in general provider awareness is low. Only 46% are aware of IES, and 14% seriously considered a program with IES.
• The CIEE Study Abroad website is the most commonly used resource when making the decision to study abroad with CIEE, with 73% reporting they used the website. Followed by 66% that used their home university study abroad office, 38% used their home university website, and 28% used a CIEE catalog/brochure. Alumni networking is also an important factor, as 27% report talking to a CIEE alum.
• Among those who used the CIEE website, 6-in-10 report finding the website through an online search. Those who used the catalogs mostly obtained the catalog from their home university study abroad office.
• Not surprisingly, informational resources (such as the catalogs, or study abroad fairs) are used earlier on in the decision making process as students are exploring their options. Meanwhile, online resources, social media, and talking to alumni are used later on, when a student is trying decide whether to go on a specific program.
• Overall, students report that talking to a CIEE alum and the CIEE Study Abroad website were the most useful and most important to their decision to study abroad with CIEE.
• CIEE resources should continue to be improved upon to ensure maximum effectiveness for the way in which they are being used by students.
4

Executive Summary
• The typical CIEE student for Spring 2015 is female, white, aged 20-21, and comes from a higher income family. Many are Social Science or Business and Management majors, and the majority (88%) have traveled internationally at least once before studying abroad with CIEE.
• Students who are white, have traveled internationally in the past, and come from higher income backgrounds are more likely to hear about CIEE from word of mouth resources, such as their peers, family members, or CIEE alumni. Meanwhile, those who come from lower incomes and are a racial minority are less likely to hear about CIEE and studying abroad from these sources. This suggests there may be different pathways to studying abroad for students of diverse backgrounds.
• In order to understand these various pathways, further research should explore backgrounds and decision making processes for summer and fall CIEE students as well. Reaching students who are choosing other program options, or who choose not to study abroad at all would also provide an interesting comparison for future marketing and sales efforts.
• Next Steps:
• Conduct the same survey with summer and fall 15 students. • Conduct a survey with advisors to examine the way in which they are using the CIEE resources and
presenting information to the students. • Marketing will work with the study abroad team to examine ways to improve the website and catalogs. • Research will work with the study abroad team to examine new research methods to reach out to the
students who are not studying abroad with CIEE.
5

RESPONDENT PROFILE
6
Respondent Profile
7
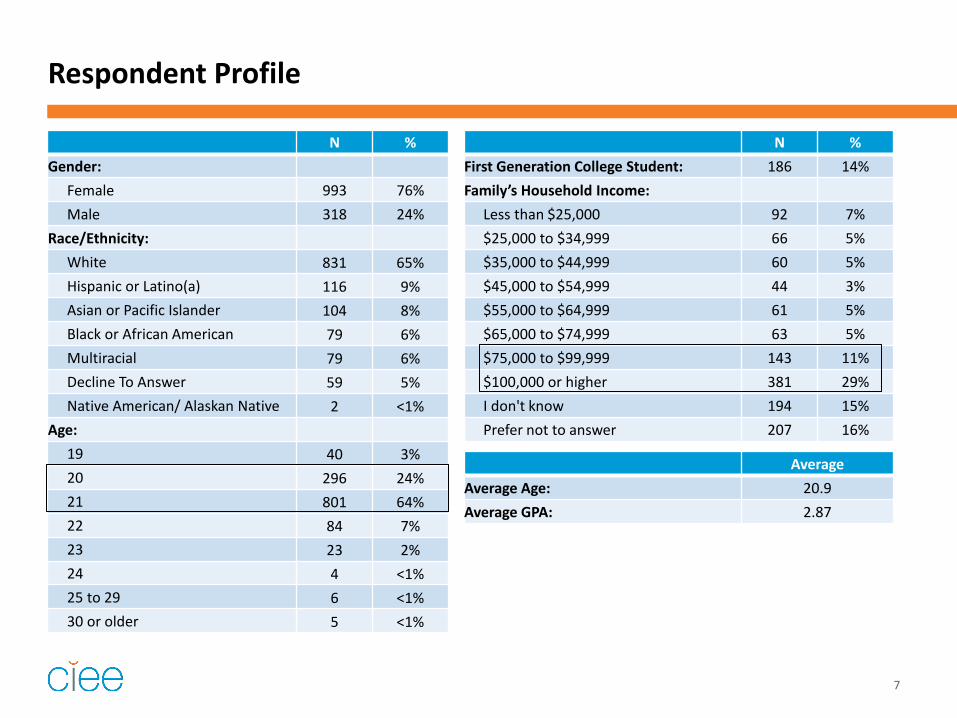
N % Gender:
Female 993 76% Male 318 24%
Race/Ethnicity: White 831 65% Hispanic or Latino(a) 116 9% Asian or Pacific Islander 104 8% Black or African American 79 6% Multiracial 79 6% Decline To Answer 59 5% Native American/ Alaskan Native 2 <1%
Age: 19 40 3% 20 296 24% 21 801 64% 22 84 7% 23 23 2% 24 4 <1% 25 to 29 6 <1% 30 or older 5 <1%
N % First Generation College Student: 186 14% Family’s Household Income:
Less than $25,000 92 7% $25,000 to $34,999 66 5% $35,000 to $44,999 60 5% $45,000 to $54,999 44 3% $55,000 to $64,999 61 5% $65,000 to $74,999 63 5% $75,000 to $99,999 143 11% $100,000 or higher 381 29% I don't know 194 15% Prefer not to answer 207 16%
Average Average Age: 20.9 Average GPA: 2.87
Respondent Profile
8
N %
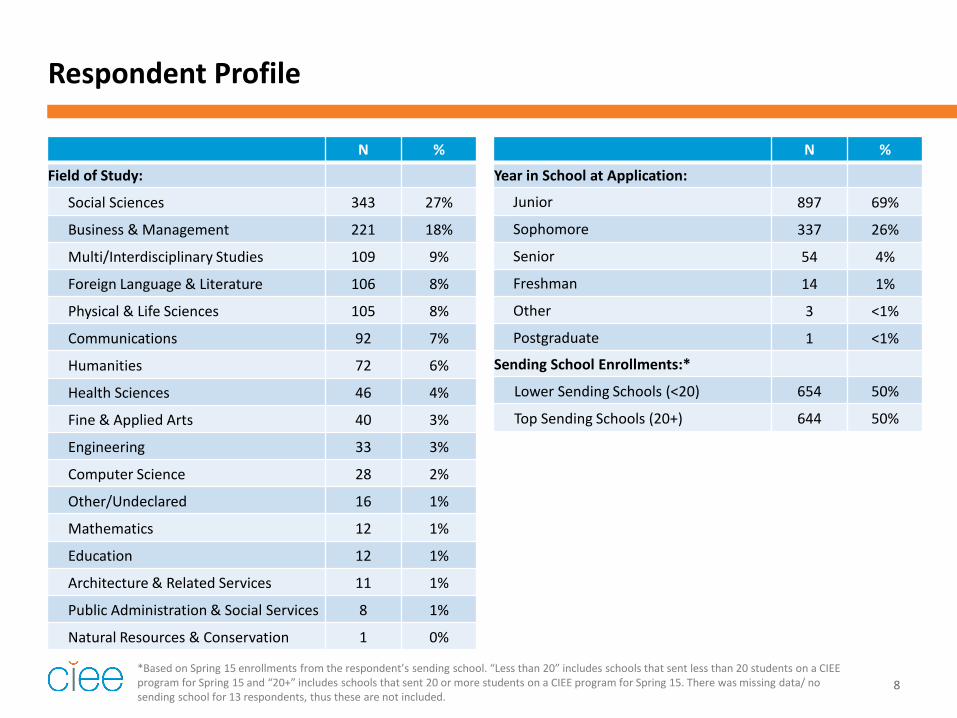
Field of Study:
Social Sciences 343 27%
Business & Management 221 18%
Multi/Interdisciplinary Studies 109 9%
Foreign Language & Literature 106 8%
Physical & Life Sciences 105 8%
Communications 92 7%
Humanities 72 6%
Health Sciences 46 4%
Fine & Applied Arts 40 3%
Engineering 33 3%
Computer Science 28 2%
Other/Undeclared 16 1%
Mathematics 12 1%
Education 12 1%
Architecture & Related Services 11 1%
Public Administration & Social Services 8 1%
Natural Resources & Conservation 1 0%
N %
Year in School at Application:
Junior 897 69%
Sophomore 337 26%
Senior 54 4%
Freshman 14 1%
Other 3 <1%
Postgraduate 1 <1%
Sending School Enrollments:*
Lower Sending Schools (<20) 654 50%
Top Sending Schools (20+) 644 50%
*Based on Spring 15 enrollments from the respondent’s sending school. “Less than 20” includes schools that sent less than 20 students on a CIEE program for Spring 15 and “20+” includes schools that sent 20 or more students on a CIEE program for Spring 15. There was missing data/ no sending school for 13 respondents, thus these are not included.

CIEE Study Abroad students are experienced international travelers.
12%
27%
23%
21%
18%
Total (n=1311)
Number of Times Traveled Internationally
10 or more
5 to 9
3 to 4
1 to 2
None
9 How many times have you traveled internationally? (Not including your upcoming study abroad experience.) *Estimated mean
Before studying abroad, students had
traveled internationally 4.2 times on average*.

KEY FINDINGS
10

AWARENESS OF STUDY ABROAD & CIEE
January 21, 2015
11

Four-in-ten first heard about CIEE Study Abroad through their study abroad office/ advisor.
28%
19%
16%
12%
7%
7%
5%
4%
1%
0%
Study abroad office/ advisor
Home university website
Friend/ Classmate
Family Member
Online search
Study abroad fair
High School teacher/guidance counselor
Professor/ Faculty Member
Other
Social media
Heard About Study Abroad
Total (n=1311)
12 How did you first hear about the opportunity to study abroad? How did you first hear about CIEE Study Abroad?
39%
24%
11%
9%
9%
3%
3%
2%
1%
0%
0%
Study abroad office/advisor
Home university website
Online search
Study abroad fair
Friend/ Classmate
Professor/ Faculty Member
CIEE alum
Family Member
Other
Advertisement (Online, Print,Radio)
Social Media
First Heard About CIEE Study Abroad
Total (n=1311)
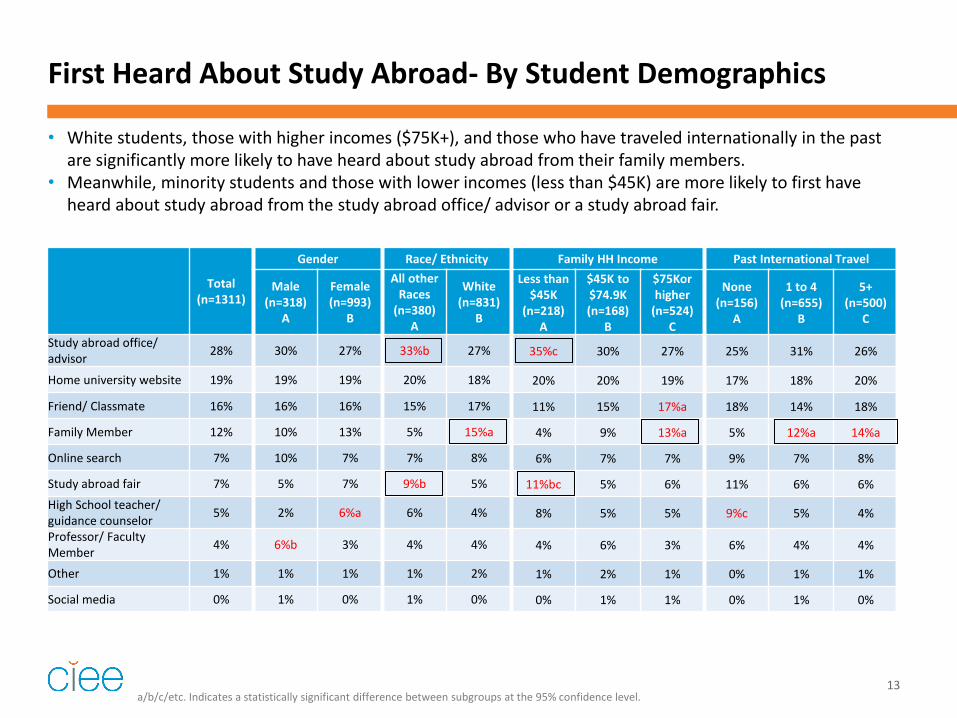
First Heard About Study Abroad- By Student Demographics
Total (n=1311)
Gender Race/ Ethnicity Family HH Income Past International Travel
Male (n=318)
A
Female (n=993)
B
All other Races
(n=380) A
White (n=831)
B
Less than $45K
(n=218) A
$45K to $74.9K (n=168)
B
$75Kor higher
(n=524) C
None (n=156)
A
1 to 4 (n=655)
B
5+ (n=500)
C
Study abroad office/ advisor 28% 30% 27% 33%b 27% 35%c 30% 27% 25% 31% 26%
Home university website 19% 19% 19% 20% 18% 20% 20% 19% 17% 18% 20%
Friend/ Classmate 16% 16% 16% 15% 17% 11% 15% 17%a 18% 14% 18%
Family Member 12% 10% 13% 5% 15%a 4% 9% 13%a 5% 12%a 14%a
Online search 7% 10% 7% 7% 8% 6% 7% 7% 9% 7% 8%
Study abroad fair 7% 5% 7% 9%b 5% 11%bc 5% 6% 11% 6% 6% High School teacher/ guidance counselor 5% 2% 6%a 6% 4% 8% 5% 5% 9%c 5% 4%
Professor/ Faculty Member 4% 6%b 3% 4% 4% 4% 6% 3% 6% 4% 4%
Other 1% 1% 1% 1% 2% 1% 2% 1% 0% 1% 1%
Social media 0% 1% 0% 1% 0% 0% 1% 1% 0% 1% 0%
13 a/b/c/etc. Indicates a statistically significant difference between subgroups at the 95% confidence level.
• White students, those with higher incomes ($75K+), and those who have traveled internationally in the past are significantly more likely to have heard about study abroad from their family members.
• Meanwhile, minority students and those with lower incomes (less than $45K) are more likely to first have heard about study abroad from the study abroad office/ advisor or a study abroad fair.
First Heard About Study Abroad- By Education Profile
Total (n=1311)
Year in School at Application Background First Major Field Of Study 1st Generation College School Enrollments
Soph. (n=337)
A
Junior (n=897)
B
Other (n=72)
C
Business & Manag. (n=221)
A
Foreign Lang.
(n=106) B
STEM (n=229)
C
Social Sciences (n=343)
D
Other (n=356)
E
Yes (n=186)
A
No (n=1107)
B
<20 (n=654)
A
20+ (n=644)
B
Study abroad office/ advisor 28% 33%b 25% 40%b 27% 27% 29% 29% 28% 32% 28% 30% 27%
Home university website 19% 18% 19% 17% 21% 14% 17% 20% 18% 17% 19% 19% 19%
Friend/ Classmate 16% 15% 17%c 8% 21%bd 11% 16% 14% 16% 11% 17%a 13% 19%a Family Member 12% 9% 13%a 7% 15%bd 8% 15%bd 9% 12% 4% 13%a 9% 14%a Online search 7% 8% 7% 10% 7% 5% 10% 6% 8% 8% 7% 10%b 5% Study abroad fair 7% 8%c 6% 3% 5% 10% 5% 8% 6% 11%b 6% 7% 6% High School teacher/ guidance counselor 5% 5% 5% 6% 2% 8% 3% 8% 6% 11%b 4% 4% 6%
Professor/ Faculty Member 4% 3% 4% 10% 2% 14%acd 3% 4% 3% 3% 4% 5% 3%
Other 1% 1% 2% 0% 0% 1% 1% 1% 2% 1% 1% 2% 1% Social media 0% 1% 0% 0% 0% 1% 1% 1% 0% 1% 0% 0% 0%
14 a/b/c/etc. Indicates a statistically significant difference between subgroups at the 95% confidence level.
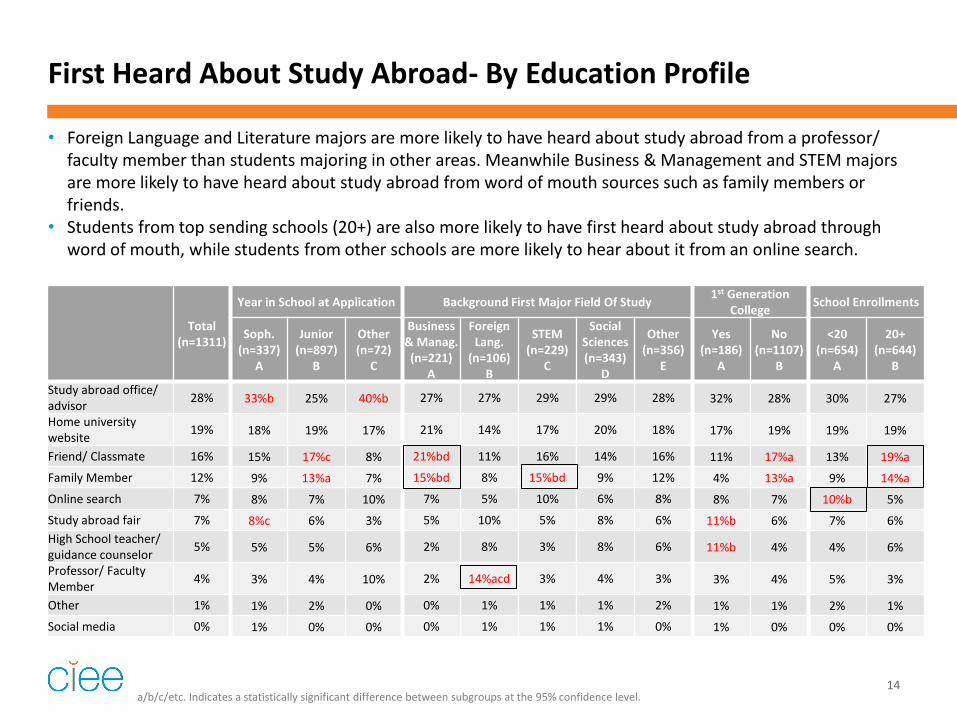
• Foreign Language and Literature majors are more likely to have heard about study abroad from a professor/ faculty member than students majoring in other areas. Meanwhile Business & Management and STEM majors are more likely to have heard about study abroad from word of mouth sources such as family members or friends.
• Students from top sending schools (20+) are also more likely to have first heard about study abroad through word of mouth, while students from other schools are more likely to hear about it from an online search.
First Heard About CIEE- By Student Demographics
Total (n=1311)
Gender Race/ Ethnicity Family HH Income Past International Travel
Male (n=318)
A
Female (n=993)
B
All other Races
(n=380) A
White (n=831)
B
Less than $45K
(n=126) A
$45K to $74.9K (n=168)
B
$75Kor higher
(n=524) C
None (n=156)
A
1 to 4 (n=655)
B
5+ (n=500)
C
Study abroad office/ advisor 39% 39% 39% 44%b 37% 42% 36% 40% 39% 40% 38%
Home university website 24% 24% 24% 24% 25% 30% 23% 23% 24% 25% 23%
Online search 11% 12% 10% 10% 10% 11% 8% 10% 12% 11% 10%
Study abroad fair 9% 5% 10% 9% 9% 7% 11% 9% 10% 9% 9%
Friend/ Classmate 9% 9% 8% 6% 10%a 5% 8% 10%a 7% 8% 10% Professor/ Faculty Member 3% 6% 2% 3% 3% 2% 8%ac 3% 2% 4% 3%
CIEE alum 3% 2% 3% 1% 3%a 1% 4% 2% 4% 2% 3%
Family Member 2% 2% 2% 2% 2% 0% 1% 2% 2% 1% 2%
Other 1% 0% 1% 1% 0% 1% 0% 0% 0% 0% 1%
Social Media 0% 1% 0% 0% 0% 0% 1% 0% 0% 0% 0% Advertisement (Online, Print, Radio) 0% 0% 0% 0% 0% 0% 0% 0% 0% 0% 0%
15 a/b/c/etc. Indicates a statistically significant difference between subgroups at the 95% confidence level.
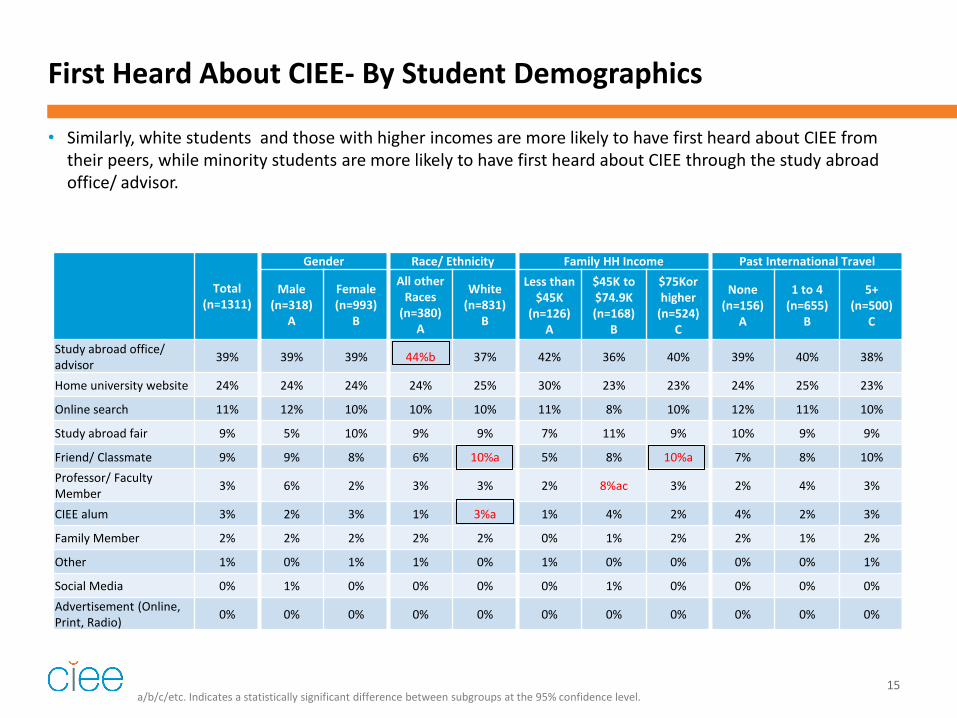
• Similarly, white students and those with higher incomes are more likely to have first heard about CIEE from their peers, while minority students are more likely to have first heard about CIEE through the study abroad office/ advisor.

First Heard About CIEE- By Education Profile
Total (n=1311)
Year in School at Application Background First Major Field Of Study 1st Generation College School Enrollments
Soph. (n=337)
A
Junior (n=897)
B
Other (n=72)
C
Business & Manag. (n=221)
A
Foreign Lang.
(n=106) B
STEM (n=229)
C
Social Sciences (n=343)
D
Other (n=356)
E
Yes (n=186)
A
No (n=1107)
B
<20 (n=654)
A
20+ (n=644)
B
Study abroad office/advisor 39% 41% 37% 54%ba 39% 36% 39% 40% 40% 40% 39% 41% 38%
Home university website 24% 23% 25% 21% 27% 25% 22% 25% 23% 30% 23% 22% 26%
Online search 11% 11% 11% 10% 9% 9% 13% 9% 12% 12% 10% 13%b 9%
Study abroad fair 9% 10% 9% 6% 6% 9% 9% 10% 9% 9% 9% 8% 10%
Friend/ Classmate 9% 8%c 10%c 1% 11% 8% 8% 8% 9% 4% 9%a 9% 9% Professor/ Faculty Member 3% 4% 3%a 4% 1% 9%ac 2% 4%a 2% 3% 3% 4%b 2%
CIEE alum 3% 1% 3% 3% 2% 2% 1% 2% 4% 1% 3%a 2% 3%
Family Member 2% 2% 2% 1% 3% 0% 4% 1% 1% 1% 2% 1% 2%
Other 1% 0% 1% 0% 1% 0% 1% 0% 0% 0% 1% 1% 0%
Social Media 0% 0% 0% 0% 0% 0% 0% 1% 0% 0% 0% 0% 0% Advertisement (Online, Print, Radio) 0% 0% 0% 0% 0% 0% 0% 0% 0% 0% 0% 0% 0%
16 a/b/c/etc. Indicates a statistically significant difference between subgroups at the 95% confidence level.
• Sophomores and Juniors are less likely to have first heard about CIEE from the study abroad office/ advisor than students at other grade levels.
• Foreign Language majors are more likely to have first heard about CIEE from a professor/ faculty member.

WHY STUDY ABROAD?
17

The majority study abroad to see the world and travel, learn about a different culture, and/or for personal development.
18 Why did you decide to study abroad? Please select all that apply.
87%
81%
81%
66%
38%
21%
18%
18%
3%
To see the world and travel
Learn about a different culture
Personal development
Acquire or develop language skills
Professional development
Travel with friends
Required for major/ degree program
Learn more about your culture/ familybackground
Other
Reason for Studying Abroad
Total (n=1311)

Reason for Studying Abroad-By Student Demographics
Total (n=1311)
Gender Race/ Ethnicity Family HH Income Past International Travel
Male (n=318)
A
Female (n=993)
B
All other Races
(n=380) A
White (n=831)
B
Less than $45K
(n=126) A
$45K to $74.9K (n=168)
B
$75Kor higher
(n=524) C
None (n=156)
A
1 to 4 (n=655)
B
5+ (n=500)
C
To see the world and travel 87% 81% 89%a 81% 91%a 81% 87% 90%a 88% 88% 86%
Learn about a different culture 81% 75% 83%a 76% 84%a 76% 77% 83% 83% 81% 80%
Personal development 81% 76% 83%a 78% 83%a 80% 79% 83% 77% 84%c 79%
Acquire or develop language skills 66% 64% 67% 67% 65% 69% 65% 63% 65% 67% 65%
Professional development 38% 42% 37% 40% 37% 44% 39% 36% 32% 39% 39%
Travel with friends 21% 21% 20% 15% 24%a 13% 18% 26%ab 16% 20% 23%
Learn more about your culture/ family background 18% 19% 18% 27%b 13% 19% 21% 16% 19% 17% 19%
Required for major/ degree program 18% 18% 18% 22%b 16% 22% 21% 15% 22% 16% 19%
Other 3% 3% 3% 3% 2% 4% 2% 2% 2% 2% 3%
19 a/b/c/etc. Indicates a statistically significant difference between subgroups at the 95% confidence level.
• Female, white students are more likely to study abroad to see the world and travel, learn about a different culture, and/or for personal development. Meanwhile minority students are more likely to study abroad to learn more about their culture/ family background and/or because it is required for their major.
• Students with higher incomes are more likely to study abroad to travel with friends.

Reason for Studying Abroad-By Education Profile
Total (n=1311)
Year in School at Application Background First Major Field Of Study 1st Generation College School Enrollments
Soph. (n=337)
A
Junior (n=897)
B
Other (n=72)
C
Business & Manag. (n=221)
A
Foreign Lang.
(n=106) B
STEM (n=229)
C
Social Sciences (n=343)
D
Other (n=356)
E
Yes (n=186)
A
No (n=1107)
B
<20 (n=654)
A
20+ (n=644)
B
To see the world and travel 87% 85% 88% 81% 90% 87% 90% 86% 84% 84% 88% 86% 88%
Learn about a different culture 81% 82%c 82%c 65% 81% 85% 82% 80% 80% 76% 82% 80% 82%
Personal development 81% 81%c 82%c 67% 82% 75% 83% 82% 80% 80% 81% 81% 81%
Acquire or develop language skills 66% 70%b 64% 71% 72%cd 93%acd 59% 63% 62% 70% 66% 63% 70%a
Professional development 38% 43%b 36% 42% 43% 47% 35% 37% 35% 44% 37% 36% 41%
Travel with friends 21% 18%c 23%ac 8% 27%b 11% 21%b 20%b 20% 14% 22%a 15% 27%a
Learn more about your culture/ family background 18% 16% 18% 19% 18% 15% 18% 21% 17% 19% 18% 17% 18%
Required for major/ degree program 18% 27%bc 15% 17% 19%c 45%acd 10% 13% 21% 22% 18% 19% 17%
Other 3% 4% 2% 3% 2% 0% 4% 2% 4% 2% 3% 4%b 1%
20 a/b/c/etc. Indicates a statistically significant difference between subgroups at the 95% confidence level.
• Business/ Management and Foreign Language/ Literature students are more likely to study abroad to develop their language skills than students majoring in other areas. Similarly, Foreign Language majors are more likely to study abroad because it is required for their major.

Reason for Studying Abroad- By CIEE Program Location
Total (n=1311)
Northern Europe (n=266)
a
Southern Europe (n=449)
b
Africa (n=147)
c
Asia (n=195)
d
Latin America (n=172)
e
MENA (n=69)
f
Australia (n=13*)
g
To see the world and travel 87% 90%d 89%d 88%d 78% 89% 81% 77%
Learn about a different culture 81% 80% 81% 82% 76% 88%abd 80% 54%
Personal development 81% 82% 80% 83% 80% 85% 68% 85%
Acquire or develop language skills 66% 35%c 85%acd 19% 76%abc 91%abcd 84%ac 0%
Professional development 38% 35% 37% 28% 41% 47% 52% 31%
Travel with friends 21% 29% 28% 16% 12% 8% 10% 8%
Learn more about your culture/ family background 18% 21% 17% 14% 22% 18% 16% 0%
Required for major/ degree program 18% 6% 19% 10% 25% 31% 30% 0%
Other 3% 3% 1% 5% 3% 3% 3% 8%
21 a/b/c/etc. Indicates a statistically significant difference between subgroups at the 95% confidence level. *Small sample size, use caution in interpretation.
• Students who study abroad to acquire or develop language skills are more likely to be studying in Southern Europe or Latin America, than other regions.
• Students who want to learn about a different culture are also more likely to be studying in Latin America.
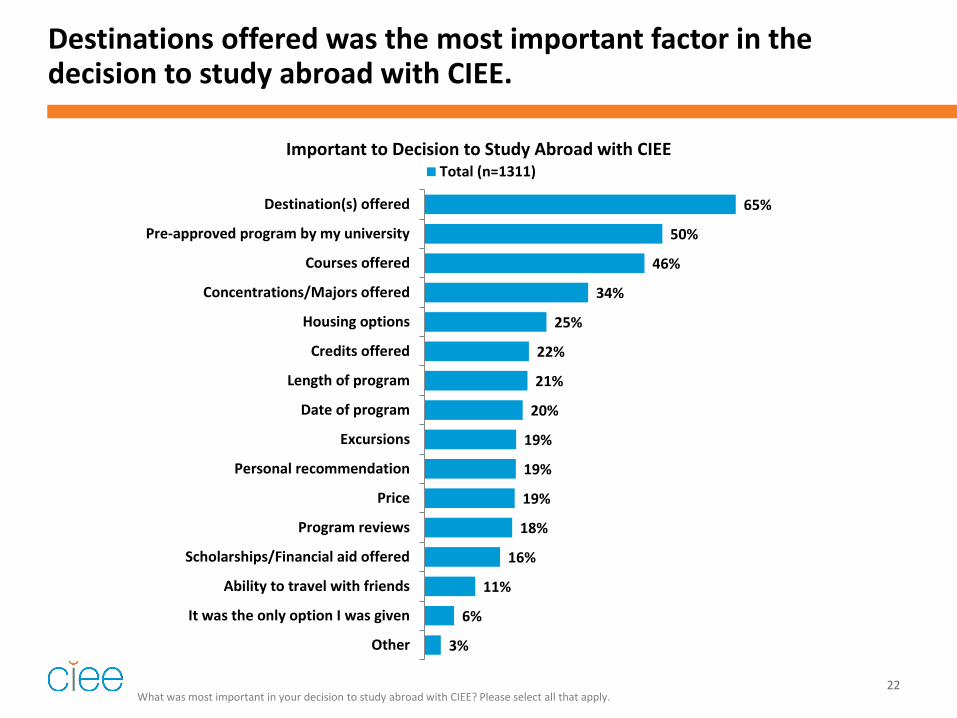
Destinations offered was the most important factor in the decision to study abroad with CIEE.
22 What was most important in your decision to study abroad with CIEE? Please select all that apply.
65%
50%
46%
34%
25%
22%
21%
20%
19%
19%
19%
18%
16%
11%
6%
3%
Destination(s) offered
Pre-approved program by my university
Courses offered
Concentrations/Majors offered
Housing options
Credits offered
Length of program
Date of program
Excursions
Personal recommendation
Price
Program reviews
Scholarships/Financial aid offered
Ability to travel with friends
It was the only option I was given
Other
Important to Decision to Study Abroad with CIEE Total (n=1311)

OTHER OPTIONS CONSIDERED
23

Half considered a program with another third party provider organization.
24 Before you chose CIEE, what other kinds of study abroad programs did you consider? Please select all that apply.
53%
42%
22%
14%
12%
10%
9%
5%
1%
Study abroad program offered through anotherstudy abroad organization (like CIEE)
Study abroad program offered through my homeuniversity
I did not consider any other options
Study abroad program offered through a universitythat is not my home university
Volunteer/ Service learning program
Overseas internship
Direct enrollment with overseas university
Teach abroad program
Other
Other Programs Considered Total (n=1311)
Males are more likely to indicate they did not consider any other options compared to females (28% vs. 19%).
While Business/ Management majors are more likely to indicate they did not consider any other options (30%), STEM majors are more likely to have considered an internship (12%) and/or service learning (14%) program.
Students from top (20+) sending schools are more likely to indicate they did not consider any other option (26%), while students from other schools are more likely to consider other 3rd party organizations (59%).

Other Programs Considered- By CIEE Program Location
Total (n=1311)
Northern Europe (n=266)
a
Southern Europe (n=449)
b
Africa (n=147)
c
Asia (n=195)
d
Latin America (n=172)
e
MENA (n=69)
f
Australia (n=13*)
g
I did not consider any other options 22% 20% 21% 20% 29%abe 16% 29%e 15%
Study abroad program offered through another study abroad organization (like CIEE) 53% 52% 54% 54% 46% 57%d 57% 62%
Study abroad program offered through my home university 42% 44%f 43%f 39% 41% 46%f 29% 54%
Study abroad program offered through a university that is not my home university 14% 18%f 14% 12% 12% 12% 9% 0%
Volunteer/ Service learning program 12% 9% 10% 19%abd 11% 15% 10% 15%
Overseas internship 10% 8% 7% 12% 18%abe 9% 10% 0%
Direct enrollment with overseas university 9% 13%bd 6% 13%b 7% 10% 12% 0%
Teach abroad program 5% 3% 2% 3% 14%abcde 6%b 4% 8%
Other 1% 0% 0% 1% 0% 2% 0% 0%
25 a/b/c/etc. Indicates a statistically significant difference between subgroups at the 95% confidence level. *Small sample size, use caution in interpretation.
• Students studying in Asia are more likely to have considered an overseas internship, or teach abroad program compared to students studying in other regions, while students studying in Africa are more likely to have considered a volunteer/ service learning program.
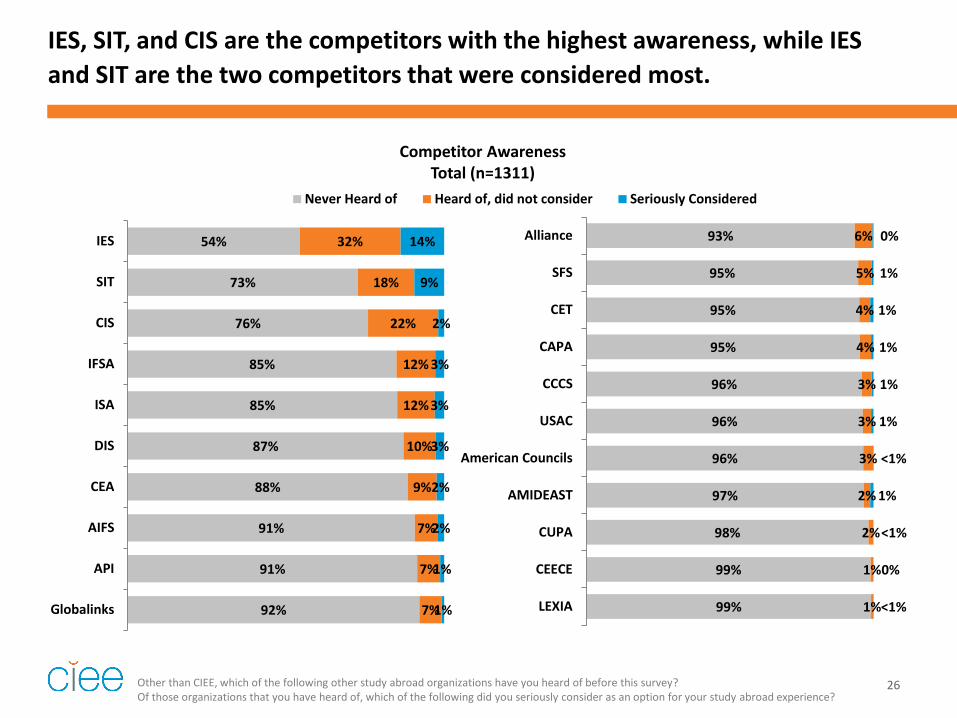
IES, SIT, and CIS are the competitors with the highest awareness, while IES and SIT are the two competitors that were considered most.
26 Other than CIEE, which of the following other study abroad organizations have you heard of before this survey? Of those organizations that you have heard of, which of the following did you seriously consider as an option for your study abroad experience?
54%
73%
76%
85%
85%
87%
88%
91%
91%
92%
32%
18%
22%
12%
12%
10%
9%
7%
7%
7%
14%
9%
2%
3%
3%
3%
2%
2%
1%
1%
IES
SIT
CIS
IFSA
ISA
DIS
CEA
AIFS
API
Globalinks
Competitor Awareness Total (n=1311)
Never Heard of Heard of, did not consider Seriously Considered
93%
95%
95%
95%
96%
96%
96%
97%
98%
99%
99%
6%
5%
4%
4%
3%
3%
3%
2%
2%
1%
1%
0%
1%
1%
1%
1%
1%
<1%
1%
<1%
0%
<1%
Alliance
SFS
CET
CAPA
CCCS
USAC
American Councils
AMIDEAST
CUPA
CEECE
LEXIA

RESOURCES USED
27

The CIEE Study Abroad website is the most commonly used resource for decision making.
28 Which of the following resources did you use when making your decision to study abroad with CIEE? Please select all that apply.
73%
66%
38%
28%
27%
20%
19%
11%
3%
1%
CIEE Study Abroad website
Home university study abroad office
Home university website
CIEE Study Abroad catalog(s)/Brochure(s)
Talked to a CIEE alum
Online Reviews
Study abroad fair(s)
CIEE Study Abroad social media
None of the above
Other
Resources Used Total (n=1311)
Where did you get the catalog? (n=366)
Study Abroad Office/ Advisor 66% Study Abroad Fair 28% Professor/Faculty Member 2% Friend/Classmate 2% Family Member 1% Other 1% I don't remember 11%
How did you find the website? (n=953)
General online search 59% Other 28% I don't remember 9% Advertisement 2% Social Media 1%
Students from top sending schools (20+) are more likely to have used their home university
website (43%), while students from other schools are more likely to have used the CIEE catalogs (33%) and/or the CIEE website (76%).

Most informational resources are used early on, while social media is used later in the decision making process.
7% 3% 3% 5% 2% 6% 8% 9% 6%
7% 14% 7%
23%
33% 16%
41%
5% 7%
10% 11%
20%
18%
21%
19%
19% 23%
31% 39%
38% 29%
45%
22%
63% 60%
42% 38%
16% 15% 11% 10%
Study abroadfair(s)
(n=252)
Homeuniversitywebsite(n=502)
Homeuniversity
study abroadoffice (n=867)
CIEE StudyAbroad
catalog(s)/Brochure(s)
(n=366)
CIEE StudyAbroadwebsite(n=953)
Talked to aCIEE alum(n=358)
OnlineReviews(n=262)
CIEE StudyAbroad social
media(n=143)
Point in Decision Making Process that Resources were Used Most
First starting to think aboutstudying abroad
Starting to narrow down myoptions
Already knew I wanted to studywith CIEE, but wasn't sure whichprogramAlready applied to specific CIEEprogram
Not Sure
29 Please choose the option that best describes the point in your decision making process that you used the following resource(s) the most.

Students found talking to an alum and the CIEE Study Abroad website to be the most useful resources.
30 Please tell us how useful you found each the following resource(s).
1% 1% 1% 2% 2% 5% 4% 2% 0% 4% 4% 1% 3% 4% 9%
17% 19%
29%
44% 51% 51% 55% 56%
82% 81%
66%
50% 46% 41% 36% 34%
Talked to aCIEE alum(n=358)
CIEE StudyAbroadwebsite(n=953)
Homeuniversity
study abroadoffice (n=867)
Homeuniversitywebsite(n=502)
CIEE StudyAbroad
catalog(s)/Brochure(s)
(n=366)
OnlineReviews(n=262)
CIEE StudyAbroad social
media(n=143)
Study abroadfair(s) (n=252)
Usefulness of Resources
Very Useful
Somewhat Useful
Not At All Useful
Not Sure
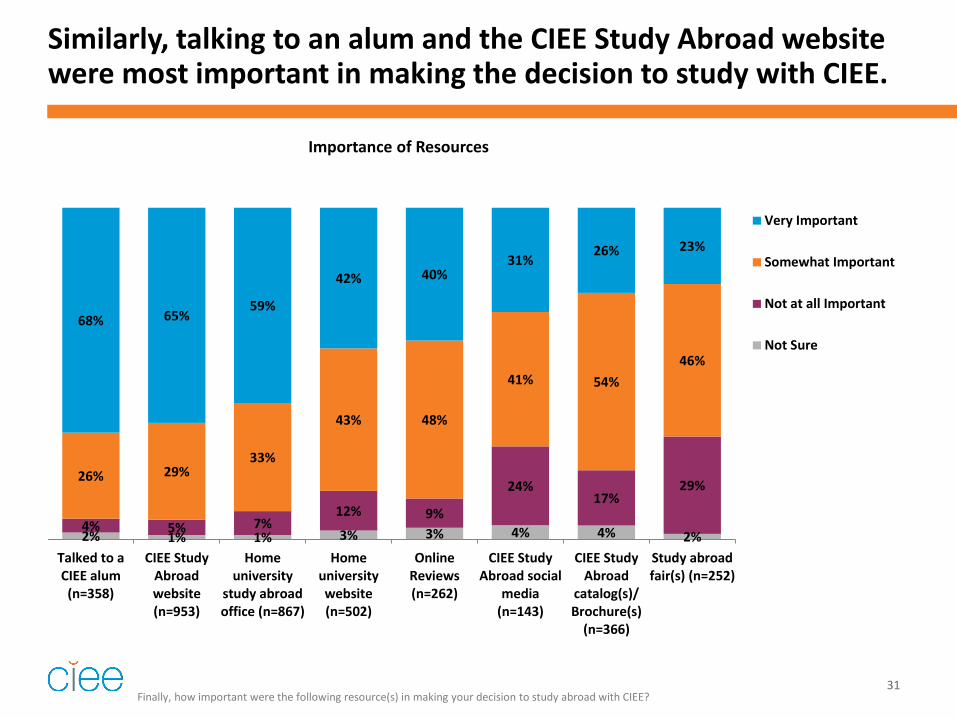
Similarly, talking to an alum and the CIEE Study Abroad website were most important in making the decision to study with CIEE.
31 Finally, how important were the following resource(s) in making your decision to study abroad with CIEE?
2% 1% 1% 3% 3% 4% 4% 2% 4% 5% 7%
12% 9%
24% 17%
29% 26% 29%
33%
43% 48%
41% 54% 46%
68% 65% 59%
42% 40% 31%
26% 23%
Talked to aCIEE alum(n=358)
CIEE StudyAbroadwebsite(n=953)
Homeuniversity
study abroadoffice (n=867)
Homeuniversitywebsite(n=502)
OnlineReviews(n=262)
CIEE StudyAbroad social
media(n=143)
CIEE StudyAbroad
catalog(s)/Brochure(s)
(n=366)
Study abroadfair(s) (n=252)
Importance of Resources
Very Important
Somewhat Important
Not at all Important
Not Sure

Importance of Resources- Segment Analysis
32 *Base= used the resource.
Top 2 Box Importance (Very/Somewhat) Total
Gender Race/ Ethnicity Family HH Income Past International Travel
Male Female All other Races White Less than
$45K $45K to $74.9K
$75Kor higher None 1 to 4 5+
CIEE Study Abroad website 94% 94% 94% 95% 94% 95% 95% 96% 98% 93% 94%
Talked to a CIEE alum 94% 92% 95% 90% 95% 94% 94% 94% 92% 93% 95%
Home university study abroad office 92% 94% 91% 93% 91% 93% 93% 93% 94% 90% 92%
Online Reviews 88% 89% 87% 91% 86% 90% 94% 88% 93% 83% 92%
Home university website 85% 87% 85% 89% 85% 91% 83% 85% 97% 82% 87%
CIEE Study Abroad catalog(s)/ Brochure(s) 80% 83% 79% 79% 79% 75% 85% 82% 85% 81% 75%
CIEE Study Abroad social media 72% 73% 71% 82% 70% 85% 78% 73% 77% 68% 75%
Study abroad fair(s) 69% 79% 67% 73% 68% 72% 66% 66% 72% 70% 67%
• While there is some top 2 box variation, due to small sample sizes, there is no significant subgroup difference in the importance of the various resources.

MEDIA USE PROFILE
33

Students spend the most time participating in online media activities.
34 Approximately how many hours do you spend each week doing the following activities?
3% 5% 12% 13% 19%
41% 46%
25% 31%
28% 21%
52%
33%
38%
34%
33% 33%
25%
21% 18% 12%
28% 22%
21%
25%
7% 7% 3% 10% 9% 6% 15%
1% 1% 1%
Browsing/interacting onsocial media(Facebook,
Twitter, etc.)
General online/surfing websites
Streaming OnlineVideos/ TV/
Movies (Hulu,Netflix, etc.)
Listening toonline radio
(Spotify,Pandora, etc.)
Reading NewsOnline (NPR,
CNN, Fox News,etc.)
Watching TV(Network, Cable)
ReadingMagazines
(Online, Print)
Weekly Media Use
10 or more hours
5-9 hours
3-4 hours
1-2 hours
None

Nearly all use Facebook regularly, and two-thirds use Instagram.
35 Which of the following social media sites do you use regularly? Select all that apply. Which of the following online streaming sites do you use regularly? Select all that apply.
96%
67%
62%
35%
24%
23%
16%
5%
4%
YouTube
Tumblr
Google Plus
Other
Social Media Sites
Total (n=1269)
84%
75%
34%
14%
10%
5%
Netflix
YouTube
iTunes
Hulu Plus
Amazon instant video
Other
Online Streaming Sites
Total (n=1158)
Others include: Snapchat
Soundcloud Timehop
Wordpress Vine
Others include: HBO Go Xfinity
Hulu (Not Plus)
APPENDIX
36

Respondent Profile- School Location
37
N % MA 147 11% PA 139 11% CA 122 9% IN 90 7% NY 88 7% WI 86 7% MN 67 5% DC 55 4% CO 48 4% OH 47 4% MI 35 3% NC 32 2% OR 31 2% IL 31 2% TX 29 2% RI 27 2% TN 21 2% IA 21 2% WA 19 1% CT 18 1% MD 17 1%
N % ME 17 1% SC 16 1% VA 15 1% GA 15 1% VT 11 1% LA 10 1% OK 9 1% NJ 7 1% NA 7 1% MO 7 1% AZ 5 0% NH 3 0% KY 3 0% FL 3 0% International 2 0% NE 1 0% HI 1 0% UT 1 0% AK 1 0% AL 1 0% MS 1 0%

Respondent Profile- Program Location
38
N % Southern Europe 449 34%
Spain 406 31% France 31 2% Portugal 6 <1% Italy 6 <1%
Northern Europe 266 20% Czech Republic 85 6% Netherlands 41 3% Belgium 32 2% Germany 23 2% Ireland 23 2% Hungary 19 1% Russia 19 1% England 11 1% Sweden 8 1% Poland 3 <1% Northern Ireland 2 <1%
Asia 195 15% China 66 5% Japan 48 4% South Korea 43 3% Thailand 19 1% Taiwan 17 1% India 2 <1%
N % Latin America 172 13%
Brazil 43 3% Chile 38 3% Dominican Republic 37 3% Costa Rica 21 2% Argentina 18 1% Peru 6 <1% Mexico 5 <1% Bonaire 4 <1%
Africa 147 11% South Africa 114 9% Botswana 11 1% Senegal 9 1% Tanzania 8 1% Ghana 5 <1%
MENA 69 5% Jordan 44 3% Turkey 8 1% Morocco 8 1% United Arab Emirates 6 <1% Israel 3 <1%
Australia + NZ 13 1% Australia 13 1%
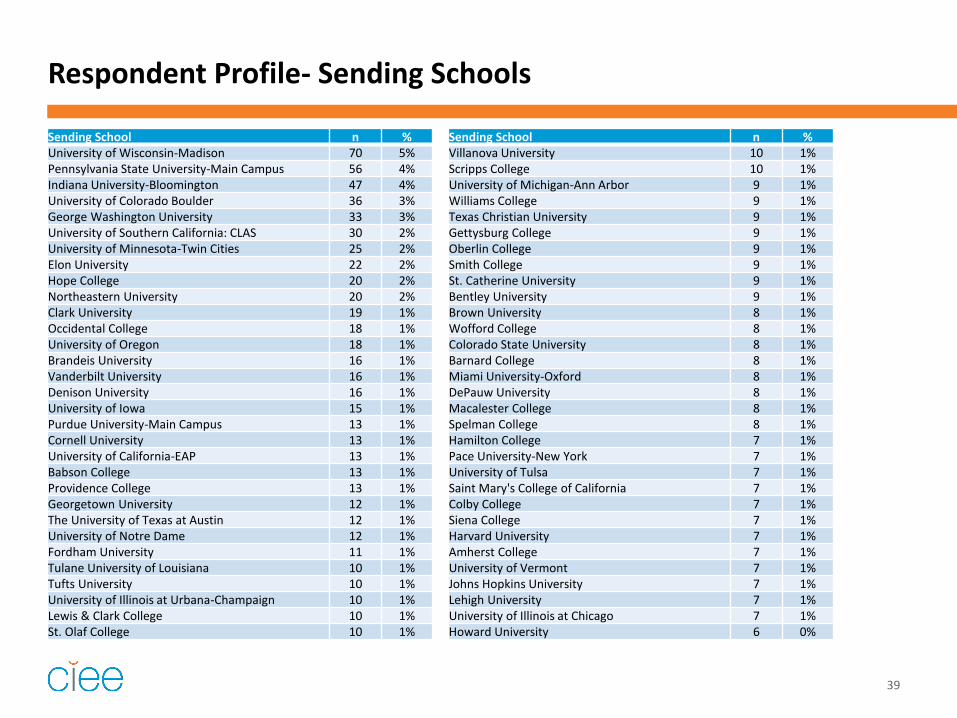
Respondent Profile- Sending Schools
Sending School n % University of Wisconsin-Madison 70 5% Pennsylvania State University-Main Campus 56 4% Indiana University-Bloomington 47 4% University of Colorado Boulder 36 3% George Washington University 33 3% University of Southern California: CLAS 30 2% University of Minnesota-Twin Cities 25 2% Elon University 22 2% Hope College 20 2% Northeastern University 20 2% Clark University 19 1% Occidental College 18 1% University of Oregon 18 1% Brandeis University 16 1% Vanderbilt University 16 1% Denison University 16 1% University of Iowa 15 1% Purdue University-Main Campus 13 1% Cornell University 13 1% University of California-EAP 13 1% Babson College 13 1% Providence College 13 1% Georgetown University 12 1% The University of Texas at Austin 12 1% University of Notre Dame 12 1% Fordham University 11 1% Tulane University of Louisiana 10 1% Tufts University 10 1% University of Illinois at Urbana-Champaign 10 1% Lewis & Clark College 10 1% St. Olaf College 10 1%
39
Sending School n % Villanova University 10 1% Scripps College 10 1% University of Michigan-Ann Arbor 9 1% Williams College 9 1% Texas Christian University 9 1% Gettysburg College 9 1% Oberlin College 9 1% Smith College 9 1% St. Catherine University 9 1% Bentley University 9 1% Brown University 8 1% Wofford College 8 1% Colorado State University 8 1% Barnard College 8 1% Miami University-Oxford 8 1% DePauw University 8 1% Macalester College 8 1% Spelman College 8 1% Hamilton College 7 1% Pace University-New York 7 1% University of Tulsa 7 1% Saint Mary's College of California 7 1% Colby College 7 1% Siena College 7 1% Harvard University 7 1% Amherst College 7 1% University of Vermont 7 1% Johns Hopkins University 7 1% Lehigh University 7 1% University of Illinois at Chicago 7 1% Howard University 6 0%

Respondent Profile- Sending Schools (continued)
Sending School n % Wellesley College 6 0% University of Wisconsin-Milwaukee 6 0% Skidmore College 6 0% University of Southern California: Annenberg 6 0% Wheaton College (IL) 6 0% University of Massachusetts Amherst 6 0% University of Washington-Seattle Campus 6 0% Bucknell University 5 0% Rochester Institute of Technology 5 0% University of Virginia-Main Campus 5 0% United States Naval Academy 5 0% Bates College 5 0% Rutgers University-New Brunswick 5 0% Susquehanna University 5 0% University of Pittsburgh-Pittsburgh Campus 5 0% University of Redlands 5 0% Soka University of America 5 0% Claremont McKenna College 5 0% University of Missouri-Columbia 5 0% Kenyon College 5 0% Carnegie Mellon University 5 0% University of Maryland-College Park 5 0% University of Pennsylvania 4 0% Belmont University 4 0% Bethel University (MN) 4 0% University of Richmond 4 0% Columbia University in the City of New York 4 0% University of Scranton 4 0% Haverford College 4 0% University of South Carolina-Columbia 4 0% Gustavus Adolphus College 4 0%
40
Sending School n % College of William and Mary 4 0% Hobart William Smith Colleges 4 0% Harvey Mudd College 4 0% Carthage College 4 0% University of St. Thomas (MN) 4 0% Wesleyan University 4 0% Roger Williams University 4 0% Earlham College 4 0% Gordon College 4 0% Pomona College 4 0% Temple University 3 0% Beloit College 3 0% Mills College 3 0% University of Rochester 3 0% Ursinus College 3 0% Sacred Heart University 3 0% Wake Forest University 3 0% Oakland University 3 0% Muhlenberg College 3 0% Keene State College 3 0% Marist College 3 0% Dickinson College 3 0% Allegheny College 3 0% Agnes Scott College 3 0% Wabash College 3 0% Ohio Wesleyan University 3 0% Rice University 3 0% University of La Verne 3 0% Trinity College 3 0% Bowdoin College 3 0% Arizona State University 3 0%

Respondent Profile- Sending Schools (continued)
Sending School n % American University 3 0% Ohio University-Main Campus 3 0% Illinois Wesleyan University 2 0% Northern Michigan University 2 0% Bryant University 2 0% Pacific Lutheran University 2 0% Whitman College 2 0% Philadelphia University 2 0% Lafayette College 2 0% Portland State University 2 0% University of Wisconsin-La Crosse 2 0% Framingham State University 2 0% Washington and Lee University 2 0% Quinnipiac University 2 0% Bradley University 2 0% Ramapo College of New Jersey 2 0% University of Hartford 2 0% Santa Clara University 2 0% University of Puget Sound 2 0% Gonzaga University 2 0% Augsburg College 2 0% Grinnell College 2 0% New York University 2 0% Southwestern University 2 0% Northwestern University 2 0% Boston University 2 0% Washington State University 2 0% University of Arizona 2 0% Eckerd College 2 0% University of California-Berkeley 2 0% University of Connecticut 2 0%
41
Sending School n % Meredith College 1 0% Saint Joseph's College of Maine 1 0% Georgia State University 1 0% Grove City College 1 0% Davidson College 1 0% Birmingham Southern College 1 0% Saint Michael's College 1 0% St. Lawrence University 1 0% Western Washington University 1 0% Boston College 1 0% University of Northern Colorado 1 0% Stonehill College 1 0% Delaware Valley College 1 0% SUNY College of Environmental Science and Forestry 1 0% Saint Mary's College 1 0% Hamline University 1 0% Utah Valley University 1 0% Swarthmore College 1 0% Washington University in St Louis 1 0% Clemson University 1 0% Winthrop University 1 0% Texas A & M University 1 0% University of New Haven 1 0% Regis University 1 0% University of Oklahoma Norman Campus 1 0% The College of Wooster 1 0% Saint Martin's University 1 0% The Evergreen State College 1 0% Bennington College 1 0% The University of Tennessee 1 0% Middlebury College 1 0%
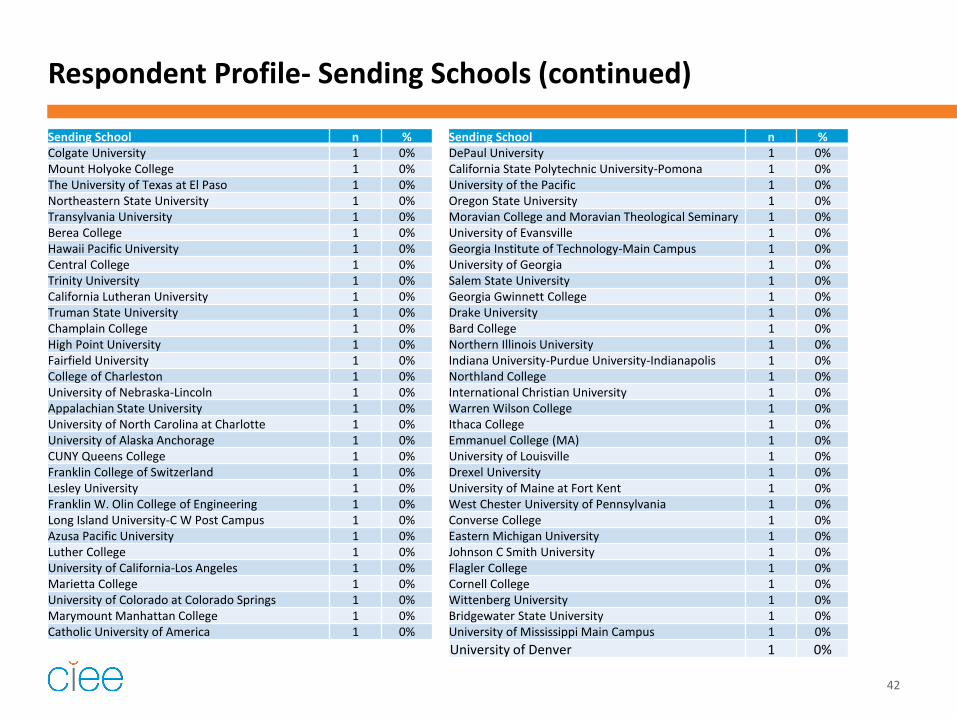
Respondent Profile- Sending Schools (continued)
Sending School n % Colgate University 1 0% Mount Holyoke College 1 0% The University of Texas at El Paso 1 0% Northeastern State University 1 0% Transylvania University 1 0% Berea College 1 0% Hawaii Pacific University 1 0% Central College 1 0% Trinity University 1 0% California Lutheran University 1 0% Truman State University 1 0% Champlain College 1 0% High Point University 1 0% Fairfield University 1 0% College of Charleston 1 0% University of Nebraska-Lincoln 1 0% Appalachian State University 1 0% University of North Carolina at Charlotte 1 0% University of Alaska Anchorage 1 0% CUNY Queens College 1 0% Franklin College of Switzerland 1 0% Lesley University 1 0% Franklin W. Olin College of Engineering 1 0% Long Island University-C W Post Campus 1 0% Azusa Pacific University 1 0% Luther College 1 0% University of California-Los Angeles 1 0% Marietta College 1 0% University of Colorado at Colorado Springs 1 0% Marymount Manhattan College 1 0% Catholic University of America 1 0%
42
Sending School n % DePaul University 1 0% California State Polytechnic University-Pomona 1 0% University of the Pacific 1 0% Oregon State University 1 0% Moravian College and Moravian Theological Seminary 1 0% University of Evansville 1 0% Georgia Institute of Technology-Main Campus 1 0% University of Georgia 1 0% Salem State University 1 0% Georgia Gwinnett College 1 0% Drake University 1 0% Bard College 1 0% Northern Illinois University 1 0% Indiana University-Purdue University-Indianapolis 1 0% Northland College 1 0% International Christian University 1 0% Warren Wilson College 1 0% Ithaca College 1 0% Emmanuel College (MA) 1 0% University of Louisville 1 0% Drexel University 1 0% University of Maine at Fort Kent 1 0% West Chester University of Pennsylvania 1 0% Converse College 1 0% Eastern Michigan University 1 0% Johnson C Smith University 1 0% Flagler College 1 0% Cornell College 1 0% Wittenberg University 1 0% Bridgewater State University 1 0% University of Mississippi Main Campus 1 0% University of Denver 1 0%
ciee.org
Founded in 1947, CIEE is the world leader in international education and exchange, delivering the highest quality programs that increase global understanding and intercultural knowledge. We provide participants with skills, competencies, and experiences that elevate their ability to contribute positively to our global community.
Council on International Educational Exchange 300 Fore Street Portland, ME 04101 207-553-4000
© Copyright CIEE 2014. All Rights Reserved. ciee.org
Founded in 1947, CIEE is the world leader in international education and exchange, delivering the highest quality programs that increase global understanding and intercultural knowledge. We provide participants with skills, competencies, and experiences that elevate their ability to contribute positively to our global community.
Council on International Educational Exchange 300 Fore Street Portland, ME 04101 207-553-4000
© Copyright CIEE 2014. All Rights Reserved.