study designs alain moren, epiconcept, june 2006 source: epiet
TRANSCRIPT

Study designs
Alain Moren, Epiconcept, June 2006Source: EPIET

Cohort study measuring risk
Exposure Total Cases Risk (%) Risk ratio
Exposed 100 40 40% 4
Unexposed 100 10 10% Reference
Total 200 50 25%
Denominator = those present at beginning Usually short duration = outbreak (attack rate)
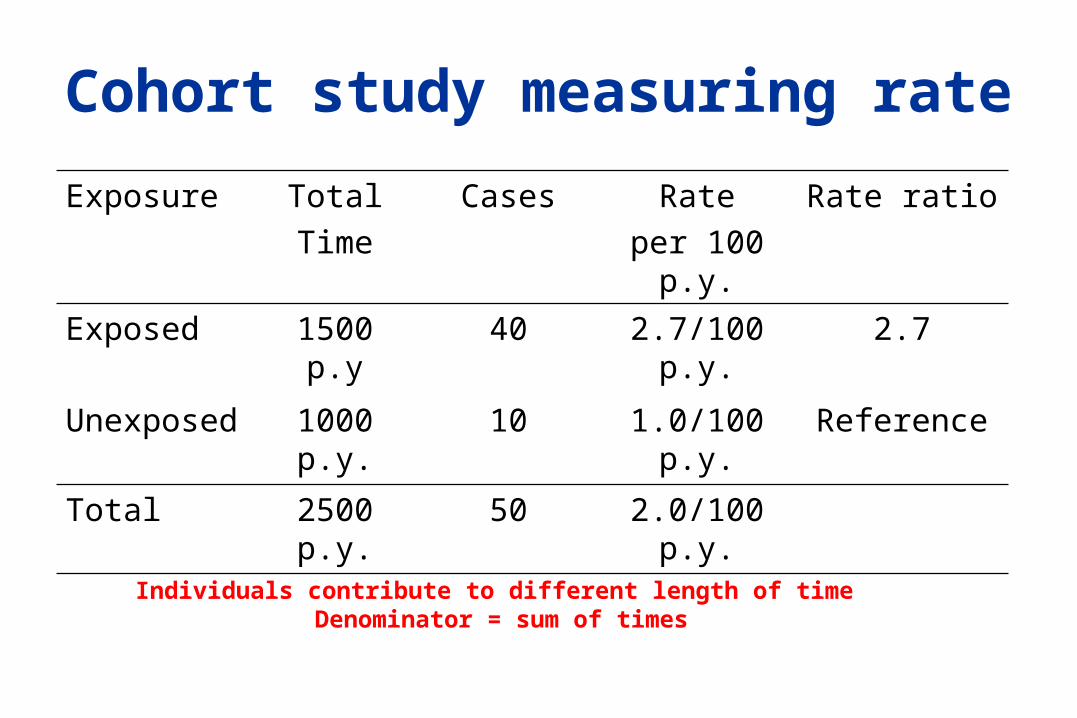
Cohort study measuring rate
Exposure Total
Time
Cases Rate
per 100 p.y.
Rate ratio
Exposed 1500 p.y 40 2.7/100 p.y. 2.7
Unexposed 1000 p.y. 10 1.0/100 p.y. Reference
Total 2500 p.y. 50 2.0/100 p.y.
Individuals contribute to different length of time Denominator = sum of times
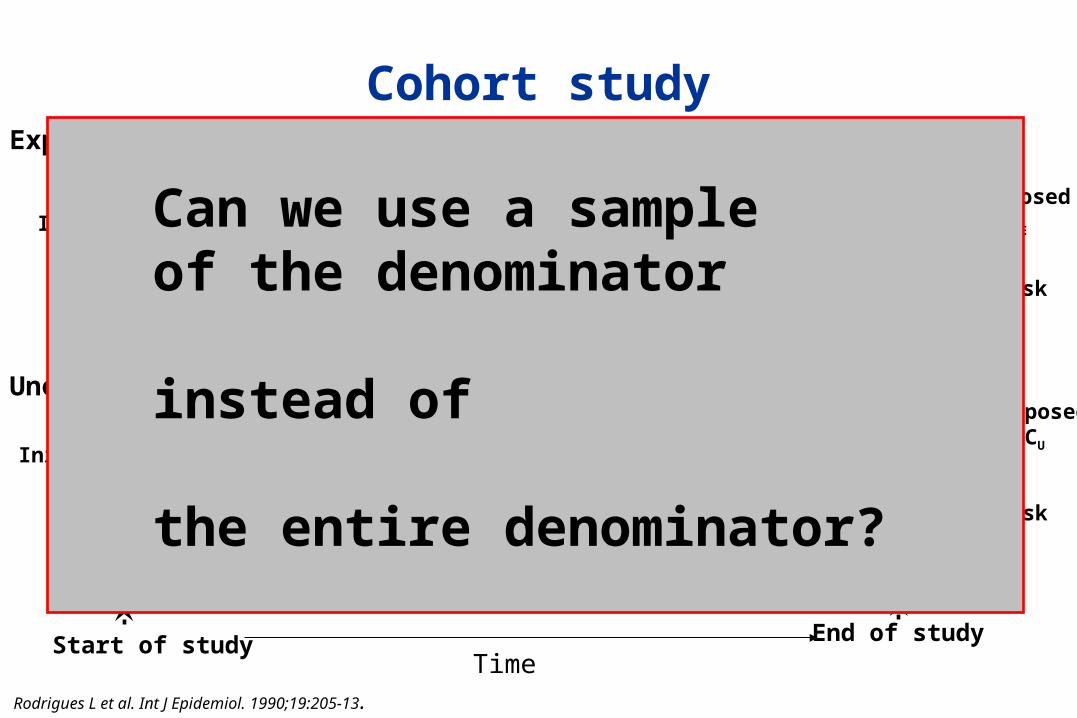
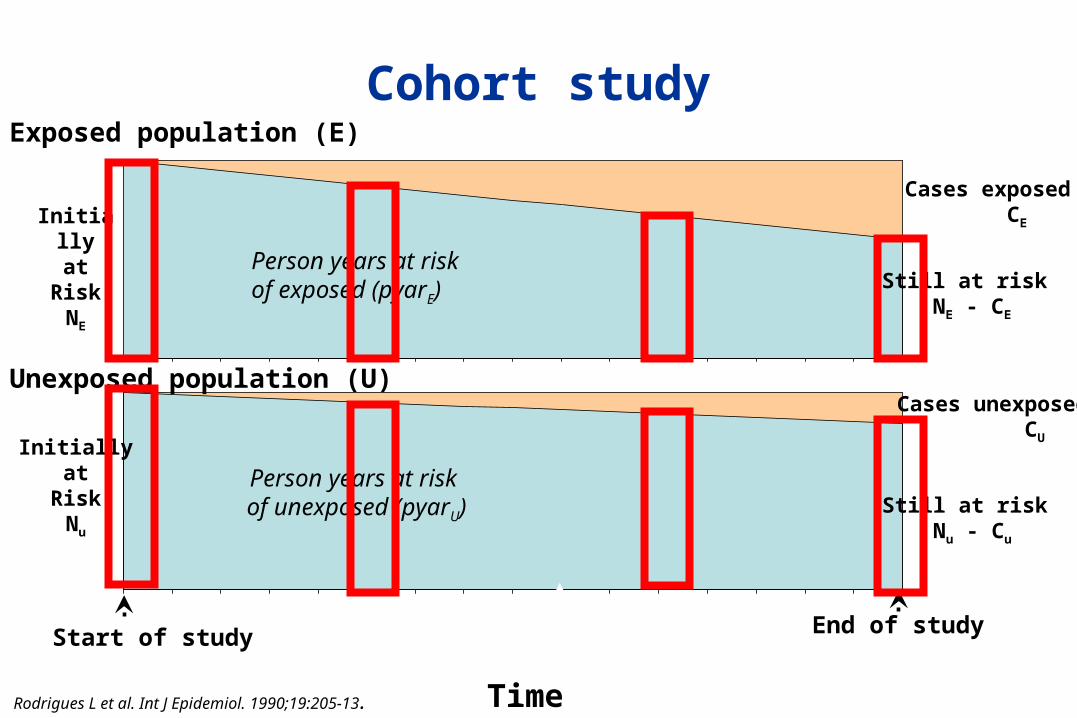
Cohort study
Currently at risk
Cases exposed CE
Start of study End of study
Currently at risk
Person years at riskof exposed (pyarE)
Person years at risk of unexposed (pyarU)
Initiallyat
RiskNE
Initiallyat
RiskNu
Exposed population (E)
Unexposed population (U)Cases unexposed CU
Still at risk NE - CE
Still at risk Nu - Cu
TimeRodrigues L et al. Int J Epidemiol. 1990;19:205-13.
Can we use a sample of the denominator
instead of
the entire denominator?
Cases
E
E
30 10
10 10
E
E
30
10
100
100
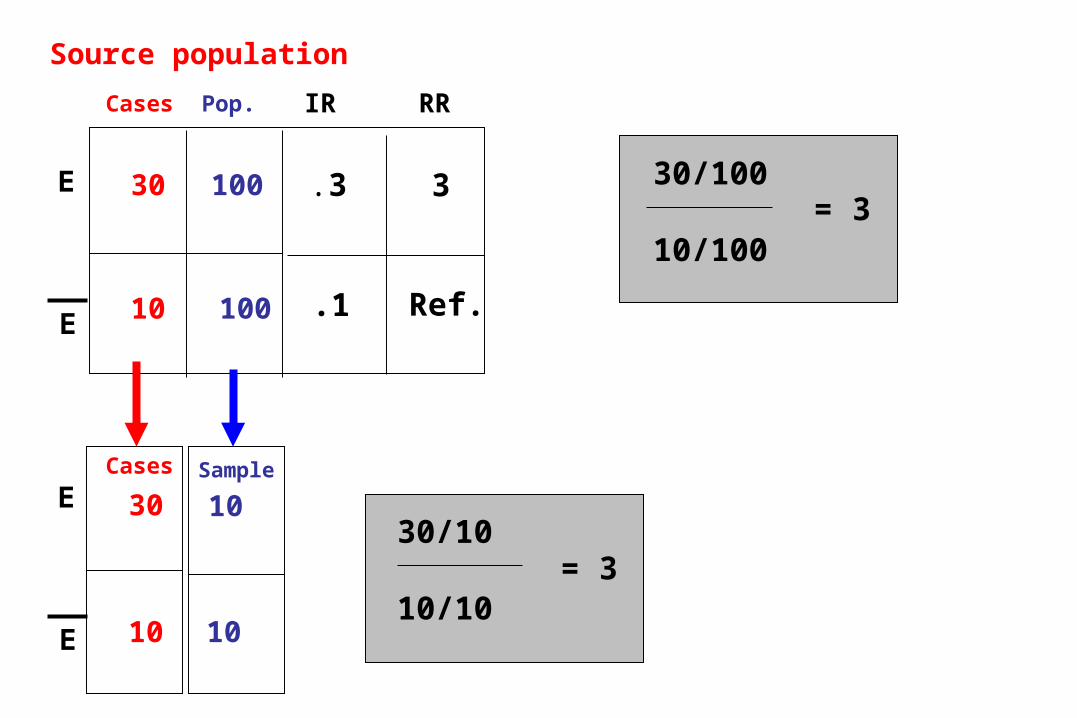
Source population
Pop.Cases
.3
.1
IR RR
3
Ref.
30/100
10/100
30/10
10/10
= 3
= 3
Sample
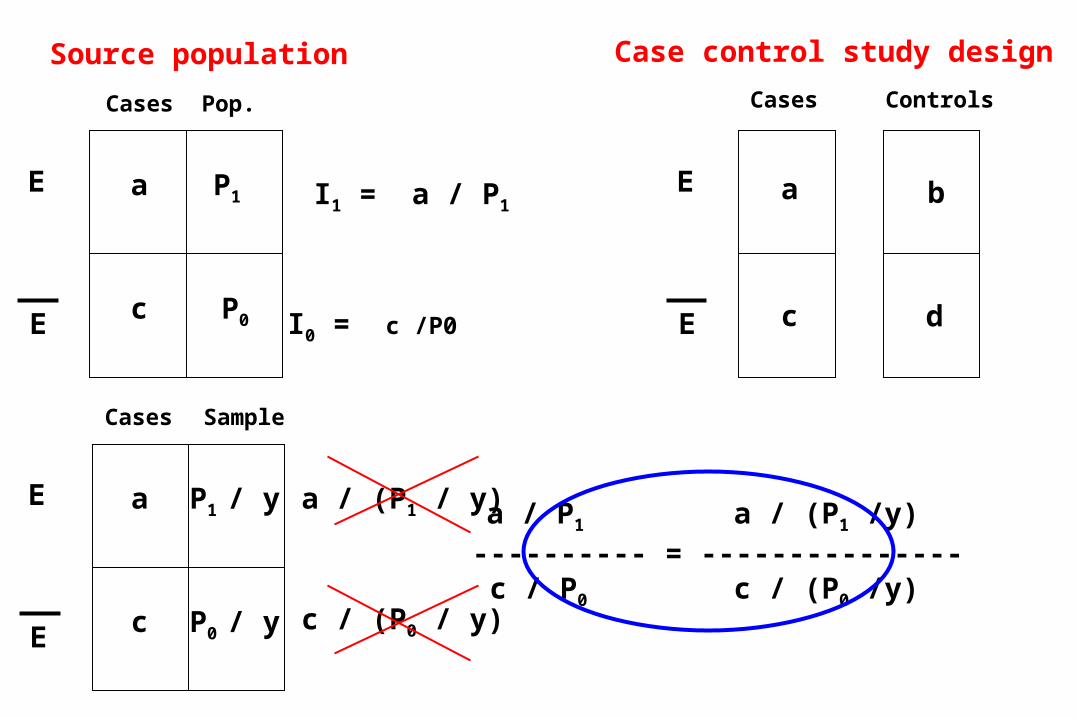
Case control study design
I1 = a / P1
I0 = c /P0
Cases Controls
E
E
a b
c d
E
E
a
c
P1
P0
Source population
Pop.Cases
a / P1 a / (P1 /y)---------- = --------------- c / P0 c / (P0 /y)
E
E
a
c
P1 / y
P0 / y
SampleCases
a / (P1 / y)
c / (P0 / y)

Controls selection
• Controls sampled to mirror the exposure experience in the source population– sampled from source population that gives rise
to cases– representative of exposure in source population
• Sampling independently of exposure status
Cohort study
Currently at risk
Cases exposed CE
Start of study End of study
Currently at risk
Person years at riskof exposed (pyarE)
Occurrence of New case
Person years at risk of unexposed (pyarU)
Initiallyat
RiskNE
Initiallyat
RiskNu
Exposed population (E)
Unexposed population (U)Cases unexposed CU
Still at risk NE - CE
Still at risk Nu - Cu
TimeRodrigues L et al. Int J Epidemiol. 1990;19:205-13.
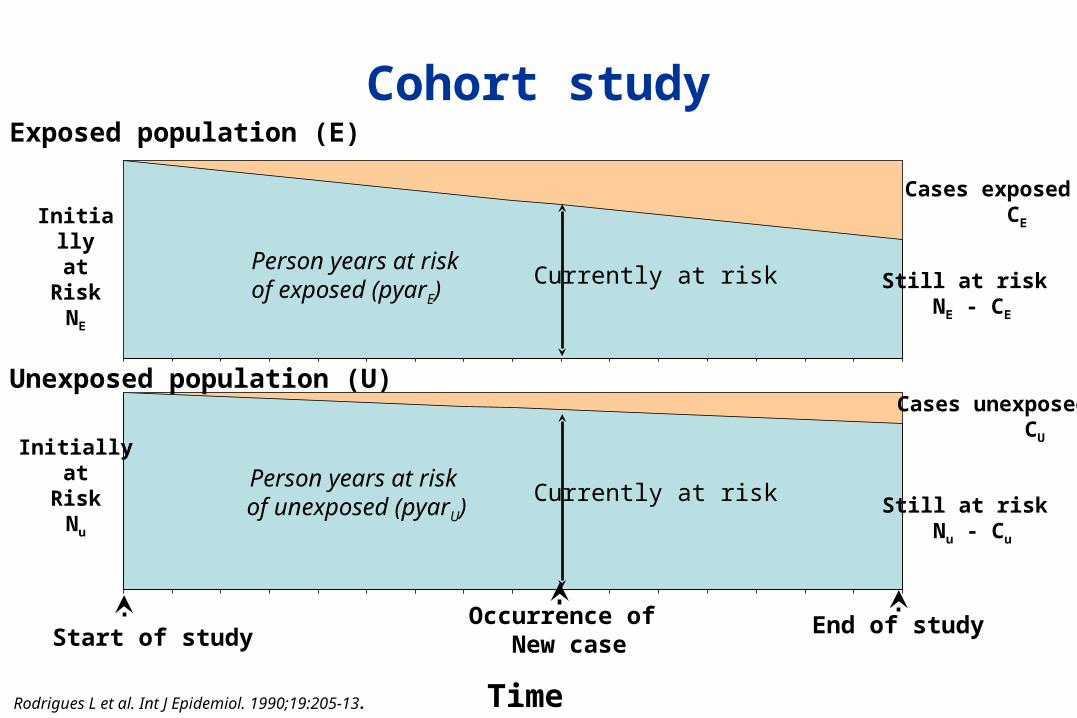
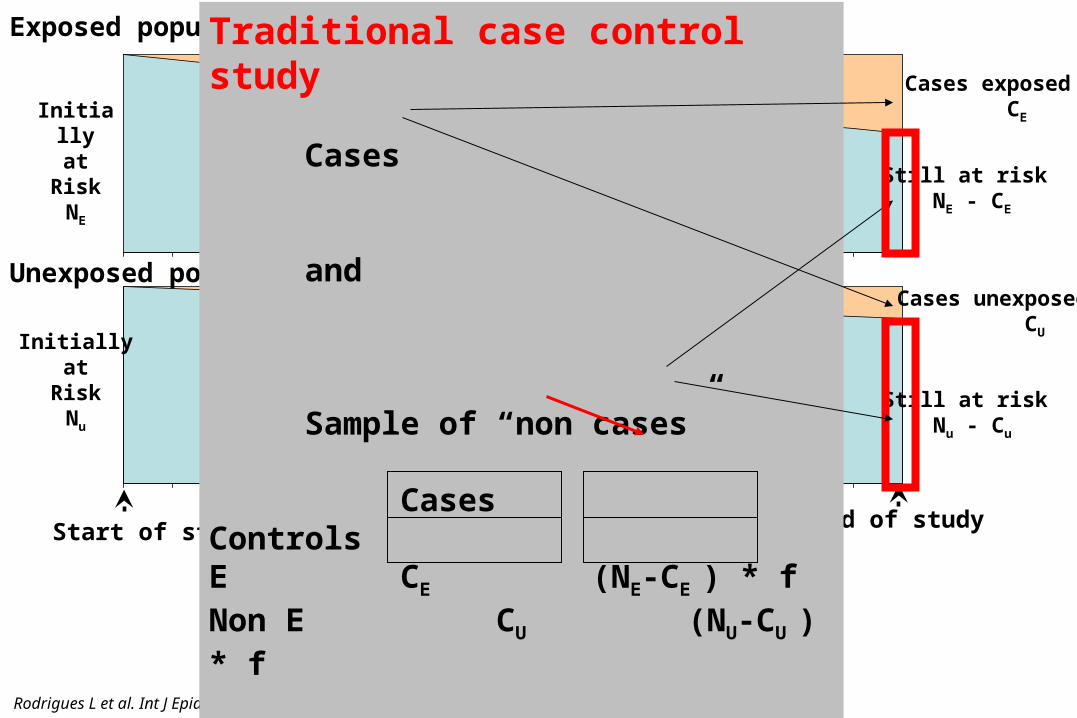
Traditional case control study
Cases
and
Sample of “non cases”
Cases ControlsE CE (NE-CE ) * fNon E CU (NU-CU ) * f
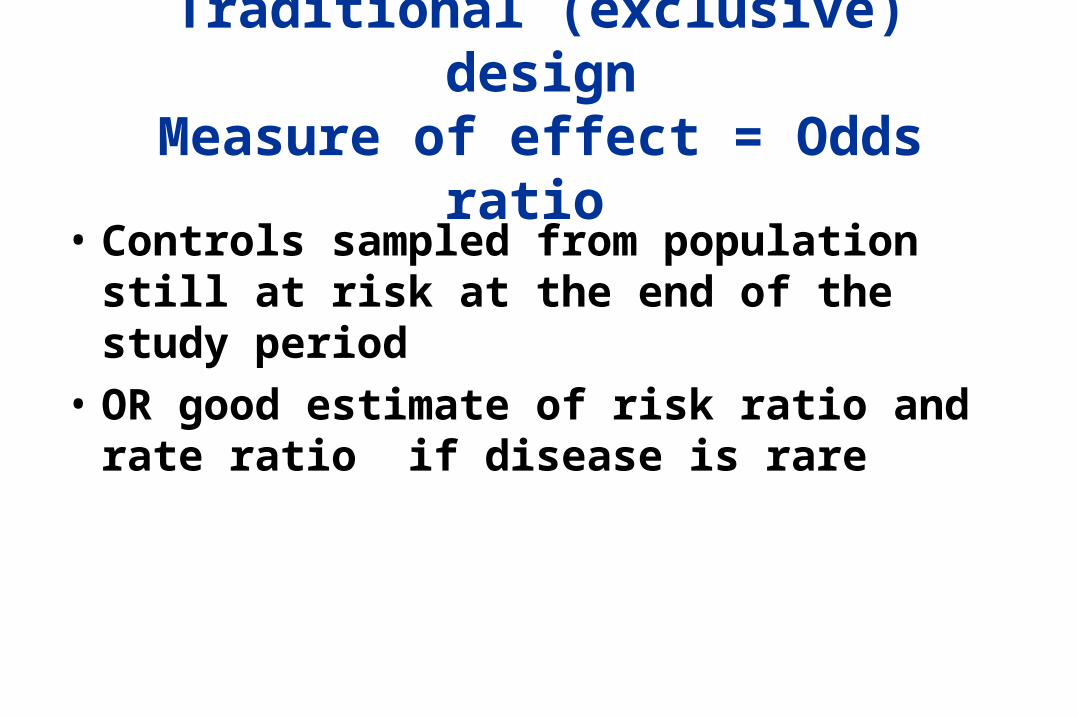
Traditional (exclusive) designMeasure of effect = Odds ratio
• Controls sampled from population still at risk at the end of the study period
• OR good estimate of risk ratio and rate ratio if disease is rare
Cohort study
Currently at risk
Cases exposed CE
Start of study End of study
Currently at risk
Person years at riskof exposed (pyarE)
Occurrence of New case
Person years at risk of unexposed (pyarU)
Initiallyat
RiskNE
Initiallyat
RiskNu
Exposed population (E)
Unexposed population (U)Cases unexposed CU
Still at risk NE - CE
Still at risk Nu - Cu
TimeRodrigues L et al. Int J Epidemiol. 1990;19:205-13.
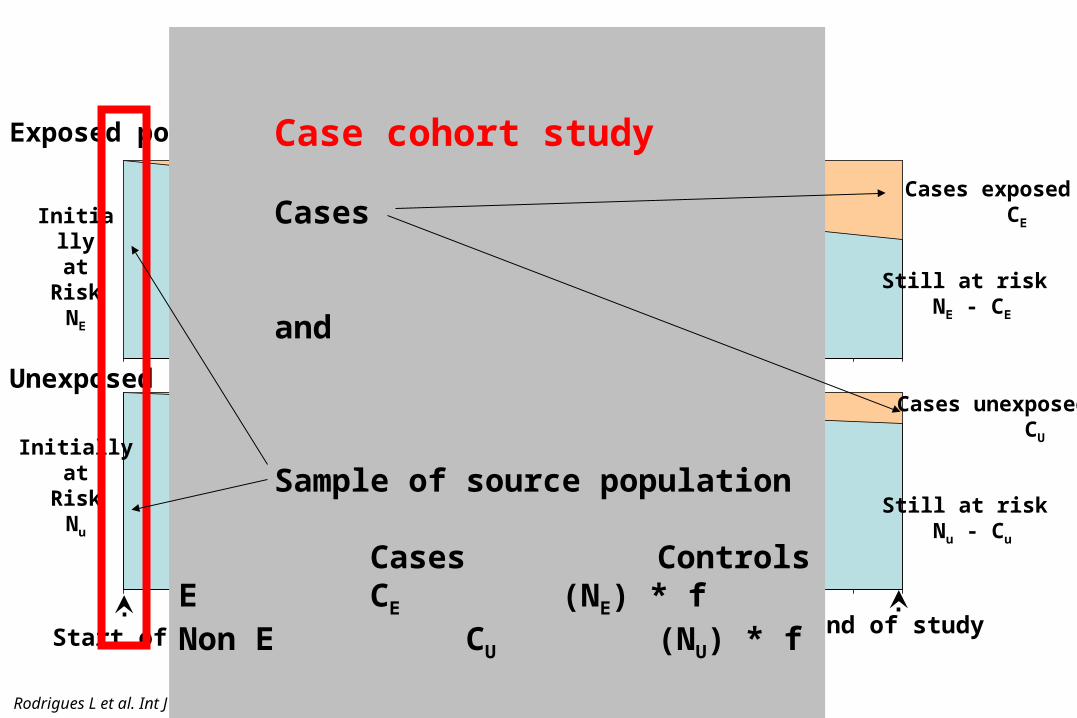
Case cohort study
Cases
and
Sample of source population
Cases ControlsE CE (NE) * fNon E CU (NU) * f
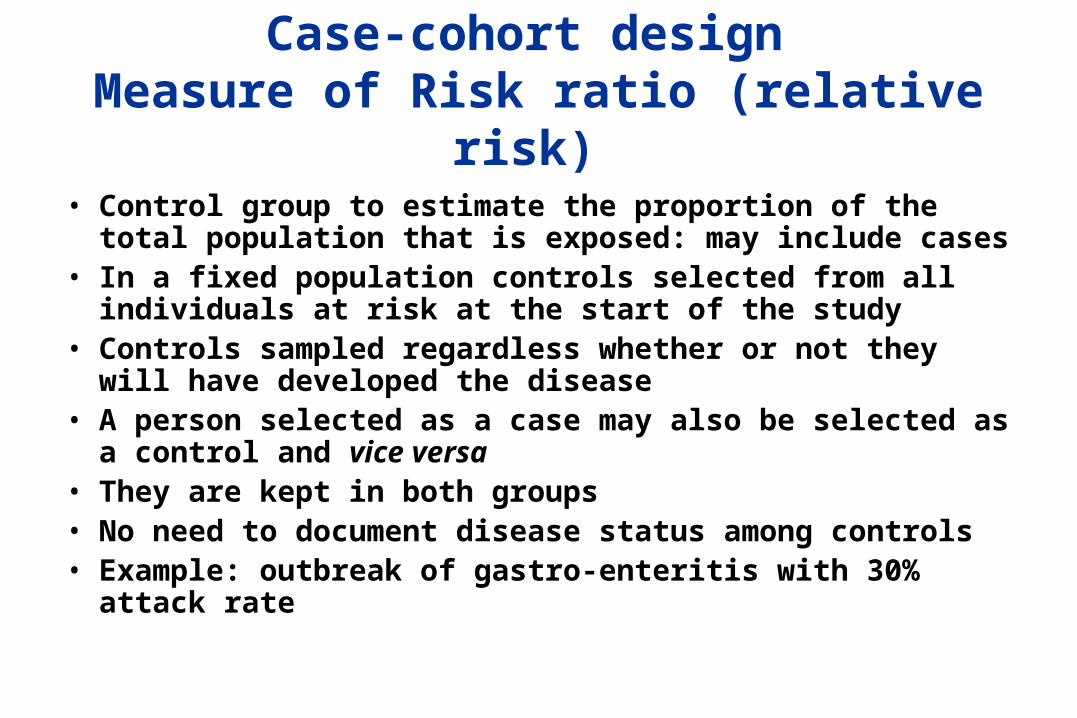
Case-cohort design Measure of Risk ratio (relative risk)
• Control group to estimate the proportion of the total population that is exposed: may include cases
• In a fixed population controls selected from all individuals at risk at the start of the study
• Controls sampled regardless whether or not they will have developed the disease
• A person selected as a case may also be selected as a control and vice versa
• They are kept in both groups• No need to document disease status among controls• Example: outbreak of gastro-enteritis with 30% attack rate
Cohort study
Currently at risk
Cases exposed CE
Start of study End of study
Currently at risk
Person years at riskof exposed (pyarE)
Occurrence of New case
Person years at risk of unexposed (pyarU)
Initiallyat
RiskNE
Initiallyat
RiskNu
Exposed population (E)
Unexposed population (U)Cases unexposed CU
Still at risk NE - CE
Still at risk Nu - Cu
TimeRodrigues L et al. Int J Epidemiol. 1990;19:205-13.
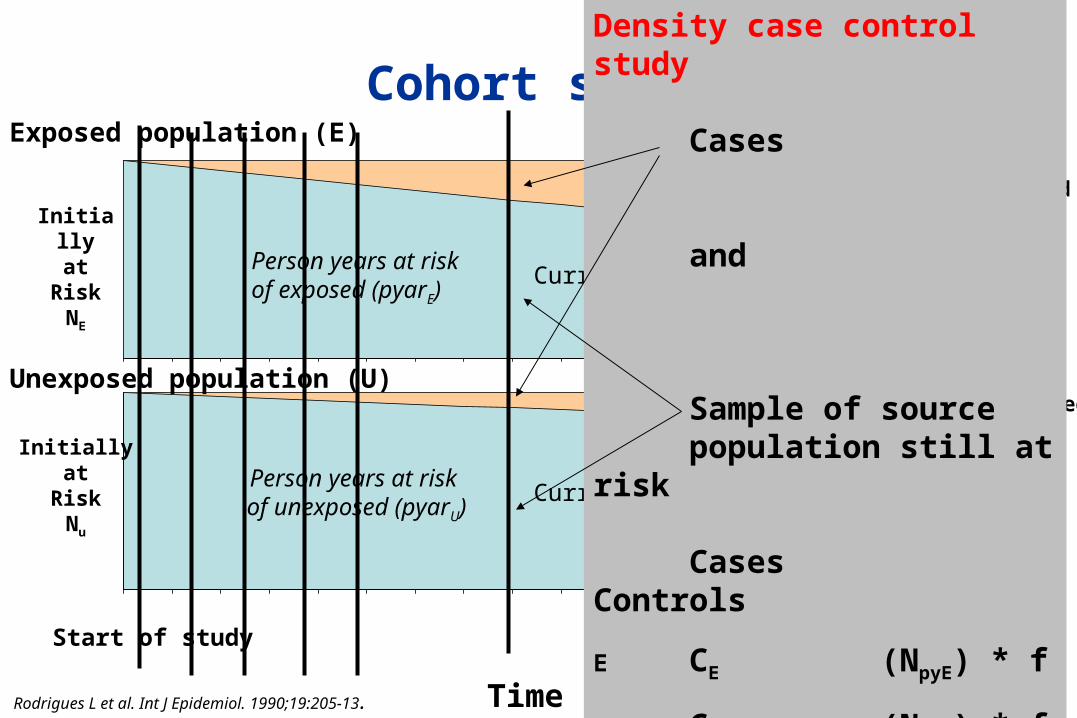
Density case controlstudy
Cases
and
Sample of source population still at risk
Cases Controls
E CE (NpyE) * f
Non E CU (NpyU) * f

Density case control (concurrent) design OR estimates the rate ratio
• Controls are selected concurrently from those still at risk when a case occur
• A person selected as a control can later become a case • The opposite not possible: a case no longer at risk • A control who later becomes a case is kept in both groups• Controls represent person years at risk experience among
exposed and unexposed• Match analysis on time of selection is necessary to give
unbiased estimate of rate ratio
Cohort study
Currently at risk
Cases exposed CE
Start of study End of study
Currently at risk
Person years at riskof exposed (pyarE)
Occurrence of New case
Person years at risk of unexposed (pyarU)
Initiallyat
RiskNE
Initiallyat
RiskNu
Exposed population (E)
Unexposed population (U)Cases unexposed CU
Still at risk NE - CE
Still at risk Nu - Cu
TimeRodrigues L et al. Int J Epidemiol. 1990;19:205-13.
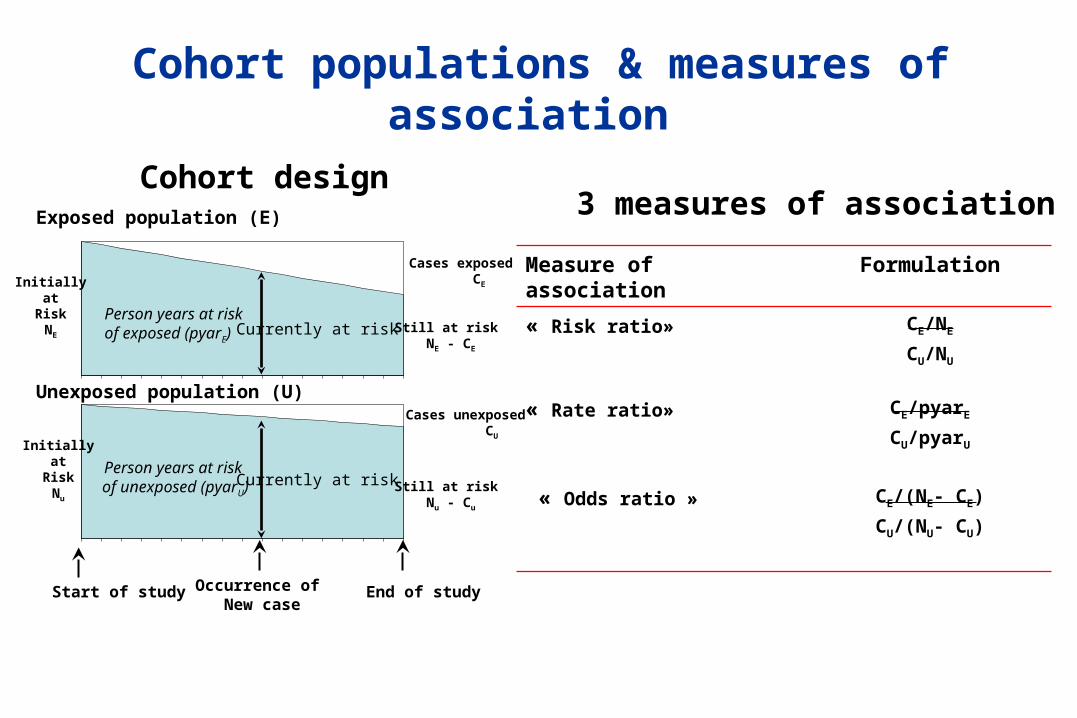
Cohort populations & measures of association
Measure of association Formulation
« Risk ratio» CE/NE
CU/NU
« Rate ratio» CE/pyarE
CU/pyarU
« Odds ratio » CE/(NE- CE)
CU/(NU- CU)
Cohort design3 measures of association
Currently at risk
Cases exposed CE
Start of study End of study
Currently at risk
Person years at riskof exposed (pyarE)
Occurrence of New case
Person years at risk of unexposed (pyarU)
Initiallyat
RiskNE
Initiallyat
RiskNu
Exposed population (E)
Unexposed population (U)Cases unexposed CU
Still at risk NE - CE
Still at risk Nu - Cu

Cohort populations & measures of association
Measure of association Formulation Alternative
formulation
« Risk ratio» CE/NE
CU/NU
CE/CU
NE/NU
« Rate ratio» CE/pyarE
CU/pyarU
CE/CU
pyarE/pyarU
« Odds ratio » CE/(NE- CE)
CU/(NU- CU)
CE/CU
(NE- CE) /(NU- CU)
Measures of association
Currently at risk
Cases exposed CE
Start of study End of study
Currently at risk
Person years at riskof exposed (pyarE)
Occurrence of New case
Person years at risk of unexposed (pyarU)
Initiallyat
RiskNE
Initiallyat
RiskNu
Exposed population (E)
Unexposed population (U)Cases unexposed CU
Still at risk NE - CE
Still at risk Nu - Cu
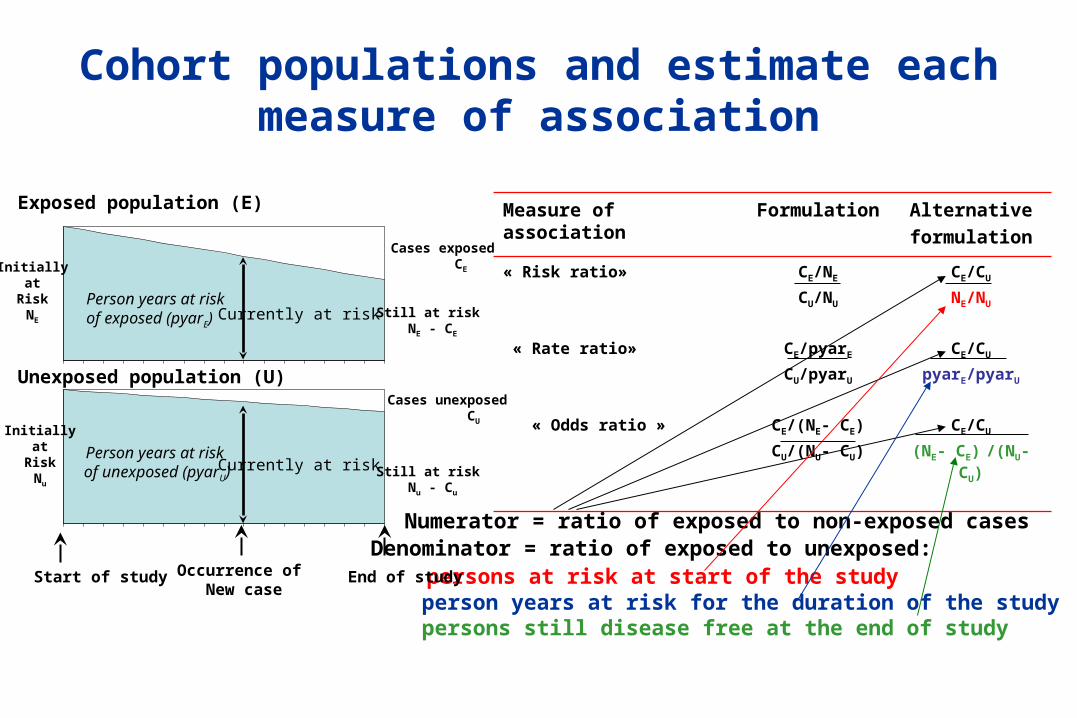
Cohort populations and estimate each measure of association
Measure of association Formulation Alternative
formulation
« Risk ratio» CE/NE
CU/NU
CE/CU
NE/NU
« Rate ratio» CE/pyarE
CU/pyarU
CE/CU
pyarE/pyarU
« Odds ratio » CE/(NE- CE)
CU/(NU- CU)
CE/CU
(NE- CE) /(NU- CU)
Numerator = ratio of exposed to non-exposed cases Denominator = ratio of exposed to unexposed: persons at risk at start of the study person years at risk for the duration of the study persons still disease free at the end of study
Currently at risk
Cases exposed CE
Start of study End of study
Currently at risk
Person years at riskof exposed (pyarE)
Occurrence of New case
Person years at risk of unexposed (pyarU)
Initiallyat
RiskNE
Initiallyat
RiskNu
Exposed population (E)
Unexposed population (U)Cases unexposed CU
Still at risk NE - CE
Still at risk Nu - Cu
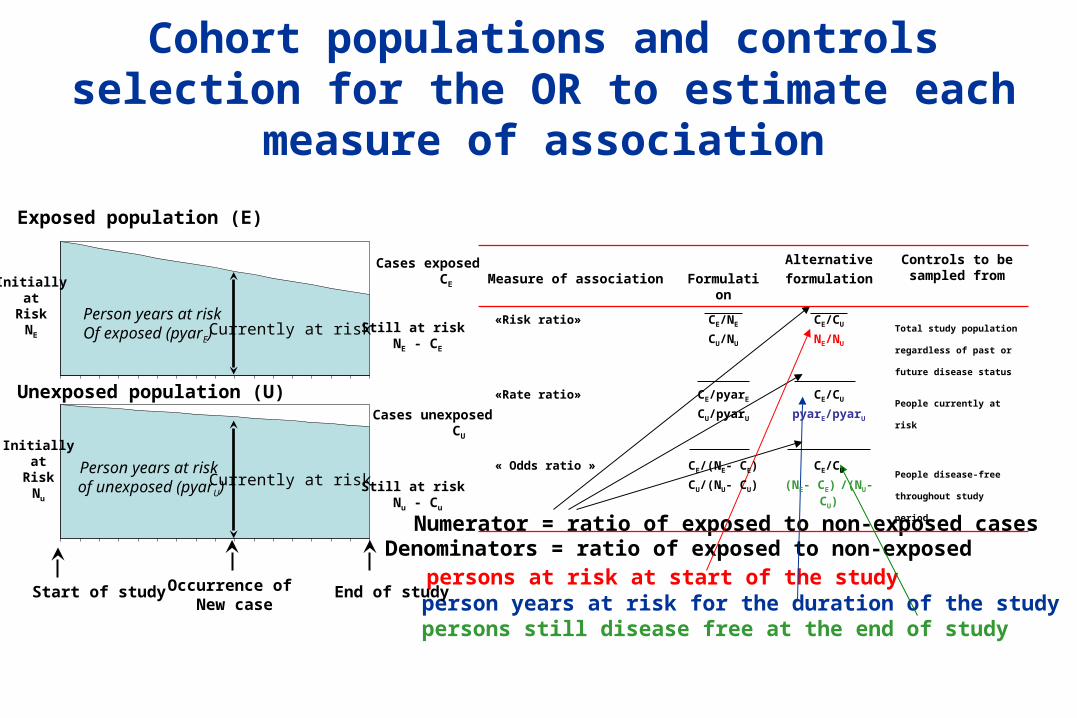
Cohort populations and controls selection for the OR to estimate each measure of association
Numerator = ratio of exposed to non-exposed cases Denominators = ratio of exposed to non-exposed persons at risk at start of the study person years at risk for the duration of the study persons still disease free at the end of study
Measure of association Formulation
Alternative
formulation
Controls to be sampled from
«Risk ratio» CE/NE
CU/NU
CE/CU
NE/NU
Total study population
regardless of past or future
disease status
«Rate ratio» CE/pyarE
CU/pyarU
CE/CU
pyarE/pyarU
People currently at risk
« Odds ratio » CE/(NE- CE)
CU/(NU- CU)
CE/CU
(NE- CE) /(NU- CU)People disease-free
throughout study period
Currently at risk
Cases exposed CE
Start of study End of study
Currently at risk
Person years at riskOf exposed (pyarE)
Occurrence of New case
Person years at risk of unexposed (pyarU)
Initiallyat
RiskNE
Initiallyat
RiskNu
Exposed population (E)
Unexposed population (U)Cases unexposed CU
Still at risk NE - CE
Still at risk Nu - Cu

How to select controls to estimate the respective measure of association
Measure of association Formulation
Alternative
formulation
Controls to be sampled from
«Risk ratio» CE/NE
CU/NU
CE/CU
NE/NU
Total study population
regardless of past or future
disease status
«Rate ratio» CE/pyarE
CU/pyarU
CE/CU
pyarE/pyarU
People currently at risk
« Odds ratio » CE/(NE- CE)
CU/(NU- CU)
CE/CU
(NE- CE) /(NU- CU)People disease-free
throughout study period
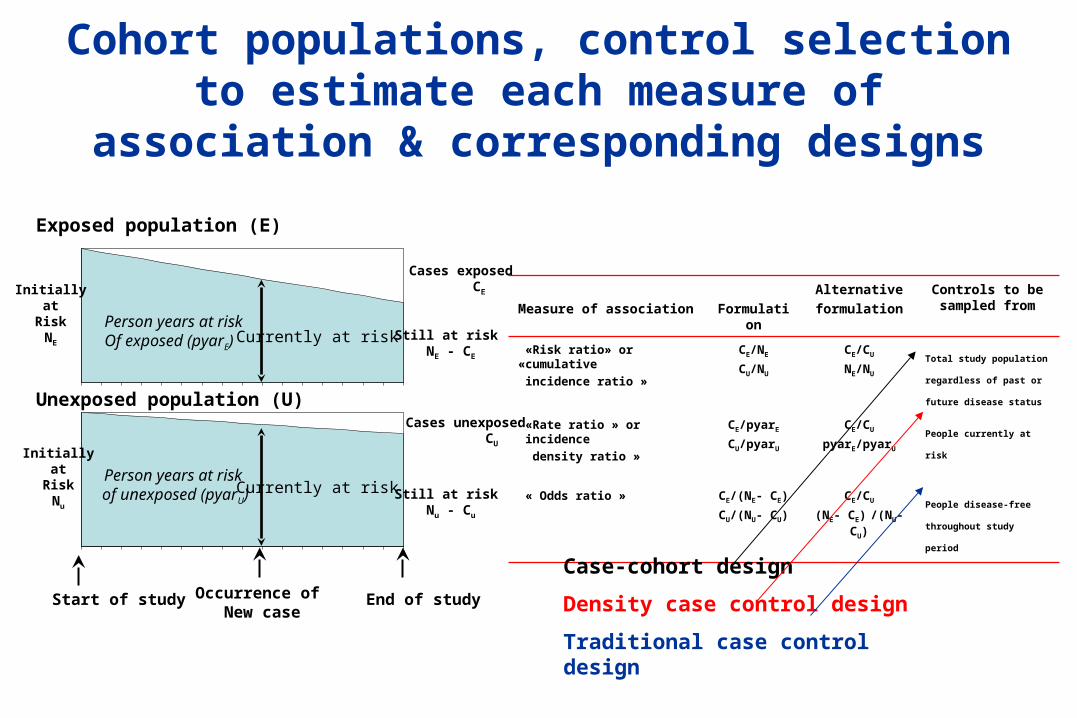
Cohort populations, control selection to estimate each measure of association &
corresponding designs
Measure of association Formulation
Alternative
formulation
Controls to be sampled from
«Risk ratio» or «cumulative
incidence ratio »
CE/NE
CU/NU
CE/CU
NE/NU
Total study population
regardless of past or future
disease status
«Rate ratio » or incidence
density ratio »
CE/pyarE
CU/pyarU
CE/CU
pyarE/pyarU
People currently at risk
« Odds ratio » CE/(NE- CE)
CU/(NU- CU)
CE/CU
(NE- CE) /(NU- CU)People disease-free
throughout study period
Case-cohort design
Density case control design
Traditional case control design
Currently at risk
Cases exposed CE
Start of study End of study
Currently at risk
Person years at riskOf exposed (pyarE)
Occurrence of New case
Person years at risk of unexposed (pyarU)
Initiallyat
RiskNE
Initiallyat
RiskNu
Exposed population (E)
Unexposed population (U)Cases unexposed CU
Still at risk NE - CE
Still at risk Nu - Cu

What design and when?Traditional case control
- rare diseaseCase cohort
- frequent disease- same denominator over time- non recurrent outcome
Density case control- rare or frequent disease- exposure changes over time- non or recurrent outcome

OR in case-control studies: the rare disease assumption
• Case control study very efficient for rare diseases
• Initially used for testing significant differences in exposure without attempting to quantify the risk associated with exposure :« Statistically do more lung cancer patients have a history of smoking than controls ?» rather than « by how many times does smoking increase the risk of lung cancer ? »
• Cornfield (1961): if disease is rare : OR ~ RR
• Used more and more for common diseases
• Miettinen (1976), Greenland (1981), Smith (1984) : if controls chosen appropriately, no rare disease assumption is needed for the OR to estimate the relative risk or rate !
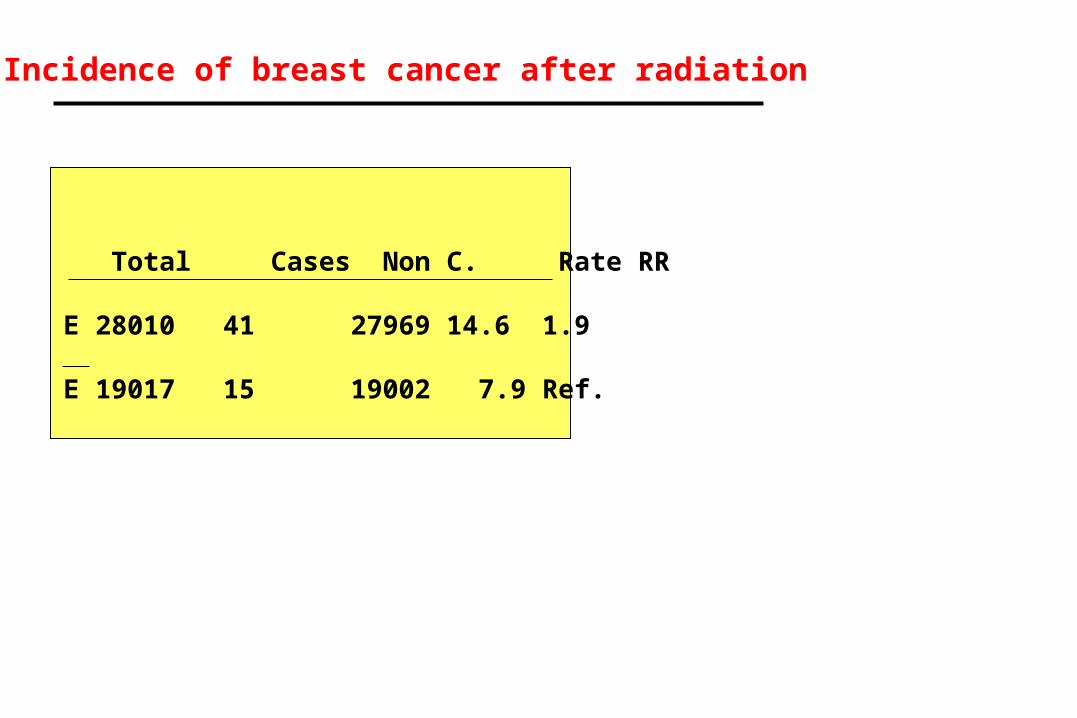
Total Cases Non C. Rate RR
E 28010 41 27969 14.6 1.9
E 19017 15 19002 7.9 Ref.
Incidence of breast cancer after radiation
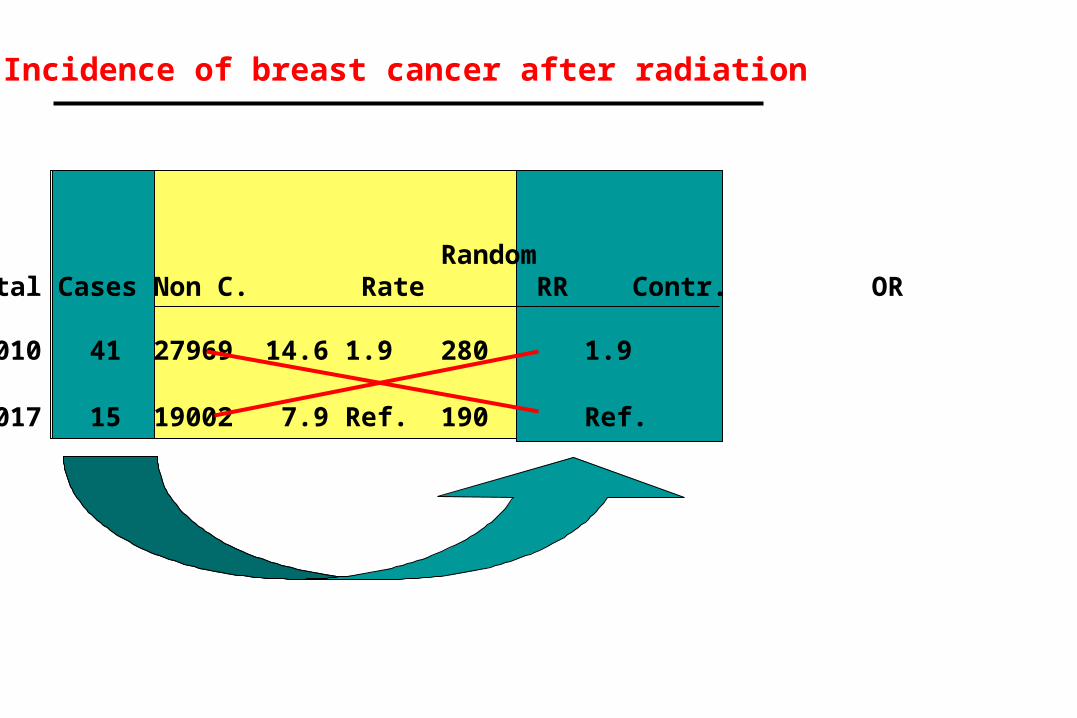
Incidence of breast cancer after radiation
Random
Total Cases Non C. Rate RR Contr. OR
28010 41 27969 14.6 1.9 280 1.9
19017 15 19002 7.9 Ref. 190 Ref.

Incidence of breast cancer after radiation
NonRandom Cases.
Total Cases Non C. Rate RR Contr. OR Contr. OR
28010 41 27969 14.6 1.9 280 1.9 279 1.9
19017 15 19002 7.9 Ref. 190 Ref. 190 Ref.
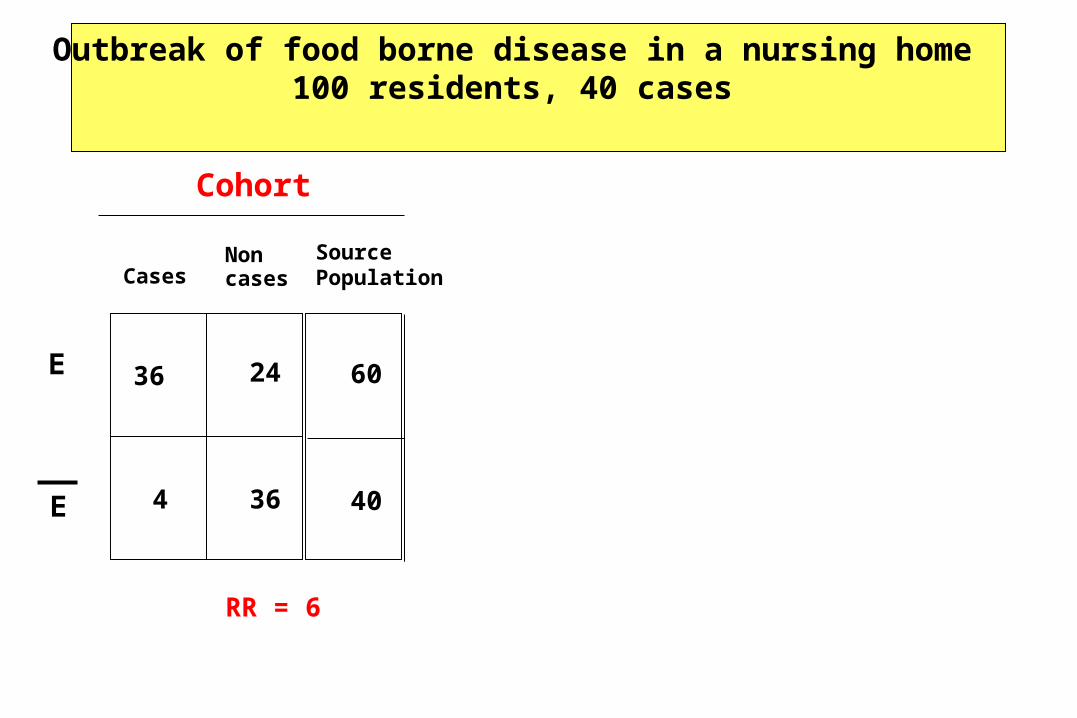
Cases
E
E 4
SourcePopulation
60
40
Outbreak of food borne disease in a nursing home100 residents, 40 cases
36
RR = 6
24
36
Non cases
Cohort
CasesNon cases
E
E
12
4 18
SourcePopulation
60
40
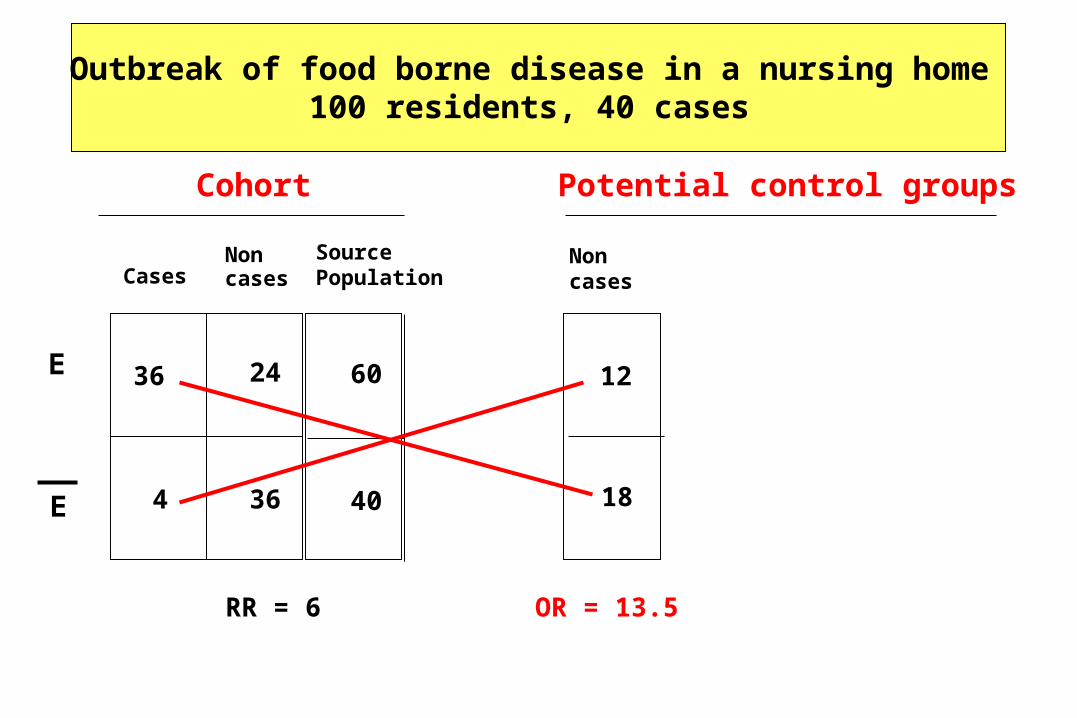
Outbreak of food borne disease in a nursing home100 residents, 40 cases
36
RR = 6 OR = 13.5
24
36
Non cases
Potential control groupsCohort
CasesNon cases
E
E
12
4 18
SourcePopulation
60
40
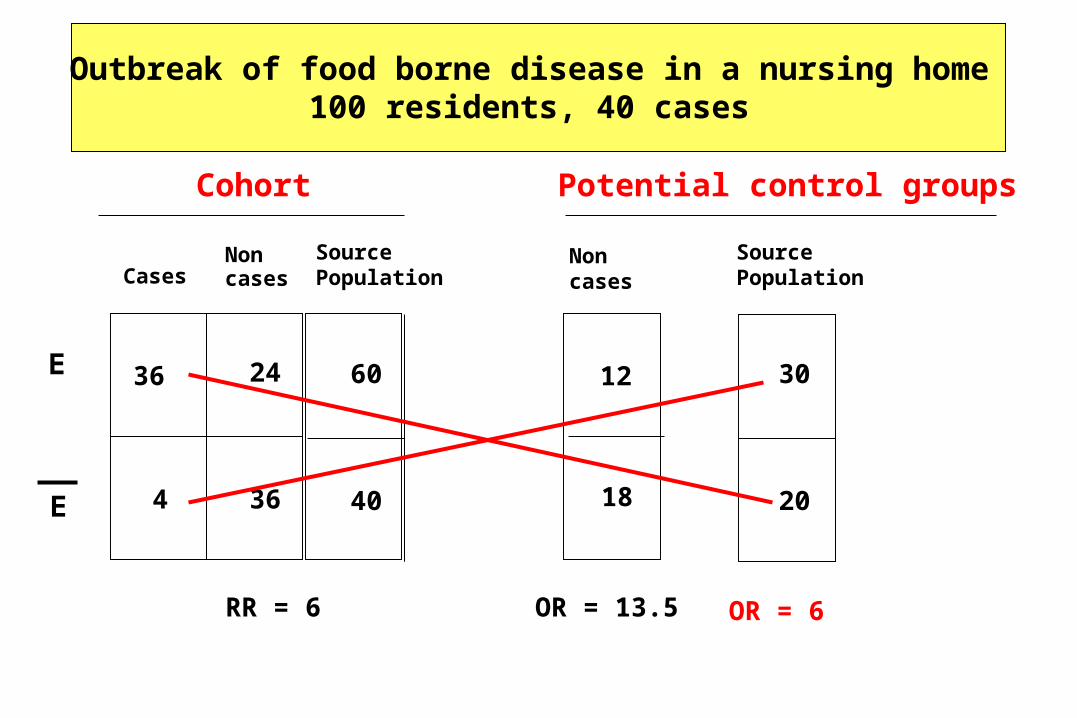
Outbreak of food borne disease in a nursing home100 residents, 40 cases
36
SourcePopulation
30
20
RR = 6 OR = 13.5 OR = 6
24
36
Non cases
Potential control groupsCohort
Rare disease assumption = wrong issue
Issue = selection of controls

Alternative designs
• « Case-to-case »
• « Case-crossover »

« Case-to-case approach »
Source: Jean Claude Desenclos, Jet De Valk
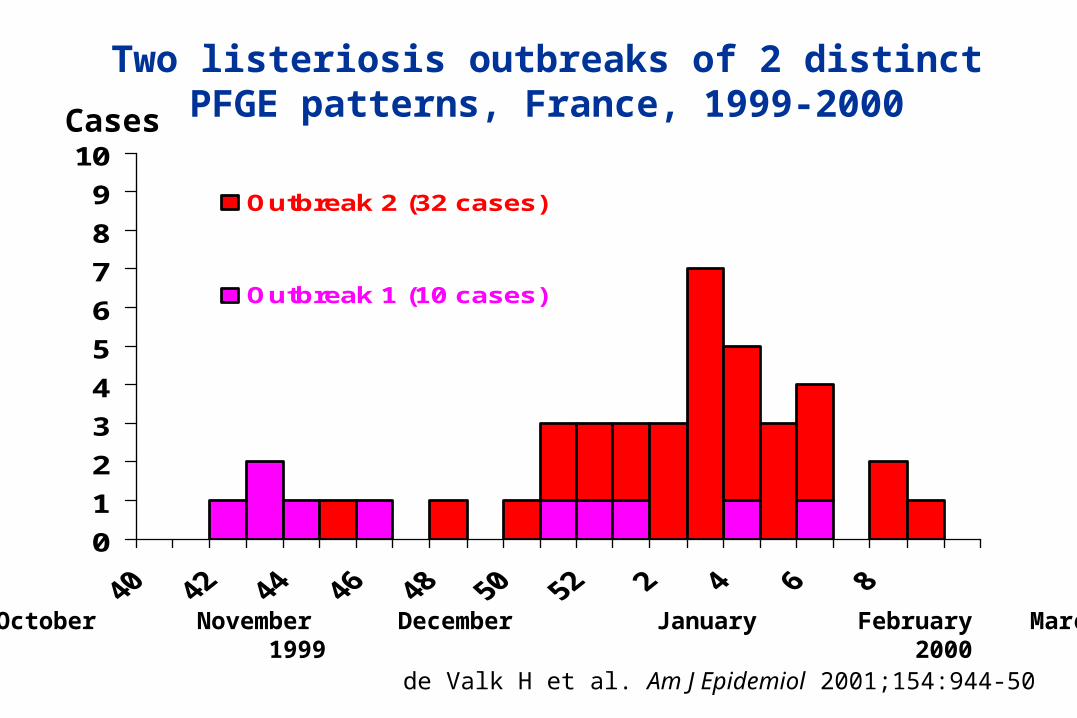
Two listeriosis outbreaks of 2 distinct PFGE patterns, France, 1999-2000
0
1
2
3
4
5
6
7
8
9
10
Outbreak 2 (32 cases)
Outbreak 1 (10 cases)
October November December January February March 1999 2000
Cases
de Valk H et al. Am J Epidemiol 2001;154:944-50
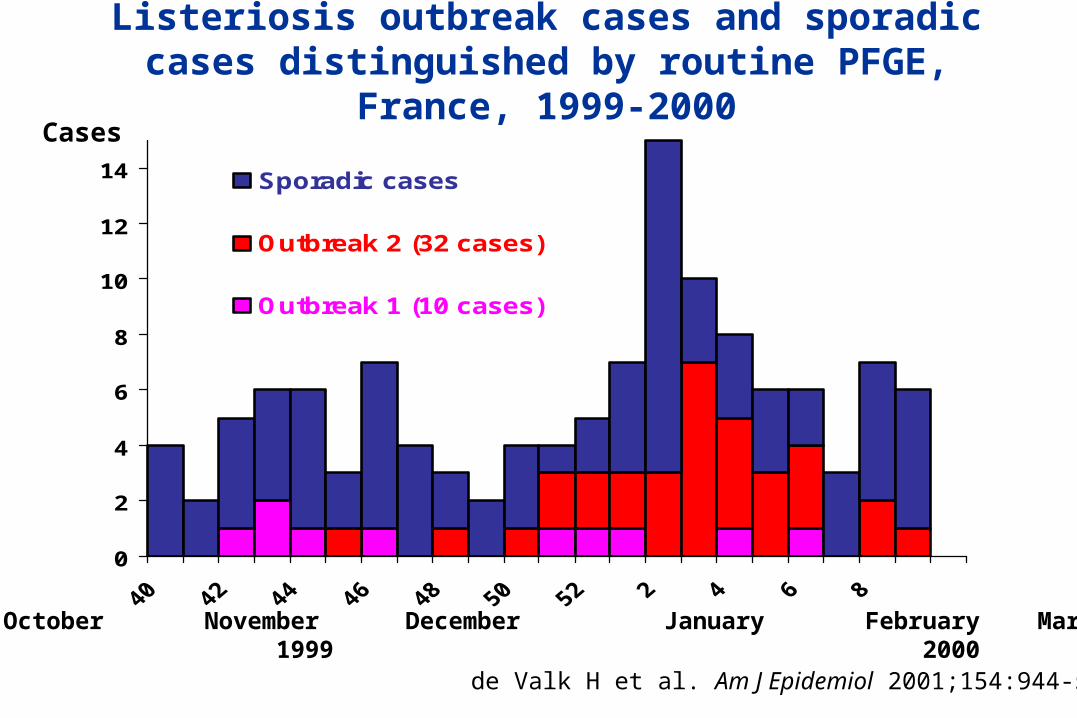
Listeriosis outbreak cases and sporadic cases distinguished by routine PFGE, France, 1999-2000
0
2
4
6
8
10
12
14Sporadic cases
Outbreak 2 (32 cases)
Outbreak 1 (10 cases)
October November December January February March 1999 2000
Cases
de Valk H et al. Am J Epidemiol 2001;154:944-50
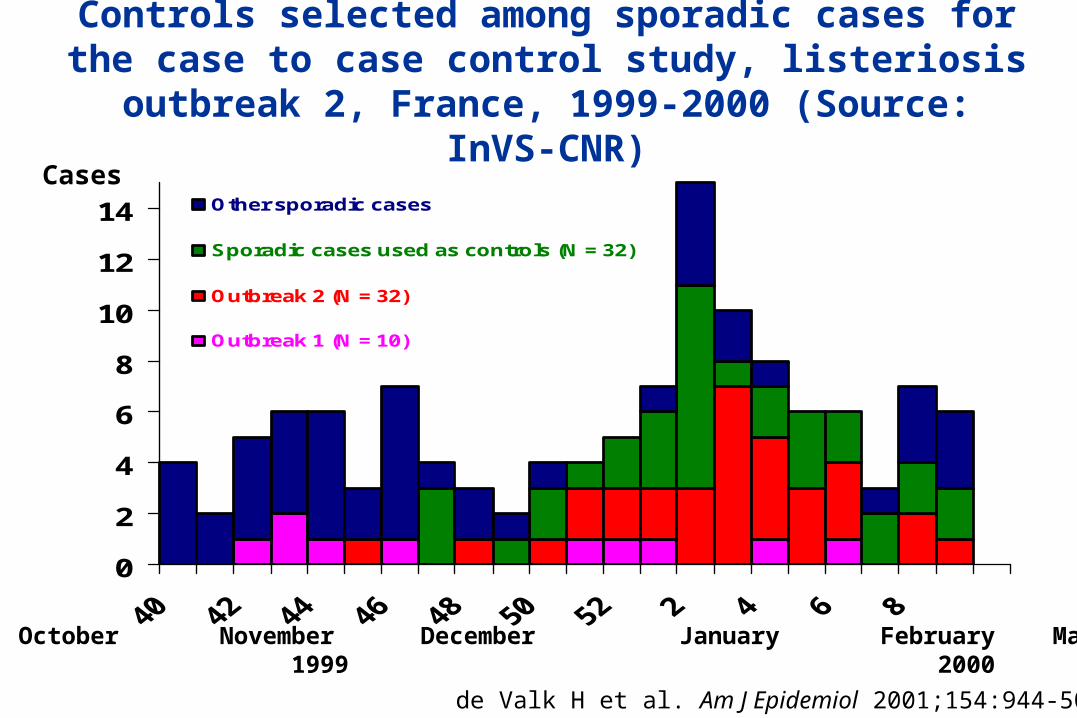
Controls selected among sporadic cases for the case to case control study, listeriosis outbreak 2, France,
1999-2000 (Source: InVS-CNR)
0
2
4
6
8
10
12
14 Other sporadic cases
Sporadic cases used as controls (N = 32)
Outbreak 2 (N = 32)
Outbreak 1 (N = 10)
October November December January February March 1999 2000
Cases
de Valk H et al. Am J Epidemiol 2001;154:944-50

Food consumption of case-patients and control-subjects, multivariate analysis on 29 case-patients
and 32 control-subjects. Outbreak of listeriosis, France, December 1999 - February 2000.
Food consumed
Adjusted Odds ratio*
95% CI
p
Pork tongue in jelly 75.5 4.7 – 1216.0 0.002
Cooked ham 7.1 0.7 – 71.8 0.1
Pâté de campagne 8.9 1.7 – 46.1 0.009
*adjusted for underlying condition, pregnancy status and date of interview by logistic regression
de Valk H et al. Am J Epidemiol 2001;154:944-50
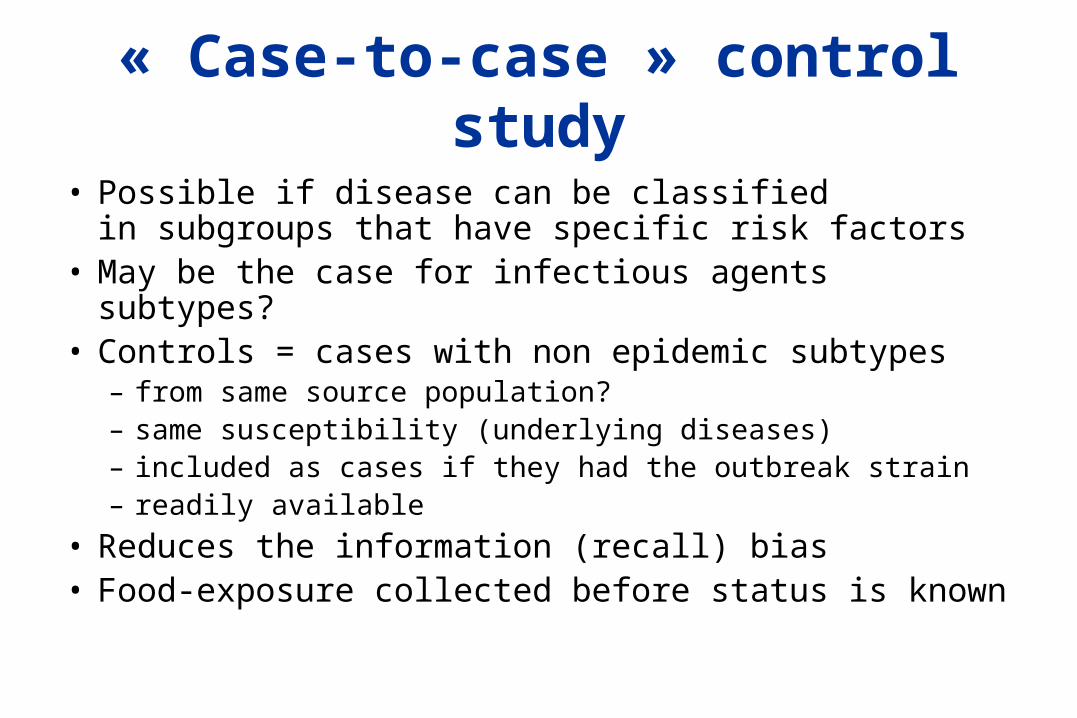
« Case-to-case » control study
• Possible if disease can be classified in subgroups that have specific risk factors
• May be the case for infectious agents subtypes?• Controls = cases with non epidemic subtypes
– from same source population? – same susceptibility (underlying diseases)– included as cases if they had the outbreak strain– readily available
• Reduces the information (recall) bias• Food-exposure collected before status is known

The case-crossover design
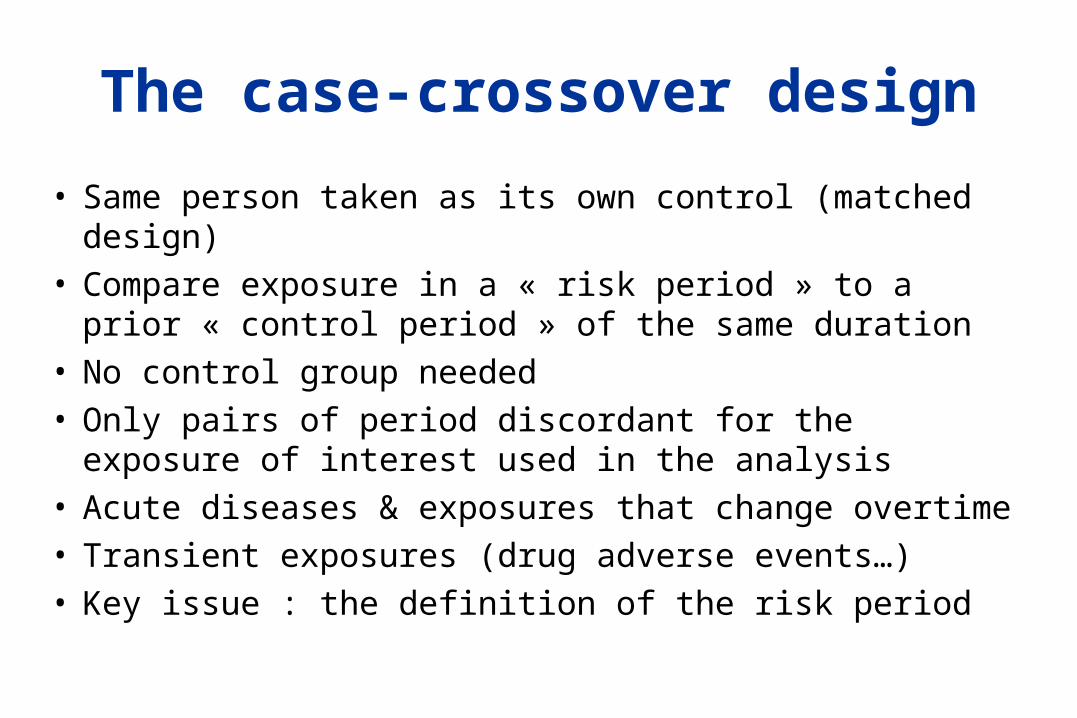
The case-crossover design
• Same person taken as its own control (matched design)• Compare exposure in a « risk period » to a prior
« control period » of the same duration • No control group needed• Only pairs of period discordant for the exposure of
interest used in the analysis • Acute diseases & exposures that change overtime• Transient exposures (drug adverse events…)• Key issue : the definition of the risk period
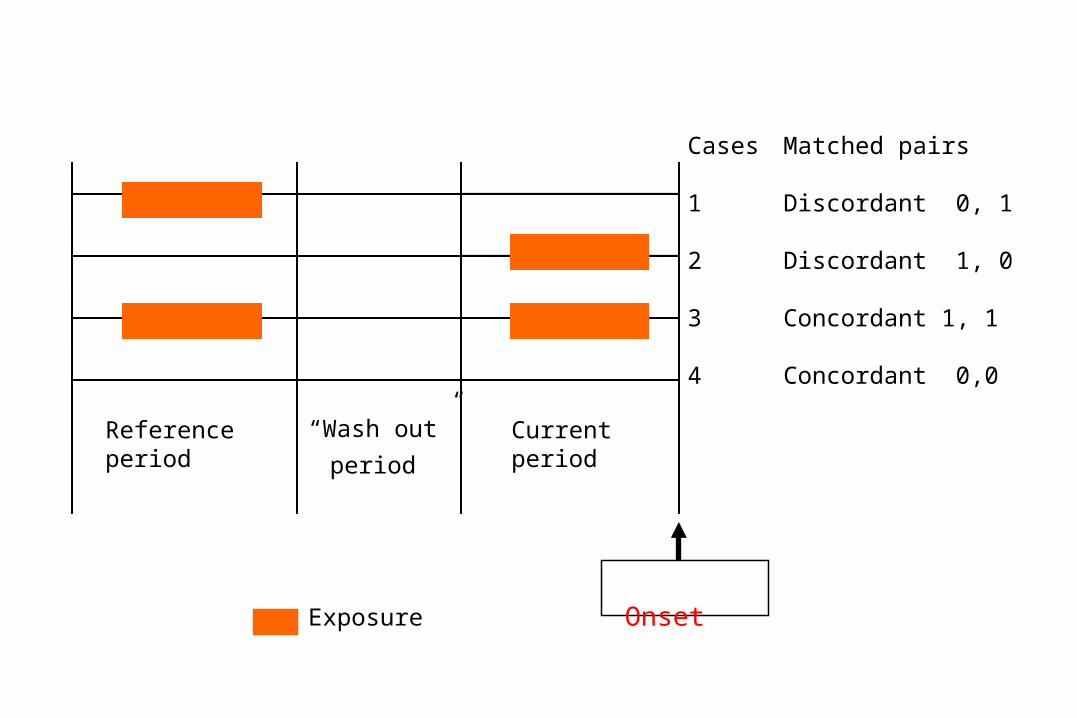
Reference period
“Wash out”
period
Currentperiod
Exposure Onset
Cases Matched pairs
1 Discordant 0, 1
2 Discordant 1, 0
3 Concordant 1, 1
4 Concordant 0,0

« Case crossover » design applied to a prolonged Salmonella Typhimurium
outbreak
Control period
72 hours
“Wash out”period
48 hoursRisk period 72 hours
Discordant pair ( 1,0 )
Concordant pair ( 1,1 )
Discordant pair ( 0,1 )
Concordant pair ( 0,0 )
Exposure
Onset
Haegebaert S et al. Epidemiol infect 2003;130,1-5
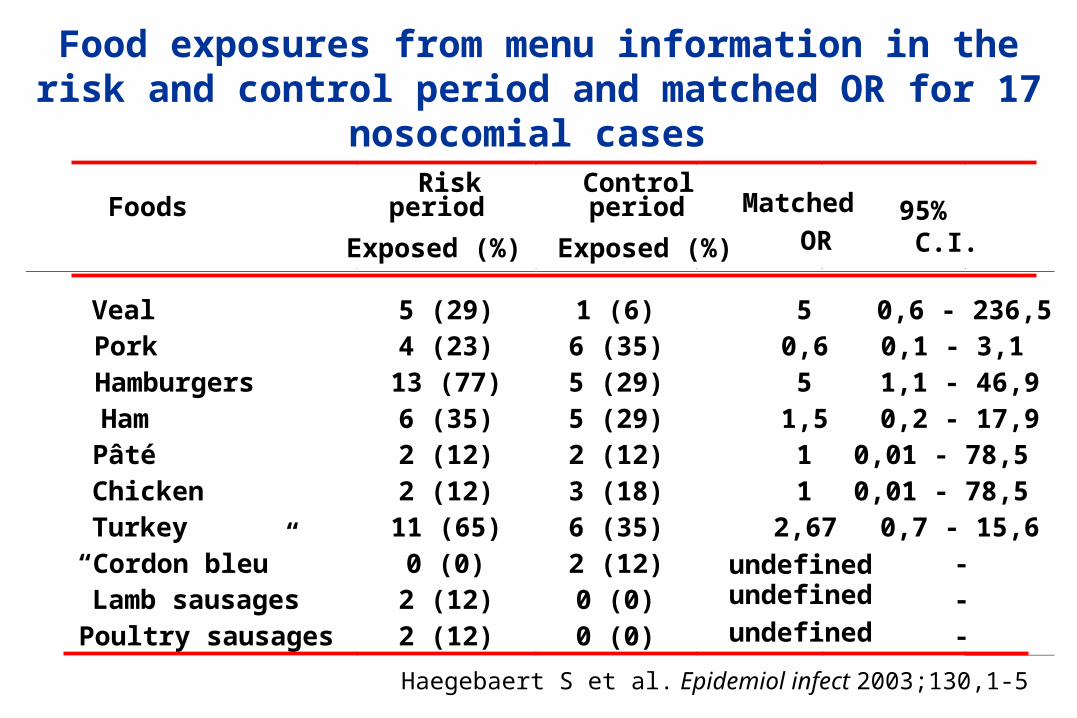
Food exposures from menu information in the risk and control period and matched OR for 17 nosocomial cases
Foods Riskperiod
Control period Matched
OR 95% C.I. Exposed (%) Exposed (%)
Veal 5 (29) 1 (6) 5 0,6 - 236,5 Pork 4 (23) 6 (35) 0,6 0,1 - 3,1 Hamburgers 13 (77) 5 (29) 5 1,1 - 46,9 Ham 6 (35) 5 (29) 1,5 0,2 - 17,9 Pâté 2 (12) 2 (12) 1 0,01 - 78,5 Chicken 2 (12) 3 (18) 1 0,01 - 78,5 Turkey 11 (65) 6 (35) 2,67 0,7 - 15,6 “Cordon bleu” 0 (0) 2 (12) undefined - Lamb sausages 2 (12) 0 (0) - Poultry sausages 2 (12) 0 (0) -
undefined
undefined
Haegebaert S et al. Epidemiol infect 2003;130,1-5
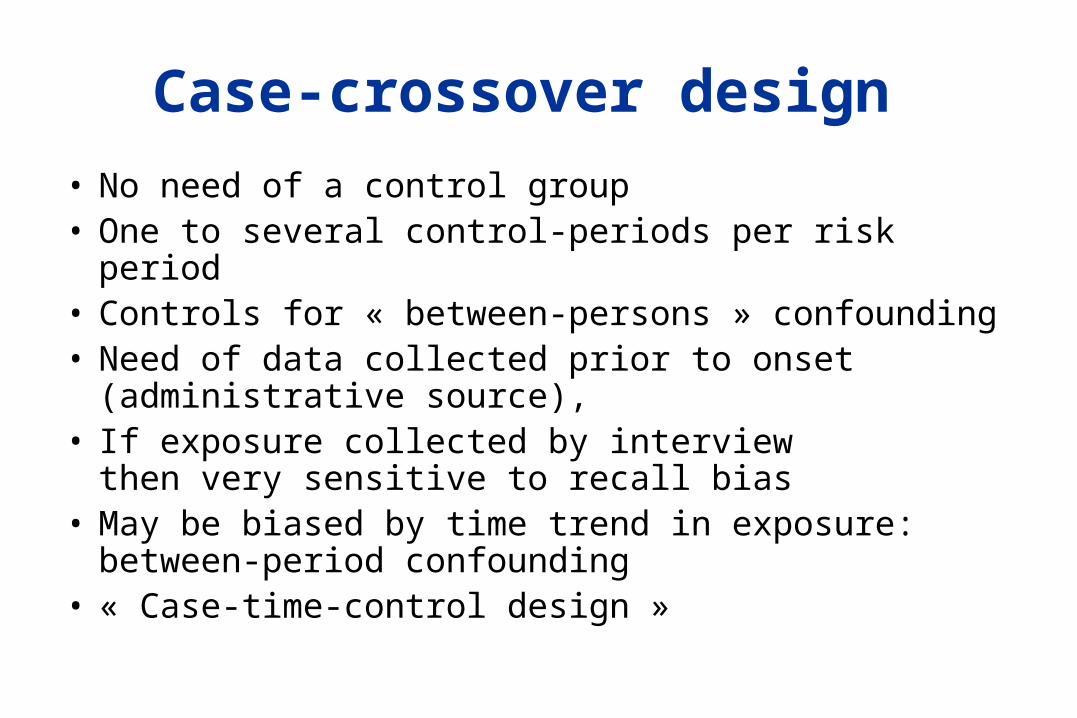
Case-crossover design
• No need of a control group• One to several control-periods per risk period• Controls for « between-persons » confounding• Need of data collected prior to onset
(administrative source), • If exposure collected by interview
then very sensitive to recall bias• May be biased by time trend in exposure:
between-period confounding• « Case-time-control design »
References1. Rodrigues L et al. Int J Epidemiol 1990;19:205-132. de Valk H et al. Am J Epidemiol 2001;154:944-503. Haegebaert S et al. Epidemiol infect 2003;130,1-54. Hernandez-Diaz S et al. Am J Epidemiol 2003;158:385-3915. Rothman KJ; Epidemiology: an introduction. Oxford University Press 2002,
73-936. Suisa S. The case-time-control design. Epidemioogy. 1995;6:248-253.7. Greenland S. Confounding and exposure trends in Case-cross-over and
case-time-control designs. Epidemiology. 1996; 7231-239.8. Mittleman, Maclure, Robins. Control sampling strategies for case cross-
over studies: An assessment or relative effectiveness. A J Epidemiol. 142;1:91-98.

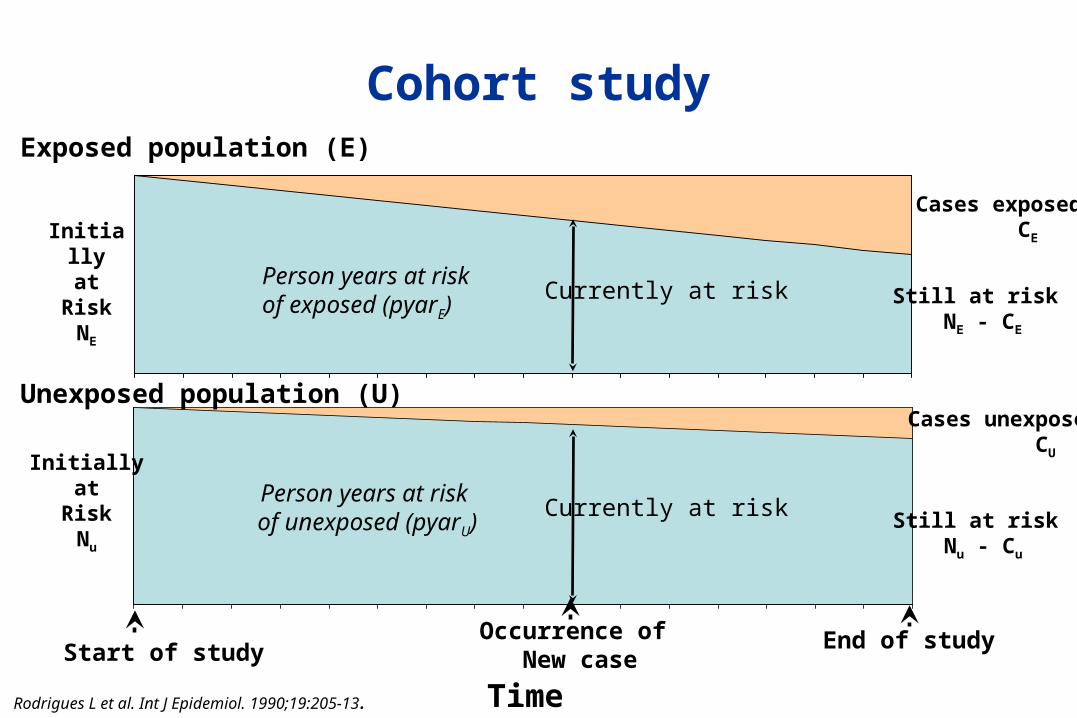
Cohort study
Currently at risk
Cases exposed CE
Start of study End of study
Currently at risk
Person years at riskof exposed (pyarE)
Occurrence of New case
Person years at risk of unexposed (pyarU)
Initiallyat
RiskNE
Initiallyat
RiskNu
Exposed population (E)
Unexposed population (U)Cases unexposed CU
Still at risk NE - CE
Still at risk Nu - Cu
TimeRodrigues L et al. Int J Epidemiol. 1990;19:205-13.

Surveillance of human listeriosis, France
Lm human isolates
Routine extended
food questionnaire
Clusterdetection
Mandatory notification
Routine ongoingPFGE typing
>3 isolates with same
PFGE patternin 10 weeks
Investigation
InVSDDASSClinicians
Laboratories NRC
• Timely detection of clusters• Food history readily available when cluster recognised• “Case to case” case-control studies