study of flow in compacted columns of swelling...
TRANSCRIPT
8 TRANSPORTATION RESEARCH RECORD 1277
Study of Flow Swelling Clay
in Compacted Columns of
E. WEISBERG ANDS. FRYDMAN
Part of a research program aimed at studying the advance of the wetting front and the development of swell during flow through a compacted, active clay is described. The study included tests on compacted soil columns tested both under laboratory conditions and under an increased acceleration field in a centrifuge. Speci~l ins~rumentation was employed, including gamma ray scannmg, high-speed photography, and moisture transducers. Test results indicated differences in the wetting process for soil compact~d wet and dry of plastic limit. In the latter case, a sharp wettmg front was observed, whose rate of advance was unaffected by the high suction in the soil. In the columns compacted wet of P.lastic limit, the wetting front was less sharp, and its advance was significantly affected by soil suction. In all cases, the coefficient of permeability dropped continuously following wetting. These ?bser~a~ions !ed to a model for the process of flow through swellmg soil m which flow advances through the large, inter-aggregate pores of the soil. As the aggregates become wet, they swell, the pores close, and permeability decreases.
Prediction of the behavior of swelling-soil embankments and subgrades on wetting requires an understanding of the coupled effects of saturated and unsaturated flow, swell, and the stress-strain response of the soil. Such predictions are of importance in many fields (e.g., performance of pavements on expansive clays, stability of water reservoir embankments, development of lateral pressure on structures retaining expansive soils, performance of foundations located in or near expansive soils). Several simplified modeling approaches have been developed for estimation of soil movements as a result of wetting and consequent swelling. These generally involve a decoupling of the flow and stress-strain problems [e.g., Justo et al. (1), Picornell and Lytton (2), Uzan et al. (J)]. Richards ( 4) presented a more sophisticated approach that employs a coupled analysis, leading to a more realistic modeling of the physical processes involved. However, he concluded that "current knowledge of the interaction between water flow and load-deformation processes is not sufficient for the accurate analysis of the response of swelling soils in the field."
This paper describes part of a research program aimed at studying the advance of the wetting front, and the accompanying development of swell, during flow through a compacted, active clay. The overall study included tests on compacted soil columns performed both under laboratory conditions and under increased accelerations in a centrifuge, with the purpose of clarifying the modeling Jaws governing the coupled flow-swell process.
Technion-Israel Institute of Technology, Haifa, Israel.
THE SOIL TESTED
The soil used in the investigation was a highly plastic, brown clay known in Israel as Mizra clay, from a location about 20 km east of Haifa. This clay has been used for many previous research studies carried out in Israel on the swelling mechanism [e.g., Kassiff et al. (5), Komornik and Zeitlen (6), Ben Shalom (7), Samoocha (8), Pachas (9), Keissar (10)], and its basic geotechnical properties have been well established. The soil contains about 70 percent clay-sized particles; the predominant clay mineral is montmorillonite, rich in adsorbed calcium cations. The consistency limits of the sample used for the tests were liquid limit (LL) 78 percent and plasticity index (PI) 53 percent. Specific gravity of the particles was 2. 75. Maximum dry density and optimum moisture content as obtained in a standard compaction test (Proctor energy, ASTM D698-78) were 12.6 kN/m3 and 33 percent, respectively. All tests were performed on soil compacted to a dry density of 13.5 kN/m3
; most tests were performed on columns compacted at a moisture content of 21 percent (i.e., slightly below the plastic limit), but columns at 16 percent (very dry) and 30 percent (slightly above the plastic limit) were also tested.
ONE-DIMENSIONAL FLOW TESTS
General
Tests were performed on soil compacted in perspex columns of internal diameter 112 mm and height 300 mm. The soil was placed and compacted in layers of 20 mm; the bottom layer was sand, providing a drain for water that would eventually flow downward during the test. The weight and height of each compacted layer were carefully monitored during preparation, and this, together with moisture content determinations, provided a check on the initial total and dry densities of the soil column.
Two series of tests were carried out-one under laboratory conditions, and the second under increased acceleration conditions in a centrifuge. The purpose of the centrifuge tests was to simulate the stress conditions that exist in a prototype situation. The use of centrifugal modelling in geotechnical engineering has been extensively described in the literature [e.g., Craig et al. (11)]. In particular, the use of the method for simulating flow through stable soils has been demonstrated [Cargill and Ko (12), Goodings (13), Arulanandan et al. (14)]. In such cases, as the soil structure and properties remain unchanged during flow, time effects are scaled according to clear scaling laws; the time required for flow to occur between

Weisberg and Frydman
two points at similar geometrical locations in a prototype and in a small model tested in a centrifuge will be in the ratio of n2
, where n is the ratio between both the prototype and model dimensions, and the accelerations acting on the model and the prototype.
In the case of flow through swelling soils, a more complex situation exists. As flow advances through the soil, swelling occurs, altering the ·structure and properties (presumably including the coefficient of permeability) of the wetted soil. The swelling process itself is time dependent and, as a result, the properties of the soil in the wetted zone continue to change with time until an equilibrium condition is reached. The scaling of time effects in small models will, therefore, be complicated by the superposition of a permeability change, the rate of which is not, a priori, clearly connected to the governing acceleration field. The purpose of the research, of which the present paper describes part, was to study the implications of these effects with regard to the possibility of using small models for simulating flow through prototypes of swelling soils. This paper does not discuss the modeling consequences of the results of the tests performed in the centrifuge; these will be presented elsewhere. The paper makes use of these results in order to develop a better understanding of the flow/swell phenomenon in expansive soil.
In order to monitor both the advance of the wetting front and the development of swell within the soil columns, special techniques were employed. The techniques used for the two test series are presented below. In all cases, the height of water above the base of the soil column was held constant during a test.
Columns Tested Under Laboratory Conditions
In order to monitor changes in moisture content and dry density in the columns, they were scanned with gamma rays during flow. Gamma radiation attenuation has been used since the early 1960s for measuring density and moisture content in porous materials and during flow through them [e.g., Davidson et al. (15), Gurr (16)]. Tsur and Pazi (17) built a scanning system for laboratory samples, and this system was employed for the present investigation. In essence, the system consists of a source (Cs137
, with an energy of 0.662 MeV, producing a narrow ray of 1 mm depth and 20 mm width) and a scintillation counter detector. The spacing between the source and detector is 30 cm. The soil column is placed between the source and detector, and a reading of gamma ray transmission is taken at desired stages of the flow test. The column is seated on a base that can be raised or lowered, with height monitoring being carried out using a linear variable differential transformer (L VDT), so that the location of the section at which readings are being obtained is known at any time. A scan over the column height may be made at various stages of the test by taking a series of readings, in between which the column is raised or lowered as required. Figure 1 shows the equipment, and Figure 2 shows a soil column being scanned.
The single count obtained at the detector during a reading is generally correlated to the bulk density of the soil. Consequently, if moisture content is known, dry density can be calculated; alternatively, if dry density is known, moisture content can be calculated. In the case of the study of flow through stable soils, the dry density of the soil may be con-
FIGURE 1 Gamma ray device (source on right, detector on left).
FIGURE 2 Soil column being scanned during wetting test (leads are connected to moisture transducers).
9

10
sidered constant, and so the change in moisture content (and hence the advance of the wetting front) can be monitored as flow progresses through the soil column. However, in the case of associated flow and swell, where both moisture content and dry density are changing simultaneously, one reading of gamma ray transmission is insufficient to enable the estimation of these two unknowns. This problem may be solved by using, for example, two sources of different energies; each reading would then provide two transmission counts enabling the evaluation of the two unknowns.
In the present investigation, a different approach was employed. During compaction of the soil columns, a small lead disk, 1 mm thick and 20 mm in diameter, was placed between each layer. On completion of compaction, the soil column was scanned. The locations of the lead disks, easily identifiable by the extreme attenuation they cause, were established relative to a fixed point on the perspex column. Additional count readings were made in each compacted layer, approximately midway between the lead disks. Using the measured initial moisture content of the soil sample, these readings made possible the calculation of the initial dry density over the column height.
A head of water was then applied to the top of the column, and flow developed downward through the soil. At various stages of advance of the wetting front (usually visible on the wall of the column), further series of readings were made of the locations of the disks and of the count at layer centers. As the dry weight of soil located between any pair of disks could be assumed to remain constant, the relative movement between neighboring disks was used to calculate the amount of swell and the change in dry density of the relevant soil layer. The count readings at layer center, together with the calculated dry densities, made possible the calculation of the moisture content in each layer and the degree of saturation of the layer. Several of the tests were continued for some time after the wetting front reached the bottom of the column, in order to facilitate the evaluation of the "saturated" coefficient of permeability of the soil, and to study the variation with time of degree of saturation, permeability, and swell. Some of the soil columns were carefully extruded from the perspex container on completion of the test, and moisture contents of the layers were determined by the oven-drying procedure; these values were compared to those obtained from the gamma ray scan carried out at the end of the test.
Columns Tested in the Centrifuge
The centrifuge used for the study (Figure 3) has been described previously [Leshchinsky et al. (18), Frydman and Keissar (19)]. It has an arm radius of 1.6 m, develops a maximum acceleration at the sample center of 100 g, and can take a maximum payload of 5,000 kg-g (i.e., 5,000 kg at 1 g up to 50 kg at 100 g).
In order to monitor the advance of the wetting front and the development of swell in the soil, the following techniques were used:
1. During preparation of the soil columns, a number of small steel balls, 3 mm diameter, were placed at the top of each compacted layer, in contact with the perspex container.
TRANSPORTATION RESEARCH RECORD 1277
FIGURE 3 The centrifuge.
During the test, the columns were photographed at different stages of the wetting process while in flight in the centrifuge. Analysis of the movements of the balls, obtained from the resulting photographs, allowed the calculation of the development of swell during the test. The photography and analysis procedures have been described previously (18,19).
2. During preparation of the soil columns, an electrical resistance transducer was placed between each compacted layer. The transducer consisted of a pair of wires, spaced 7 mm from each other and supported on a plastic mesh. During the test, alternating current was applied between the wires, and the electrical resistance of the soil between them was measured. When the wetting front reached a transducer, the measured resistance dropped markedly. These readings provided a means for monitoring the advance of the wetting front.
3. The above inclusions were additional to the lead disks placed between layers in the laboratory-tested columns. The columns were scanned by gamma ray transmission before and after each test. The data so obtained provided information on the overall change in moisture content and dry density during the test. They also provided a check on the measurements carried out in flight in the centrifuge.
4. Water level was held constant during a test by use of a control system including a solenoid valve activated by a float mounted at the desired water level.
Figure 4 shows a photograph of the top of a soil layer during compaction of a column for centrifuge testing; the steel balls, moisture transducer, and lead disk are clearly seen. Figure 5 shows three stages in the wetting of a column compacted at 21 percent moisture content; the photographs were taken while the column was in flight in the centrifuge, at an acceleration of 15 g. The wetting front is clearly visible at all stages.
A SIMPLIFIED MODEL FOR THE ADVANCE OF THE WETTING FRONT
A simplified model for the advance of the wetting front during one-dimensional flow was presented by Uzan et al. (3). Mod-

Weisberg and Frydman
FIGURE 4 View of the top of a soil layer during compaction of a column for centrifuge testing.
ified to take account of centrifugal acceleration, this model is used as the basis for analyzing the tests. The model assumes a sharp wetting front, as shown in Figure 6, with saturated flow within the wetted zone. For flow downwards through the soil column shown in Figure 6, the time t for the wetting front to reach depth h may be considered, for the case in which the suction at the wetting front is ljl, as follows:
Define the effective porosity n' = n - 0, where 0 is the volumetric water content (i.e., the ratio between volume of
(
'
11
water to total volume); n' represents the relative volume of pores not filled with water.
The rate of advance v of the wetting front is given by
v = qln' = ( - Ki)ln' (1)
where K is the coefficient of permeability of the wet soil, i (the hydraulic gradient) equals -[HA - H8 ]/h, and HA and H 8 are the heads at levels A and B.
Taking level B as reference elevation, the head at A is N (H0 + h), and at B is -cxljl , where N is the centrifugal acceleration and ex is a coefficient with value between 0 and 1. The hydraulic gradient i is then
. -[N(h + H 0 ) + cxljl] L =
h (2)
Two limiting cases may be considered, the first when the suction at the wetting front is zero, and the second when the suction, ljl, is much greater than the value N(h + H0). In the former case, the rate of advance of the wetting front is given by
dh KN(h + H 0 )
v = dt = n'h (3)
For an increment of time from t = 0 tot, in which h increases from 0 to h, Equation 3 yields
n' [ Ho J t = KN h + H0ln (h + Ho) (4)
where K represents an average coefficient of permeability over time t and depth h.
FIGURE 5 Three wetting stages in a column tested in the centrifuge at 15 g (compaction moisture content 21 percent).

12
Ho
h S =I
Wetting front
S < I
FIGURE 6 Simplified onedimensional flow model.
In the second case, with ljJ >> h + H 0 ,
v = dh = Ko:l)J dt n'h
which leads, for time interval 0 to t, to
h2n' t=--
2Ko:l)J
B
(5)
(6)
with K again representing a value averaged over time and depth.
Uzan et al. (20) suggested that o: be taken as 0.5. Using this value, Equation 6 can be written
h2n' t=-
Kl)J (7)
In this second case, in which the driving head is controlled mainly by the extremely large suction, the rate of advance of
TRANSPORTATION RESEARCH RECORD 1277
the wetting front is dependent neither on the acceleration field nor on the level of water above the soil surface.
TEST RESULTS
Figure 7 shows a comparison between the moisture contents obtained by gamma ray scan and those obtained by oven drying. Despite the existence of some outliers, there is seen to be generally good correspondence between the values, providing a basis for confidence in the moisture content values obtained from the gamma ray scans in all the tests.
Figures 8-10 show the degree of saturation, S, and the amount of swell as a function of depth.in the soil column and
60 Legend
+ Sii11ple 11 =16X + SiKnple 11 o =30X + • Q
t!) t::. SiKllple (column No. 1) 110
,21'% -<-"" z D Sii11ple (column No. 2) 11 '21X ' ~ Sii11ple (coiumn No; 3) II o =21~ '11-"
>- 11°=21X (>.:::, er • SiKllple (column No. 4)
0 ~ c 50 Q~
z ILi ~ !::,. > ~ !::,. 0 + I 'v >(
D ,,e 0 !::,. 3 40
• •
30 --~~~~~~--------+---------' 30 40 50 60
w % I GAMMA - RAY
FIGURE 7 Comparison of moisture content values obtained by oven drying and by gamma ray scanning.
SWELL ,(%)
0 10 20 0 10 20 0 10 20 3 0 10 20 30 0 10 20 30 0 10 20 30
61 <m t§§_J.. (UJ._ (77 (73 <ill -z • • • • • • 0: 3 • • • • • • II.I • • • • • >- • ct5 • • .J • • •
7 - • •
DEGREE OF SATURATION. s 0.2 0.6 1.0 0.2 0.6 1.0 0.2 0.6 l.O 0.2 0.6 1.0 0.2 0.6 1.0 0.2 0.6 1.0
• • • • • • 0 z • • • • • •
3 • • • • • • 0: • • • LU • • • >- 5 • • -~ • • • • .J • • • • • •
7 • • • • • • I =IOmin 1=25min t=40min t =80min t= 160min I =l,500min
FIGURE 8 Distribution of degree of saturation and swell with depth during laboratory test (compaction moisture content 16 percent).

SWELL 1 (%)
00 10 20 0 10 20 30 0 10 20 30 0 10 20 30 0 10 20 30 40 0 10 20 30 40 0 10 20 30 40
• • • • • • • 0 z2 • • • • • • • a: • • • • • • • ~4 • • • • • • c • • • • ..J6 • •
•
DEGREE OF SATURATION1
S
0 0.2 0.6 LO 02 0.6 1.0 0.2 0.6 1.0 0.2 0.6 1.0 0 .2 0.6 1.0 02 0.6 1.0 0.2 0.6 1.0
0 • • • • • • • z2 • • • • • • • a: • • • • • • • ~4 • • • • • • • c • • • • • • • ..J
6 • • • • • • • • • • • • • •
I• 10 min t • 25min. t :r40min. t•68min. ts 87min. t=l40min. t • 10,000min .
FIGURE 9 Distribution of degree of saturation and swell with depth during laboratory test (compaction moisture content 21 percent).

14 TRANSPORTATION RESEARCH RECORD 1277
SWELL,(%)
5 10 15 5 1015 5 10 15 5 10 15 5 10 15 5 10 15 5 1015
• ~34) ~ 8) - 40) -.(~0)
• • • • • • • 03 z • • • • • •
• • • • - • D: 5 w • • -· >- • • • • ct -' 7
• • •
DEGREE OF SATURATION, s 0.8 0.9 0.8 0.9 0.8 0.9 0.8 0.9 0.8 0.9 0.8 0.9 0 .8 0 .9
• • • • • • • • • • • • 0
3 • • • • z • • • D: • • • • • • • w 5 • • • • • • • >- • • • • • • ct • -' 7 - • • • • • • •
• • • • • • • t=IOmin t=75min t=l80min t = 390min t=660min t = l,260min 1=11,550min
FIGURE 10 Distribution of degree of saturation and swell with depth during laboratory test (compaction moisture content 30 percent).
time for three tests performed in the laboratory-one at each preparation moisture content. From these figures, the following observations may be made:
1. In the columns prepared at the lower moisture contents of 16 and 21 percent, corresponding to degrees of saturation of 0.42 and 0.56, respectively, a sharp wetting front could be identified, associated with a sharp increase in the degree of saturation. IL was observed in the lesls lhal lhe sharp welling front was clearly visible in the columns prepared at these lower moisture contents (as in the case of the centrifuge columnssee Figure 5). In the column prepared at 30 percent moisture content, corresponding to a degree of saturation of 0.8, the wetting front was less sharp. On the basis of these results, the sharp wetting front model presented in Figure 6 appears reasonable, at least for the lower moisture contents.
2. In all cases, the degree of saturation of the wetted zone increased with time, but never reached 1.0; the maximum value attained was in the range 0.90 to 0.96.
3. Swelling began to develop concurrently with wetting and increased with time. A steep gradient of swell was observed along the column height, despite the small magnitude of the overburden pressures.
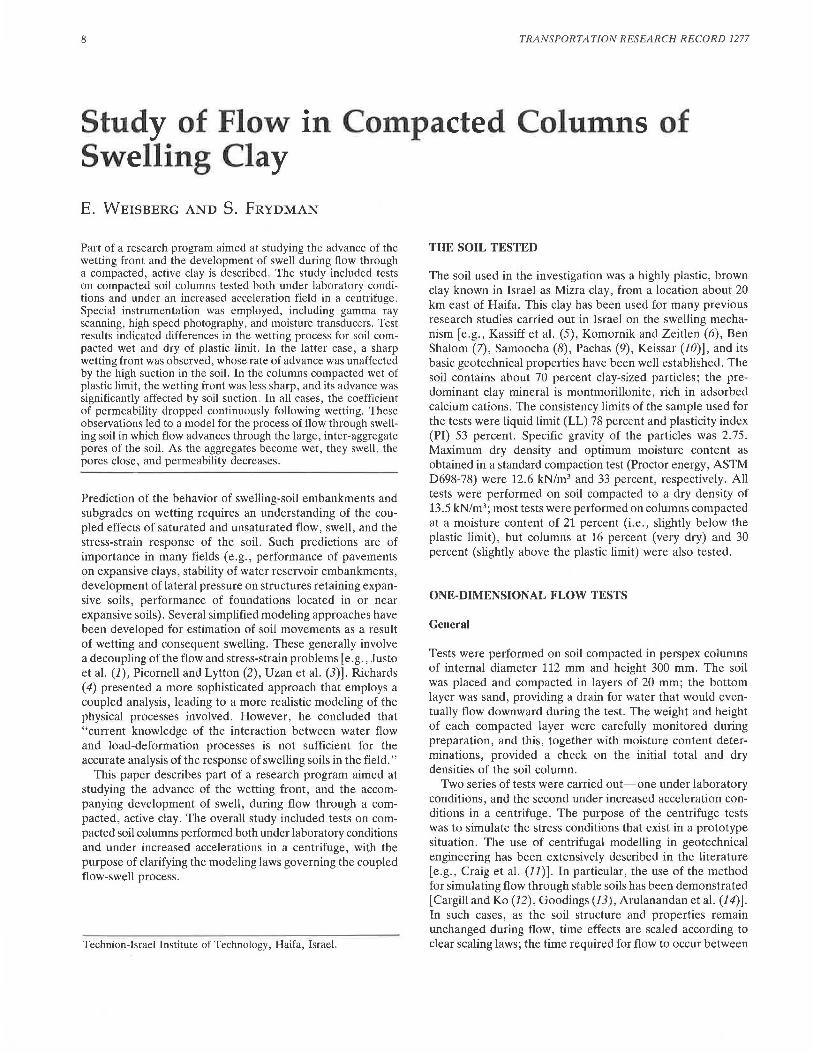
Figure 11 shows the advance of the wetting front as a function of time for soil columns compacted at 21 percent moisture content and tested under both laboratory and centrifuge conditions. In general, the rate of advance of the wetting front increases with centrifugal acceleration and with height of water above the soil surface, Ha. The suction corresponding to the compaction conditions of these columns was evaluated using the method developed by Keissar (10) and was found to be
of the order of 2 MPa. For the test conditions applied, the value of 0.5 lfi is clearly much larger than N(Ha + h), and so, as seen from Equation 7, neither the centrifugal acceleration, N, nor the water height, Ha, would be expected to have such an effect. On the contrary, the trend noted in Figure 11 is consistent with the case in which the effect of suction is insignificant (Equation 4).
It appears, then, that the high suction measured in the soil is not effective in influencing the advance of the wetting front. This observation is considered further, and its implications are discussed in the next section. At this stage, attention is focused on the columns compacted slightly dry of the plastic limit (21 percent moisture content), which represented the bulk of the testing program. Following discussion of the results of these tests, and their consequences, the comparative behavior of columns compacted wet of plastic limit (30 percent moisture content) is considered.
SOIL COMPACTED DRY OF PLASTIC LIMIT
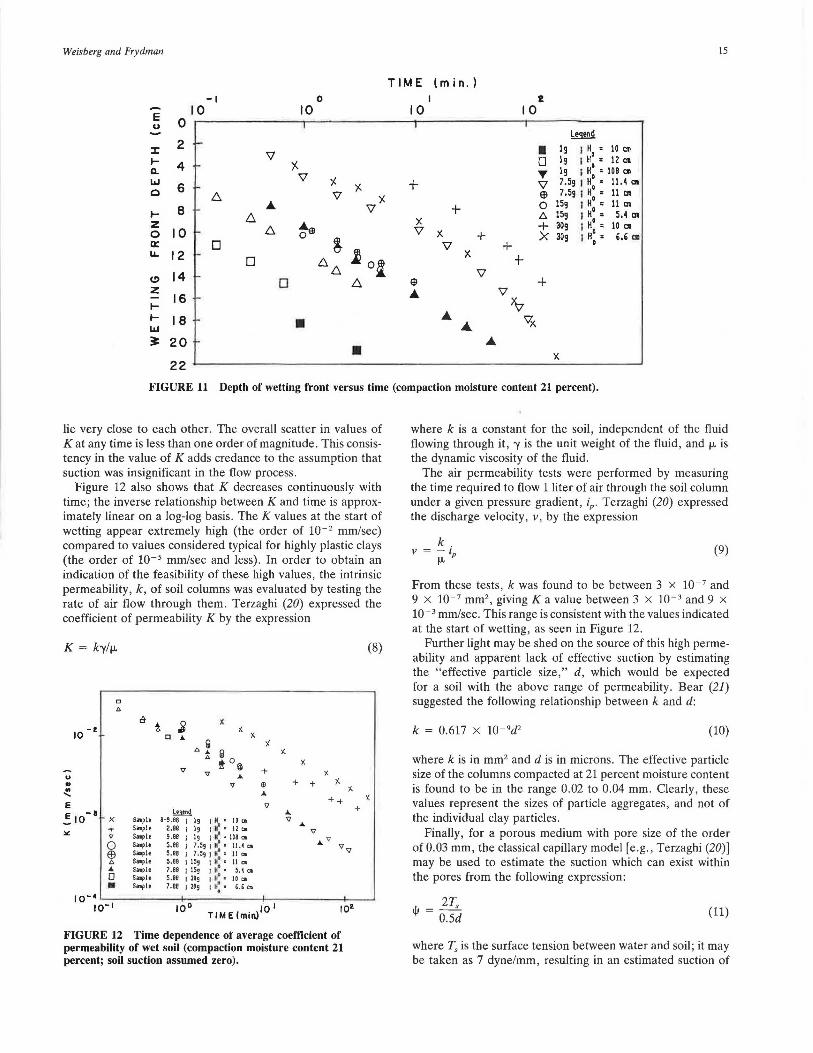
The results shown in Figure 11 suggest that the rate of advance of the wetting front in the soil columns compacted at 21 percent moisture content was not affected by suction. In order to investigate this observation further, it was assumed that the suction was insignificant, and Equation 4 was used to calculate the variation of K with time during the wetting process. The result of these calculations is shown in Figure 12. It should be noted that K, as used in Equation 11 and shown in Figure 12, represents an average value over time (from time zero up to time t) and depth of wetting front (from depth zero to depth h). Of the 9 tests performed, the results of 7
Weisberg and Frydman
E
-1 10
u
::c la.. LI.I 0
1-z
0
2 -
4
6
B -
0 10 -a: LL
(!)
z II-LI.I
12 -
14 -
16 -
18
3: 20
22
D D
0
0 10 I
• •
TIME (min.) I
10 I
+
x
" +
)(
" +
x
"
2 10
+ +
I
Leqend
I !9 1 H • 10 on 0 19 I H: • 12 aa T 19 l H
0 = 108 Cll
\I 7.59 I H0
• 11.4 a1
Ell 7 .59 ; H0
• II Cll
O 159 I H0
• 11 m e,. 159 I H
0 • S.4 a1
+ 309 I H0
= 10 Cll
X 309 I H0
• 6.6 c:11
x
15
FIGURE 11 Depth of wetting front versus time (compaction moisture content 21 percent).
lie very close to each other. The overall scatter in values of Kat any time is less than one order of magnitude. This consistency in the value of K adds credance to the assumption that suction was insignificant in the flow process .
Figure 12 also shows that K decreases continuously with time; the inverse relationship between K and time is approximately linear on a log-log basis . The K values at the start of wetting appear extremely high (the order of 10- 2 mm/sec) compared to values considered typical for highly plastic clays (the order of 10-5 mm/sec and less). In order to obtain an indication of the feasibility of these high values, the intrinsic permeability, k , of soil columns was evaluated by testing the rate of air flow through them. Terzaghi (20) expressed the coefficient of permeability K by the expression
K = k-y/µ
0
"' ~
i ~ )( Cl "
)(
,. ~ x lil x
"' ! o@ )(
v + v "
)(
v Ill + + )(
" 'f..
'V ++
b!..9!ni " s~ple M.00 : :~ : ~.: :~: v " Sa11ph 2.00 v
Snph 9.88 l lj I M', 108 OI
0 EEl
S.nplt Sample
5. 0e l . 88
" v l 1.59 I if • 11.~ '" "'v ; t;;~' ! ~ : ~! : t;. ...
0 •
Sinj>lt Sonple SM\j)h Snph
5.88 1.BS
:m ::: :fr: 5.SS 1.SS
100 TIME(min)lol
FIGURE 12 Time dependence of average coefficient of permeability of wet soil (compaction moisture content 21 percent; soil suction assumed zero).
(8)
+
where k is a constant for the soil, independent of the fluid flowing through it , 'Y is the unit weight of the fluid , and µ is the dynamic viscosity of the fluid.
The air permeability tests were performed by measuring the time required to flow 1 liter of air through the soil column under a given pressure gradient, iP. Terzaghi (20) expressed the discharge velocity , v, by the expression
k . v = -1 µ p
(9)
From these tests, k was found to be between 3 x 10- 1 and 9 x 10- 1 mm2, giving Ka value between 3 x 10 - 3 and 9 x 10- 3 mm/sec. This range is consistent with the values indicated at the start of wetting, as seen in Figure 12.
Further light may be shed on the source of this high permeability and apparent lack of effective suction by estimating the "effective particle size ," d, which would be expected for a soil with the above range of permeability . Bear (21) suggested the following relationship between k and d:
k = 0.617 x 10 - 9d2 (10)
where k is in mm2 and d is in microns. The effective particle size of the columns compacted at 21 percent moisture content is found to be in the range 0.02 to 0.04 mm. Clearly, these values represent the sizes of particle aggregates, and not of the individual clay particles.
Finally, for a porous medium with pore size of the order of 0.03 mm, the classical capillary model [e .g., Terzaghi (20)] may be used to estimate the suction which can exist within the pores from the following expression :
l(i = 2T, 0.5d (11)
where T, is the surface tension between water and soil; it may be taken as 7 dyne/mm, resulting in an estimated suction of

16
about 9 kPa. This is a very small suction , in contrast to the value of 2 MPa measured in suction tests. It would appear that the high suction is developed within the soil aggregates, but is not relevant to the interaggregate pores where the flow apparently takes place.
On the basis of the above considerations, it is suggested that the advance of the wetting front in highly swelling clay, compacted dry of the plastic limit , involves the following process. Flow occurs through the large, interaggregate pores and is not significantly affected by suction head. As wetting develops, swelling occurs at the surface of the aggregates, resulting in a decrease in the size of the interaggregate pores and consequently in the permeability of the wetted portion of the soil. The process of decreasing permeability continues with time , accompanied by swelling of the soil. This suggested model is consistent with the observations of Tovey et al. (22) from scanning electron micrographs prepared both before and after swelling tests on a clay compacted dry of the plastic limit. These showed that although the overall porosity of the soil increased during swelling, the sizes of the interaggregate pores decreased.
SOIL COMPACTED WET OF PLASTIC LIMIT
Only three soil columns compacted at 30 percent moisture content were tested , two under laboratory conditions and one in the centrifuge. Although these are sufficient to warrant clear-cut conclusions, their results are presented and discussed in the light of the observations made with regards the drier columns.
Figure 13 shows the advance of the wetting front with time. The observation that the rate of advance was similar for all columns immediately suggests that the suction may have been significant at this compaction moisture condition . If the suction ljJ is assumed to be zero, and Equation 4 is used to calculate the average coefficient of permeability , K , at different stages of the wetting process , the values shown in Figure 14 result. In this case, in mnlrast to the dry soil, the assumption of ljJ = 0 does not result in a consistent estimate of K. Suction tests performed on soil compacted at 30 percent moisture content indicated values of the order of 200 kPa. In Figure 15 , the K values have been recalculated from the results of
E u
:c ... a.. ... 0
... z 0
"' ... " z ;::: ... "' JI:
0 10
0
2
" 6
e 10
12
14
16 0 S"1ple
I 8 t;,, S;nple D S"'i'le
TIME (min.)
I 10
6. 00 6.
D oo 6.
g
!l9!M 3.87 l 1, I H • 60 "' 6.87 ; ls 1 H
0 • 15 01
6.87 i 15s I H: • 3.8 m
& 10
0
0
0
20 ~------------------~
FIGURE 13 Depth of wetting front versus time (compaction moisture content 30 percent).
TRANSPORTATION RESEA RCH RECORD 1277
_., 10 ~-------------------.
.~
-e
0 S>npl• t:,. s ... pl• O Sampl•
6.
0 0
10 L.0------.--- -----.--------' 10 10 5
FIGURE 14 Time dependence of average coefficient of permeability of wet soil (compaction moisture content 30 percent; soil suction assumed zero).
u
"' "' ' E E
-o 10
lo:: -6
10
-7
10 0 10
0 Sir11ple !::,. Sample
0 Sample
I 10
0 0
0 0 A 0
1' 0
0
Leqend 3. 67 19 H =60"" 6.87 19 if 0150> 6.87 15g H0=J.8m •
2 10
TIME (min . )
FIGURE 15 Time dependence of average coefficient of permeability of wet soil (compaction moisture content 30 percent; soil suction assumed 200 kPa).
a 10
the three tests, using Equation 2 for hydraulic gradient, with ex = 0.5 and ljJ = 200 kPa . For these conditions, consistent values of Kare obtained from the three tests . It would appear , then, that for soil compacted wet of plastic limit , the suction that is measured in a suction test is effective in the pores through which flow occurs. This observation, if demonstrated by further testing , would suggest a basic difference between the role of suction, as measured by conventional techniques, in the wetting of soils compacted dry and wet of the plastic limit.
Figure 15 again shows K decreasing almost linearly with time on a log-log plot . It appears that the mechanism of swell suggested for the dry soil may also be pertinent for the wetter condition .
CONCLUSIONS
The results of the tests reported in this paper indicate some features of flow through compacted, swelling clay that should

Weisberg and Frydman
be considered when carrying out analyses of field situations. It is clear that generalizations cannot be made on the basis of the limited number of tests performed, but the following observations, which should be verified by further investigations, appear pertinent:
1. There appear to be differences in the flow process in soils compacted below and above the plastic limit. Below the plastic limit, the wetting front is relatively sharp, but it becomes difficult to define the wetting front as a sharp interface between wet and unwet zones as compaction moisture content increases above the plastic limit. Below the plastic limit, suctions appear to have insignificant effect on the rate of advance of the wetting front. The high suctions measured at these moisture contents are apparently developed in the small pores within the soil aggregates, whereas flow advances through the larger, interaggregate pores where the suctions are extremely small . As the compaction moisture content increases above the plastic limit, the size of the aggregates increases and that of the interaggregate pores decreases, and the suctions in the interaggregate pores apparently approach those in the intraaggregate pores. The measured suctions are then significant in controlling the rate of advance of the wetting front. This finding is of major significance in analysis and design of field situations, where the in situ value of soil suction represents one of the basic items of input data.
2. The coefficient of permeability of compacted, swelling soil decreases with time following wetting, despite the fact that the overall porosity of the soil increases due to swelling. It is suggested that the source of this permeability decrease lies in the fact that flow develops through the larger interaggregate pores, leading to swelling on the aggregate surfaces and a resulting decrease in the sizes of these pores. This decrease in pore size results in a decrease in permeability that is approximately linear with time on a log-log scale. At the same time, the intragranular pores increase in size, resulting in an overall increase in the porosity of the soil. The decrease in permeability with time should be taken into account in analysis.
ACKNOWLEDGMENT
The research described in the paper was partially financed by the Department of Soil Conservation and Drainage in the Israeli Ministry of Agriculture. The support of Ezra Henkin, head of the department, is gratefully acknowledged.
REFERENCES
1. J. L. Justo, J. Saura, J. E. Rodriguez, A. Delgado, and A. Jamrillo. A Finite Element Method to Design and Calculate Pier Foundations in Expansive Collapsing Soils . Proc., Fifth International Conference on Expansive Soils, Adelaide, Australia, 1984, pp. 119-123.
2. M. Picornell and R. L. Lytton. Modelling the Heave of a Heavily Loaded Foundation. Proc., Fifth International Conference on Expansive Soils, Adelaide, Australia, 1984, pp. 104-108.
17
3. J. Uzan, R. Baker, and S. Frydman. Characterization of Constrained Swelling of Clay. Transportation Research Record 1137, TRB, National Research Council, Washington, D.C., 1987, pp. 52-58.
4. B . G. Richards. Finite Element Analysis of Volume Change in Expansive Clays. Proc., Fifth International Conference on Expansive Soils, Adelaide, Australia, 1984, pp. 141-148.
5. G. Kassiff, M. Livneh, and G. Wiseman . Pavements on Expansive Clays. Jerusalem Academic Press, Jerusalem, 1969.
6. A. Komornik and J . G. Zeitlen. An Apparatus for Measuring Lateral Soil Swelling Pressure in the Laboratory . Proc., Sixth International Conference on Soil Mechanics and Foundation Engineering, Vol. 1, 1965 , pp. 278-281.
7. A. Ben Shalom. Laboratory Method for Measuring Swelling Potential under Partial Saturation Conditions. M.Sc. thesis, Technion, Israel Institute of Technology, 1970 (in Hebrew) .
8. S. Samoocha. A Method for Measuring Three Dimensional Swell and Shear Strength of Clay Specimens Under Controlled Unsaturated Conditions. M.Sc. thesis. Technion, Israel Institute of Technology, 1971 (in Hebrew).
9. G. Pachas. Swelling of Israeli Clays Under Triaxial Stress Conditions . M.Sc. thesis, Technion, Israel Institute of Technology, 1986.
10. I. Keissar. The Development of a Model for the Prediction of Flow, Strains and Stresses in Expansive Soils. D.Sc. thesis. Technion, Israel Institute of Technology, 1989 (in Hebrew) .
11. W. H. Craig, R. G. James, and A. N. Schofield (eds .). Centrifuges in Soil Mechanics. Balkema, Rotterdam, Netherlands, 1987.
12. K. W. Cargill and H. Ko. Centrifugal Modelling of Transient Water Flow. Journal of Geotechnical Engineering, ASCE , Vol. 109, No. 4, 1983, pp. 536-555.
13. D. J. Goodings. Relationships for Modelling Water Effects in Geotechnical Centrifuge Models. Proc., Symposium on the Application of Centrifuge Modelling lo Geotechnical Design, University of Manchester, 1984.
14. K. Arulanandan, P. Y. Thompson, B. L. Kutter, N. J. Meegoda, K. K. Muraleetharan, and C. Yogachandran. Centrifuge Modelling of Transport Processes for Pollutants in Soils. Journal of Geotechnical Engineering, ASCE, Vol. 114, No. 2, 1988, pp . 185-205 .
15. J. H. Davidson, J. W. Biggar, and D. R. Nielsen. Gamma Radiation Attenuation for Measuring Bulk Density and Transient Water Flow in Porous Materials. Journal of Geophysical Research, Vol. 68, No. 16, 1963 , pp. 4777-4783 .
16. C. G . Gurr. Use of Gamma Rays in Measuring Water Content and Permeability in Unsaturated Columns of Soil. Soil Science, Vol. 94, 1962, pp. 224-230.
17. B. Tsur and B. Pazi. The Measurement of Density and Moisture Co/l/ent of Soil Samples Usi11g Gamma Radit11ion. Agriculturnl Engineering Faculty Technion, Israel In tiiutc of Tcchnol gy, Haifa 1969, (in Hebrew) .
18. D. Leshchinsky, S. Frydman, and R . Baker. Study of Soil Structure Interaction Using Finite Elements and Centrifugal Models. Canadian Geotechnical Journal, Vol. 3, 1981, pp. 345-359.
19. S. Frydman and I. Keissar. Earth Pressure on Retaining Walls Near Rock Faces. Journal of Geotechnical Engineering, ASCE, Vol. 113, No. 6, 1987, pp. 586-599.
20. K. Terzaghi. Theoretical Soil Mechanics. John Wiley and Sons, New York, 1943.
21. J. Bear. Dynamics of Fluids in Porous Media. Elsevier, New York, 1972.
22. N. K. Tovey, S. Frydman, and K. Y. Wong. A Study of a Swelling Clay in the Scanning Electron Microscope. Proc., Third International Conference on Expansive Soils, Haifa, Israel, Vol. 2, 1973, pp. 45-54.
Publication of this paper sponsored by Committee on Environmental Factors Except Frost.