study of pharmaceutical tablets using raman mapping
TRANSCRIPT

University of Mississippi University of Mississippi
eGrove eGrove
Honors Theses Honors College (Sally McDonnell Barksdale Honors College)
Spring 5-9-2020
Study of Pharmaceutical Tablets Using Raman Mapping Study of Pharmaceutical Tablets Using Raman Mapping
Kyle Joseph Pauly University of Mississippi
Follow this and additional works at: https://egrove.olemiss.edu/hon_thesis
Part of the Complex Mixtures Commons, Medicinal Chemistry and Pharmaceutics Commons,
Pharmaceutical Preparations Commons, and the Physical Chemistry Commons
Recommended Citation Recommended Citation Pauly, Kyle Joseph, "Study of Pharmaceutical Tablets Using Raman Mapping" (2020). Honors Theses. 1441. https://egrove.olemiss.edu/hon_thesis/1441
This Undergraduate Thesis is brought to you for free and open access by the Honors College (Sally McDonnell Barksdale Honors College) at eGrove. It has been accepted for inclusion in Honors Theses by an authorized administrator of eGrove. For more information, please contact [email protected].

i
Study of Pharmaceutical Tablets
Using Raman Mapping
By: Kyle Pauly
A thesis submitted to the faculty of The University of Mississippi in partial fulfillment of the requirements of the Sally McDonnell Barksdale Honors College.
Oxford, MS
May 2020
Approved by:
___________________________________ Dr. Nathan Hammer
Advisor
___________________________________
Dr. Gerald Rowland Reader
___________________________________ Dr. Gergory Tschumper
Reader

ii
©2020 Kyle Joseph Pauly
ALL RIGHTS RESERVED
iii
Acknowledgements
Firstly, I would like to thank the University of Mississippi and the Sally McDonnell
Barksdale Honors college for giving me a home and a place to grow for the last four years
of my life. I would also like to thank Dr. Hammer for mentoring me and pushing me to
become a better student and researcher. I am honored to have been a member of The
Hammer Lab as they accepted me with open arms and were there to help me whenever
possible. Specifically, I would like to thank Genevieve Verville, Austin Dorris, and April
Hardin for being my mentors not only in lab but in life. However, none of this would have
been possible without the support of my friends, my parents, Quinn and Anne, and my
siblings, Ryan, Sean and Farryn.

iv
Study of Pharmaceutical Tablets Using Raman Mapping
Kyle Pauly (under the direction of Dr. Nathan Hammer)
Covalent bonds are the strongest type of bonds holding molecules together. Based on the
pattern of bonding of the molecule, the atoms associated with the bond will vibrate at a
specific frequency. Utilizing vibrational spectroscopy, such as Raman spectroscopy, these
unique vibrational frequencies can be used to detect the presence of analytes over a selected
area. Furthermore, the intensities of the vibrational modes can be tracked to comparatively
quantify the concentration of analytes at various locations. This is a method of great
importance due to its ability to compare pharmaceutical tablets synthesized with different
techniques. Here, the presence and concentration of ibuprofen in lipid matrix was observed.
This was done in collaboration with a pharmaceutical lab with the hopes of producing a
higher quality suppository tablet.

v
Table of Contents
Copyrights Page ....................................................................................................... ii
Acknowledgements .................................................................................................. iii
Abstract .................................................................................................................... iv
List of Figures .......................................................................................................... vii
List of Abbreviations ............................................................................................... viii
Chapter 1: Pharmaceuticals ................................................................................... 1
1.1 History of Pharmaceuticals .................................................................. 1
1.2 The Drug Development Process ............................................................ 2
1.3 Ibuprofen ................................................................................................. 4
1.4 Suppositories ........................................................................................... 5
Chapter 2: Raman Spectroscopy ........................................................................... 7
2.1 What is Spectroscopy ............................................................................. 7
2.2 Raman Spectroscopy .............................................................................. 10
2.3 Principles of Raman Spectroscopy ........................................................ 10
2.4 Applications of Raman Spectroscopy ................................................... 14
2.5 Instrumentation of Raman Spectroscopy ............................................. 14
Chapter 3: Raman Mapping ................................................................................... 19
3.1 Principles of Raman Mapping ............................................................... 19
3.2 Applications of Raman Mapping .......................................................... 20
3.3 Raman Mapping of Pharmaceuticals ................................................... 21

vi
Chapter 4: Method Development ........................................................................... 23
4.1 Calibration and Sample Preparation .................................................... 23
4.2 Reference Spectra ................................................................................... 24
4.3 Step Size and Area Mapped ................................................................... 26
4.4 Limitations and Errors of Instrument .................................................. 35
Chapter 5: Conclusions and Future Work ............................................................ 39
References ................................................................................................................ 40

vii
List of Figures
1. Line structure of the S(+) enantiomer of Ibuprofen 5
2. Electromagnetic Spectrum 8
3. Quantum Mechanically Allowed Transitions 9
4. Scattering Patterns of Raman Spectroscopy 12
5. IR and Raman Active Modes of CO2 13
6. Fluorescence versus Stokes Scattering 16
7. Reference Raman Spectra of Ibuprofen and the Lipid Matrix 24
8. Reference Raman Spectra between 1400cm-1 and 1650cm-1 25
9. Composition of Spectra Gathered from 5-micron 12,100µm2 Raman Map 27
10. 12,100µm2 Raman map of Ibuprofen with a 5-micron Resolution 28
11. 12,100µm2 Raman map of the Lipid Matrix with a 5-micron Resolution 29
12. 12,100µm2 Raman map of Ibuprofen with a 2-micron Resolution 31
13. Composition of Spectra Gathered from 2-micron 12,100µm2 Raman Map 32
14. 360,000µm2 Raman Map of Ibuprofen with outlined 12,100µm2 34
Raman Map
15. Composition of Spectra Displaying Baseline Error 35
16. Composition of Spectra Gathered from 25,000,000µm2 area 36
17. 25,000,000µm2 Raman Map of Ibuprofen with 25-micron Resolution 37

viii
List of Abbreviations
FDA Food and Drug Administration
NSAID Non-Steroidal Anti-Inflammatory Drug
COX-1 Cyclooxygenase-1
COX-2 Cyclooxygenase-2
UK United Kingdom
EMS Electromagnetic Spectrum
UV Ultraviolet
IR Infrared
YAG Yttrium Aluminum Garnet
CCD Charged Coupled Device
API Active Pharmaceutical Ingredient
SEM-EDX Scanning Electron Microscopy combined with Energy-Dispersive
X-Ray Spectroscopy
XRPD X-Ray Powder Diffraction
TAT Transactivator of Transcription
MCF Michigan Cancer Foundation
COVID-19 Coronavirus Disease of 2019
1
Chapter 1: Pharmaceuticals
1.1 History of Pharmaceuticals
A pharmaceutical is described as a substance that is used for the diagnosis,
treatment, or prevention of a disease. This substance usually evokes beneficial response
that results in the restoration, correction, or modification of organ functions. This process
has existed for centuries, dating back to ancient civilization consuming medicinal plants
and minerals; however, the pharmaceutical revolution began in the 16th century with the
construction of the first pharmacopoeia in Germany detailing a list of drugs and their
preparation. This resulted in the rapid development of the pharmaceutical industry and has
led to modern pharmaceutical approach.1
At the heart of modern pharmaceuticals in the United States is the Food and Drug
Administration (FDA). This federal government agency was established in 1906 as a result
of the Federal Food and Drugs Act. In addition, this act outlawed the mislabeling and
selling of tainted food, drinks and drugs. This along with the Shirley Act passed in 1911,
which outlawed medication from making false medical claims, were the first steps taken
by the United States in order to make the pharmaceutical industry more scientific field.2
Through trial and error and legislation, the FDA has slowly evolved into its modern form
and, as a result, a five-step drug development process is required for every new medication.

2
1.2 The Drug Development Process
As outlined by the FDA, the drug discovery process consists of five steps: discovery
and development, preclinical research, clinical research, FDA review, and FDA post-
market safety monitoring.
The discovery and development step begins at the research level. As organ systems
and disease become more understood, more molecules are tested to find possible beneficial
effects. Thousands of chemicals are tested, but very few make it to later stages of testing.
After this initial testing, the chemical properties of the molecules must be further studied
to understand how it is absorbed, distributed, metabolized and excreted. This
understanding helps researchers and manufacturers to determine the dosage and best
method of administration. After this, the compound then moves to the preclinical research
stage of development.3
In this stage, in-vitro, test tube and culture tests, and in-vivo, live animal tests, are
performed. Since the toxicity of the compounds are discovered in this step, the in-vivo test
is typically preformed on animals.4 The choice of animal is dependent upon the organ
system of interest and ethicality of the experiment. For example, larger animals, such as
dogs, cats, and non-human primates, are commonly used as models for cardiology,
endocrinology, bone, and joint research. However, a majority of these tests are performed
on mice and rats.5 The goal of this stage of research is to provide more detailed insight
into the dosing and toxicity levels of the compounds before moving into human testing.4
The clinic research stage is typically the most important stage of drug development
process as it is the first stage in which the drugs are tested on humans. Within this stage
of research, there is typically three to four phases of human research. These tests begin

3
small in size, 20-100 people, to confirm the safety and dosage of the drug. After this, the
tests get larger in size and begin to focus in on the efficacy and side effects of the drugs.
The time period of these tests range from a few months to up to four years. If the drug has
evidence of effectiveness and is seemingly safe, the drug developer files an application to
the FDA to market the drug.6
This application must include the proposed labeling, safety, dosing, and directions
of use. In addition, all of the studies, data, and analysis have to be shared with the FDA.
Once this application has been completed, the review team analyzes the sections of
application based on the specialties of the individual reviewer. For example, a
pharmacologist will review the data from animal studies. As well as reviewing the
application, the laboratory is also inspected for any signs of fabrication, or withheld data.
The review team has six to ten months to make a decision on whether or not to approve the
drug. After this total review, the review team offers a recommendation to a senior FDA
official who makes the final decision regarding the marketing of the proposed drug.7
Once a drug hits the market, the FDA continues to monitor its safety and efficacy.
The FDA also monitors advertisement to ensure the information provided is truthful and
sufficiently describes the side effects. This is a continuing process that lasts the entire
length of product’s lifetime in the marketplace. Lastly, when the initial patents of the drugs
expire, generic brands can be made following the original instructions, and do not require
the manufacturers to undergo as rigorous of testing since this was already done when the
initial patent was filed for.8
In this thesis, the stage of development that was concentrated on was discovery and
development. The collaborator to this experiment provided samples mixed in various ways
4
with a novel instrument to be analyzed using Raman mapping. The goal of this was to
provide experimental data to ensure the proper mixing and an even distribution of the active
ingredient. Once the method was established, the goal was to then analyze a sample with
more active ingredients.
1.3 Ibuprofen
The initial active ingredient analyzed was ibuprofen. This drug is a propionic acid
derivative that was introduced in 1969 as an alternative to aspirin. Today, it has become
the most commonly used and prescribed non-steroidal anti-inflammatory drug (NSAID).
Its function is to inhibit cyclooxygenase-1 (COX-1) and cyclooxygenase-2 (COX-2),
which are enzymes involved in the synthesis of prostaglandins. These prostaglandins are
lipid autacoids that play a key role in the inflammatory response.9 Inflammation is a
response by the immune system to infection and injury. Typically, inflammation is a
healthy and beneficial response as it leads to the removal of offending factors and restores
tissue and physiological function. However, these prostaglandins also play an important
role in the production of pain and, therefore, are a key target for pain reducing drugs.10 In
addition, due to its single chiral center, there exists two enantiomers: R(-) and S(+). The
S(+) enantiomer inhibits the cyclooxygenases, whereas the R(-) enantiomer becomes
involved in the lipid metabolism pathway and is incorporated into triglycerides.
Interestingly, 50-60% of the R(-) undergoes metabolic inversion to the S(+) enantiomer
depending on the dosing situations. Therefore, due to the safety and inversion of the
enantiomers, ibuprofen is typically taken as a racemic mixture.11 The structure of the S(+)
enantiomer of Ibuprofen is shown in Figure 1.

5
Figure 1. Line structure of the S(+) enantiomer of Ibuprofen.
Ibuprofen is typically taken orally with a potency of 200 to 800 mg. It is available
as an over the counter medication and has been rated as the safest conventional NSAID in
the UK. It has a maximum daily dose of 3200 mg, with over dosage resulting in seizures,
apnea, and hypertension9. It has been shown to have therapeutic application for patent
ductus arteriosus, rheumatoid and osteo-arthritis, cystic fibrosis, orthostatic hypotension,
dental pain, dysmenorrhea, fever, and headaches.9
1.4 Suppositories
There are six general routes of entry into the body for drug administration. In order
of fastest to slowest central nervous system response, these are: intravenous, inhaling,
snorting, oral, and rectal.12 Suppositories often follow the rectal route of entry. Though its
absorption is typically slow, it offers many advantages as well. By avoiding the stomach,
acidic and enzymatic degradation of the drug can be avoided as well as irritation of the
stomach and small intestine. In addition, these medications can be taken before surgeries
and by patients with upper gastrointestinal diseases. Furthermore, the delivery of the
medication can be stopped in cases of accidental overdose by simply removing the
suppository.13
O
OH

6
Rectal suppositories are typically inserted as a solid, and then are slowly dissolved
within the body. The medication is then taken up by the epithelial cells lining the rectum.
From here, the medication passes through the lower and middle hemorrhoid veins and enter
systemic venous circulation via the internal iliac veins.13 Due to this mode of entry, the
medication circumvents the liver and, therefore, does not undergo first pass metabolism.
This increases its bioavailability.13

7
Chapter 2: Raman Spectroscopy
2.1 What is Spectroscopy?
Spectroscopy is defined as the study of interactions between light and matter. Light
is electromagnetic radiation with a consistent speed depending on the medium that it travels
through. In addition, light has a characteristic referred to as wave-particle duality. This
principle states that light exhibits properties of both waves and particles. This particle is
referred to as a photon.14 An understanding of both of these properties is required for
spectroscopy as the energy of this photon of light is determined by its wavelength. This
theory which is shown in Equation 1.1 was proposed by Einstein who postulated that the
amount of energy, E, carried by a photon depends on its frequency, ν, multiplied by
Planck’s constant, h.14
E = hν (1.1)
Furthermore, frequency is equal to the speed of light, c, divided by its wavelength, λ. This expands Equation 1.1 into Equation 1.2:
(1.2)
Planck’s constant, 6.626 x 10⁻³⁴ J•s, and the speed of light, 3.00 x 10⁸ m/s, are both
constants. Therefore, there is an inversely proportional relationship between the energy
and wavelength of light. The full range of wavelengths and their corresponding energies
is shown in Figure 2.
E = hcλ

8
Figure 2. Electromagnetic Spectrum.
At the core of the interaction between light and molecules is the concept that atoms
and molecules exist at well-defined energy levels. Quantum chemistry defines four
primary energy levels for molecules: electronic, vibrational, rotational, and translational.15
Due to their lack of bonding, only electronic and translational energy levels exist for atoms.
These energy levels can be experimentally analyzed with light due to the fact that a photon
can only be absorbed or emitted if its energy is equivalent to the energy gap between two
atomic or molecular quantum energy states.15 Typically, the magnitude of these transitions
is as follows: Electronic > Vibrational > Rotational > Translational15. A schematic
depicting these transitions is shown in Figure 3. Based on this understanding, different
energy level transitions result from different regions of the EMS. For example, Electronic
transitions are comparatively large, so high energy light, such as ultraviolet (UV) or visible
light, must be used to probe these transitions. On the other hand, lower energy light, such
a microwave, is needed to probe rotational transitions. Therefore, spectroscopic
instruments typically utilize specific regions of the EMS to analyze the unique molecular
transitions of analytes.15 For example, IR spectroscopy, as the name suggests, analyzes the
absorption of infrared light by a molecule. IR spectroscopy is a form of vibrational
spectroscopy and its absorption arises from a net change in dipole moment of a molecule.
Dipole moment refers to the magnitude of the charge separation in polar covalent bonds.
Wavelength (m)
Form of Radiation
Frequency (Hz)
Gamma Rays X-rays Ultraviolet Infrared Microwaves Radiowaves
Visible Light
10-14 10-12 10-9 10-6 10-3 1 103
1024 1020 1016 1012 108 104

9
Therefore, only asymmetric vibrational modes can be analyzed with this technique as the
net charge separation of symmetric vibrational modes is always zero.15
Figure 3. Quantum Mechanical Transitions.
Ener
gy
Internuclear separation
Ground State
Excited Electronic State
Elec
troni
c Tr
ansi
tion
Vibrational Transition
Rotational Transition

10
2.2 Raman Spectroscopy
When analyzing benzene with a mercury lamp, Sir C.V. Raman observed an
unexpected wavelength in the light scattered from benzene. This became known as the
Raman Effect and the unknown spectrum he observed was the Raman spectrum of benzene.
As he explored this phenomenon more, he found that, regardless of the excitation
wavelength, the change in wavelength was consistent for a given molecule.15 However,
Sir Raman, was not the first person to observe scattering. Previously, Lord Rayleigh had
explained that the color of the sky was due to the elastic scattering of light by the molecules
in the atmosphere.16 As a result, the ideas of these great minds combined to form the
foundation of Raman spectroscopy.
2.3 Principles of Raman Spectroscopy
Complementary to IR, Raman spectroscopy is also a form of vibrational
spectroscopy. Rather than absorption or emission of light, Raman spectroscopy occurs due
to the scattering of photons by a molecule. This scattering is best described as an
absorption of light by a molecule to excite it to a virtual state, which is nearly immediately
followed by the emission of light.15 As opposed to other forms of spectroscopy, this virtual
state can exist at any energy level. Yet, so as to not break any quantum rules, this virtual
state exists for around 10-13 seconds and is only achievable under strong electromagnetic
conditions.15 These conditions are supplied by the laser. After this virtual state is achieved,
the photon will then be emitted by the molecule. There are three possible emission patterns
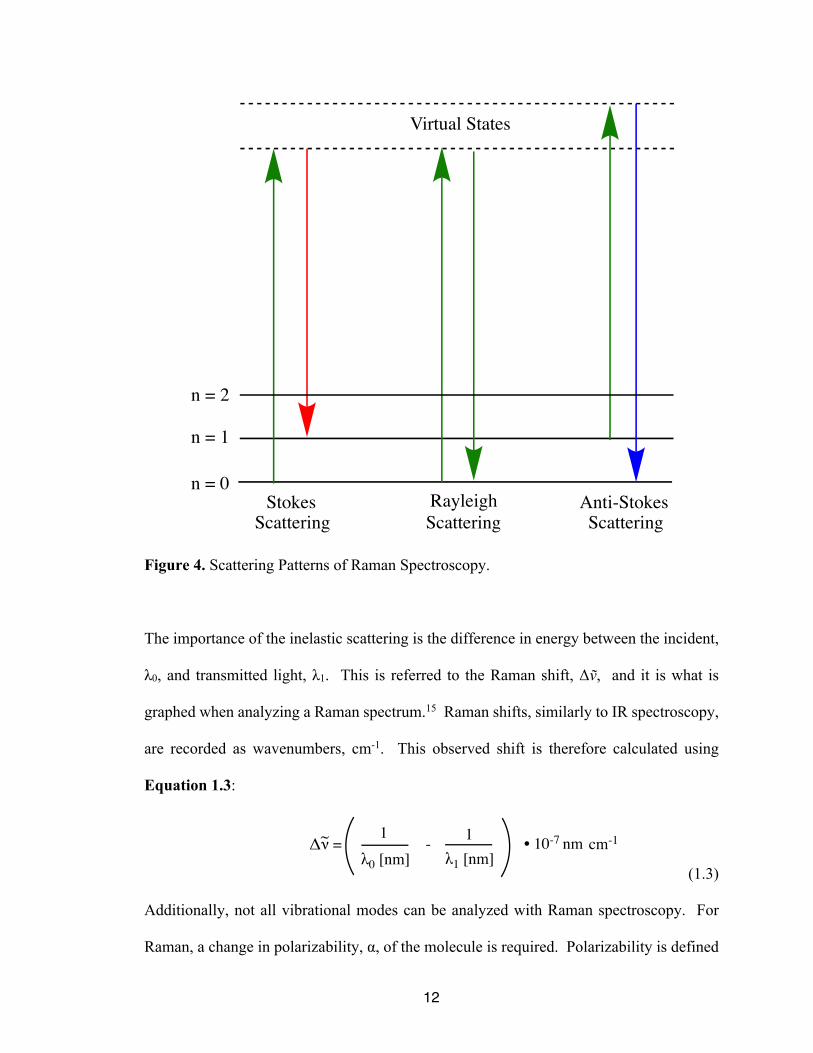
for this photon. The first of these is Rayleigh scattering. If the molecule, originally in a
ground state, is excited up to the virtual state and then falls back into the ground state,

11
Rayleigh scattering has occurred. As previously stated, this is an elastic form of scattering
as the incident and emitted light have the same energy. This is not useful for Raman
spectroscopy because no molecular properties are revealed.15 Therefore, the only useful
scattering patterns for Raman spectroscopy are inelastic scattering in the forms of Stokes
and anti-Stokes scattering. Stokes scattering occurs when the molecule, originally in the
ground state, is excited to the virtual state. This time, however, it falls into an excited
vibrational state. Therefore, the emitted photon now has less energy as some energy was
absorbed by the molecule.15 Finally, anti-Stokes scattering occurs when the molecule is
already in an excited vibrational state. When the molecule emits a photon, the electron
returns to the vibrational ground level; this causes the emitted photon to be higher in energy
than the incident photon. Anti-Stokes is the rarest form of scattering as it requires the
molecule to be in an excited vibrational state before analysis. However, the incidence of
anti-stokes scattering can be increased by heating the sample.15 For research purposes
though, only Stokes scattering is typically observed. The Raman scattering patterns are
shown in Figure 4.
12
Figure 4. Scattering Patterns of Raman Spectroscopy.
The importance of the inelastic scattering is the difference in energy between the incident,
λ0, and transmitted light, λ1. This is referred to the Raman shift, Δṽ, and it is what is
graphed when analyzing a Raman spectrum.15 Raman shifts, similarly to IR spectroscopy,
are recorded as wavenumbers, cm-1. This observed shift is therefore calculated using
Equation 1.3:
(1.3)
Additionally, not all vibrational modes can be analyzed with Raman spectroscopy. For
Raman, a change in polarizability, α, of the molecule is required. Polarizability is defined
n = 0
n = 1
n = 2
Virtual States
StokesScattering
Rayleigh Anti-StokesScatteringScattering
Δν =1 1- • 10-7 nm cm-1
λ0 [nm] λ1 [nm]~
13
as the difficulty of an external electronic field to distort the electron cloud of an atom of
molecule.15 This concept is shown in Equation 1.4.
µinduced=αE (1.4)
µinduced is defined as the induced dipole moment and E refers to the external electric field.
A change in polarizability is observed during symmetric stretching modes of molecules.
This is because the simultaneous stretching and compressing of adjacent bonds
significantly changes the electron cloud of a molecule.15 Antisymmetric modes, other the
other hand, will not undergo a change in polarizability because the relative distances
between the atoms are all the same. Furthermore, bending modes are also generally Raman
inactive. This is because the change in polarizability is symmetric throughout bend,
therefore there is no net change in polarizability.15 Interestingly, vibrational modes that
are IR active are typically Raman inactive and vice versa. A common example of this
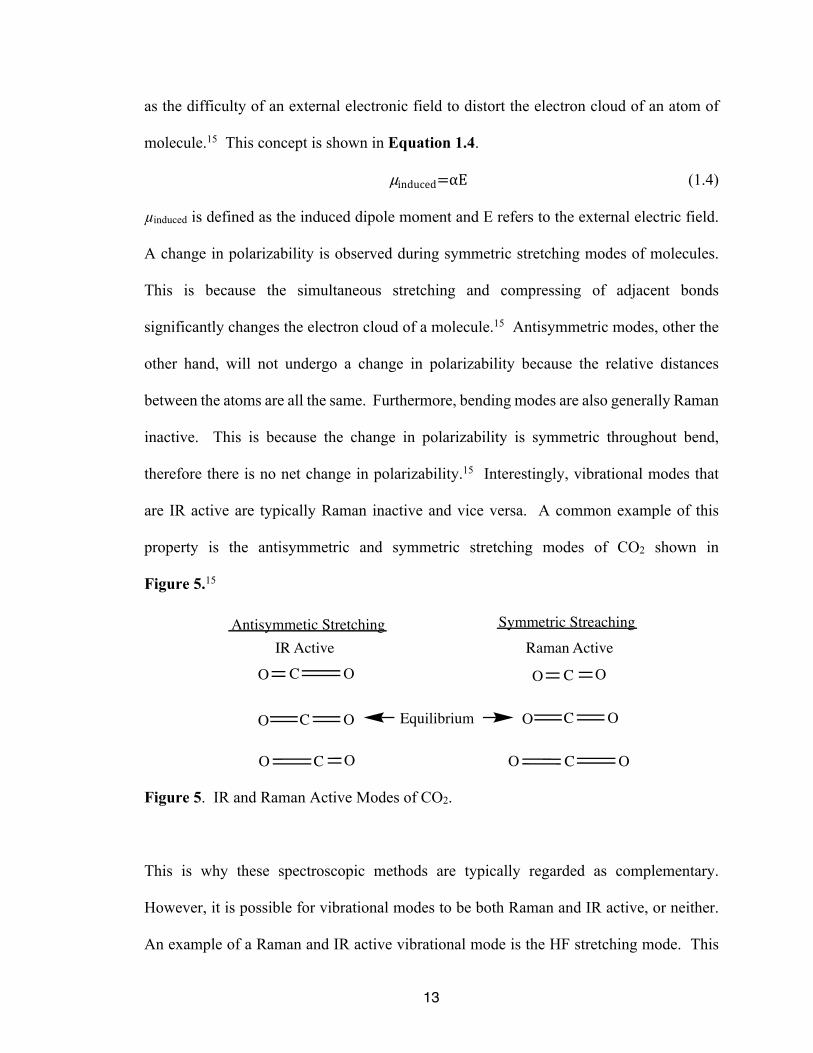
property is the antisymmetric and symmetric stretching modes of CO2 shown in
Figure 5.15
Figure 5. IR and Raman Active Modes of CO2.
This is why these spectroscopic methods are typically regarded as complementary.
However, it is possible for vibrational modes to be both Raman and IR active, or neither.
An example of a Raman and IR active vibrational mode is the HF stretching mode. This
CO O
C OO
CO O
C OO
Antisymmetic Stretching Symmetric Streaching
IR Active Raman Active
CO O CO OEquilibrium

14
is because both the polarizability and dipole moment change as the molecule stretches and
compresses. Both these methods, when used in conjunction will provide the best overall
understanding of the nature of the vibrational modes in the analyzed molecules.15
2.4 Applications of Raman Spectroscopy
Raman spectroscopy has become an increasing common analytical technique. Its
main application is the identification of organic, inorganic, and biological samples.15 In
fact, most applications where a non-destructive, microscopic, chemical analysis, and/or
imaging technique is required can be probed with Raman spectroscopy.17 This is
accomplished by comparing the observed spectral peaks with characteristic group
frequencies.18 From these observed peaks, insights about the molecule’s vibrational modes
are gathered, as well as its interactions with solvent molecules.19,20 In addition, this method
can also be used to confirm the presence of molecules in complex mixtures by identifying
molecule specific peaks within the obtained spectrum.21 Furthermore, this form of
spectroscopy is not limited by the phase of the analyte. Solids, liquids, gases, gels, slurries,
and powders can all be analyzed with Raman Spectroscopy.17
2.5 Instrumentation of Raman Spectroscopy
The components of a typical Raman spectrometer include a radiant source, a
wavelength discriminator, filters, and the detector. Typically, the radiant light source for
Raman spectroscopy is a laser in the visible range of the EMS.15 The visible region is
usually an ideal option of light source for Raman spectroscopy because an optimal Raman
light source excites the molecule without inciting electronic absorptions, as this would

15
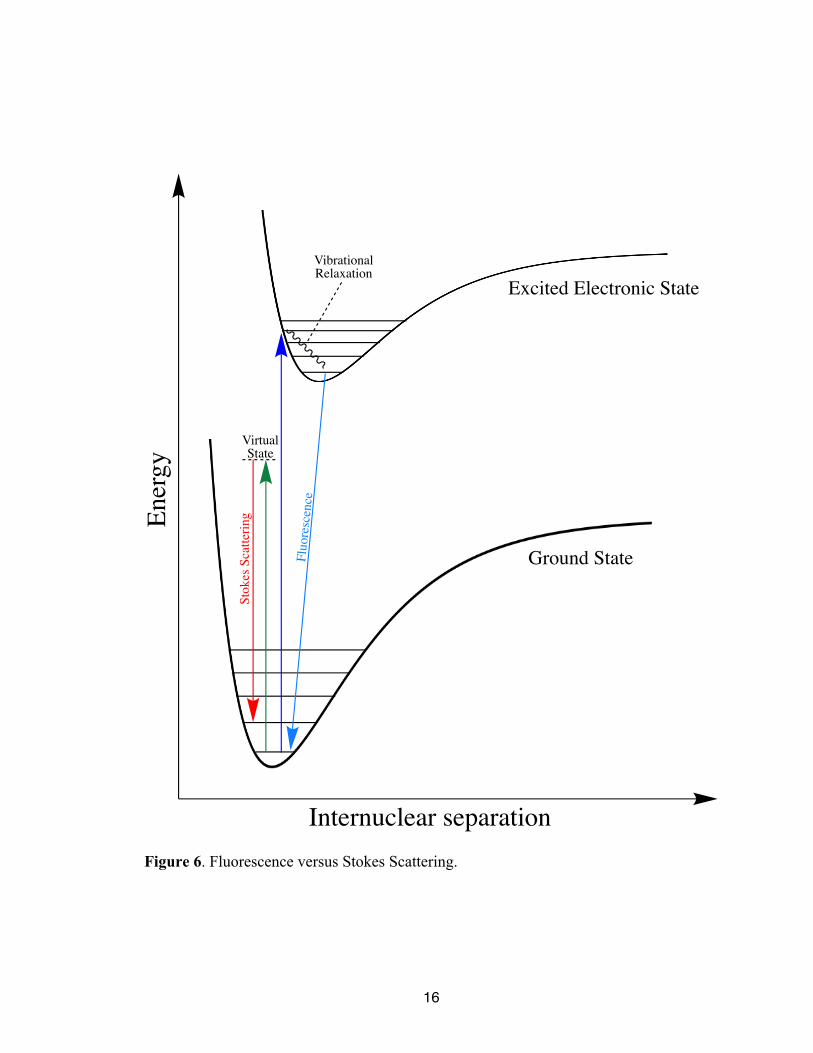
result in fluorescence which would overwhelm the Raman signals.15 The chosen laser
should possess sufficient energy such that the virtual state is higher in energy than the
vibrational levels of the ground electronic state, allowing for analysis of all possible
vibrational states. In order to further show this, a comparison between stokes scattering
and fluorescence are shown below in Figure 6. Common Raman lasers include argon ion
lasers (488 nm or 514 nm), diode lasers (785 nm or 830 nm), Nd:YAG lasers (532 nm or
1064 nm), and neon-copper lasers (248 nm).15
16
Figure 6. Fluorescence versus Stokes Scattering.
Ener
gy
Internuclear separation
Ground State
Excited Electronic State
Virtual State
Stok
es S
catte
ring
Fluo
resc
ence
VibrationalRelaxation
17
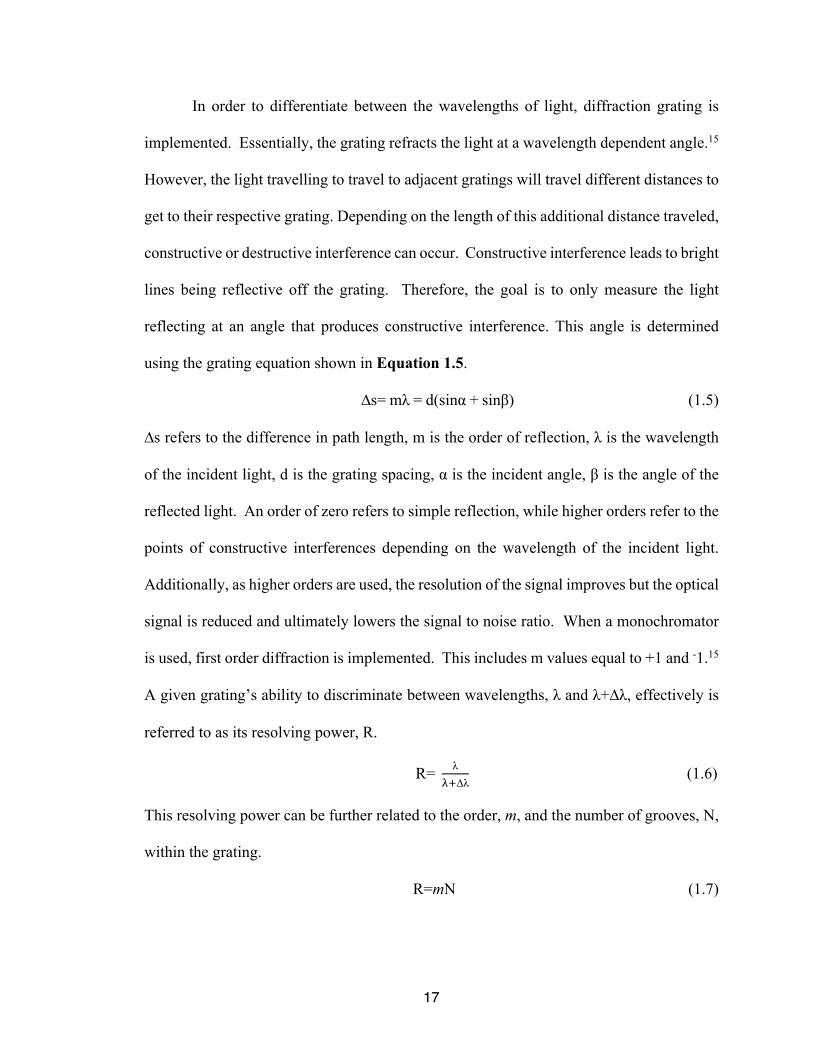
In order to differentiate between the wavelengths of light, diffraction grating is
implemented. Essentially, the grating refracts the light at a wavelength dependent angle.15
However, the light travelling to travel to adjacent gratings will travel different distances to
get to their respective grating. Depending on the length of this additional distance traveled,
constructive or destructive interference can occur. Constructive interference leads to bright
lines being reflective off the grating. Therefore, the goal is to only measure the light
reflecting at an angle that produces constructive interference. This angle is determined
using the grating equation shown in Equation 1.5.
∆s=mλ=d(sinα+sinβ) (1.5)
∆s refers to the difference in path length, m is the order of reflection, λ is the wavelength
of the incident light, d is the grating spacing, α is the incident angle, β is the angle of the
reflected light. An order of zero refers to simple reflection, while higher orders refer to the
points of constructive interferences depending on the wavelength of the incident light.
Additionally, as higher orders are used, the resolution of the signal improves but the optical
signal is reduced and ultimately lowers the signal to noise ratio. When a monochromator
is used, first order diffraction is implemented. This includes m values equal to +1 and -1.15
A given grating’s ability to discriminate between wavelengths, λ and λ+∆λ, effectively is
referred to as its resolving power, R.
R= λ'(∆λ
(1.6)
This resolving power can be further related to the order, m, and the number of grooves, N,
within the grating.
R=mN (1.7)

18
In addition to grating, filters are also implemented to block the Rayleigh scattered light
while allowing Raman scattered light pass through.15 Finally, a detector is used to convert
the electromagnetic energy of the scattered photons into an electrical energy. The most
common detector in modern Raman spectrometers are silicon charge coupled device
(CCD) detectors. This detector is sensitive to electromagnetic radiation between ~400 and
~1,000 nm. This detector can be further enhanced through cooling which reduces the
thermal noise and, therefore, increases the signal to noise ratio.15
Additional components can be added to the Raman spectrometer to improve its
functionality.

19
Chapter 3: Raman Mapping
3.1 Principles of Raman Mapping
Raman mapping is a branch of Raman spectroscopy. In fact, in order to perform
Raman mapping, the instrumentation remains the same, but a motorized x-y-z stage must
be fitted onto the instrument to move the sample from point to point.22 In principle, Raman
mapping involves collecting spectral data over a defined area or volume.19 In addition to
Raman mapping, another similar method is referred to as Raman imaging. The function of
both of these methods is to analyze spectra over an area, but the difference revolves around
sample movement. In Raman mapping, the sample is moved, but in Raman imaging, the
area of the CCD is utilized by recording the spectra at each pixel within the detector. Due
to the typically large area of the CCD detector, the sample can be analyzed at multiple
points simultaneously without sample movement.19 However, wavelengths of light must
be analyzed individually, slowing the process. Here, the process of Raman mapping is
expanded upon.
As previously stated, Raman mapping involves the translational motion of the
sample. As the sample moves from point to point, a point source is used to capture the
Raman spectra at each location.19,22,23 From here, two common approaches can be
implemented to analyze the Raman maps: univariate and multivariate. In the univariate
approach, reference samples of the individual constituents are analyzed and spectral-
specific bands that are free of interferences from other constituents are used to classify the
analytes within the system.19,24,25,26 These bands are then further characterized by their
position, area, or height. In comparison, multivariate methods do not require prior spectral

20
information and improves interpretation of results. Within this method, each component
receives a score or parameter, which is mapped at each location analyzed.19,22 This score
or parameter is based on the agreement to theoretical or reference spectra and the intensity
of the peak.19,25,27
3.2 Applications of Raman Mapping
Regardless of the method of analysis, the goal is typically to produce a composite
imagine illustrating the distribution of all of the components within the analyzed area.19
By classifying molecule specific peaks, the presence of the analytes can be determined at
the various points in the mapped area. In addition to these qualitative studies, quantitative
studies can also be performed with this technique. The rarity of Raman scattering plays a
key role in this as increasing the concentration of analyte increases the chances of Raman
scattering occurring if all other experimental parameters are held constant.15,19,28
Furthermore, if calibrated with reference material of known concentrations, a calibration
curve can be created to determine the concentration of analyte throughout the analyzed
area.28 However, without a calibration curve, the intensities can still be used to
comparatively quantize the concentrations of analyte within the system if experimental
parameters are consistent.19
In addition to producing composite images, Raman mapping can also be used to
gather spectroscopic information about a system over a larger area. To ensure a
comprehensive spectrum is obtained, individual Raman spectra can be collected at various
spatial locations, as would be done for a composite image, and then averaged.29 This
method becomes when useful when analyzing large analytes such as protein. For example,

21
this strategy was used to observe the aggregation of α-synuclein amyloids, which are
present in large amounts within Lewy bodies. These Lewy bodies are a diagnostic hallmark
of Parkinson’s disease, so understanding their formation is of great importance.29
3.3 Raman Mapping of Pharmaceuticals
The most common use of Raman mapping within the pharmaceutical industry is to
track the distribution of the active pharmaceutical ingredient (API) for their density and
blending distribution pattern. Multiple components can be tracked simultaneously with
this technique. Understanding the distribution of API in tablets is of particular interest
because the drug release rate is primarily determined by the distribution of the drug.19 In
addition, from the Raman maps, the particle size and spatial distribution of the API can be
estimated leading to consistent production of products.27 This is important because it can
give insights about the manufacturing process and can then lead to optimization. In fact,
Raman Mapping can be implemented at each step of the manufacturing process to monitor
and check for induced transitions and then check for drug stability to determine shelf life.26
An example of this is an experiment in which Raman mapping was implemented to
characterize the API and cyclodextrin formulations. This is important as cyclodextrins
improve the dissociation characteristics of drugs. 0.8mm2 to 1mm2 maps were produced
with step sizes of 40µm. Three peaks that were specific to the API at 1581cm-1, 1586cm-1
, and 1372cm-1 were determined to be markers for the API. Therefore, changes in these
peaks would indicate formation of an API-cyclodextrin formation. Six different forms of
cyclodextrins were analyzed and the formation of the API-cyclodextrin were analyzed over
the mapped area. This data was then compared to the results obtained via scanning electron
22
microscopy combined with energy-dispersive X-ray Spectroscopy (SEM-EDX) and X-ray
powder diffraction (XRPD). The results showed that Raman mapping is an effective to
characterize the API-cyclodextrin formation over the analyzed area.30
Raman maps can be taken at different points of the drug dissolution process. This
can give provide information about the physical changes that occur during the drug release
progress and ensure a consistent release of the API.31 In addition to analyzing tablets,
Raman mapping has also been employed to observe cellular uptake.19,32 This was
accomplished by tracking the uptake of unmodified and TAT peptide modified liposome
into human breast carcinoma MCF-7 cells over 24 hours. To ensure proper detection, both
of the analyzed liposomes were deuterated in order to distinguish them within the cells.32
As will be discussed further, the limitations of Raman mapping arise due to the time
required to collect data. Typically, areas analyzed with Raman range from 25µm2 to
~10mm2.19 However, as the area analyzed gets larger, the time of acquisition increases as
well. As instrumentation improves, it will open the door to new applications and make it
an even more powerful technique.

23
Chapter 4: Method Development
In this experiment, the goal was to analyze the distribution of API within a
suppository tablet using Raman mapping. However, due to this being a relatively novel
technique to the laboratory, the entire method of analysis needed to be constructed. The
underlying issues that were initially confronted were: the classification of the ingredients,
the time taken to analyze, the area of analysis, and the construction of a 3D representation
of the whole suppository. In order to better define the method, a suppository containing
just two ingredients, ibuprofen and a lipid matrix, was analyzed. Understanding this,
reference spectra of pure samples of the individual analytes were gathered. From this,
spectral-specific bands could be selected to monitor the analytes. Additional testing could
then be performed to further optimize the time and area of analysis.
4.1 Calibration and Sample Preparation
In order to ensure consistent and precise measurements, the Raman spectrometer
was calibrated before collecting any data. This was done by obtaining the Raman shift for
a silicon wafer. Crystalline Silicon has a distinct peak at 520 cm-1 relative to the laser line,
so aligning the detector with this known value establishes that the data produced by the
instrument is accurate.33 In terms of sample preparation, it was previously established that
Raman requires little to no sample preparation. However, due to the large shape of the
suppository, cross sections had to be collected by slicing the suppository with a utility blade
which had proved successful in a previous experiment.34 Care was taken to have the cross
sections be as flat as possible so avoid the laser coming out of focus which can lead to
signal fluctuations.27

24
4.2 Reference Spectra
A univariate approach was applied to this experiment. Therefore, spectral-specific
peaks with good clarity and separation were needed for each of the analyzed molecules.
To accomplish this, reference spectra of pure ibuprofen and the lipid matrix were obtained
as shown in Figure 7. The 532nm Nd:YAG laser with 100x objective, 100% laser power,
and a 600 gr/mm grating with a 10 second acquisition time for 3 acquisitions was employed
to record these reference spectra.
Figure 7. Reference Raman Spectra of Ibuprofen and the Lipid Matrix.

25
When analyzing the reference spectra, a distinct peak for Ibuprofen can be seen at
1610cm-1. This likely represents a C=C stretching mode.35 In addition, the lipid matrix
contains unique vibrational modes from ~1410cm-1 to 1490cm-1. This likely correlates to
CH2 and CH3 bending modes.35 Ibuprofen also contains vibrational modes within this
region, but the peak at 1442cm-1 is significantly more intense as was easily observed in
samples containing both the ibuprofen and the lipid matrix. Therefore, it was hypothesized
that the presence of both of these analytes could be tracked within the region of 1400cm-1
and 1650cm-1 as has been done in similar experiments.36 This region and the analyte
specific modes are shown below in Figure 8.
Figure 8. Reference Raman Spectra between 1400cm-1 and 1650cm-1.
In addition to the univariate approach, a multivariate approach was also
implemented. However, with the multivariate approach, small deviations in peak position

26
from the reference peaks lead to drastic changes in the outputted intensities displayed
within the composite images produced. Using the univariate approach, the peak heights
over a small range of wavenumbers could be analyzed allowing for these small deviations
to be analyzed without skewing the results, producing more precise results.
4.3 Step Size and Area Mapped
As mentioned earlier, a Raman map is obtained by gathering the spectral data over
a defined area. Over this area, the translational stage moves to allow the sample to analyzed
uniformly with a specified distance between the points. The distance between these points
is important due to the particle size of the analytes. If the step size is significantly larger
than the particle size, the distribution of analytes will not be represented correctly as the
laser spot is typically around 1µm.2,21,24,34 Furthermore, the smaller the step size, the longer
it will take to analyze the area21. Therefore, initially a 110µm2 area with a step size of 5µm
was analyzed. This was performed with the 532 Nd:YAG laser, 100% power, and a
600gr/mm grating with an acquisition time of 3 second for 2 acquisitions at each analyzed
point. The EMS region of 1400cm-1 to 1650cm-1 was used. A compilation of all of the
spectra gathered during analysis is shown below in Figure 9.

27
Figure 9. Composition of Spectra Gathered from 5-micron 12,100µm2 Raman Map.
From these spectra, the peak at ~1610cm-1 can be clearly seen as well at the broad
peaks for the lipid matrix from 1410cm-1 to 1470cm-1. There is less clarity to these peaks
due to the relatively short time and number of acquisitions. However, this quickened time
is necessary as these spectra were gathered over the course of six hours. Small increases
in these parameters result in significantly more time being required to perform these
analyses. Still, the distribution of ibuprofen and lipid can be determined with this method.
As these spectra were gathered at distinct locations over the mapped area, it was possible
to produce the Raman maps. Using the univariate technique, Figure 10 and Figure 11
were produced from this data.

28
Figure 10. 12,100µm2 Raman map of Ibuprofen with a 5-micron Resolution.

29
Figure 11. 12,100µm2 Raman map of the Lipid Matrix with a 5-micron Resolution.

30
Within the ibuprofen image, a bright red square can be seen in the center of the
image. This correlates to the very intense peak at ~1610cm-1 seen in Figure 9. This further
indicates that a high concentration of ibuprofen is present at this location. However, this
also presents as drawback of this method. Due to this point being significantly more
intense, the significance of the rest of the points is underestimated. There could be a
substantial amount of analyte at other locations that is now being treated as a miniscule in
comparison to this point.
Information about the suppository is also revealed from the lipid Raman map.
Within the region designating the lipid matrix, peaks were consistently seen with intensities
between 150 and 220 counts, signifying a near homogenous distribution of the lipid within
the matrix. Based on this assumption, further testing was conducted over a shorter
wavelength range in an effort to make a more efficient test.
To confirm the results of this test, another test was performed on this same region
of the suppository, but a 2µm step size was utilized. All other parameters were held
constant. The spectra and composite image are shown in Figure 12 and Figure 13,
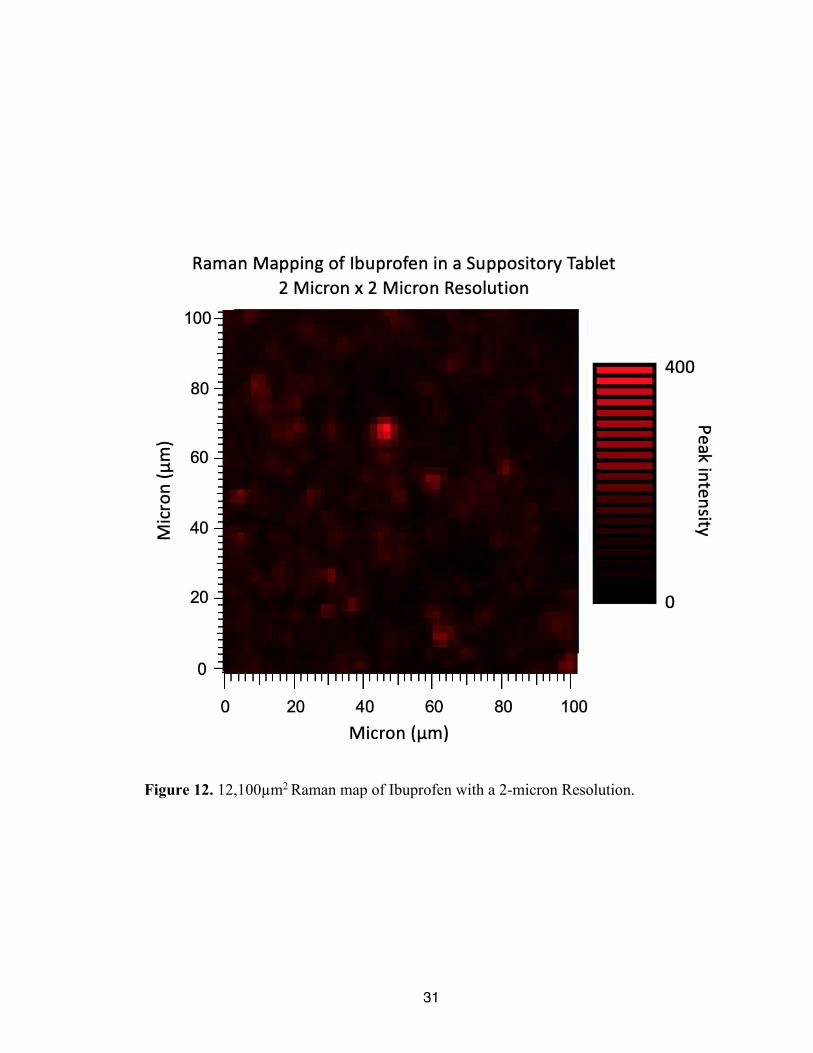
respectively. From the figures, a very similar distribution of analyte is seen, as well as the
intense peak seen towards the center of the gathered image. This supports the conclusion
that the distribution was properly captured at the lower resolution. In addition, the spectra
for this 2µm image were taken over the course of 17 hours further supporting the necessity
for a more efficient method.
31
Figure 12. 12,100µm2 Raman map of Ibuprofen with a 2-micron Resolution.
32
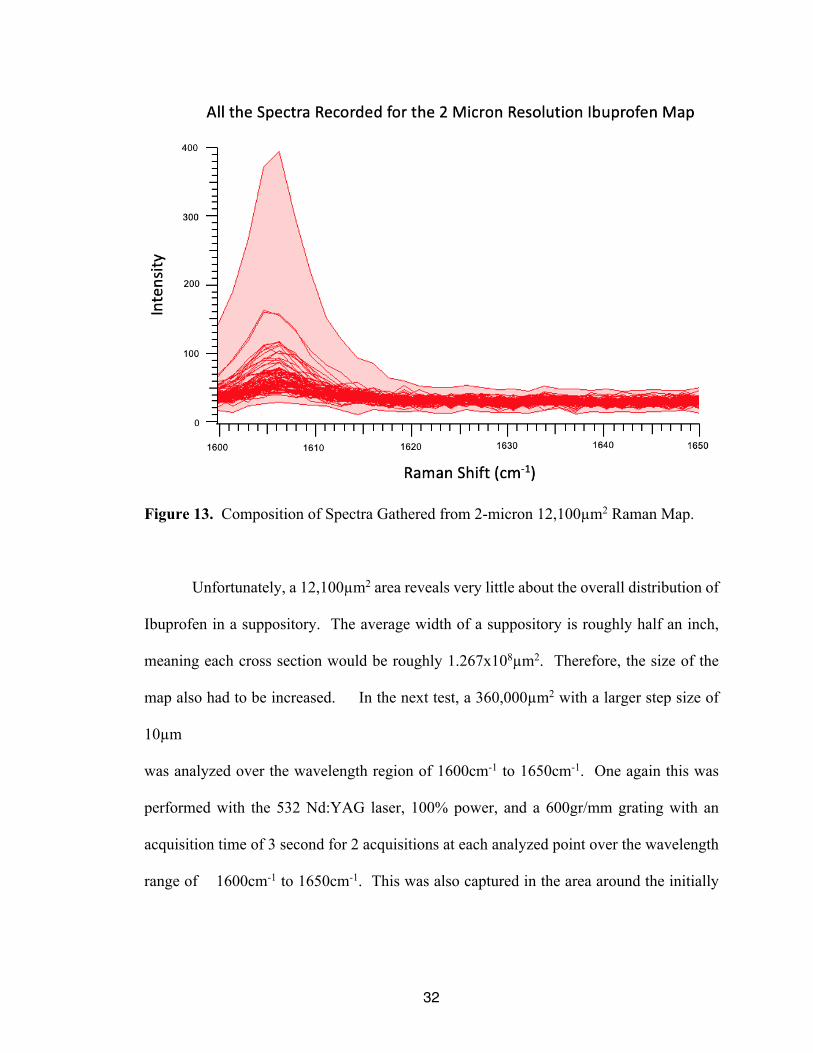
Figure 13. Composition of Spectra Gathered from 2-micron 12,100µm2 Raman Map.
Unfortunately, a 12,100µm2 area reveals very little about the overall distribution of
Ibuprofen in a suppository. The average width of a suppository is roughly half an inch,
meaning each cross section would be roughly 1.267x108µm2. Therefore, the size of the
map also had to be increased. In the next test, a 360,000µm2 with a larger step size of
10µm
was analyzed over the wavelength region of 1600cm-1 to 1650cm-1. One again this was
performed with the 532 Nd:YAG laser, 100% power, and a 600gr/mm grating with an
acquisition time of 3 second for 2 acquisitions at each analyzed point over the wavelength
range of 1600cm-1 to 1650cm-1. This was also captured in the area around the initially
33
analyzed 12,100µm2 area to determine if the original distribution could be seen within the
larger map.
This map is shown below in Figure 14 along with an outline containing the original
12,100µm2 area.
Looking at the outlined area within the composite image, the distribution of
ibuprofen was still be reliably captured. Thus, it can be assumed that the distribution was
correctly measured throughout the entire scan. Therefore, these were the parameters that
were used to conduct further testing.

34
Figure 14. 360,000µm2 Raman Map of Ibuprofen with outlined 12,100µm2 Raman Map.

35
4.4 Limitation and Errors of Instrument
It was around this time, that the laser began experiencing issues. The first of these
issues pertained to the baseline intensity. As can be seen in Figure 9 and Figure 13, the
baseline intensity stays relatively constant. However, spectra like the ones seen in Figure
15 were soon regularly produced. The cause of this error was unknown, but it led to
baseline intensities that varied from 100 to 500 counts. This was a significant issue due to
the method of analysis implemented. Using the univariate method of data analysis, the
peak hieght is of great importance, but, with this error, a small signal may be greatly
intensified solely based on the intensity of the baseline leading to very inaccurate results.
To account for this, a baseline correction was applied to each of the gathered spectra.
Interestingly, this also led to curvature within the baseline, producing broad peaks within
the region of 1525cm-1 and 1575cm-1. Luckily, the peaks around 1610cm-1 and 1435cm-1
for Ibuprofen and the lipid matrix are still reliable seen. This is shown in Figure 16.
Figure 15. Composition of Spectra Displaying Baseline Error.

36
Another, issue that was experienced was laser pulsing. With this issue, the intensity
of the laser light would fluctuate. This was very apparent within the Raman maps as
sections of the map would be significantly lower in intensity. Due to these Raman maps
taking many hours to produce, large portions of the data would be unreliable. All of these
issues became more relevant as the area mapped was increased significantly. In an effort
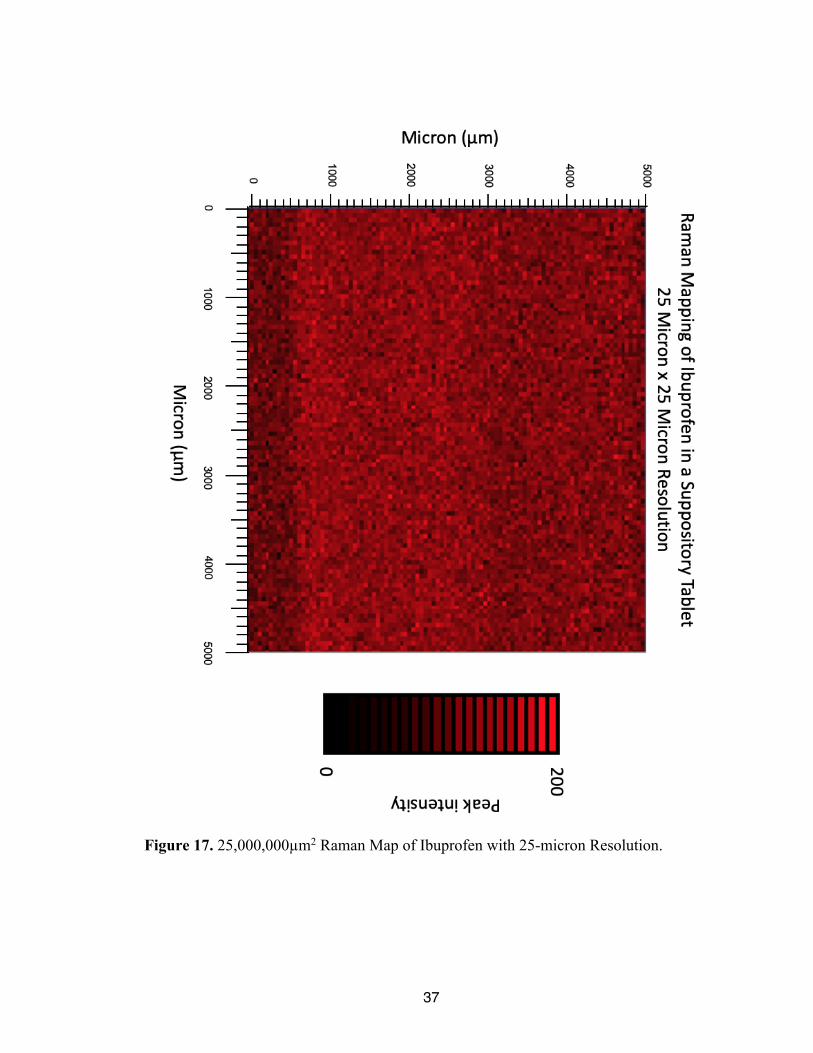
to determine the size limit of the instrument, a 25,000,000µm2 area with a larger step size
of 25µm was analyzed. This was performed with the 532nm Nd:YAG laser, 100% laser
power, and the 600gr/mm grating with an acquisition time of 3 seconds for two
acquisitions. The Spectra recorded and composite image are shown below in Figure 16
and Figure 17.
Figure 16. Composition of Spectra Gathered from 25,000,000µm2 area.
37
Figure 17. 25,000,000µm2 Raman Map of Ibuprofen with 25-micron Resolution.

38
Unlike the other Raman maps produced, no clear insights regarding the ibuprofen
distribution are seen. It seems like a homogenous mixture, but that is not what was seen in
the higher resolution maps. This indicates that most likely too large of a step size was used
to accurately map ibuprofen within the sample. However, this Raman map was produced
over the course of 67 hours. Therefore, a smaller steps size is not reasonable for research
purposes as it would take even longer to produce the Raman maps. Furthermore, this
25,000,000µm2 area is still significantly smaller than the cross section of the suppository.
In addition, due to the very long total acquisition time, dimming of the laser was seen
toward the bottom of the map as can be seen in Figure 17.
Further data was set to be gathered, but, due to the COVID-19 outbreak, this was
not feasible. However, it was still possible to produce conclusions from the gathered data
to date.

39
Chapter 5: Conclusions and Future Work
Based on the data, it can be concluded that further research should be conducted
over smaller areas with smaller step sizes. Larger sizes take significantly longer to produce
and produce less accurate descriptions of the distribution of analytes. Furthermore, this
analysis could be performed with more analytes, but would require a larger range of
wavenumbers and analyte specific peaks that are easily visible when analyzed within the
mixture. However, analysis on the overall distribution of ibuprofen throughout the
suppository is not feasible with the current equipment due to the large sizes of the cross
sections and acquisition times associated with this method. On the other hand, optimization
and the limitations of the method were successfully discovered. Further uses of this method
should be performed over smaller surface areas, or in a similar manner to the experiment
probing the aggregation of α-synuclein amyloids, where spectra gathered with Raman
mapping were averaged to acquire a more representative spectrum. To perform large area
Raman maps, specialized equipment, such as the Renishaw inViaTM Qontor® which is
specifically designed for rapid large area Raman imaging, should be used to better
understand the overall distribution of analytes within the system.37 However, a decently
representative distribution could be achieved by combining data taken from different grid
points as proposed by a previous experiment.21

40
References:
1. Pharmaceutical. https://www.britannica.com/technology/pharmaceutical (accessed 4/14).
2. Administration, F. D., A History of the FDA and Drug Regulation in the United
States FDA centennial: 2006. 3. Step 1: Discovery and Development. https://www.fda.gov/patients/drug-
development-process/step-1-discovery-and-development (accessed 4/14). 4. Step 2: Preclinical Research. https://www.fda.gov/patients/drug-development-
process/step-2-preclinical-research (accessed 4/14). 5. Badyal, D. K.; Desai, C., Animal use in pharmacology education and research: the
changing scenario. Indian Journal of Pharmacology 2014, 46 (3), 257-65. 6. Step 3: Clinical Research. https://www.fda.gov/patients/drug-development-p rocess/step-3-clinical-research (accessed 4/14). 7. Step 4: FDA Drug Review. https://www.fda.gov/patients/drug-development-
process/step-4-fda-drug-review (accessed 4/14). 8. Step 5: FDA Post-Market Drug Safety Monitoring.
https://www.fda.gov/patients/drug-development-process/step-5-fda-post-market-drug-safety-monitoring.
9. Bushra, R.; Aslam, N., An overview of clinical pharmacology of Ibuprofen.
Oman Medical Journal 2010, 25 (3), 155-1661. 10. Ricciotti, E.; FitzGerald, G. A., Prostaglandins and inflammation.
Arteriosclerosis, Thrombosis, and Vascular Biology 2011, 31 (5), 986-1000. 11. Evans, A. M., Comparative pharmacology of S(+)-ibuprofen and (RS)-ibuprofen.
Clinical Rheumatology 2001, 20 Suppl 1, S9-14. 12. 5.2 Speed of Drug Effect.
https://www1.health.gov.au/internet/publications/publishing.nsf/Content/drugtreat-pubs-front6-wk-toc~drugtreat-pubs-front6-wk-secb~drugtreat-pubs-front6-wk-secb-5~drugtreat-pubs-front6-wk-secb-5-2.
13. Baviskar, P.; Bedse, A.; Sadique, S.; Kunde, V.; Jaiswal, S., Drug delivery on
rectal absorption: Suppositories. International Journal of Pharmaceutical Sciences Review and Research 2013, 21, 70-76.
14. Tro, N. J., Chemistry : Structure and Properties. p 1 volume (various pages).

41
15. Granger, R. M., Intrumental Analysis: Revised Edition. 1st ed.; Oxford University
Press: United States of America, 2017. 16. The Raman Effect.
http://www.acs.org/content/acs/en/education/whatischemistry/landmarks/ramaneffect.html (accessed 4/18).
17. What are the most common applications of Raman spectroscopy?
https://www.horiba.com/us/en/scientific/products/raman-spectroscopy/raman-academy/raman-faqs/what-are-the-most-common-applications-of-raman-spectroscopy/ (accessed 4/18).
18. Atkins, P. W., Elements of Physical Chemistry. 6th ed.; W. H. Freeman and Co.:
New York, NY, 2013. 19. Gordon, K. C.; McGoverin, C. M., Raman Mapping of Pharmaceuticals.
International Journal of Pharmaceutics 2011, 417 (1), 151-162. 20. Zetterholm, S. G.; Verville, G. A.; Boutwell, L.; Boland, C.; Prather, J. C.;
Bethea, J.; Cauley, J.; Warren, K. E.; Smith, S. A.; Magers, D. H.; Hammer, N. I., Noncovalent Interactions between Trimethylamine N-Oxide (TMAO), Urea, and Water. The Journal of Physical Chemistry B 2018, 122 (38), 8805-8811.
21. Bell, S. E. J.; Beattie, J. R.; McGarvey, J. J.; Peters, K. L.; Sirimuthu, N. M. S.;
Speers, S. J., Development of sampling methods for Raman analysis of solid dosage forms of therapeutic and illicit drugs. Journal of Raman Spectroscopy 2004, 35 (5), 409-417.
22. Gowen, A. A.; O’Donnell, C. P.; Cullen, P. J.; Bell, S. E. J., Recent applications
of Chemical Imaging to pharmaceutical process monitoring and quality control. European Journal of Pharmaceutics and Biopharmaceutics 2008, 69 (1), 10-22.
23. Vajna, B.; Farkas, I.; Szabo, A.; Zsigmond, Z.; Marosi, G., Raman microscopic
evaluation of technology dependent structural differences in tablets containing imipramine model drug. Journal of Pharmaceutical and Biomedical Analysis 2009, 51, 30-8.
24. Arruabarrena, J.; Coello, J.; Maspoch, S., Raman spectroscopy as a
complementary tool to assess the content uniformity of dosage units in break-scored warfarin tablets. International Journal of Pharmaceutics 2014, 465 (1-2), 299-305.
25. Zhang, L.; Henson, M. J.; Sekulic, S. S., Multivariate data analysis for Raman
imaging of a model pharmaceutical tablet. Analytica Chimica Acta 2005, 545 (2), 262-278.
42
26. Rantanen, J., Process analytical applications of Raman spectroscopy. The Journal of Pharmacy and Pharmacology 2007, 59 (2), 171-7.
27. Wang, H.; Barona, D.; Oladepo, S.; Williams, L.; Hoe, S.; Lechuga, D.; Vehring,
R., Macro-Raman spectroscopy for bulk composition and homogeneity analysis of multi-component pharmaceutical powders. Journal of Pharmaceutical and Biomedical Analysis 2017, 141.
28. Eksi-Kocak, H.; Ilbasmis Tamer, S.; Yilmaz, S.; Eryilmaz, M.; Boyaci, I. H.;
Tamer, U., Quantification and spatial distribution of salicylic acid in film tablets using FT-Raman mapping with multivariate curve resolution. Asian Journal of Pharmaceutical Sciences 2018, 13 (2), 155-162.
29. Flynn, J. D.; Jiang, Z.; Lee, J. C., Segmental 13C-Labeling and Raman
Microspectroscopy of α-Synuclein Amyloid Formation. Angewandte Chemie International Edition 2018, 57 (52), 17069-17072.
30. Vajna, B.; Farkas, I.; Farkas, A.; Pataki, H.; Nagy, Z.; Madarász, J.; Marosi, G.,
Characterization of drug–cyclodextrin formulations using Raman mapping and multivariate curve resolution. Journal of Pharmaceutical and Biomedical Analysis 2011, 56 (1), 38-44.
31. Čapková-Helešicová, T.; Pekárek, T.; Schöngut, M.; Matějka, P., New designed
special cells for Raman mapping of the disintegration process of pharmaceutical tablets. Journal of Pharmaceutical and Biomedical Analysis 2019, 168, 113-123.
32. Matthaus, C.; Kale, A.; Chernenko, T.; Torchilin, V.; Diem, M., New ways of
imaging uptake and intracellular fate of liposomal drug carrier systems inside individual cells, based on Raman microscopy. Molecular Pharmaceutics 2008, 5 (2), 287-93.
33. Xu, Z.; He, Z.; Song, Y.; Fu, X.; Rommel, M.; Luo, X.; Hartmaier, A.; Zhang, J.;
Fang, F., Topic Review: Application of Raman Spectroscopy Characterization in Micro/Nano-Machining. Micromachines 2018, 9 (7).
34. Windbergs, M.; Haaser, M.; McGoverin, C. M.; Gordon, K. C.; Kleinebudde, P.;
Strachan, C. J., Investigating the relationship between drug distribution in solid lipid matrices and dissolution behaviour using Raman spectroscopy and mapping. Journal of Pharmaceutical Sciences 2010, 99 (3), 1464-75.
35. Raman Spectroscopy for Analysis and Monitoring In RAMAN DATA AND
ANALYSIS Horiba.

43
36. Sakamoto, T.; Matsubara, T.; Sasakura, D.; Takada, Y.; Fujimaki, Y.; Aida, K.; Miura, T.; Terahara, T.; Higo, N.; Kawanishi, T.; Hiyama, Y., Chemical mapping of tulobuterol in transdermal tapes using microscopic laser Raman spectroscopy. Die Pharmazie 2009, 64 (3), 166-71.
37. inVia™ Qontor® confocal Raman microscope.
https://www.renishaw.com/en/invia-qontor-confocal-raman-microscope--38125 (accessed 4/16).