study of the surface integrity and high cycle fatigue
TRANSCRIPT
metals
Article
Study of the Surface Integrity and High Cycle FatiguePerformance of AISI 4340 Steel after CompositeSurface Modification
Hai Fu 1,2,3 and Yilong Liang 1,2,3,*1 College of Materials and Metallurgy, Guizhou University, Guiyang 550025, China2 Guizhou Key Laboratory of Materials Strength and Structure, Guiyang 550025, China3 High Performance Metal Structure Material and Manufacture Technology National Local Joint Engineering
Laboratory, Guiyang 550025, China* Correspondence: [email protected]; Tel.: +86-130-3782-6595
Received: 7 July 2019; Accepted: 3 August 2019; Published: 6 August 2019�����������������
Abstract: In the field of materials science, the fabrication of a material with severe surface plasticdeformation and a good surface state is an issue encountered in the development of counterbalancedgradient materials. For this paper, AISI 4340 steel was first processed with abrasive water jetpeening (AWJP) and then with ultrasonic surface rolling (USRE) to obtain a good surface state whilemaintaining large plastic deformation. The AISI 4340 steel composite surface was therefore modified,and the surface integrity and cycle fatigue performance were analyzed. The results show that theplastic deformation layer of the modified composite surface of the 4340 steel was 310 µm from thesurface of the sample, the grain size 40 µm from the surface layer was refined to 70 nm, and themaximum surface roughness Ra is 0.06. The fatigue limit of the modified composite surfaces obtainedby the tensile fatigue test was 595.7 MPa, which was 85.7 MPa higher than the 510 MPa fatigue limitof the unmodified matrix, indicating that the method of composite surface modification can producea deep deformation layer while maintaining good surface conditions. The results show that workhardening caused by a composite surface treatment is the most important factor for improving thefatigue performance of materials.
Keywords: AISI 4340 steel; abrasive water jet peening; ultrasonic surface rolling; fatigue performance;nano-gradient; structure roughness
1. Introduction
Under normal service conditions, the damage of mechanical or structural parts is primarily causedby fatigue, and the fatigue failure of materials often starts at the surface, where cracks often startto form and propagate [1–3]. So how to improve the surface quality of materials is an importantconsideration in material design and industrial application. Dixit et al. [4] put forward modelingrequirements for material surface state and surface quality from the perspective of material design andmodeling, reflecting the importance of material surface state and quality material modeling. However,Krahmer et al. [5] takes the surface integrity and surface state as the consideration point, and abrasivewater jet, wire electrodischarge machining, laser to replace the traditional milling processing of tensilesamples, shortening the processing time and having great industrial value in industrial applications,In practical application literature [6–9], ball-burnishing means can be adopted to significantly improvethe surface quality of materials, so as to improve the corrosion resistance and wear resistance ofmaterials and reduce the wear ratio of materials. In terms of material fatigue, Nie et al. [10] the surfacestate of titanium alloy after polishing can affect crack initiation in the fatigue process, thus affectingthe fatigue performance of the material. Torres et al. [11] found that micro-cracks formed on the
Metals 2019, 9, 856; doi:10.3390/met9080856 www.mdpi.com/journal/metals

Metals 2019, 9, 856 2 of 16
surface of AISI 4340 steel during shot peening would have an impact on the initiation location ofcracks. Wu et al. [12] studied the influence of different polishing methods on the rotary bendingfatigue life of nickel-based Alloy GH4169. Klein et al. [13] showed that the surface morphology had asignificant impact on the cyclic deformation behavior of TWIP steel under high cycle fatigue. However,in literatures [14,15], special morphologies such as pits and pitting points are easy to form in the shotpeening process, and local stress concentration is easy to cause, which will reduce the performance ofmaterials. Therefore, it is a meaningful problem to design materials with good large deformation andgood surface condition for the use of structural parts
The material used herein is an AISI 4340 steel; because of its high strength, toughness,good hardenability, and thermal stability, it is suitable for the manufacture of important partsthat require a high strength and large cross section, such as large diameter turbine shafts and bladesin heavy machinery. In metal structural parts such as transmission shafts, crankshafts and aircraftlanding gears [16,17], various failures originate from the surface, so the treatment of the surface isparticularly important.
In the design of this paper, AWJP is used to form a deep deformation layer on the surface. When asurface is rolled by an ultrasonic process to reduce the surface roughness, deformation is introducedthat forms nanograins on the surface. The gradient structure is slowly extended, forming an ideal“nano–submicron–micron” gradient structure from the surface layer into the matrix that resists fatiguecrack initiation and expansion. In the literature review done for this work, it was found that thecombination of AWJP and ultrasonic surface rolling (USRE) was not reported in the literature whenmaterials were subjected to surface strengthening treatments. In this paper, the surface modificationtreatment of the material is carried out by the method of USRE after AWJP, and the fatigue propertiesof the nano-gradient in of steel are also studied. The microstructure and fatigue limit of the 4340 steelafter AWJP + USRE are determined to improve the theoretical basis for future industrial productionand application.
2. Materials and Methods
The Principle of Abrasive Water Jet Peening and Ultrasonic Surface Rolling
The basic principle of AWJP is to spray a high-pressure, high-speed water jet that is carrying alarge amount of abrasive energy in a specific way on the surface of the metal component so that it isplastically deformed at the recrystallization temperature (cold hardened layer). The goal is to producean ideal grain structure (grain strengthening) and residual stress distribution (stress strengthening).The roughness of the surface is decreased to improve the performance of the material.
Ultrasonic surface rolling is a combination of ultrasonic energy and static load rolling to treatthe surface of metal parts. The machining head applies an ultrasonic frequency that consists of amechanical vibration at a certain amplitude along the normal direction of the workpiece surface.Under certain feeding conditions, the working head transmits a static pressure and ultrasonic shockvibration to the surface of the rotating mechanical component, causing a squeezing effect. Metallicmaterials undergo substantial elastoplastic deformation. After processing, the surface of the workpieceexperiences a certain elastic recovery, and the plastic flow generated fills or partially fills the “valley”on the surface of the workpiece, thereby greatly reducing the surface roughness Ra to the nano leveland improving the surface. The schematic diagram of composite surface modification is shown inFigure 1. In this paper, composite surface modification is defined as AWJP+USRE.
The experimental material used herein was 4340 steel, and its chemical composition is shown inTable 1. The tensile properties of the material measured at room temperature are shown in Table 2.The parameters of abrasive water shot peening and ultrasonic surface rolling are shown in Tables 3and 4. The heat treatment process involved heating at 850 ◦C for 90 min, oil quenching, and temperingat 540 ◦C for 240 min.

Metals 2019, 9, 856 3 of 16
Metals 2019, 9, x FOR PEER REVIEW 2 of 16
initiation location of cracks. Wu et al. [12] studied the influence of different polishing methods on the rotary bending fatigue life of nickel-based Alloy GH4169. Klein et al. [13] showed that the surface morphology had a significant impact on the cyclic deformation behavior of TWIP steel under high cycle fatigue. However, in literatures [14,15], special morphologies such as pits and pitting points are easy to form in the shot peening process, and local stress concentration is easy to cause, which will reduce the performance of materials. Therefore, it is a meaningful problem to design materials with good large deformation and good surface condition for the use of structural parts
The material used herein is an AISI 4340 steel; because of its high strength, toughness, good hardenability, and thermal stability, it is suitable for the manufacture of important parts that require a high strength and large cross section, such as large diameter turbine shafts and blades in heavy machinery. In metal structural parts such as transmission shafts, crankshafts and aircraft landing gears [16,17], various failures originate from the surface, so the treatment of the surface is particularly important.
In the design of this paper, AWJP is used to form a deep deformation layer on the surface. When a surface is rolled by an ultrasonic process to reduce the surface roughness, deformation is introduced that forms nanograins on the surface. The gradient structure is slowly extended, forming an ideal “nano–submicron–micron” gradient structure from the surface layer into the matrix that resists fatigue crack initiation and expansion. In the literature review done for this work, it was found that the combination of AWJP and ultrasonic surface rolling (USRE) was not reported in the literature when materials were subjected to surface strengthening treatments. In this paper, the surface modification treatment of the material is carried out by the method of USRE after AWJP, and the fatigue properties of the nano-gradient in of steel are also studied. The microstructure and fatigue limit of the 4340 steel after AWJP + USRE are determined to improve the theoretical basis for future industrial production and application.
2. Materials and Methods
The Principle of Abrasive Water Jet Peening and Ultrasonic Surface Rolling
The basic principle of AWJP is to spray a high-pressure, high-speed water jet that is carrying a large amount of abrasive energy in a specific way on the surface of the metal component so that it is plastically deformed at the recrystallization temperature (cold hardened layer). The goal is to produce an ideal grain structure (grain strengthening) and residual stress distribution (stress strengthening). The roughness of the surface is decreased to improve the performance of the material.
Ultrasonic surface rolling is a combination of ultrasonic energy and static load rolling to treat the surface of metal parts. The machining head applies an ultrasonic frequency that consists of a mechanical vibration at a certain amplitude along the normal direction of the workpiece surface. Under certain feeding conditions, the working head transmits a static pressure and ultrasonic shock vibration to the surface of the rotating mechanical component, causing a squeezing effect. Metallic materials undergo substantial elastoplastic deformation. After processing, the surface of the workpiece experiences a certain elastic recovery, and the plastic flow generated fills or partially fills the “valley” on the surface of the workpiece, thereby greatly reducing the surface roughness Ra to the nano level and improving the surface. The schematic diagram of composite surface modification is shown in Figure 1. In this paper, composite surface modification is defined as AWJP+USRE.
Figure 1. Schematic diagram of AWJP+USRE approach.
Table 1. Chemical compositions of 4340 steel.
Element C Si S P Cr Ni Mo Cu Al
Content 0.42 0.30 0.0019 0.0021 0.90 1.65 0.25 0.14 0.009
Table 2. Mechanical properties of 4340 steel.
Tensile Strength σb/MPa Yield Strength σs/MPa Elongation δ/% Reduction of Area ψ/%
1160 1098 18.7 54.6
Table 3. Parameters of waterjet peening progress.
Parameter Values
Water flow pressure, MPa 100Forward speed, mm/min 10
Speed, r/min 30Target distance, mm 10
Nozzle angle 90◦
Table 4. Ultrasonic surface rolling processing parameters.
Parameter Values
Static pressure, N 320Amplitude, um 6
Speed, r/min 280Forward speed, mm/r 0.08
Rolling times 3
The heat-treated sample was finished into a funnel-type standard fatigue sample, and the smoothfatigue sample designed according to GB/T3075-2008 is shown in Figure 2. Then, the center portion ofthe sample was axially ground and polished to a mirror finish. The AISI 4340 steel was subjected toa 1 × 10⁷ high-cycle fatigue test with axial r = −1 on a QBG-200 high-frequency fatigue tester (QianBang Company, Changchun, China). The resonance frequency of the sample was 140 Hz and the testwas carried out at room temperature. The fatigue limit was determined by the lifting method and thesingle sample method when the specified cycle time is 107. The fatigue limit was calculated by thefollowing formula [18]:
σmax =1m
n∑i=1
viσi (1)
where m is the total number of effective fatigue tests (both failure and passage are included in thelifting process), n is the test stress level series, vi is the number of tests corresponding to the i-th stresslevel, and σi is the first level i stress level. Using the group test method, the stress level was measuredto increase the corresponding fatigue life. Finally, the data obtained by the lifting method were taken
Metals 2019, 9, 856 4 of 16
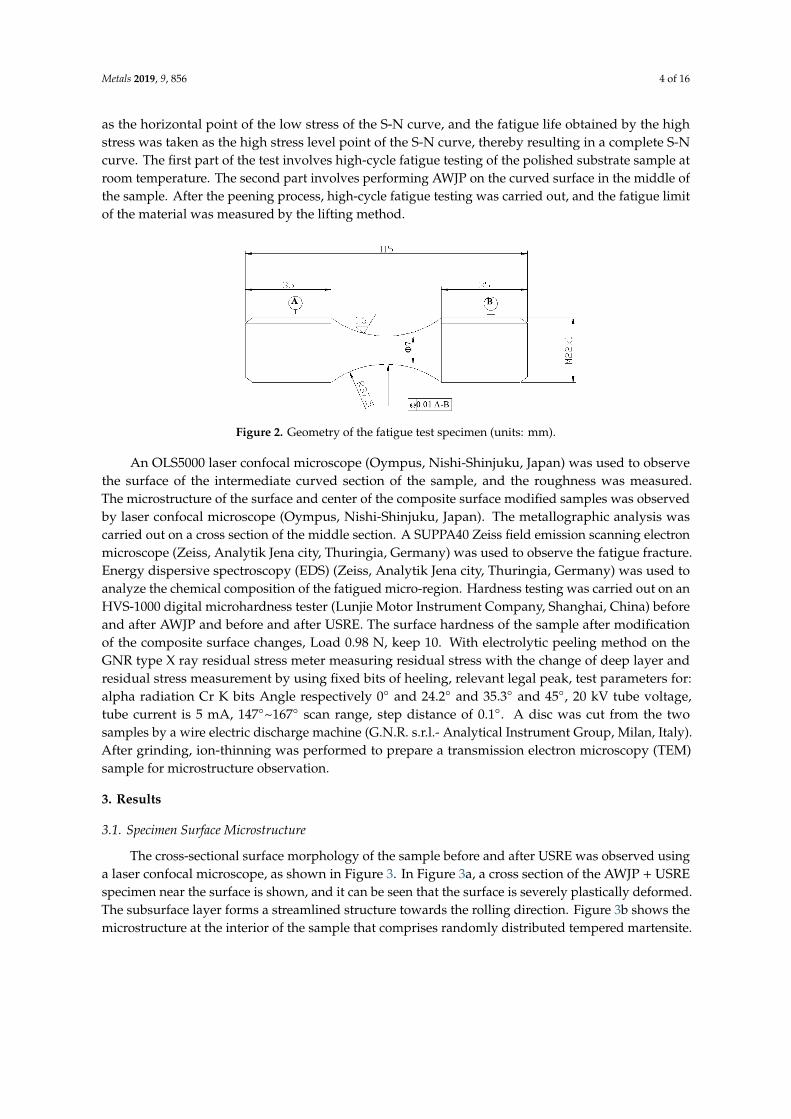
as the horizontal point of the low stress of the S-N curve, and the fatigue life obtained by the highstress was taken as the high stress level point of the S-N curve, thereby resulting in a complete S-Ncurve. The first part of the test involves high-cycle fatigue testing of the polished substrate sample atroom temperature. The second part involves performing AWJP on the curved surface in the middle ofthe sample. After the peening process, high-cycle fatigue testing was carried out, and the fatigue limitof the material was measured by the lifting method.
Metals 2019, 9, x FOR PEER REVIEW 4 of 16
of the sample. After the peening process, high-cycle fatigue testing was carried out, and the fatigue limit of the material was measured by the lifting method.
Figure 2. Geometry of the fatigue test specimen (units: mm).
An OLS5000 laser confocal microscope (Oympus, Nishi-Shinjuku, Japan) was used to observe the surface of the intermediate curved section of the sample, and the roughness was measured. The microstructure of the surface and center of the composite surface modified samples was observed by laser confocal microscope (Oympus, Nishi-Shinjuku, Japan). The metallographic analysis was carried out on a cross section of the middle section. A SUPPA40 Zeiss field emission scanning electron microscope (Zeiss, Analytik Jena city, Thuringia, Germany) was used to observe the fatigue fracture. Energy dispersive spectroscopy (EDS) (Zeiss, Analytik Jena city, Thuringia, Germany) was used to analyze the chemical composition of the fatigued micro-region. Hardness testing was carried out on an HVS-1000 digital microhardness tester (Lunjie Motor Instrument Company, Shanghai, China) before and after AWJP and before and after USRE. The surface hardness of the sample after modification of the composite surface changes, Load 0.98 N, keep 10. With electrolytic peeling method on the GNR type X ray residual stress meter measuring residual stress with the change of deep layer and residual stress measurement by using fixed bits of heeling, relevant legal peak, test parameters for: alpha radiation Cr K bits Angle respectively 0° and 24.2° and 35.3° and 45°, 20 kV tube voltage, tube current is 5 mA, 147°~167° scan range, step distance of 0.1°. A disc was cut from the two samples by a wire electric discharge machine (G.N.R. s.r.l.- Analytical Instrument Group, Milan, Italy). After grinding, ion-thinning was performed to prepare a transmission electron microscopy (TEM) sample for microstructure observation.
3. Results
3.1. Specimen Surface Microstructure
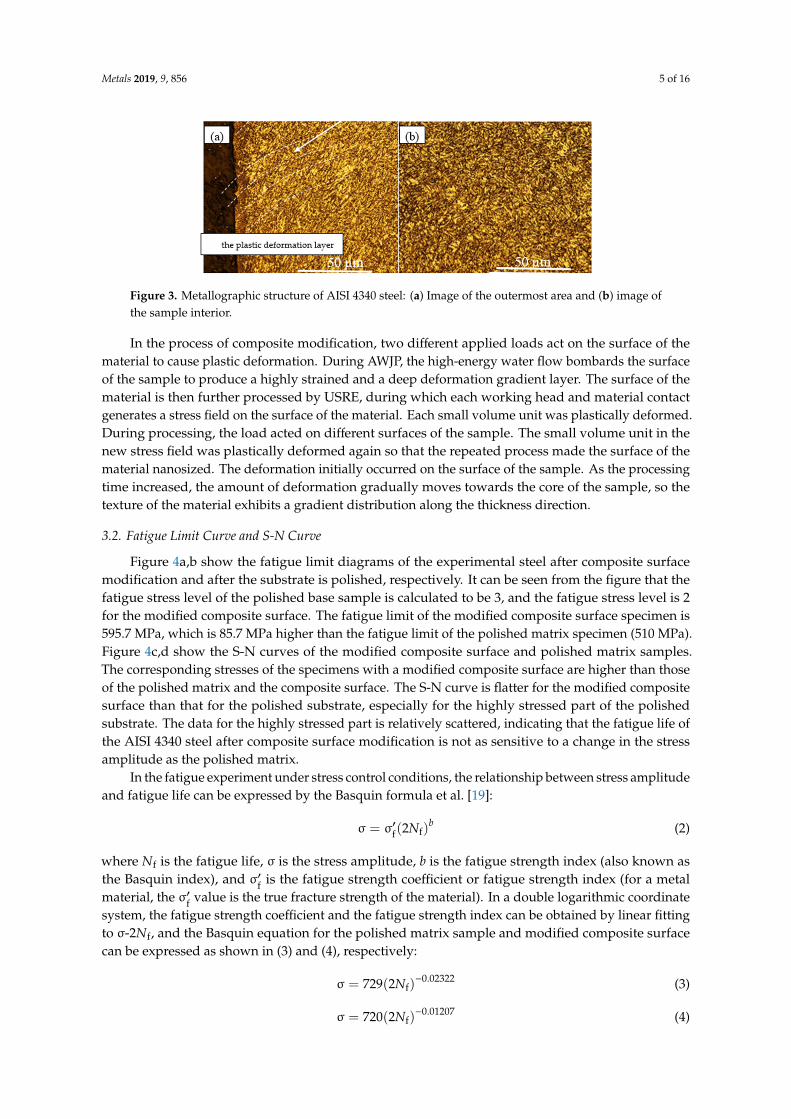
The cross-sectional surface morphology of the sample before and after USRE was observed using a laser confocal microscope, as shown in Figure 3. In Figure 3a, a cross section of the AWJP + USRE specimen near the surface is shown, and it can be seen that the surface is severely plastically deformed. The subsurface layer forms a streamlined structure towards the rolling direction. Figure 3b shows the microstructure at the interior of the sample that comprises randomly distributed tempered martensite.
Figure 2. Geometry of the fatigue test specimen (units: mm).
An OLS5000 laser confocal microscope (Oympus, Nishi-Shinjuku, Japan) was used to observethe surface of the intermediate curved section of the sample, and the roughness was measured.The microstructure of the surface and center of the composite surface modified samples was observedby laser confocal microscope (Oympus, Nishi-Shinjuku, Japan). The metallographic analysis wascarried out on a cross section of the middle section. A SUPPA40 Zeiss field emission scanning electronmicroscope (Zeiss, Analytik Jena city, Thuringia, Germany) was used to observe the fatigue fracture.Energy dispersive spectroscopy (EDS) (Zeiss, Analytik Jena city, Thuringia, Germany) was used toanalyze the chemical composition of the fatigued micro-region. Hardness testing was carried out on anHVS-1000 digital microhardness tester (Lunjie Motor Instrument Company, Shanghai, China) beforeand after AWJP and before and after USRE. The surface hardness of the sample after modificationof the composite surface changes, Load 0.98 N, keep 10. With electrolytic peeling method on theGNR type X ray residual stress meter measuring residual stress with the change of deep layer andresidual stress measurement by using fixed bits of heeling, relevant legal peak, test parameters for:alpha radiation Cr K bits Angle respectively 0◦ and 24.2◦ and 35.3◦ and 45◦, 20 kV tube voltage,tube current is 5 mA, 147◦~167◦ scan range, step distance of 0.1◦. A disc was cut from the twosamples by a wire electric discharge machine (G.N.R. s.r.l.- Analytical Instrument Group, Milan, Italy).After grinding, ion-thinning was performed to prepare a transmission electron microscopy (TEM)sample for microstructure observation.
3. Results
3.1. Specimen Surface Microstructure
The cross-sectional surface morphology of the sample before and after USRE was observed usinga laser confocal microscope, as shown in Figure 3. In Figure 3a, a cross section of the AWJP + USREspecimen near the surface is shown, and it can be seen that the surface is severely plastically deformed.The subsurface layer forms a streamlined structure towards the rolling direction. Figure 3b shows themicrostructure at the interior of the sample that comprises randomly distributed tempered martensite.
Metals 2019, 9, 856 5 of 16
Metals 2019, 9, x FOR PEER REVIEW 4 of 16
of the sample. After the peening process, high-cycle fatigue testing was carried out, and the fatigue limit of the material was measured by the lifting method.
Figure 2. Geometry of the fatigue test specimen (units: mm).
An OLS5000 laser confocal microscope (Oympus, Nishi-Shinjuku, Japan) was used to observe the surface of the intermediate curved section of the sample, and the roughness was measured. The microstructure of the surface and center of the composite surface modified samples was observed by laser confocal microscope (Oympus, Nishi-Shinjuku, Japan). The metallographic analysis was carried out on a cross section of the middle section. A SUPPA40 Zeiss field emission scanning electron microscope (Zeiss, Analytik Jena city, Thuringia, Germany) was used to observe the fatigue fracture. Energy dispersive spectroscopy (EDS) (Zeiss, Analytik Jena city, Thuringia, Germany) was used to analyze the chemical composition of the fatigued micro-region. Hardness testing was carried out on an HVS-1000 digital microhardness tester (Lunjie Motor Instrument Company, Shanghai, China) before and after AWJP and before and after USRE. The surface hardness of the sample after modification of the composite surface changes, Load 0.98 N, keep 10. With electrolytic peeling method on the GNR type X ray residual stress meter measuring residual stress with the change of deep layer and residual stress measurement by using fixed bits of heeling, relevant legal peak, test parameters for: alpha radiation Cr K bits Angle respectively 0° and 24.2° and 35.3° and 45°, 20 kV tube voltage, tube current is 5 mA, 147°~167° scan range, step distance of 0.1°. A disc was cut from the two samples by a wire electric discharge machine (G.N.R. s.r.l.- Analytical Instrument Group, Milan, Italy). After grinding, ion-thinning was performed to prepare a transmission electron microscopy (TEM) sample for microstructure observation.
3. Results
3.1. Specimen Surface Microstructure
The cross-sectional surface morphology of the sample before and after USRE was observed using a laser confocal microscope, as shown in Figure 3. In Figure 3a, a cross section of the AWJP + USRE specimen near the surface is shown, and it can be seen that the surface is severely plastically deformed. The subsurface layer forms a streamlined structure towards the rolling direction. Figure 3b shows the microstructure at the interior of the sample that comprises randomly distributed tempered martensite.
Figure 3. Metallographic structure of AISI 4340 steel: (a) Image of the outermost area and (b) image ofthe sample interior.
In the process of composite modification, two different applied loads act on the surface of thematerial to cause plastic deformation. During AWJP, the high-energy water flow bombards the surfaceof the sample to produce a highly strained and a deep deformation gradient layer. The surface of thematerial is then further processed by USRE, during which each working head and material contactgenerates a stress field on the surface of the material. Each small volume unit was plastically deformed.During processing, the load acted on different surfaces of the sample. The small volume unit in thenew stress field was plastically deformed again so that the repeated process made the surface of thematerial nanosized. The deformation initially occurred on the surface of the sample. As the processingtime increased, the amount of deformation gradually moves towards the core of the sample, so thetexture of the material exhibits a gradient distribution along the thickness direction.
3.2. Fatigue Limit Curve and S-N Curve
Figure 4a,b show the fatigue limit diagrams of the experimental steel after composite surfacemodification and after the substrate is polished, respectively. It can be seen from the figure that thefatigue stress level of the polished base sample is calculated to be 3, and the fatigue stress level is 2for the modified composite surface. The fatigue limit of the modified composite surface specimen is595.7 MPa, which is 85.7 MPa higher than the fatigue limit of the polished matrix specimen (510 MPa).Figure 4c,d show the S-N curves of the modified composite surface and polished matrix samples.The corresponding stresses of the specimens with a modified composite surface are higher than thoseof the polished matrix and the composite surface. The S-N curve is flatter for the modified compositesurface than that for the polished substrate, especially for the highly stressed part of the polishedsubstrate. The data for the highly stressed part is relatively scattered, indicating that the fatigue life ofthe AISI 4340 steel after composite surface modification is not as sensitive to a change in the stressamplitude as the polished matrix.
In the fatigue experiment under stress control conditions, the relationship between stress amplitudeand fatigue life can be expressed by the Basquin formula et al. [19]:
σ = σ′f(2Nf)b (2)
where Nf is the fatigue life, σ is the stress amplitude, b is the fatigue strength index (also known asthe Basquin index), and σ′f is the fatigue strength coefficient or fatigue strength index (for a metalmaterial, the σ′f value is the true fracture strength of the material). In a double logarithmic coordinatesystem, the fatigue strength coefficient and the fatigue strength index can be obtained by linear fittingto σ-2Nf, and the Basquin equation for the polished matrix sample and modified composite surfacecan be expressed as shown in (3) and (4), respectively:
σ = 729(2Nf)−0.02322 (3)
σ = 720(2Nf)−0.01207 (4)

Metals 2019, 9, 856 6 of 16
Compared with the polished base sample, the fatigue strength coefficient of the modifiedcomposite surface is not very different, and the fatigue strength index b of the sample is higher thanthat of the polished base sample. By studying the fatigue behaviour of coarse-grained (CG) Cu andultra-fine-grained (UFG) Cu under both tension and compression modes, Li et al. [20], Höppel et al. [21]and Huang [22] revealed that b is affected by strain localization during crack initiation and the stressgradient during crack propagation. The value of b during UFG Cu tensile fatigue is decreased becausethe crack initiation mode changes from the CG persistent slip band (PSB) to an ultra-fine crystallineshear band (SB). SBs are more localized with respect to PSB strain, and in addition, grain refinementaccelerates crack propagation. For the AWJP+USRE sample, the gradient structure improves theresistance to crack initiation during fatigue. In addition, because the gradient deformation layer isattached to a plastically good substrate and has a good work hardening ability, strain localizationis suppressed. Moreover, the gradient structure from nanocrystals to coarse crystals provides goodcrack propagation resistance [23–25]. The AWJP + USRE sample has a high b value in both the crackinitiation and expansion stages.
Metals 2019, 9, x FOR PEER REVIEW 5 of 16
Figure 3. Metallographic structure of AISI 4340 steel: (a) Image of the outermost area and (b) image of the sample interior.
In the process of composite modification, two different applied loads act on the surface of the material to cause plastic deformation. During AWJP, the high-energy water flow bombards the surface of the sample to produce a highly strained and a deep deformation gradient layer. The surface of the material is then further processed by USRE, during which each working head and material contact generates a stress field on the surface of the material. Each small volume unit was plastically deformed. During processing, the load acted on different surfaces of the sample. The small volume unit in the new stress field was plastically deformed again so that the repeated process made the surface of the material nanosized. The deformation initially occurred on the surface of the sample. As the processing time increased, the amount of deformation gradually moves towards the core of the sample, so the texture of the material exhibits a gradient distribution along the thickness direction.
3.2. Fatigue Limit Curve and S-N Curve
Figure 4a,b show the fatigue limit diagrams of the experimental steel after composite surface modification and after the substrate is polished, respectively. It can be seen from the figure that the fatigue stress level of the polished base sample is calculated to be 3, and the fatigue stress level is 2 for the modified composite surface. The fatigue limit of the modified composite surface specimen is 595.7 MPa, which is 85.7 MPa higher than the fatigue limit of the polished matrix specimen (510 MPa). Figure 4c,d show the S-N curves of the modified composite surface and polished matrix samples. The corresponding stresses of the specimens with a modified composite surface are higher than those of the polished matrix and the composite surface. The S-N curve is flatter for the modified composite surface than that for the polished substrate, especially for the highly stressed part of the polished substrate. The data for the highly stressed part is relatively scattered, indicating that the fatigue life of the AISI 4340 steel after composite surface modification is not as sensitive to a change in the stress amplitude as the polished matrix.
580
590
600
610
620
stre
ss/M
Pa
20MPa
(a)
460
480
500
520
540
560
stre
ss/M
Pa
30MPa
(b)
0.0 2.0x10⁶ 4.0x10⁶ 6.0x10⁶ 8.0x10⁶ 1.0x10⁷ 1.2x10⁷ 1.4x107560
570
580
590
600
610
620
630(c) Failure point,AWJP+USRE
Through point,AWJP+USRE
S-N curve,AWJP+USRE
stre
ss/M
Pa
Cycles/Nf
0.0 2.0x10⁶ 4.0x10⁶ 6.0x10⁶ 8.0x10⁶ 1.0x10⁷ 1.2x10⁷ 1.4x10⁷
465
480
495
510
525
540
555
570
585 (d) Failure,polishing
Through point,polishing
S-N curve,polishing
stre
ss/M
Pa
Cycles/Nf Figure 4. The fatigue limit of 4340 steel processed with (a) 13% abrasive water jet peening (AWJP) + ultrasonic surface rolling (USRE) and (b) after polishing. The S-N curves of the 4340 steel processed with (c) AWJP + USRE and (d) after polishing.
Figure 4. The fatigue limit of 4340 steel processed with (a) 13% abrasive water jet peening (AWJP) +
ultrasonic surface rolling (USRE) and (b) after polishing. The S-N curves of the 4340 steel processedwith (c) AWJP + USRE and (d) after polishing.
3.3. Fatigue Fracture
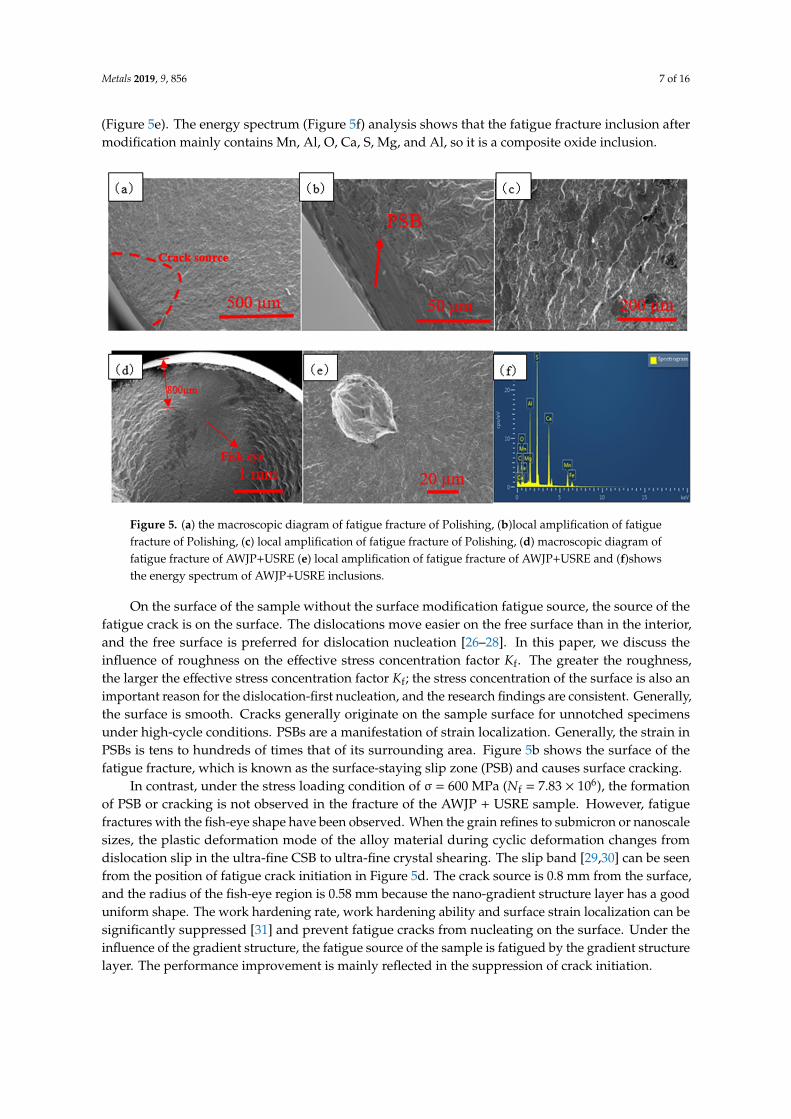
Through scanning electron microscopy (SEM) observation of the fatigue fracture of the polishedsubstrate and the composite surface, Figure 5a–c show the fatigue fracture morphology of the polishedsamples. It can be seen from Figure 5a that the fatigue source of the polished samples is located onthe surface of the samples and the sample is modified on the composite surface. The fatigue sourceof most of the sample is located in the subsurface or internal inclusion. When the fatigue life isgreater than approximately 106 cycles, the fatigue fracture is mostly due to internal inclusion cracking.Figure 5d–f shows the typical high-cycle fatigue fracture morphology of the modified compositesurface and polished substrate. The crack source region exhibits a typical “fish-eye” morphology atlow magnification (Figure 5d). In the heart of the fish-eye structure, there is a sandwich structure
Metals 2019, 9, 856 7 of 16
(Figure 5e). The energy spectrum (Figure 5f) analysis shows that the fatigue fracture inclusion aftermodification mainly contains Mn, Al, O, Ca, S, Mg, and Al, so it is a composite oxide inclusion.Metals 2019, 9, x FOR PEER REVIEW 7 of 16
Figure 5. (a) the macroscopic diagram of fatigue fracture of Polishing, (b)local amplification of fatigue fracture of Polishing, (c) local amplification of fatigue fracture of Polishing, (d) macroscopic diagram of fatigue fracture of AWJP+USRE (e) local amplification of fatigue fracture of AWJP+USRE and (f)shows the energy spectrum of AWJP+USRE inclusions.
On the surface of the sample without the surface modification fatigue source, the source of the fatigue crack is on the surface. The dislocations move easier on the free surface than in the interior, and the free surface is preferred for dislocation nucleation [26–28]. In this paper, we discuss the influence of roughness on the effective stress concentration factor Kf. The greater the roughness, the larger the effective stress concentration factor Kf; the stress concentration of the surface is also an important reason for the dislocation-first nucleation, and the research findings are consistent. Generally, the surface is smooth. Cracks generally originate on the sample surface for unnotched specimens under high-cycle conditions. PSBs are a manifestation of strain localization. Generally, the strain in PSBs is tens to hundreds of times that of its surrounding area. Figure 5b shows the surface of the fatigue fracture, which is known as the surface-staying slip zone (PSB) and causes surface cracking.
In contrast, under the stress loading condition of σ = 600 MPa (Nf = 7.83 × 10⁶), the formation of PSB or cracking is not observed in the fracture of the AWJP + USRE sample. However, fatigue fractures with the fish-eye shape have been observed. When the grain refines to submicron or nanoscale sizes, the plastic deformation mode of the alloy material during cyclic deformation changes from dislocation slip in the ultra-fine CSB to ultra-fine crystal shearing. The slip band [29,30] can be seen from the position of fatigue crack initiation in Figure 5d. The crack source is 0.8 mm from the surface, and the radius of the fish-eye region is 0.58 mm because the nano-gradient structure layer has a good uniform shape. The work hardening rate, work hardening ability and surface strain localization can be significantly suppressed [31] and prevent fatigue cracks from nucleating on the surface. Under the influence of the gradient structure, the fatigue source of the sample is fatigued by the gradient structure layer. The performance improvement is mainly reflected in the suppression of crack initiation.
Figure 5. (a) the macroscopic diagram of fatigue fracture of Polishing, (b)local amplification of fatiguefracture of Polishing, (c) local amplification of fatigue fracture of Polishing, (d) macroscopic diagram offatigue fracture of AWJP+USRE (e) local amplification of fatigue fracture of AWJP+USRE and (f)showsthe energy spectrum of AWJP+USRE inclusions.
On the surface of the sample without the surface modification fatigue source, the source of thefatigue crack is on the surface. The dislocations move easier on the free surface than in the interior,and the free surface is preferred for dislocation nucleation [26–28]. In this paper, we discuss theinfluence of roughness on the effective stress concentration factor Kf. The greater the roughness,the larger the effective stress concentration factor Kf; the stress concentration of the surface is also animportant reason for the dislocation-first nucleation, and the research findings are consistent. Generally,the surface is smooth. Cracks generally originate on the sample surface for unnotched specimensunder high-cycle conditions. PSBs are a manifestation of strain localization. Generally, the strain inPSBs is tens to hundreds of times that of its surrounding area. Figure 5b shows the surface of thefatigue fracture, which is known as the surface-staying slip zone (PSB) and causes surface cracking.
In contrast, under the stress loading condition of σ = 600 MPa (Nf = 7.83 × 10⁶), the formationof PSB or cracking is not observed in the fracture of the AWJP + USRE sample. However, fatiguefractures with the fish-eye shape have been observed. When the grain refines to submicron or nanoscalesizes, the plastic deformation mode of the alloy material during cyclic deformation changes fromdislocation slip in the ultra-fine CSB to ultra-fine crystal shearing. The slip band [29,30] can be seenfrom the position of fatigue crack initiation in Figure 5d. The crack source is 0.8 mm from the surface,and the radius of the fish-eye region is 0.58 mm because the nano-gradient structure layer has a gooduniform shape. The work hardening rate, work hardening ability and surface strain localization can besignificantly suppressed [31] and prevent fatigue cracks from nucleating on the surface. Under theinfluence of the gradient structure, the fatigue source of the sample is fatigued by the gradient structurelayer. The performance improvement is mainly reflected in the suppression of crack initiation.

Metals 2019, 9, 856 8 of 16
4. Discussion
4.1. Effect of Roughness on Fatigue Life
Figure 6a,b is a polished sample’s surface topography and the height map, it can be seen from theFigure 6a surface has left scar left by the polishing process, from Figure 6c,d is the surface topographyof samples after the abrasive water jet shot and a height map, from Figure 6c as you can see, the sampleafter AWJP surface has obvious pits left by abrasive particles, from Figure 7 shows the roughnessof the surface of samples after the abrasive water jet shot Ra is 1.577 microns. From Figure 6e,f isabrasive water jet shot + ultrasonic surface rolling surface morphology of the samples after the figureand the height map, from Figure 6f can see sample results compound after surface modification,surface without abrasive water pit, which is formed by the shot peening, from Figure 7 shows thecomposite surface roughness on the surface of the modified for Ra = 0.06, shows that composite surfacemodification has greatly improve the surface quality of the material.
Metals 2019, 9, x FOR PEER REVIEW 8 of 16
4. Discussion
4.1. Effect of Roughness on Fatigue Life
Figure 6a,b is a polished sample’s surface topography and the height map, it can be seen from the Figure 6a surface has left scar left by the polishing process, from Figure 6c,d is the surface topography of samples after the abrasive water jet shot and a height map, from Figure 6c as you can see, the sample after AWJP surface has obvious pits left by abrasive particles, from Figure 7 shows the roughness of the surface of samples after the abrasive water jet shot Ra is 1.577 microns. From Figure 6e,f is abrasive water jet shot + ultrasonic surface rolling surface morphology of the samples after the figure and the height map, from Figure 6f can see sample results compound after surface modification, surface without abrasive water pit, which is formed by the shot peening, from Figure 7 shows the composite surface roughness on the surface of the modified for Ra = 0.06, shows that composite surface modification has greatly improve the surface quality of the material.
(a) (b)
(c) (d)
(e) (f)
Figure 6. (a–f) The surface topography and height of Polishing, AWJP, and AWJP + USRE. Figure 6. (a–f) The surface topography and height of Polishing, AWJP, and AWJP + USRE.

Metals 2019, 9, 856 9 of 16Metals 2019, 9, x FOR PEER REVIEW 9 of 16
0.420
0.448
0.476
0.504
0.050
0.055
0.060
0.065
0.070
0.58
1.16
1.74
2.32
Polished Specimen
Ra
/μm
AWJP+USRE Specimen
AWJP Specimen
Figure 7. Surface roughness of materials under different processes.
Surface modification methods are an important factor that affects the surface quality for certain part sizes and material properties. According to the principles of fracture mechanics, the larger the surface roughness value, the larger the notch effect; that is, the larger the stress concentration factor, the worse the fatigue performance. During AWJP, the entrainment of the abrasive high-pressure water flow is equivalent to a projectile with a very large energy bombarding the metal surface so that the surface of the metal forms a special surface topography, such as pits. The geometry of the phase is due to many small indentations, resulting in stress concentrations on the working surface of the part. It is known from the fracture mechanics that the surface after processing can be regarded as composed of numerous microscopic notches. The influence of these rough uneven notches on fatigue can be expressed by the theoretical stress concentration factor Kt [32]:
t 1 2 γ hKρ
= + (5)
where h is the height of the microscopic roughness, ρ is the radius of curvature of the valley, and γ is the correlation coefficient of the ratio of the unevenness to the height. From Equation (5), the deeper the valley, the smaller the radius of curvature, and the easier it is to form stress concentrations. The influence of the stress concentration factor on the fatigue properties of the material is also related to whether the material is sensitive to the notch. Therefore, the effective stress concentration factor Kf is introduced [33]:
f t1 ( 1)K q K= + − (6)
where q is the sensitivity of the material to stress concentration, which is a function of the material strength and shape of the micro-notch size. As the strength of the material increases, the value of ρ decreases and the value of q increases. Equation (6) shows that the larger the surface roughness is, the larger the stress concentration factor; that is, the larger the effective stress concentration factor is, the easier the fatigue crack initiation, and the lower the fatigue life. In contrast, crack initiation is difficult, so the fatigue life increases. Therefore, it is not easy to sprout a crack on a smooth surface, and cracks in samples after the composite treatment are initiated in the subsurface. This difference in the location of the crack initiation results in a higher initial life for the modified composite surface.
4.2. Residual Stress Impact on Fatigue Performance
It can be seen from Figure 8 that a residual stress of −472 MPa appears at a position of approximately 50 µm from the surface after AWJP. The residual stress after single rolling is −697 MPa, and the residual stress of the surface-modified composite is larger than those after single treatment methods and is −846 MPa. The residual stress introduced by the surface treatment has an important influence on the fatigue life of the sample. When the residual stress is superimposed on the fatigue
Figure 7. Surface roughness of materials under different processes.
Surface modification methods are an important factor that affects the surface quality for certainpart sizes and material properties. According to the principles of fracture mechanics, the larger thesurface roughness value, the larger the notch effect; that is, the larger the stress concentration factor,the worse the fatigue performance. During AWJP, the entrainment of the abrasive high-pressure waterflow is equivalent to a projectile with a very large energy bombarding the metal surface so that thesurface of the metal forms a special surface topography, such as pits. The geometry of the phase is dueto many small indentations, resulting in stress concentrations on the working surface of the part. It isknown from the fracture mechanics that the surface after processing can be regarded as composedof numerous microscopic notches. The influence of these rough uneven notches on fatigue can beexpressed by the theoretical stress concentration factor Kt [32]:
Kt = 1 + 2
√γ
hρ
(5)
where h is the height of the microscopic roughness, ρ is the radius of curvature of the valley, and γ isthe correlation coefficient of the ratio of the unevenness to the height. From Equation (5), the deeperthe valley, the smaller the radius of curvature, and the easier it is to form stress concentrations.The influence of the stress concentration factor on the fatigue properties of the material is also relatedto whether the material is sensitive to the notch. Therefore, the effective stress concentration factor Kf
is introduced [33]:Kf = 1 + q(Kt − 1) (6)
where q is the sensitivity of the material to stress concentration, which is a function of the materialstrength and shape of the micro-notch size. As the strength of the material increases, the value of ρdecreases and the value of q increases. Equation (6) shows that the larger the surface roughness is,the larger the stress concentration factor; that is, the larger the effective stress concentration factoris, the easier the fatigue crack initiation, and the lower the fatigue life. In contrast, crack initiation isdifficult, so the fatigue life increases. Therefore, it is not easy to sprout a crack on a smooth surface,and cracks in samples after the composite treatment are initiated in the subsurface. This difference inthe location of the crack initiation results in a higher initial life for the modified composite surface.

Metals 2019, 9, 856 10 of 16
4.2. Residual Stress Impact on Fatigue Performance
It can be seen from Figure 8 that a residual stress of−472 MPa appears at a position of approximately50 µm from the surface after AWJP. The residual stress after single rolling is −697 MPa, and the residualstress of the surface-modified composite is larger than those after single treatment methods and is−846 MPa. The residual stress introduced by the surface treatment has an important influence on thefatigue life of the sample. When the residual stress is superimposed on the fatigue load, the stressstate of the sample changes, which affects the nucleation and expansion of a fatigue crack. In general,the residual stress affects the fatigue behaviour of a material in the same way as the load applied to thematerial. If the residual stress is compressive, the fatigue properties of the material can be improved;if it is a tensile stress, the fatigue properties of the material are decreased. The residual compressivestress generated by surface strengthening can not only suppress the initiation of fatigue cracks butalso increase the crack closing effect and reduce the expansion rate of short cracks [34], which helps toimprove the fatigue performance of the specimen.
Metals 2019, 9, x FOR PEER REVIEW 10 of 16
load, the stress state of the sample changes, which affects the nucleation and expansion of a fatigue crack. In general, the residual stress affects the fatigue behaviour of a material in the same way as the load applied to the material. If the residual stress is compressive, the fatigue properties of the material can be improved; if it is a tensile stress, the fatigue properties of the material are decreased. The residual compressive stress generated by surface strengthening can not only suppress the initiation of fatigue cracks but also increase the crack closing effect and reduce the expansion rate of short cracks [34], which helps to improve the fatigue performance of the specimen.
0 100 200 300 400 500 600-900
-800
-700
-600
-500
-400
-300
-200
-100
0
Res
idua
l Str
essM
Pa
Distance from surface/μm
AWJP+USRE AWJP USRE
Figure 8. Variation of the residual stress along the thickness direction.
4.3. Influence of Deformation Layer Structure on Fatigue Performance
Deformation-induced grain refinement is the main grain refinement mechanism in the composite modification process. AISI 4340 steel can be considered a high-level dislocation metal, so its plastic deformation is mainly carried out by dislocation slip. The dislocation gradually entangled with each other and formed cellular structure in the grain, as shown in Figure 9a. The dislocation density in the grains increases with increasing deformation, and the dislocations gradually become entangled with each other and form a cell structure inside the grain. As the amount of deformation continues to increase, the cell structure is turned into a subgrain (with an independent slip system). When the amount of deformation is further increased, a subcrystal is transformed into a grain with a small angle or a grain with a large angle [35]. On the surface of the metal, high strain rates are easily accommodated to create a rearrangement and annihilation in the vicinity of dislocation walls and dislocation entanglements. When the rate of dislocation generation and quenching reaches equilibrium, the grain size is correspondingly stable; Finally, a nanocrystalline structure with a randomly distributed orientation is formed. Eventually, the formation of new nanocrystalline grains is seen in Figure 9b the near surface region forms a nanocrystalline layer of approximately 100 µm.
(a) (b)
Figure 8. Variation of the residual stress along the thickness direction.
4.3. Influence of Deformation Layer Structure on Fatigue Performance
Deformation-induced grain refinement is the main grain refinement mechanism in the compositemodification process. AISI 4340 steel can be considered a high-level dislocation metal, so its plasticdeformation is mainly carried out by dislocation slip. The dislocation gradually entangled with eachother and formed cellular structure in the grain, as shown in Figure 9a. The dislocation density inthe grains increases with increasing deformation, and the dislocations gradually become entangledwith each other and form a cell structure inside the grain. As the amount of deformation continuesto increase, the cell structure is turned into a subgrain (with an independent slip system). When theamount of deformation is further increased, a subcrystal is transformed into a grain with a smallangle or a grain with a large angle [35]. On the surface of the metal, high strain rates are easilyaccommodated to create a rearrangement and annihilation in the vicinity of dislocation walls anddislocation entanglements. When the rate of dislocation generation and quenching reaches equilibrium,the grain size is correspondingly stable; Finally, a nanocrystalline structure with a randomly distributedorientation is formed. Eventually, the formation of new nanocrystalline grains is seen in Figure 9b thenear surface region forms a nanocrystalline layer of approximately 100 µm.

Metals 2019, 9, 856 11 of 16
Metals 2019, 9, x FOR PEER REVIEW 10 of 16
load, the stress state of the sample changes, which affects the nucleation and expansion of a fatigue crack. In general, the residual stress affects the fatigue behaviour of a material in the same way as the load applied to the material. If the residual stress is compressive, the fatigue properties of the material can be improved; if it is a tensile stress, the fatigue properties of the material are decreased. The residual compressive stress generated by surface strengthening can not only suppress the initiation of fatigue cracks but also increase the crack closing effect and reduce the expansion rate of short cracks [34], which helps to improve the fatigue performance of the specimen.
0 100 200 300 400 500 600-900
-800
-700
-600
-500
-400
-300
-200
-100
0
Res
idua
l Str
essM
Pa
Distance from surface/μm
AWJP+USRE AWJP USRE
Figure 8. Variation of the residual stress along the thickness direction.
4.3. Influence of Deformation Layer Structure on Fatigue Performance
Deformation-induced grain refinement is the main grain refinement mechanism in the composite modification process. AISI 4340 steel can be considered a high-level dislocation metal, so its plastic deformation is mainly carried out by dislocation slip. The dislocation gradually entangled with each other and formed cellular structure in the grain, as shown in Figure 9a. The dislocation density in the grains increases with increasing deformation, and the dislocations gradually become entangled with each other and form a cell structure inside the grain. As the amount of deformation continues to increase, the cell structure is turned into a subgrain (with an independent slip system). When the amount of deformation is further increased, a subcrystal is transformed into a grain with a small angle or a grain with a large angle [35]. On the surface of the metal, high strain rates are easily accommodated to create a rearrangement and annihilation in the vicinity of dislocation walls and dislocation entanglements. When the rate of dislocation generation and quenching reaches equilibrium, the grain size is correspondingly stable; Finally, a nanocrystalline structure with a randomly distributed orientation is formed. Eventually, the formation of new nanocrystalline grains is seen in Figure 9b the near surface region forms a nanocrystalline layer of approximately 100 µm.
(a) (b)
Figure 9. TEM image of the AWJP + USRP sample (a) at a depth of 200 µm and (b) a depth of 150 µm.
Figure 10a–e is a composite surface modified AISI4340 steel and selected different depths of TEMbright field image and regional electron diffraction pattern from the sample surface. It can be seen fromFigure 10 that as the depth of the surface layer increases, it is clear from the gradient diffraction ring inFigure 10 that the number of diffraction rings increases and the grain size decreases as it approachesthe surface. As can be seen from Figure 11, after the surface nanocrystals pass through AWJP + USRE,the grain size is about 70–80 nm at a distance of 40 µm from the surface. At a depth of about 300 µmfrom the surface of the sample, the size of the crystal grains was about 1.6 µm in the vicinity of thesubstrate. It can be seen from Figure 10a that the evolution of the structure can be seen at a distance of40 µm from the surface of the sample. The morphology is different from martensite and seems to befragmentation. From Figure 10b at 80 µm from the surface of the sample, it can be seen in the TEMimage that the black particles may be precipitated carbides due to the high tempering temperature.Martensite morphology is clearly seen in Figure 10d,e, including martensite mass and martensitebar. These results indicate that the deformation mechanism of the modified composite involves thetransformation from martensite block in the transparent matrix to deformed and bent martensite tobroken nanocrystals.
To reduce the energy of the system, the high-density dislocation grain size can significantly affectthe crack initiation resistance during the fatigue process of the material. In general, grain refinementincreases the strength of the material and improves its resistance to fatigue crack initiation. For smoothunnotched specimens, fatigue cracks generally develop on the surface of the material. Therefore,the introduction of nanocrystals on the surface of the sample increases the strength and hardnessof the surface, inhibits crack initiation on the surface, and improves the fatigue properties of thematerial. The “nano-submicron” gradient structure from the surface layer to the matrix of the modifiedcomposite surface sample is an ideal structure to resist fatigue crack initiation and expansion.
The hardness is measured using a HVS-1000 microhardness tester (Lunjie Motor InstrumentCompany, Shanghai, China) on a sample treated with AWJP only and USRE only and a sample treatedwith AWJP + USRE. It can be seen from Figure 12 that the surface hardness after USRE can reach471 HV, and the deformation is seen from the hardness curve. The layer is approximately 180 µmfrom the surface. The hardness of the surface after AWJP reaches 510 HV, the plastic rheology layer isapproximately 200 µm from the surface. The composite surface modification combines the advantagesbetween the two. The hardness reaches 586 HV and is 176 HV greater than that of the of the substrate(410 HV) and the plastic flow region. The layer changed at 280 µm from the surface of the substrate.

Metals 2019, 9, 856 12 of 16Metals 2019, 9, x FOR PEER REVIEW 12 of 16
Figure 10. AWJP + USRE AISI 4340 steel TEM bright-field images and selected area electron diffraction pattern for different depths from the sample surface. (a) 40 µm from the surface; (b) 80 µm from the surface; (c) 120 µm from the surface; (d) 200 µm from the surface; (e) 300 µm from the surface.
200
200 nm
40 µm
80 µm
120 µm
200 µm
300 µm
(a)
(b)
(c)
(d)
(e)
200 nm
200 nm
200 nm
Figure 10. AWJP + USRE AISI 4340 steel TEM bright-field images and selected area electron diffractionpattern for different depths from the sample surface. (a) 40 µm from the surface; (b) 80 µm from thesurface; (c) 120 µm from the surface; (d) 200 µm from the surface; (e) 300 µm from the surface.

Metals 2019, 9, 856 13 of 16Metals 2019, 9, x FOR PEER REVIEW 13 of 16
0 50 100 150 200 250 300
0
500
1000
1500
2000
2500
3000
3500
AWJP+USRP
Gra
in s
ize/
nm
Depth (μm)
Figure 11. Comparison of grain size along the thickness direction.
To reduce the energy of the system, the high-density dislocation grain size can significantly affect the crack initiation resistance during the fatigue process of the material. In general, grain refinement increases the strength of the material and improves its resistance to fatigue crack initiation. For smooth unnotched specimens, fatigue cracks generally develop on the surface of the material. Therefore, the introduction of nanocrystals on the surface of the sample increases the strength and hardness of the surface, inhibits crack initiation on the surface, and improves the fatigue properties of the material. The “nano-submicron” gradient structure from the surface layer to the matrix of the modified composite surface sample is an ideal structure to resist fatigue crack initiation and expansion.
The hardness is measured using a HVS-1000 microhardness tester (Lunjie Motor Instrument Company, Shanghai, China) on a sample treated with AWJP only and USRE only and a sample treated with AWJP + USRE. It can be seen from Figure 12 that the surface hardness after USRE can reach 471 HV, and the deformation is seen from the hardness curve. The layer is approximately 180 µm from the surface. The hardness of the surface after AWJP reaches 510 HV, the plastic rheology layer is approximately 200 µm from the surface. The composite surface modification combines the advantages between the two. The hardness reaches 586 HV and is 176 HV greater than that of the of the substrate (410 HV) and the plastic flow region. The layer changed at 280 µm from the surface of the substrate.
0 100 200 300 400 500 600
400
420
440
460
480
500
520
540
560
580
600
Mic
roh
ard
ne
ss/H
V
Distance from surface/μm
AWJP+USRE USRE AWJP
Figure 12. Comparison of microhardness along the thickness direction.
Figure 11. Comparison of grain size along the thickness direction.
Metals 2019, 9, x FOR PEER REVIEW 13 of 16
0 50 100 150 200 250 300
0
500
1000
1500
2000
2500
3000
3500
AWJP+USRP
Gra
in s
ize/
nm
Depth (μm)
Figure 11. Comparison of grain size along the thickness direction.
To reduce the energy of the system, the high-density dislocation grain size can significantly affect the crack initiation resistance during the fatigue process of the material. In general, grain refinement increases the strength of the material and improves its resistance to fatigue crack initiation. For smooth unnotched specimens, fatigue cracks generally develop on the surface of the material. Therefore, the introduction of nanocrystals on the surface of the sample increases the strength and hardness of the surface, inhibits crack initiation on the surface, and improves the fatigue properties of the material. The “nano-submicron” gradient structure from the surface layer to the matrix of the modified composite surface sample is an ideal structure to resist fatigue crack initiation and expansion.
The hardness is measured using a HVS-1000 microhardness tester (Lunjie Motor Instrument Company, Shanghai, China) on a sample treated with AWJP only and USRE only and a sample treated with AWJP + USRE. It can be seen from Figure 12 that the surface hardness after USRE can reach 471 HV, and the deformation is seen from the hardness curve. The layer is approximately 180 µm from the surface. The hardness of the surface after AWJP reaches 510 HV, the plastic rheology layer is approximately 200 µm from the surface. The composite surface modification combines the advantages between the two. The hardness reaches 586 HV and is 176 HV greater than that of the of the substrate (410 HV) and the plastic flow region. The layer changed at 280 µm from the surface of the substrate.
0 100 200 300 400 500 600
400
420
440
460
480
500
520
540
560
580
600
Mic
roh
ard
ne
ss/H
V
Distance from surface/μm
AWJP+USRE USRE AWJP
Figure 12. Comparison of microhardness along the thickness direction. Figure 12. Comparison of microhardness along the thickness direction.
In the actual service of materials, the fatigue life of materials is a powerful guarantee for industrialsafety production. Many scholars predict the fatigue life of materials [34,35]. To study the main factorsaffecting the fatigue performance of gradient structures, the paper by Bagherifard et al. [36] consideredthe effects of residual stress in this manner:
σf = σtf
1 + (σbf
σtf− 1
)(x′
2/b
)KD( FWHMP
FWHMNP
)(CSP
CSNP
)(7)
where σf is the fatigue limit, σtf is the pull-fatigue limit, σbf is the bending fatigue limit, x’ is therelevant stress gradient (RSG), b is the size parameter of the sample, FWHMP is the half-width of thediffraction peak of the sample after surface treatment, FWHMNP is the half-width of the diffractionpeak of the base material, CSP is the surface roughness of the sample after treatment, and CSNP isthe surface roughness of the base material. It can be seen that the FWHM in the X-ray diffractionpeak for the composite treatment is increased by 18.7% relative to the matrix FWHM. The fatigueproperties of the materials before and after composite surface modification are improved by 16.8%.Therefore, the gradient structure after composite surface modification is the main reason for the fatigueproperties of the materials. For the roughness coefficient CS, the roughness of the polished substratehas an Ra of 0.4, which meets the standard of finishing. The sample is sanded along the axial directionwith sandpaper. Because the experiment involves tensile fatigue, the roughness does not fatigue thematerial. The effect of the residual stress on the fatigue performance in the nano-gradient structure hasbeen investigated by scholars [37,38] who annealed the sample after peening, leaving the hardened

Metals 2019, 9, 856 14 of 16
layer and completely releasing the residual stress. The removal of the stress proves that the fatigueperformance of the material is still greatly improved in the case of only the hard layer, and thus theresidual stress does not appear to be the most important factor. In summary, the roughness and residualstress of the material play a positive role in the improvement of the fatigue properties of the material,and among the factors considered in this study, the gradient structure after the composite modificationis the most important one for improving fatigue properties.
5. Conclusions
1. In the surface state, the modified composite plastic deformation layer reaches 310 µm from thesurface. The composite modification at a depth of 90 µm is comparable to a single modified layerat a depth of 220 µm; the material Ra is reduced from 1.57 µm to 0.06 µm through after AWJP.A crystalline layer appears 40 µm away from the surface. The particle size reached 70 nm.
2. Composite modification can obtain a smooth gradient structure. the fatigue limit of the unmodifiedmatrix is increased from 510 MPa to 595.9 MPa (an increase of 85.9 MPa), and the roughness,residual stress, and gradient are analysed herein. The effect of the structure on the fatigueproperties of the material indicates that the gradient structure is the most important factoraffecting the fatigue properties of the material. The surface and the fine grain on the surface caneffectively prevent the initiation of fatigue crack in the fatigue process, and the large grain atthe center can affect the propagation of fatigue crack in the fatigue process, so as to improve thefatigue performance of the material.
Author Contributions: Conceptualization, H.F. and L.Y.; methodology, H.F.; formal analysis, H.F.; writing—originaldraft preparation, H.F.; writing—review and editing H.F.; supervision, L.Y.
Funding: This research was funded by “National Natural Science Foundation of China, grant number 51671060”“The Science and Technology Project of Guizhou Province, grant number (2014) 6012” and “Guizhou Science andTechnology Talent Cooperation Platform Project, grant number (2019) 5303”.
Conflicts of Interest: The authors declare no conflict of interest.
References
1. Hensel, J.; Eslami, H.; Nitschke-Pagel, T.; Dilger, K. Fatigue strength enhancement of butt welds by means ofshot peening and clean blasting. Metals 2019, 9, 744. [CrossRef]
2. Dai, K.; Shaw, L. Analysis of fatigue resistance improvements via surface severe plastic deformation.Int. J. Fatigue 2008, 30, 1398–1408. [CrossRef]
3. Yoon, S.J.; Park, J.H.; Choi, N.S. Fatigue life analysis of shot-peened bearing steel. J. Mech. Sci. Technol. 2012,26, 1747–1752. [CrossRef]
4. Dixit, U.S.; Joshi, S.N.; Davim, J.P. Incorporation of material behavior in modeling of metal forming andmachining processes: A review. Mater. Des. 2011, 32, 655–3670. [CrossRef]
5. Krahmer, D.M.; Polvorosa, R.; López de Lacalle, L.N.; Alonso-Pinillos, U.; Abate, G.; Riu, F. Alternatives forspecimen manufacturing in tensile testing of steel plates. Exp. Tech. 2016, 40, 1555–1565. [CrossRef]
6. Uddin, M.S.; Hall, C.; Hooper, R.; Charrault, E.; Murphy, P.; Santos, V. Finite element analysis of surfaceintegrity in deep ball-burnishing of a biodegradable AZ31B Mg alloy. Metals 2018, 8, 136. [CrossRef]
7. Rodríguez, A.; Calleja, A.; López de Lacalle, L.N.; Pereira, O.; González, H.; Urbikain, G.; Laye, J. Burnishingof FSW aluminum Al–Cu–Li components. Metals 2019, 9, 260. [CrossRef]
8. Dzierwa, A.; Markopoulos, A.P. Influence of ball-burnishing process on surface topography parameters andtribological properties of hardened steel. Machines 2019, 7, 11. [CrossRef]
9. Dzionk, S.; Scibiorski, B.; Przybylski, W. Surface texture analysis of hardened shafts after ceramic ballburnishing. Materials 2019, 12, 204. [CrossRef]
10. Nie, B.; Zhao, Z.; Chen, D.; Liu, S.; Lu, M.; Zhang, J.; Liang, F. Effect of basketweave microstructure on veryhigh cycle fatigue behavior of TC21 titanium alloy. Metals 2018, 8, 401. [CrossRef]
11. Torres, M.A.S.; Voorwald, H.J.C. An evaluation of shot peening residual stress and stress relaxation on thefatigue life of AISI 4340 steel. Int. J. Fatigue 2002, 24, 877–886. [CrossRef]
Metals 2019, 9, 856 15 of 16
12. Wu, D.; Zhang, D.; Yao, C. Effect of turning and surface polishing treatments on surface integrity and fatigueperformance of nickel-based alloy GH4169. Metals 2018, 8, 549. [CrossRef]
13. Klein, M.W.; Smaga, M.; Beck, T. Surface morphology and its influence on cyclic deformation behavior ofhigh-Mn TWIP steel. Metals 2018, 8, 832. [CrossRef]
14. Troiani, E.; Zavatta, N. The Effect of laser peening without coating on the fatigue of a 6082-T6 aluminumalloy with a curved notch. Metals 2019, 9, 728. [CrossRef]
15. Lieblich, M.; Barriuso, S.; Ibáñez, J.; Ruiz-de-Lara, L.; Díaz, M.; Ocaña, J.L.; Alberdi, A.; González-Carrasco, J.L.On the fatigue behavior of medical Ti6Al4V roughened by grit blasting and abrasiveless waterjet peening.J. Mech. Behav. Biomed. Mater. 2016, 63, 390–398. [CrossRef] [PubMed]
16. Zehnder, A.T.; Rosakis, A.J. Dynamic fracture initiation and propagation in 4340 steel under impact loading.Int. J. Fract. 1990, 43, 271–285. [CrossRef]
17. Ning, J.; Liang, S.Y. Evaluation of an analytical model in the prediction of machining temperature of AISI1045 steel and AISI 4340 steel. J. Manuf. Mater. Process 2018, 2, 74. [CrossRef]
18. Zhong, L.; Liang, Y.; Yan, Z.; Hu, H. Effect of shot peening on high cycle fatigue limit of FGH4097 P/Msuperalloys at room temperature. Rare Metal Mater. Eng. 2018, 47, 2198–2204.
19. Hong, W.; Qing, G. Study of the Fatigue behavior and the mechanism of fatigue failure within ultra-high-cycleregimein 40 Cr steel and 50 axles steel (abstract of the Ph.D. dissertation). China Railway Sci. 2006, 27, 136–138.
20. Li, R.H. Improved fatigue properties of ultrafine-grained copper under cyclic torsion loading. Acta Mater.2013, 61, 5857–5868. [CrossRef]
21. Höppel, H.W. An overview: Fatigue behaviour of ultrafine-grained metals and alloys. Int. J. Fatigue 2006, 28,1001–1010. [CrossRef]
22. Zhao, X.; Zhang, Y.; Liu, Y. Surface Characteristics and Fatigue Behavior of Gradient Nano-StructuredMagnesium Alloy. Metals 2017, 7, 62. [CrossRef]
23. Fujii, T.; Lin, F. Fatigue behavior of a plain-woven glass fabric laminate under tension/torsion biaxial loading.J. Compos. Mater. 1995, 29, 573–590. [CrossRef]
24. Zhang, Z.F.; Wang, Z.G. Dependence of intergranular fatigue cracking on the interactions of persistent slipbands with grain boundaries. Acta Mater. 2003, 29, 347–364. [CrossRef]
25. Kumar, K.S.; Swygenhoven, H.V.; Suresh, S. Mechanical behavior of nanocrystalline metals and alloys.Acta Mater. 2003, 29, 5743–5774. [CrossRef]
26. Reck, A.; Zeuner, A.T.; Zimmermann, M. Fatigue behavior of non-optimized laser-cut medical gradeTi-6Al-4V-ELI sheets and the effects of mechanical post-processing. Metals 2019, 9, 843. [CrossRef]
27. Vinogradov, A. Fatigue limit and crack growth in ultra-fine grain metals produced by severe plasticdeformation. J. Mater. Sci. 2007, 42, 1797–1808. [CrossRef]
28. Huang, H.W. Enhancing torsion fatigue behaviour of a martensitic stainless steel by generating gradientnanograined layer via surface mechanical grinding treatment. Mater. Sci. Technol. 2013, 29, 1200–1205.[CrossRef]
29. Cavaliere, P. Crack tip plasticity in plastically graded Ni–W electrodeposited nanocrystalline alloys.Comput. Mater. Sci. 2008, 41, 440–449. [CrossRef]
30. Fang, T.H. Revealing extraordinary intrinsic tensile plasticity in gradient nano-grained copper. Science 2011,331, 1587–1590. [CrossRef]
31. Huang, J.Y. Microstructures and dislocation configurations in nanostructured Cu processed by repetitivecorrugation and straightening. Acta Mater. 2001, 49, 1497–1505. [CrossRef]
32. Spagnoli, A.; Terzano, M.; Brighenti, R.; Artoni, F.; Carpinteri, A. How Soft Polymers Cope with Cracks andNotches. Appl. Sci. 2019, 9, 1086. [CrossRef]
33. Peterson, R.E.; Plunkett, R. Stress concentration factors. Nav. Eng. J. 1955, 67, 697–708.34. Gao, Y. Influence of Shot Peening on Tension-Tension Fatigue Properties of TC18 Titanium Alloy. Rare Metal
Mater. Eng. 2004, 33, 1000–1002.35. Dalaei, K.; Karlsson, B. Influence of overloading on fatigue durability and stability of residual stresses in
shot peened normalized steel. Mater. Sci. Eng. A 2011, 528, 7323–7330. [CrossRef]36. Bagherifard, S.; Guagliano, M. Application of different fatigue strength criteria on shot peened notched parts.
Part 2: Nominal and local stress approaches. Appl. Surf. Sci. 2014, 289, 173–179. [CrossRef]

Metals 2019, 9, 856 16 of 16
37. Nikitin, I. Mechanical and thermal stability of mechanically induced near-surface nanostructures. Mater. Sci.Eng. A 2005, 403, 318–327. [CrossRef]
38. Dalaei, K.; Karlsson, B.; Svensson, L.E. Stability of shot peening induced residual stresses and their influenceon fatigue lifetime. Mater. Sci. Eng. A 2011, 528, 1008–1015. [CrossRef]
© 2019 by the authors. Licensee MDPI, Basel, Switzerland. This article is an open accessarticle distributed under the terms and conditions of the Creative Commons Attribution(CC BY) license (http://creativecommons.org/licenses/by/4.0/).