study on long term concrete deterioration due to sulfuric … papers/data/e144.pdf · study on long...
TRANSCRIPT

STUDY ON LONG TERM CONCRETE
DETERIORATION DUE TO SULFURIC ACID
Yutaka OOKAME1, Yuji HATANO
2 and Kenji KAWAI
3
1,2,3Hiroshima University, Japan
*1,*2,*3 1-3-2 Kagamiyama Higashi-Hiroshima, Hiroshima 739-8511 Japan ,
ABSTRACT
Recently, the deterioration of concrete caused by sulfuric acid attacks in sewage and waste
water treatment plants has been reported. In this study, prismatic concrete (W/B=0.55)
specimens in which a part of cement was replaced with blast furnace slag, fly ash and silica
fume were prepared. There were coated with acid-resistant epoxy-acrylic resin and immersed
in flowing (0.7~0.9 m/s) sulfuric acid solution of concentrations 2 mol/L, 1 mol/L, 0.09
mol/L and 0.006 mol/L, and the effects of the flow of solution as well as the use of mineral
admixtures were investigated. The results showed that there was a linear relationship
between the CaO and both the duration before the beginning of peeling of concrete as well as
the erosion rate.
Keywords. Sulfuric acid, Blast furnace slag, Fly ash, Silica fume, Deterioration
INTRODUCTIONS
Recently the deterioration of concrete caused by sulfuric acid attacks in sewage and waste
water treatment plants has been reported. The deterioration of concrete by sulfuric acid
attacks can be characterized by the erosion of concrete due to sulfuric acid and erosion
caused by the expansion of products due to the reaction of the calcium compounds in
concrete with sulfuric acid. As a countermeasure to this deterioration, the development of
acid resistant cementitious material using multiple mineral admixtures for the purpose of
inhibiting the production of calcium hydroxide is performed. It has been confirmed that the
multiple use of mineral admixtures can significantly reduce the erosion due to sulfuric acid
attacks (SOEDA 1991), but investigations on the performance of such materials have not
been carried out enough. It is thought that both the understanding of the performance of acid
resistant cementitious material, and the evaluation of the resistance to sulfuric acid for these
types of materials can lead to the development of much higher-quality acid resistant
cementitious materials. On the other hand, it is thought that the flow of sewage materials
accelerates the deterioration of concrete caused by sulfuric acid. This study aimed at
clarifying the effect of the flow of fluid on concrete deterioration caused by sulfuric acid
attack, together the effect of the use of mineral admixtures.
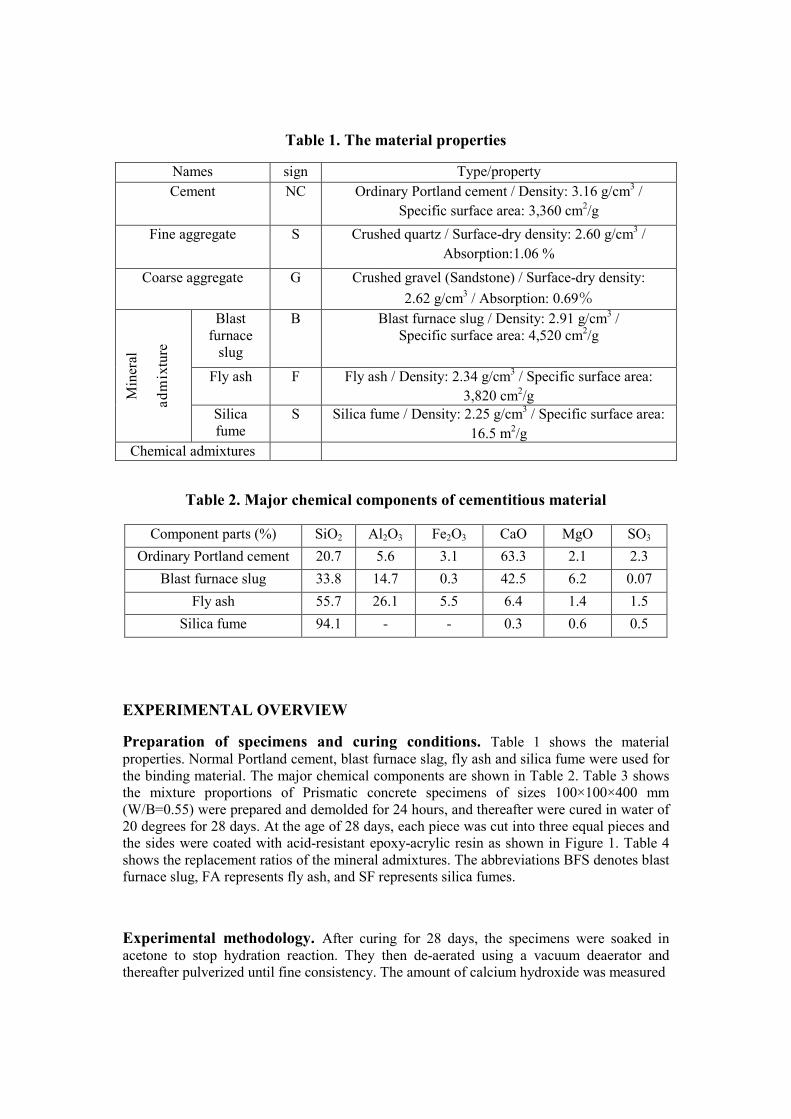
Table 1. The material properties
Names sign Type/property
Cement NC Ordinary Portland cement / Density: 3.16 g/cm3 /
Specific surface area: 3,360 cm2/g
Fine aggregate S Crushed quartz / Surface-dry density: 2.60 g/cm3 /
Absorption:1.06 %
Coarse aggregate G Crushed gravel (Sandstone) / Surface-dry density:
2.62 g/cm3 / Absorption: 0.69%
Min
eral
adm
ixtu
re
Blast
furnace
slug
B Blast furnace slug / Density: 2.91 g/cm3 /
Specific surface area: 4,520 cm2/g
Fly ash F Fly ash / Density: 2.34 g/cm3 / Specific surface area:
3,820 cm2/g
Silica
fume
S Silica fume / Density: 2.25 g/cm3 / Specific surface area:
16.5 m2/g
Chemical admixtures
Table 2. Major chemical components of cementitious material
Component parts (%) SiO2 Al2O3 Fe2O3 CaO MgO SO3
Ordinary Portland cement 20.7 5.6 3.1 63.3 2.1 2.3
Blast furnace slug 33.8 14.7 0.3 42.5 6.2 0.07
Fly ash 55.7 26.1 5.5 6.4 1.4 1.5
Silica fume 94.1 - - 0.3 0.6 0.5
EXPERIMENTAL OVERVIEW
Preparation of specimens and curing conditions. Table 1 shows the material
properties. Normal Portland cement, blast furnace slag, fly ash and silica fume were used for
the binding material. The major chemical components are shown in Table 2. Table 3 shows
the mixture proportions of Prismatic concrete specimens of sizes 100×100×400 mm
(W/B=0.55) were prepared and demolded for 24 hours, and thereafter were cured in water of
20 degrees for 28 days. At the age of 28 days, each piece was cut into three equal pieces and
the sides were coated with acid-resistant epoxy-acrylic resin as shown in Figure 1. Table 4
shows the replacement ratios of the mineral admixtures. The abbreviations BFS denotes blast
furnace slug, FA represents fly ash, and SF represents silica fumes.
Experimental methodology. After curing for 28 days, the specimens were soaked in
acetone to stop hydration reaction. They then de-aerated using a vacuum deaerator and
thereafter pulverized until fine consistency. The amount of calcium hydroxide was measured

Table 3. Mixture proportion of concrete specimens
Maximum
size of
coarse
aggregate
Slump
(cm)
content
20 10
Table 4. Concrete specimen name and
replacement rate of each mineral
admixture
Names OPC B
NC 100 -
B30 70 30
F30 70 -
S20 80 -
B30F30 40 30
B30S20 50 30
F30S20 50 -
B30F30S20 20 30
using TG-DTA, and the pore volume of
Mercury Intrusion Porosimetry
acrylic resin, they were immersed in flowing (0.7
concentrations 2 mol/L, 1 mol/L, 0.09 mol/L and 0.006 mol/L, and for comparison purposes,
some specimens were immersed in non
neutralization depth of each specimen were m
minimum graduation of 0.05 mm, while the mass loss was measured using a mass meter of
minimum graduation of 0.1 g at fixed durations. Erosion depth here is defined as the
difference between the original length of the
In the case where the deterioration products remained attached to the concrete specimen's
surface at the time of measurement, they were considered as a part of the concrete specimens
and were not removed. R
measurement point. Then neutralization length was measured using phenolphthalein.
Table 3. Mixture proportion of concrete specimens
Air
content
(%)
W/B
Unit content(kg/m3
Water Binding material
Fine aggregate
5.0 0.55 174 316 830
specimen name and
replacement rate of each mineral
admixture
Coated with acid resistant epoxy
Figure 1. Outline of the specimens
B F S
- -
30 - -
30 -
- 20
30 30 -
30 - 20
30 20
30 30 20
pore volume of the fine pulverized specimens was measured
Mercury Intrusion Porosimetry. After the specimens were coated with acid-
mmersed in flowing (0.7 ~ 0.9 m/s) sulfuric acid solutions of
concentrations 2 mol/L, 1 mol/L, 0.09 mol/L and 0.006 mol/L, and for comparison purposes,
some specimens were immersed in non-flowing sulfuric acid solution. The erosion depth and
neutralization depth of each specimen were measured using a vernier caliper with a
minimum graduation of 0.05 mm, while the mass loss was measured using a mass meter of
minimum graduation of 0.1 g at fixed durations. Erosion depth here is defined as the
difference between the original length of the specimen and the length measured after erosion.
In the case where the deterioration products remained attached to the concrete specimen's
surface at the time of measurement, they were considered as a part of the concrete specimens
Result of the measurement was used average
Then neutralization length was measured using phenolphthalein.
3)
aggregate Coarse
aggregate
998
Coated with acid resistant epoxy-acrylic resin
1. Outline of the specimens
specimens was measured using
-resistant epoxy-
m/s) sulfuric acid solutions of
concentrations 2 mol/L, 1 mol/L, 0.09 mol/L and 0.006 mol/L, and for comparison purposes,
flowing sulfuric acid solution. The erosion depth and
easured using a vernier caliper with a
minimum graduation of 0.05 mm, while the mass loss was measured using a mass meter of
minimum graduation of 0.1 g at fixed durations. Erosion depth here is defined as the
specimen and the length measured after erosion.
In the case where the deterioration products remained attached to the concrete specimen's
surface at the time of measurement, they were considered as a part of the concrete specimens
ge results of each
Then neutralization length was measured using phenolphthalein.
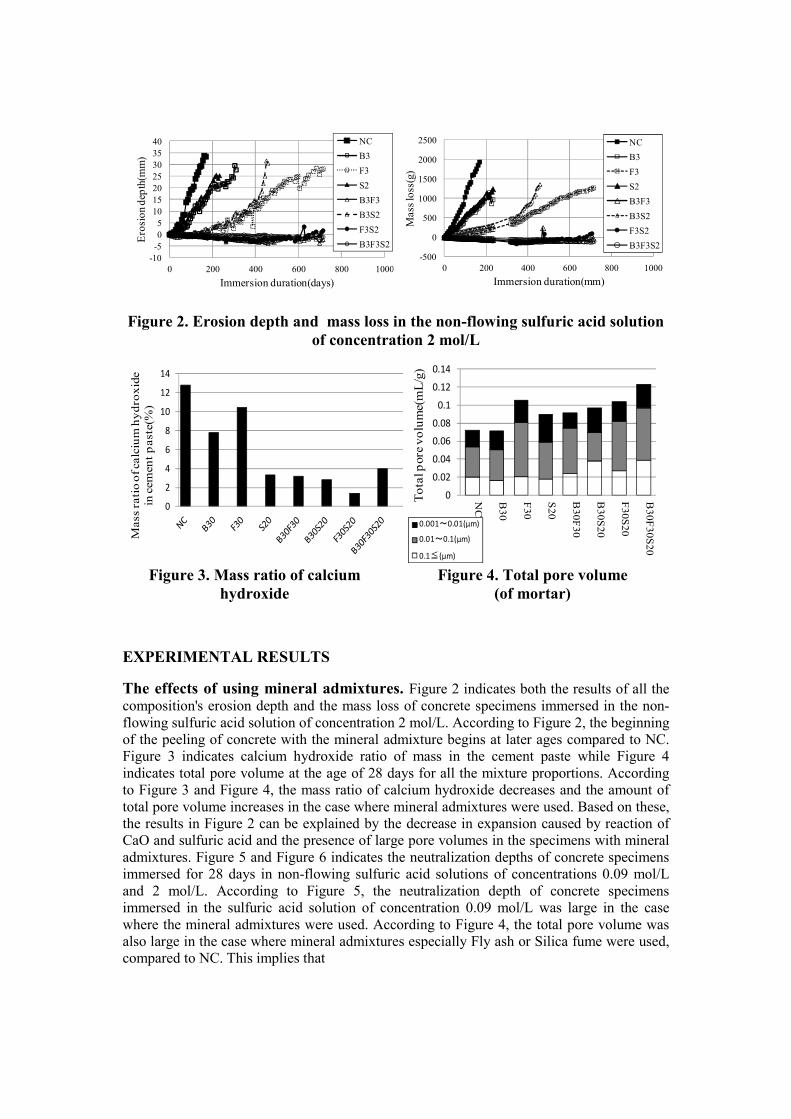
Figure 2. Erosion depth and mass loss in the non-flowing sulfuric acid solution
of concentration 2 mol/L
Figure 3. Mass ratio of calcium
hydroxide
Figure 4. Total pore volume
(of mortar)
EXPERIMENTAL RESULTS
The effects of using mineral admixtures. Figure 2 indicates both the results of all the
composition's erosion depth and the mass loss of concrete specimens immersed in the non-
flowing sulfuric acid solution of concentration 2 mol/L. According to Figure 2, the beginning
of the peeling of concrete with the mineral admixture begins at later ages compared to NC.
Figure 3 indicates calcium hydroxide ratio of mass in the cement paste while Figure 4
indicates total pore volume at the age of 28 days for all the mixture proportions. According
to Figure 3 and Figure 4, the mass ratio of calcium hydroxide decreases and the amount of
total pore volume increases in the case where mineral admixtures were used. Based on these,
the results in Figure 2 can be explained by the decrease in expansion caused by reaction of
CaO and sulfuric acid and the presence of large pore volumes in the specimens with mineral
admixtures. Figure 5 and Figure 6 indicates the neutralization depths of concrete specimens
immersed for 28 days in non-flowing sulfuric acid solutions of concentrations 0.09 mol/L
and 2 mol/L. According to Figure 5, the neutralization depth of concrete specimens
immersed in the sulfuric acid solution of concentration 0.09 mol/L was large in the case
where the mineral admixtures were used. According to Figure 4, the total pore volume was
also large in the case where mineral admixtures especially Fly ash or Silica fume were used,
compared to NC. This implies that
-10
-5
0
5
10
15
20
25
30
35
40
0 200 400 600 800 1000
Ero
sion d
epth
(mm
)
Immersion duration(days)
NC
B3
F3
S2
B3F3
B3S2
F3S2
B3F3S2
-500
0
500
1000
1500
2000
2500
0 200 400 600 800 1000
Mass
loss
(g)
Immersion duration(mm)
NC
B3
F3
S2
B3F3
B3S2
F3S2
B3F3S2
0
2
4
6
8
10
12
14
Mass ratio o
f calc
ium
hydro
xid
e
in cem
ent paste
(%)
0
0.02
0.04
0.06
0.08
0.1
0.12
0.14
NC
B30
F30
S20
B30F30
B30S20
F30S20
B30F30S20
Tota
l pore
volu
me(m
L/g
)
0.001~0.01(μm)
0.01~0.1(μm)
0.1≦(μm)

Figure 5. Neutralization depth
(0.09mol/L)
Figure 6. Neutralization depth
(2mol/L)
the diffusion of sulphate ion was quickened by use of mineral admixtures, and hence
neutralization depth was large. However, compared to the neutralization depths of the
concrete specimens immersed in high concentrations of sulfuric acid solution, a different
trend was observed. According to Figure 6 contrary to what was observed in Figure 3, there
was no observable relationship between total pore volume and neutralization depth. This
could be due to the peeling of concrete from specimens which resulted in the diffusion of
sulphate ions for longer distances than in the specimens where peeling of concrete did not
take place. These results show that the neutralization caused by sulfuric acid was reduced by
use of mineral admixtures, especially where the specimens were exposed to high
concentrations of sulfuric acid.
The effects of concentration of sulfuric acid. Figure 7 indicates both the erosion depth
and the mass loss of concrete specimens immersed in the non-flowing sulfuric acid solution
of concentration 0.09 mol/L while Figure 8 indicates both the erosion depth and the mass
loss of concrete specimens immersed in the non-flowing sulfuric acid solution of
concentration 0.006 mol/L. According to Figure 7, deterioration was observed to decrease in
the case where mineral admixtures were used, which is similar to the trend observed in
Figure 2. However, mass loss in NC specimens was not observed until around 1000 days,
and thereafter repeated deterioration occurred for a while. From Figure 8, there was no
observable deterioration in the specimens, however, these results show the average values of
all the specimens. Figure 9 indicates both the results of erosion depth and mass loss for all
B30 specimens immersed in the non-flowing sulfuric acid solution of concentration 0.006
mol/L. From this Figure, in the first stages, the reaction between sulfuric acid and CaO is
taking place therefore there was no observable mass loss, but at around the age of 750 days,
the mass of specimens began to decrease At present, the mass of one of the three specimens
is smaller than the initial value. It was also observed that concrete surface immediately after
peeling became yellowish-brown in colour, therefore so it is thought that peeling was
occurring at the border between the coloured and the unaffected region, which represents
neutrality. In conditions of low concentration of sulfuric acid, the peeled concrete at a time
was thick. It is estimated that a gypsum layer thickens through the reaction of sulfuric acid
with CaO and that the layer peels due to its own dead weight.
-4
-2
0
2
4
6
8
10
12D
epth
(m
m)
Nautralization depth
Erosion depth
-4
-2
0
2
4
6
8
10
12
Depth
(m
m)
Nautralization depth
Erosion depth

Figure 7. Erosion depth and the mass loss (0.09 mol/L non-flowing)
Figure 8. Erosion depth and the mass loss (0.006 mol/L non-flowing)
Figure 9. Erosion depth and the mass loss of B30 (0.006 mol/L non-flowing)
Compared to these, the trend observed in Figure 2 is thought to have been due to the reaction
of CaO in concrete with sulfuric acid. Based on these, the results of the accelerated
deterioration tests did not show the same phenomenon as would be observed in real
conditions, however, the resistance of deterioration by using mineral admixtures is similar in
both high and low concentrations of sulfuric acid. There was no observable deterioration in
the other specimens, and for this reason continued observation is necessary.
-150
-100
-50
0
50
100
150
200
250
300
350
400
0 500 1000 1500
NC
B30
F30
S20
B30F30
B30S20
F30S20
B30F30S20-2.0
-1.5
-1.0
-0.5
0.0
0.5
1.0
0 500 1000 1500
Ero
sio
n d
ep
th(m
m)
Immersion duration(days)
-80
-70
-60
-50
-40
-30
-20
-10
0
10
20
0 500 1000 1500
Ma
ss lo
ss(g
)
Immersion duration(days)
-100
-75
-50
-25
0
25
50
75
100
0 500 1000 1500
Mas
s Loss
(g)
Immersion duration(days)
B30-1
B30-2
B30-3
-4
-2
0
2
4
6
0 500 1000 1500
Ero
sion d
epth
(mm
)
Immersion duration(days)
B30-1
B30-2
B30-3

Figure 10. Erosion depth and the mass loss of NC and B30 (2 mol/L)
Figure 11. Erosion depth and the mass loss of NC and B30 (1 mol/L)
Figure 12. Erosion depth and the mass loss of NC (0.09 mol/L)
Effects of a flowing solution. Figure 10 indicates the erosion depth and mass loss of the
NC and BFS30 concretes immersed in both the non-flowing sulfuric acid solution and in the
flowing sulfuric acid solution of concentration 2 mol/L. Figure 11 indicates the results of a
concentration of 1 mol/L. According to Figure 10, there were no observable erosion
differences between
-5
0
5
10
15
20
25
30
35
40
0 100 200 300 400
Ero
sion d
epth
(m
m)
Immersion duration (days)
NC flowing
BFS30 flowing
NC non-flowing
BFS30 non-flowing-500
0
500
1000
1500
2000
2500
0 100 200 300 400
Mas
s lo
ss (g)
Immersion duration (days)
NC flowing
BFS30 flowing
NC non-flowing
BFS30 non-flowing
-5
0
5
10
15
20
25
30
0 100 200 300 400
Ero
sion d
eoth
mm
)
Immersion duration (days)
NC flowing
BFS30 flowing
NC non-flowing
BFS30 non-flowing
-500
0
500
1000
1500
2000
0 100 200 300 400
Mas
s lo
ss (g)
Immersion deration (days)
NC flowing
BFS30 flowing
NC non-flowing
BFS30 non-flowing
-4
0
4
8
12
16
0 500 1000 1500
Ero
sion d
epth
(mm
)
Immersion duration(days)
NC flowing
NC non-flowinig
-200
0
200
400
600
800
1,000
1,200
0 500 1000 1500
Mas
s lo
ss(g
)
Immersion duration(days)
NC flowing
NC non-flowing

Figure 13. Relationship between CaO
content and duration before peeling
Figure 14. Relationship between CaO
content and erosion rate
specimens either in the flowing solution or in the non-flowing solution. However, according
to Figure 11, the specimens immersed in the flowing solution were more eroded than those
in the non-flowing solution. As mentioned above, changes in the amount of erosion were
observed in the lower concentration 1 mol/L, as opposed to the higher concentration 2 mol/L.
This difference is thought to have been as a result of shearing in the flowing solution of the
concentration of 1 mol/L. The erosion depths of the specimens of the other concretes could
not be observed, and for this reason, measurements in the future should be carried out for a
longer period of time. Figure 12 indicates the results of erosion depth and mass loss of the
NC immersed in the flowing sulfuric acid solution of concentration of 0.09 mol/L.
According to Figure 12, the specimens immersed in the flowing solution were more eroded
than those in the non-flowing solution. These results were similar to the results of concerning
the erosion depth and the mass loss of specimens immersed in the sulfuric acid solution of
concentration 0.09 mol/L. In addition, the beginning of the peeling of concrete from the
specimens immersed in the flowing solution was quicker than those immersed in the non-
flowing solution.
Quantitative estimation of concrete using mineral admixtures. In this study, the
deterioration of concrete caused by sulfuric acid attacks was considered to consist of two
parts. One was the duration of the expansion, which indicates both the period of diffusion of
sulfuric acid ions into the concrete specimens and the reaction of sulfuric acid ions with
calcium oxide. The product of this reaction has a larger volume than the reactants. This part
is also defined as the duration before the beginning of the peeling of the concrete from the
specimens’ surface. The second part was the duration of the erosion. As a consideration of
these durations, Figure 9 indicates the relationship between the duration before the beginning
of the peeling of the concrete specimens surface immersed in the flowing sulfuric acid
solution concentration of 2 mol/L and 1 mol/L and the calcium oxide content in the
cementitious materials and Figure 10 indicates the relationship between the erosion rate and
the calcium oxide content in the cementitious materials. In this case, since the deterioration
R² = 0.7746
R² = 0.7197
0
100
200
300
400
500
600
20 40 60 80
2 mol/L
1 mol/L
Calcium oxide content in the cementitious material (%)
Dura
tion
of
the
be
ge
nn
ing
of
pe
elin
g o
f co
ncre
te s
urf
ace
(d
ay
s)
R² = 0.7733
R² = 0.8228
0
0.05
0.1
0.15
0.2
0.25
20 30 40 50 60 70
Erosio
n rate
(m
m/d
ay)
Calcium oxide content (%)
Flowing solution
Not-flowing solution

of the concrete specimens was at an advanced stage, the erosion rate was calculated by a
linear approximation as provided in JSCE (2010). According to Figure 9, it is observed that
the beginning of the peeling of the concrete from the specimens started at later ages in the
cases where mineral admixtures were used, and erosion was reduced with increases in the
amount of mineral admixtures in the case of the concentration of 1 mol/L. According to
Figure 10, the erosion rate was observed to decrease with increases in mineral admixtures,
and this was more effective in the case of the non-flowing solution compared to the flowing
solution. This was due to the lesser amount of calcium oxide in the concrete specimens with
mineral admixtures. According to Figure 9 and Figure 10, it is found that the evaluation of
the beginning of the erosion of the concrete specimens due to sulfuric acid is possible if the
amount of calcium oxide present in the concrete is known.
CONCLUSIONS
• The deterioration of concrete caused by sulfuric acid was reduced by the use of mineral
admixtures.
• The flowing effect of a solution promoted the deterioration of concrete.
• The peeling of gypsum from the surface of specimens started at later ages in the cases
where mineral admixtures were used, and erosion was reduced with increases in the
amount of mineral admixtures.
• The erosion rate decrease with increases in mineral admixtures, and better relationship
was observed in the case of the non-flowing solution compared to the flowing solution.
• This study shows the existence of a linear relationship between CaO and both the
duration before the beginning of peeling of concrete as well as the erosion rate.
REFERENCES
SOEDA, M., YAMATO, T., and EMOTO, Y. (1991). "INFLUENCE OF CONBINED
ADMIXTURE ON THE CHEMICAL RESISTANCE OF CONCRETE." Cement Science
and Concrete Technology, No.45: 228-233