study on mechanical and dry sliding wear characteristics of meta-cresol novalac epoxy composites...
TRANSCRIPT

This article was downloaded by: [Moskow State Univ Bibliote]On: 16 February 2014, At: 09:18Publisher: Taylor & FrancisInforma Ltd Registered in England and Wales Registered Number: 1072954 Registered office: Mortimer House,37-41 Mortimer Street, London W1T 3JH, UK
Tribology TransactionsPublication details, including instructions for authors and subscription information:http://www.tandfonline.com/loi/utrb20
Study on Mechanical and Dry Sliding WearCharacteristics of Meta-Cresol Novalac EpoxyComposites Filled with Silicon Carbide, AluminumOxide, and Zinc Oxide ParticulatesKali Dass a , S. R. Chauhan a & Bharti Gaur ba Department of Mechanical Engineering , National Institute of Technology , Hamirpur ,H.P. , 177005 , Indiab Department of Applied Chemistry , National Institute of Technology , Hamirpur , H.P. ,177005 , IndiaAccepted author version posted online: 13 Nov 2013.Published online: 13 Nov 2013.
To cite this article: Kali Dass , S. R. Chauhan & Bharti Gaur (2014) Study on Mechanical and Dry Sliding Wear Characteristicsof Meta-Cresol Novalac Epoxy Composites Filled with Silicon Carbide, Aluminum Oxide, and Zinc Oxide Particulates, TribologyTransactions, 57:2, 157-172, DOI: 10.1080/10402004.2013.861049
To link to this article: http://dx.doi.org/10.1080/10402004.2013.861049
PLEASE SCROLL DOWN FOR ARTICLE
Taylor & Francis makes every effort to ensure the accuracy of all the information (the “Content”) containedin the publications on our platform. However, Taylor & Francis, our agents, and our licensors make norepresentations or warranties whatsoever as to the accuracy, completeness, or suitability for any purpose of theContent. Any opinions and views expressed in this publication are the opinions and views of the authors, andare not the views of or endorsed by Taylor & Francis. The accuracy of the Content should not be relied upon andshould be independently verified with primary sources of information. Taylor and Francis shall not be liable forany losses, actions, claims, proceedings, demands, costs, expenses, damages, and other liabilities whatsoeveror howsoever caused arising directly or indirectly in connection with, in relation to or arising out of the use ofthe Content.
This article may be used for research, teaching, and private study purposes. Any substantial or systematicreproduction, redistribution, reselling, loan, sub-licensing, systematic supply, or distribution in anyform to anyone is expressly forbidden. Terms & Conditions of access and use can be found at http://www.tandfonline.com/page/terms-and-conditions
Tribology Transactions, 57: 157-172, 2014Copyright C© Society of Tribologists and Lubrication EngineersISSN: 1040-2004 print / 1547-397X onlineDOI: 10.1080/10402004.2013.861049
Study on Mechanical and Dry Sliding Wear Characteristicsof Meta-Cresol Novalac Epoxy Composites Filled with
Silicon Carbide, Aluminum Oxide,and Zinc Oxide Particulates
KALI DASS,1 S. R. CHAUHAN,1 and BHARTI GAUR2
1Department of Mechanical EngineeringNational Institute of Technology Hamirpur
H.P. 177005, India2Department of Applied Chemistry
National Institute of Technology HamirpurH.P. 177005, India
In this article, the mechanical and dry sliding wear char-
acteristics of synthesized m-cresol novalac epoxy composites
filled with silicon carbide (SiC), aluminum oxide (Al2O3), and
zinc oxide (ZnO) have been studied using a pin-on-disc appa-
ratus. The influence of wear parameters such as applied nor-
mal load (20–40 N), sliding velocity (1.8–3.6 m/s), filler content
(5–15 wt%), and sliding distance (1,000–3,000 m) on the coeffi-
cient of friction and specific wear rate of these composites have
been investigated under dry sliding conditions. A design of ex-
periment technique, response surface methodology, has been
used to model the friction and wear behavior of these compos-
ites. The experimental plan for four factors at three levels using
face-centered central composite design has been employed. The
results showed that the hardness, tensile strength, and flexural
strength of these composites increased with 5 to 10 wt% filler
contents and decreased for 15 wt% filler content. The compres-
sion strength of these m-cresol novalac epoxy composites in-
creases with an increase in the filler content from 5 to 15 wt%.
The worn surfaces of these composite specimens were exam-
ined using a scanning electron microscope (SEM) to explore
the wear mechanisms.
KEY WORDS
m-Cresol Novalac Epoxy; Mechanical Properties; ResponseSurface Methodology; Coefficient of Friction; Specific Wear Rate
INTRODUCTION
Polymer composites are widely accepted for structural as wellas for tribological applications across the industries. It has been
Manuscript received June 20, 2013Manuscript accepted October 28, 2013
Review led by David BurrisColor versions of one or more of the figures in the article can be
found online at www.tandfonline.com/utrb.
used for tribological applications, manufacturing adhesives, coat-ings, reinforced plastics, casting, and engineering fields, particu-larly in aerospace applications and other composite materials dueto their high specific mechanical properties compared to the otherconventional materials (Biswas and Satapathy (1)).
The tribological characteristics of polymers are greatly influ-enced by the effects of temperature, relative speed of the inter-acting surfaces, applied normal load, and environment. To dealwith these effects and for better control of the responses, inves-tigations were carried (Friedrich and Schlarb (2)). Epoxy resinsare finding increasing use in a wide range of engineering applica-tions because of their on-the-spot processing characteristics, goodaffinity to heterogeneous materials, considerable creep and sol-vent resistance, and higher operating temperature. However, thecomposites for high-temperature applications are mainly basedon novalac resins. Novalac resins have superior mechanical andthermal properties as well as a higher chemical resistance thanother resins. Thus, an approach was developed in the labora-tory to synthesize the m-cresol novalac epoxy for tribologicalapplications.
Polymer composites are frequently employed as sliding ele-ments in various industries or tribological applications. It is worthnoting that, in the case of tribological applications, neat epoxiescannot be utilized alone due to their three-dimensional structure,which could significantly deteriorate the load-bearing capacity ofthe composites (Guo, et al. (3)). To solve this problem, the no-valac epoxy resin was modified by adding appropriate fillers tosuit a particular application. For this purpose, the inorganic fillerhas to be incorporated to improve the poor load-carrying capac-ity and wear resistance of neat epoxies (Chang, et al. (4); Ellis(5); Bhattacharya and Tummala (6); Bahadur and Gong (7)).Much research has been conducted on the effects of inorganicmicroscale particles or fillers for the tribological optimization ofpolymer matrix composites (Vort and Bahadur (8); Bhabani andBijwe (9); Schwarts and Bahadur (10); Bahadur, et al. (11); Zhaoand Bahadur (12); Padhi and Satapathy (13)).
157
Dow
nloa
ded
by [
Mos
kow
Sta
te U
niv
Bib
liote
] at
09:
18 1
6 Fe
brua
ry 2
014
158 K. DASS ET AL.
Many researchers have also reported that the incorporationof filler particulates in a composite system have improved thewear resistance and reduced the coefficient of friction (Friedrich,et al. (14); Bahadur, et al. (15); Yoo and Eiss (16); Bijwe, et al.(17); Hager and Davies (18); Zhang, et al. (19); Chang and Zhang(20)). Xing and Li (21) have studied the wear behavior of epoxymatrix composites filled with uniform spherical silica particles inthe submicrometer size range. They found an increase in the wearresistance of the epoxy matrix composites at a relatively low fillercontent of (0.5–4 wt%). Kishore, et al. (22) investigated the ef-fects of velocity and applied normal load on the sliding wear char-acteristics of glass fabric epoxy composites with different fillers.They found that the wear loss increases with an increase in theapplied normal load and sliding velocity.
Shi, et al. (23) have studied the friction and wear behavior ofnanometer silicon nitride–filled epoxy composites in which theyfound a significant improvement in tribological and mechanicalcharacteristics at a very low filler content (less than 1 vol%).Wang, et al. (24) have studied the effects of aramid fiber andZnO nanoparticles on friction and wear of PTFE compositesin dry and LN2 conditions. They found that the friction coeffi-cient of a PTFE-based composite filled with both aramid fiberand ZnO nanoparticles sliding against a steel pin in dry slid-ing conditions changed slightly when the mass percentage ofZnO varied from 1 to 5 wt% and the wear mass loss of thecomposites decreases as the percentage of ZnO increases. Zhaoand Bahadur (25) reported that the sliding wear of PPS de-creased with the addition of Ag2S or NiS fillers and increasedwith PbSe or PbTe. Suresha, et al. (26) have studied the influ-ence of SiC filler on the mechanical and tribological behaviorsof glass fabric–reinforced epoxy composite systems. They foundthat the mechanical properties of the glass fabric epoxy com-posites increased with the inclusion of SiC filler. The sliding ve-locity and applied load play significant roles in the friction andwear behavior of polymers (Bassani, et al. (27); Li, et al. (28)).It is also well known that inorganic filler particles can enhancethe tribological and mechanical properties of polymers compos-ites. The wear performance, stiffness, and toughness of the poly-mer composites are extensively influenced by the shape, size, vol-ume, or filler content and especially the dispersion of the particles(Wetzel, et al. (29)).
From the literature survey it is observed that very little is men-tioned about the friction and wear behavior of synthesized m-cresol novalac epoxy composites. This work was planned with thefollowing objectives:
1. Synthesize m-cresol novalac epoxy resin and further react theresin with epichlorohydrin to obtain m-cresol novalac epoxyresin.
2. Characterize the resin by Fourier transform infrared (FTIR)analysis.
3. Fabricate m-cresol novalac epoxy composites filled with mi-crosized SiC, Al2O3, and ZnO fillers.
4. Explore the mechanical properties and tribological character-istics of these composites under dry sliding conditions.
5. Develop a quadratic model for the coefficient of friction andspecific wear rate of these fabricated m-cresol novalac epoxycomposites.
In this investigation, four factors, sliding velocity, applied normalload, filler content, and sliding distance, have been considered asinput parameters. Based on the preliminary experiments, the ef-fects of these input parameters on the coefficient of friction andspecific wear rate were tested through a set of planned experi-ments based on the four factors at three levels. A design of ex-periment technique, response surface methodology, with a face-centered central composite design has been used to accomplishthe objectives.
MATERIALS
Material Used
m-Cresol and epichlorohydrin were purchased from FisherScientific Chemical Ltd. (India). Toluene was purchased fromSigma Aldrich. Methanol GR grade, acetone, and purifiedsodium hydroxide pellets (MKOM603629) were all purchasedfrom Merck India Ltd. The curing agent 4,41 diaminodiphenyl-methane was purchased from Alfa Aesar. Pyridine AR was pur-chased from SD Fine Chemicals Ltd. The SiC and Al2O3 fillers(average size 60 μm) and ZnO fillers (average size 0.3–0.5 μm)were purchased from Fisher Scientific Chemical Ltd. The m-cresol formaldehyde novalac resin and novalac epoxy were syn-thesized in the laboratory.
Synthesis of m-Cresol Formaldehyde Novalac Resin
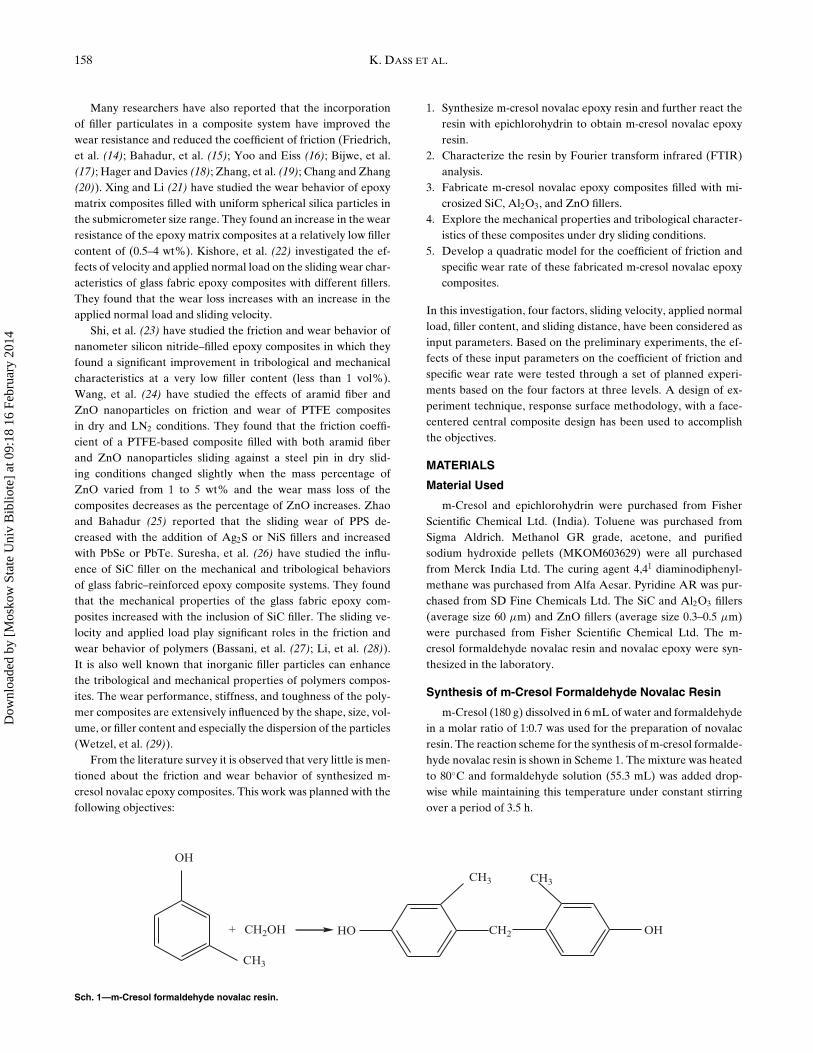
m-Cresol (180 g) dissolved in 6 mL of water and formaldehydein a molar ratio of 1:0.7 was used for the preparation of novalacresin. The reaction scheme for the synthesis of m-cresol formalde-hyde novalac resin is shown in Scheme 1. The mixture was heatedto 80◦C and formaldehyde solution (55.3 mL) was added drop-wise while maintaining this temperature under constant stirringover a period of 3.5 h.
OH
CH3
+ CH2OH HO OHCH2
CH3 CH3
Sch. 1—m-Cresol formaldehyde novalac resin.
Dow
nloa
ded
by [
Mos
kow
Sta
te U
niv
Bib
liote
] at
09:
18 1
6 Fe
brua
ry 2
014

Meta-Cresol Novalac Epoxy Composites 159
CH2
OH
n
CH2 - CH - CH2
O
EpichlorohydrinCH2
CH3CH3
OCH2 - CH - CH2
O
n
Sch. 2—m-Cresol novalac epoxy resin.
The reaction was arrested by adding 40 mL of 10 wt% sodiumbicarbonate and the product was finally washed with warm waterand dried at 80◦C under reduced pressure of (40 ± 5 mmHg).
Synthesis of m-Cresol Formaldehyde NovalacEpoxy Resin
m-Cresol novalac epoxy resin was prepared by reacting theabove synthesized novalac resin with epichlorohydrin (5 mol forevery phenolic group of the novalac resins). Sodium hydroxide ina molar ratio of 0.2:1.0 with epichlorohydrin was used as a cata-lyst. The reaction was carried out (112 ± 1◦C) with the additionof sodium hydroxide (40 wt%) gradually over a period of 3 1/2 h.The reaction scheme of synthesized m-cresol formaldehyde no-valac epoxy resin is shown in Scheme 2.
The contents were dissolved in toluene and the solution wasfiltered using Whatman filter paper no. 42 to remove the salts.Toluene was then removed by heating under reduced pressure.
Fabrication of m-Cresol Novalac Epoxy Composites
A calculated amount of m-cresol novalac epoxy resin andthe microsize particulate SiC, Al2O3, and ZnO fillers weremixed with the help of mechanical stirrer at 80◦C. 4,41 Diaminodiphenylmethane (Scheme 3) was used as a curing agent and wasmanually mixed thoroughly.
The resin and curing agent were mixed parts by weight accord-ing to the following relation (Dean, et al. (30)).
Theoretical mixing ratios
= Weight of amine/Number of available atomEpoxy equivalent weight
. [1]
After mixing the mixture thoroughly it was degassed in a vacuumchamber for about half an hour. Then the mixture was poured
H2N NH2
Sch. 3—4,41 Diamino diphenyl methane.
into aluminum foil–covered molds for degassing and room tem-perature curing for 2–3 h. After degassing and room temperaturecuring, the molds were placed in an oven. The temperature of theoven was first set at 100◦C for about 1 h, and then for postcuringthe temperature was set at 180◦C for 2 1/2 h.
CHARACTERIZATION
Epoxy Equivalent Weight
The epoxy equivalent weight of m-cresol novalac epoxy resinwas determined by the pyridinium chloride method (Knall, et al.(31)). The epoxy equivalent was calculated using the followingequation:
Epoxy equivalent weight = 16 × Sample weight, (g)Grams of oxirane in sample
[2]
Grams of oxirane in the sample = (A − B)(N)(0.0016),
where A is NaOH for blank (mL), B is NaOH for sample (mL),and N is the normality of NaOH.
FTIR Analysis
FTIR spectra for the synthesized m-cresol novalac epoxy resinwere recorded in the range of 500 to 4000 cm−1 using a Spectra65 (Perkin Elmer) FTIR spectrometer. m-Cresol novalac epoxyresin, which forms the backbone of the polymer, was character-ized by the peaks appearing at 2870–2929 cm−1 due to bridgedmethylene groups and at 3350 cm−1 due to the phenolic group.Figure 1 shows the FTIR spectrum of the (a) uncured m-cresolnovalac epoxy resin and (b) cured m-cresol novalac epoxy resin.On comparing the spectra, a characteristic peak at 916 cm−1
due to the C-O bond of the oxirane ring in the uncured epoxyresin disappeared in the spectra of cured epoxy resin as shown inFigs. 1a and 1b. In addition, a peak appeared at 1315 cm−1 of thecured epoxy resin corresponding to the C-N bond that formeddue to the thermal curing with the 4,41 diamino diphenyl methanethat was incorporated into the cured network. No such peak wasobserved in the uncured sample. In addition, both spectra showedpeaks at 3500, 2980, and 1100 cm−1 corresponding to the hydroxylgroup and methyl and ether bonds, respectively.
Dow
nloa
ded
by [
Mos
kow
Sta
te U
niv
Bib
liote
] at
09:
18 1
6 Fe
brua
ry 2
014

160 K. DASS ET AL.
4000 3500 3000 2500 2000 1500 1000 5000
10
20
30
40
50
60
70
80
Tra
nsm
ittan
ce (%
)
Wavelength (cm-1)(a)
4000 3500 3000 2500 2000 1500 1000 500
0
10
20
30
40
50
60
70
80
Tra
nsm
itta
nce
(%)
Wavelength (cm-1)
(b)
Fig. 1—FTIR spectra of (a) uncured and (b) cured m-cresol novalac epoxy resin.
EXPERIMENTAL PROCEDURE
Mechanical Characterization
In mechanical characterization the mechanical properties suchas tensile strength as per ASTM: D3039, flexural strength asper ASTM: D790, and compression strength as per ASTM: D3410 tests of the meta-cresol novalac epoxy composites filledwith SiC, Al2O3, and ZnO filler specimens were determined bya Hounsefield-25KN universal testing machine at a deformationrate of 2 mm/min. The hardness measurement of the compositespecimens was carried using a Rockwell hardness tester.
Friction and Wear Testing
The friction and wear tests were carried out using a pin-on-disc wear monitoring tester (DUCOM) as per ASTM: G 99 as
shown in Fig. 2. The diameter of the wear track was 100 mm. Thesmooth and hardened ground steel disc surface (EN-32, hard-ness 72 HRC) served as counterpart and was finished by abra-sion against 1200-grade SiC paper, which provided a roughnessof Ra = 0.6–0.7 μm. The circular cross section end of the novalacepoxy composite pin was also finished by 400-grade size SiC pa-per for the sliding contact. The specimen was held stationary andthe disc was rotated while a normal force was applied througha lever mechanism. During the test, friction force was measuredby a transducer mounted on the loading arm. The friction forcereadings were taken as the average of 100 readings every 40 s forthe required period. A microprocessor controlled data acquisi-tion system was used for this purpose.
The weight loss method was used to find the specific wearrate of the m-cresol novalac epoxy composites. During these
Fig. 2—Schematic diagram of pin-on-disc apparatus.
Dow
nloa
ded
by [
Mos
kow
Sta
te U
niv
Bib
liote
] at
09:
18 1
6 Fe
brua
ry 2
014
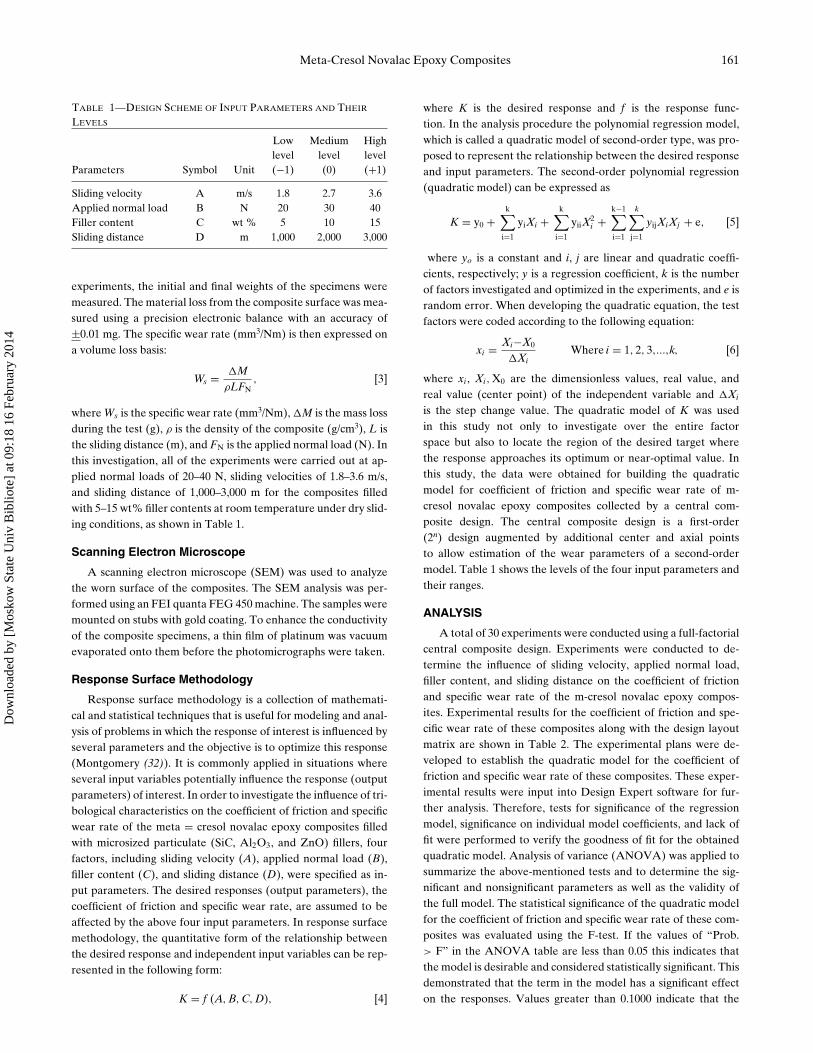
Meta-Cresol Novalac Epoxy Composites 161
TABLE 1—DESIGN SCHEME OF INPUT PARAMETERS AND THEIR
LEVELS
Low Medium Highlevel level level
Parameters Symbol Unit (−1) (0) (+1)
Sliding velocity A m/s 1.8 2.7 3.6Applied normal load B N 20 30 40Filler content C wt % 5 10 15Sliding distance D m 1,000 2,000 3,000
experiments, the initial and final weights of the specimens weremeasured. The material loss from the composite surface was mea-sured using a precision electronic balance with an accuracy of±0.01 mg. The specific wear rate (mm3/Nm) is then expressed ona volume loss basis:
Ws = �MρLFN
, [3]
where Ws is the specific wear rate (mm3/Nm), �M is the mass lossduring the test (g), ρ is the density of the composite (g/cm3), L isthe sliding distance (m), and FN is the applied normal load (N). Inthis investigation, all of the experiments were carried out at ap-plied normal loads of 20–40 N, sliding velocities of 1.8–3.6 m/s,and sliding distance of 1,000–3,000 m for the composites filledwith 5–15 wt% filler contents at room temperature under dry slid-ing conditions, as shown in Table 1.
Scanning Electron Microscope
A scanning electron microscope (SEM) was used to analyzethe worn surface of the composites. The SEM analysis was per-formed using an FEI quanta FEG 450 machine. The samples weremounted on stubs with gold coating. To enhance the conductivityof the composite specimens, a thin film of platinum was vacuumevaporated onto them before the photomicrographs were taken.
Response Surface Methodology
Response surface methodology is a collection of mathemati-cal and statistical techniques that is useful for modeling and anal-ysis of problems in which the response of interest is influenced byseveral parameters and the objective is to optimize this response(Montgomery (32)). It is commonly applied in situations whereseveral input variables potentially influence the response (outputparameters) of interest. In order to investigate the influence of tri-bological characteristics on the coefficient of friction and specificwear rate of the meta = cresol novalac epoxy composites filledwith microsized particulate (SiC, Al2O3, and ZnO) fillers, fourfactors, including sliding velocity (A), applied normal load (B),filler content (C), and sliding distance (D), were specified as in-put parameters. The desired responses (output parameters), thecoefficient of friction and specific wear rate, are assumed to beaffected by the above four input parameters. In response surfacemethodology, the quantitative form of the relationship betweenthe desired response and independent input variables can be rep-resented in the following form:
K = f (A, B, C, D), [4]
where K is the desired response and f is the response func-tion. In the analysis procedure the polynomial regression model,which is called a quadratic model of second-order type, was pro-posed to represent the relationship between the desired responseand input parameters. The second-order polynomial regression(quadratic model) can be expressed as
K = y0 +k∑
i=1
yiXi +k∑
i=1
yiiX2i +
k−1∑
i=1
k∑
j=1
yijXiXj + e, [5]
where yo is a constant and i, j are linear and quadratic coeffi-cients, respectively; y is a regression coefficient, k is the numberof factors investigated and optimized in the experiments, and e israndom error. When developing the quadratic equation, the testfactors were coded according to the following equation:
xi = Xi−X0
�XiWhere i = 1, 2, 3,...,k, [6]
where xi , Xi, X0 are the dimensionless values, real value, andreal value (center point) of the independent variable and �Xi
is the step change value. The quadratic model of K was usedin this study not only to investigate over the entire factorspace but also to locate the region of the desired target wherethe response approaches its optimum or near-optimal value. Inthis study, the data were obtained for building the quadraticmodel for coefficient of friction and specific wear rate of m-cresol novalac epoxy composites collected by a central com-posite design. The central composite design is a first-order(2n) design augmented by additional center and axial pointsto allow estimation of the wear parameters of a second-ordermodel. Table 1 shows the levels of the four input parameters andtheir ranges.
ANALYSIS
A total of 30 experiments were conducted using a full-factorialcentral composite design. Experiments were conducted to de-termine the influence of sliding velocity, applied normal load,filler content, and sliding distance on the coefficient of frictionand specific wear rate of the m-cresol novalac epoxy compos-ites. Experimental results for the coefficient of friction and spe-cific wear rate of these composites along with the design layoutmatrix are shown in Table 2. The experimental plans were de-veloped to establish the quadratic model for the coefficient offriction and specific wear rate of these composites. These exper-imental results were input into Design Expert software for fur-ther analysis. Therefore, tests for significance of the regressionmodel, significance on individual model coefficients, and lack offit were performed to verify the goodness of fit for the obtainedquadratic model. Analysis of variance (ANOVA) was applied tosummarize the above-mentioned tests and to determine the sig-nificant and nonsignificant parameters as well as the validity ofthe full model. The statistical significance of the quadratic modelfor the coefficient of friction and specific wear rate of these com-posites was evaluated using the F-test. If the values of “Prob.> F” in the ANOVA table are less than 0.05 this indicates thatthe model is desirable and considered statistically significant. Thisdemonstrated that the term in the model has a significant effecton the responses. Values greater than 0.1000 indicate that the
Dow
nloa
ded
by [
Mos
kow
Sta
te U
niv
Bib
liote
] at
09:
18 1
6 Fe
brua
ry 2
014
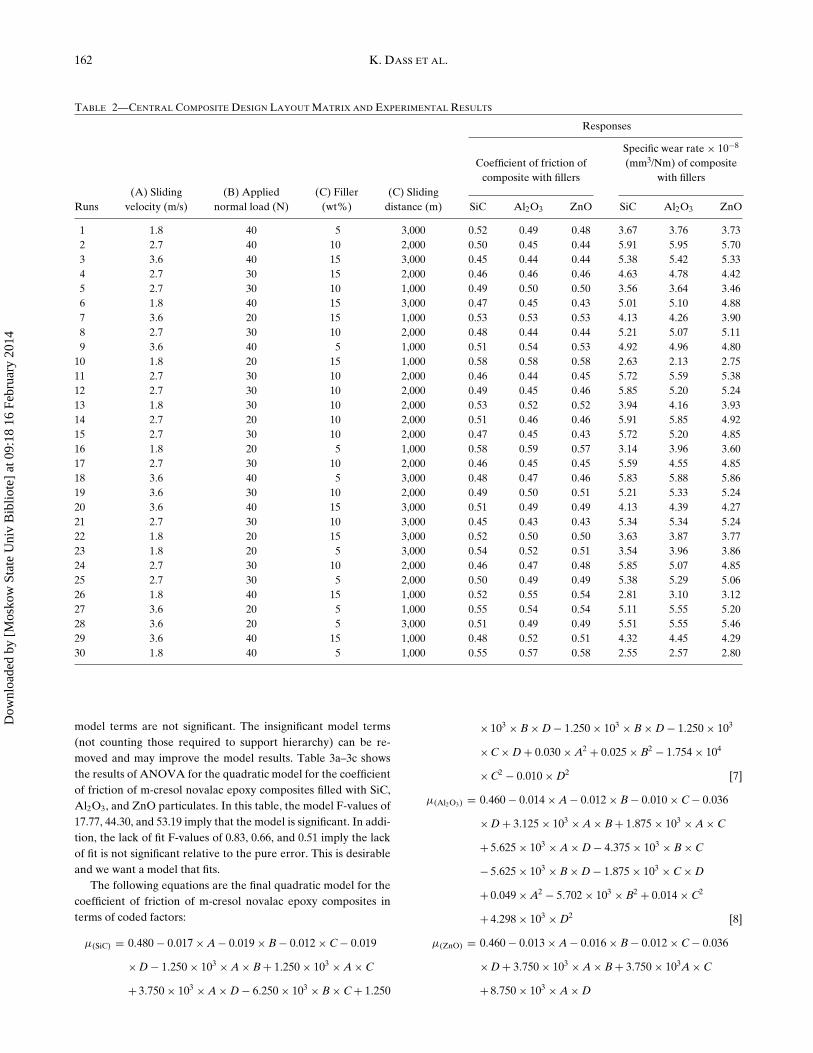
162 K. DASS ET AL.
TABLE 2—CENTRAL COMPOSITE DESIGN LAYOUT MATRIX AND EXPERIMENTAL RESULTS
Responses
Coefficient of friction ofcomposite with fillers
Specific wear rate × 10−8
(mm3/Nm) of compositewith fillers
(A) Sliding (B) Applied (C) Filler (C) SlidingRuns velocity (m/s) normal load (N) (wt%) distance (m) SiC Al2O3 ZnO SiC Al2O3 ZnO
1 1.8 40 5 3,000 0.52 0.49 0.48 3.67 3.76 3.732 2.7 40 10 2,000 0.50 0.45 0.44 5.91 5.95 5.703 3.6 40 15 3,000 0.45 0.44 0.44 5.38 5.42 5.334 2.7 30 15 2,000 0.46 0.46 0.46 4.63 4.78 4.425 2.7 30 10 1,000 0.49 0.50 0.50 3.56 3.64 3.466 1.8 40 15 3,000 0.47 0.45 0.43 5.01 5.10 4.887 3.6 20 15 1,000 0.53 0.53 0.53 4.13 4.26 3.908 2.7 30 10 2,000 0.48 0.44 0.44 5.21 5.07 5.119 3.6 40 5 1,000 0.51 0.54 0.53 4.92 4.96 4.80
10 1.8 20 15 1,000 0.58 0.58 0.58 2.63 2.13 2.7511 2.7 30 10 2,000 0.46 0.44 0.45 5.72 5.59 5.3812 2.7 30 10 2,000 0.49 0.45 0.46 5.85 5.20 5.2413 1.8 30 10 2,000 0.53 0.52 0.52 3.94 4.16 3.9314 2.7 20 10 2,000 0.51 0.46 0.46 5.91 5.85 4.9215 2.7 30 10 2,000 0.47 0.45 0.43 5.72 5.20 4.8516 1.8 20 5 1,000 0.58 0.59 0.57 3.14 3.96 3.6017 2.7 30 10 2,000 0.46 0.45 0.45 5.59 4.55 4.8518 3.6 40 5 3,000 0.48 0.47 0.46 5.83 5.88 5.8619 3.6 30 10 2,000 0.49 0.50 0.51 5.21 5.33 5.2420 3.6 40 15 3,000 0.51 0.49 0.49 4.13 4.39 4.2721 2.7 30 10 3,000 0.45 0.43 0.43 5.34 5.34 5.2422 1.8 20 15 3,000 0.52 0.50 0.50 3.63 3.87 3.7723 1.8 20 5 3,000 0.54 0.52 0.51 3.54 3.96 3.8624 2.7 30 10 2,000 0.46 0.47 0.48 5.85 5.07 4.8525 2.7 30 5 2,000 0.50 0.49 0.49 5.38 5.29 5.0626 1.8 40 15 1,000 0.52 0.55 0.54 2.81 3.10 3.1227 3.6 20 5 1,000 0.55 0.54 0.54 5.11 5.55 5.2028 3.6 20 5 3,000 0.51 0.49 0.49 5.51 5.55 5.4629 3.6 40 15 1,000 0.48 0.52 0.51 4.32 4.45 4.2930 1.8 40 5 1,000 0.55 0.57 0.58 2.55 2.57 2.80
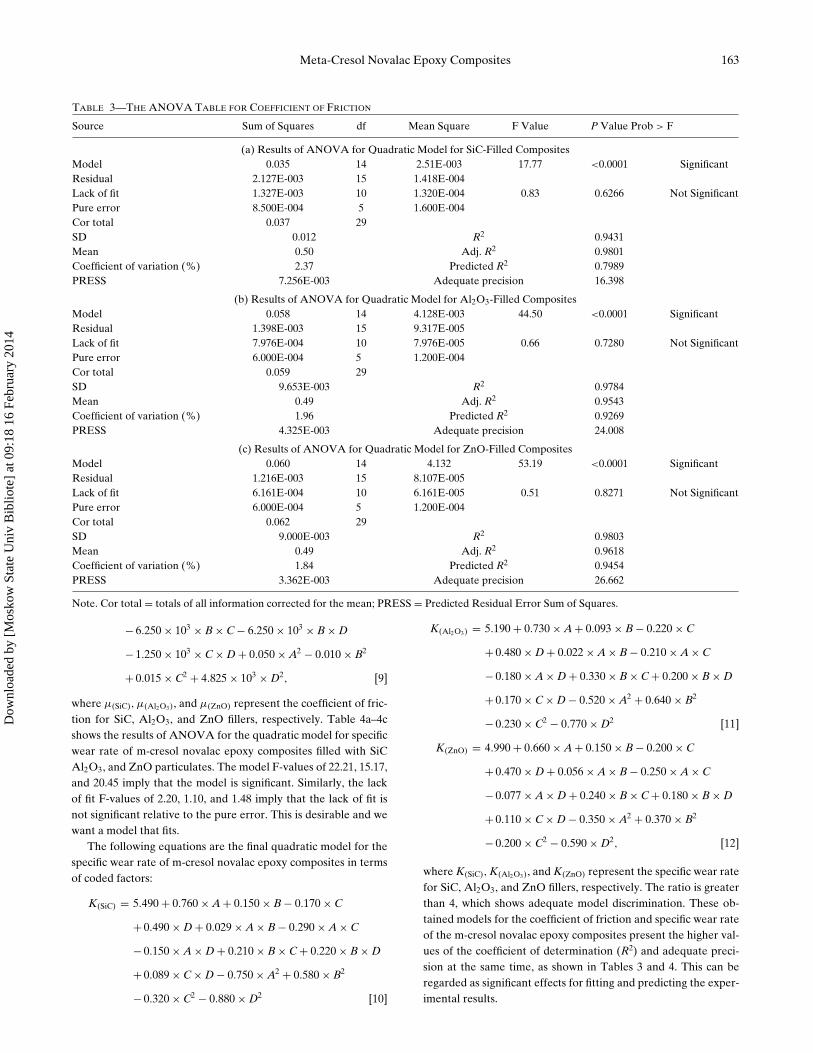
model terms are not significant. The insignificant model terms(not counting those required to support hierarchy) can be re-moved and may improve the model results. Table 3a–3c showsthe results of ANOVA for the quadratic model for the coefficientof friction of m-cresol novalac epoxy composites filled with SiC,Al2O3, and ZnO particulates. In this table, the model F-values of17.77, 44.30, and 53.19 imply that the model is significant. In addi-tion, the lack of fit F-values of 0.83, 0.66, and 0.51 imply the lackof fit is not significant relative to the pure error. This is desirableand we want a model that fits.
The following equations are the final quadratic model for thecoefficient of friction of m-cresol novalac epoxy composites interms of coded factors:
μ(SiC) = 0.480 − 0.017 × A − 0.019 × B − 0.012 × C − 0.019
× D − 1.250 × 10³ × A × B + 1.250 × 10³ × A × C
+ 3.750 × 10³ × A × D − 6.250 × 10³ × B × C + 1.250
× 103 × B × D − 1.250 × 10³ × B × D − 1.250 × 10³
× C × D + 0.030 × A2 + 0.025 × B2 − 1.754 × 10⁴
× C2 − 0.010 × D2 [7]
μ(Al2O3) = 0.460 − 0.014 × A − 0.012 × B − 0.010 × C − 0.036
× D + 3.125 × 10³ × A × B + 1.875 × 10³ × A × C
+ 5.625 × 10³ × A × D − 4.375 × 10³ × B × C
− 5.625 × 10³ × B × D − 1.875 × 10³ × C × D
+ 0.049 × A2 − 5.702 × 10³ × B2 + 0.014 × C2
+ 4.298 × 10³ × D2 [8]
μ(ZnO) = 0.460 − 0.013 × A − 0.016 × B − 0.012 × C − 0.036
× D + 3.750 × 10³ × A × B + 3.750 × 10³A × C
+ 8.750 × 10³ × A × D
Dow
nloa
ded
by [
Mos
kow
Sta
te U
niv
Bib
liote
] at
09:
18 1
6 Fe
brua
ry 2
014
Meta-Cresol Novalac Epoxy Composites 163
TABLE 3—THE ANOVA TABLE FOR COEFFICIENT OF FRICTION
Source Sum of Squares df Mean Square F Value P Value Prob > F
(a) Results of ANOVA for Quadratic Model for SiC-Filled CompositesModel 0.035 14 2.51E-003 17.77 <0.0001 SignificantResidual 2.127E-003 15 1.418E-004Lack of fit 1.327E-003 10 1.320E-004 0.83 0.6266 Not SignificantPure error 8.500E-004 5 1.600E-004Cor total 0.037 29SD 0.012 R2 0.9431Mean 0.50 Adj. R2 0.9801Coefficient of variation (%) 2.37 Predicted R2 0.7989PRESS 7.256E-003 Adequate precision 16.398
(b) Results of ANOVA for Quadratic Model for Al2O3-Filled CompositesModel 0.058 14 4.128E-003 44.50 <0.0001 SignificantResidual 1.398E-003 15 9.317E-005Lack of fit 7.976E-004 10 7.976E-005 0.66 0.7280 Not SignificantPure error 6.000E-004 5 1.200E-004Cor total 0.059 29SD 9.653E-003 R2 0.9784Mean 0.49 Adj. R2 0.9543Coefficient of variation (%) 1.96 Predicted R2 0.9269PRESS 4.325E-003 Adequate precision 24.008
(c) Results of ANOVA for Quadratic Model for ZnO-Filled CompositesModel 0.060 14 4.132 53.19 <0.0001 SignificantResidual 1.216E-003 15 8.107E-005Lack of fit 6.161E-004 10 6.161E-005 0.51 0.8271 Not SignificantPure error 6.000E-004 5 1.200E-004Cor total 0.062 29SD 9.000E-003 R2 0.9803Mean 0.49 Adj. R2 0.9618Coefficient of variation (%) 1.84 Predicted R2 0.9454PRESS 3.362E-003 Adequate precision 26.662
Note. Cor total = totals of all information corrected for the mean; PRESS = Predicted Residual Error Sum of Squares.
− 6.250 × 10³ × B × C − 6.250 × 10³ × B × D
− 1.250 × 10³ × C × D + 0.050 × A2 − 0.010 × B2
+ 0.015 × C2 + 4.825 × 10³ × D2, [9]
where μ(SiC), μ(Al2O3), and μ(ZnO) represent the coefficient of fric-tion for SiC, Al2O3, and ZnO fillers, respectively. Table 4a–4cshows the results of ANOVA for the quadratic model for specificwear rate of m-cresol novalac epoxy composites filled with SiCAl2O3, and ZnO particulates. The model F-values of 22.21, 15.17,and 20.45 imply that the model is significant. Similarly, the lackof fit F-values of 2.20, 1.10, and 1.48 imply that the lack of fit isnot significant relative to the pure error. This is desirable and wewant a model that fits.
The following equations are the final quadratic model for thespecific wear rate of m-cresol novalac epoxy composites in termsof coded factors:
K(SiC) = 5.490 + 0.760 × A + 0.150 × B − 0.170 × C
+ 0.490 × D + 0.029 × A × B − 0.290 × A × C
− 0.150 × A × D + 0.210 × B × C + 0.220 × B × D
+ 0.089 × C × D − 0.750 × A2 + 0.580 × B2
− 0.320 × C2 − 0.880 × D2 [10]
K(Al2O3) = 5.190 + 0.730 × A + 0.093 × B − 0.220 × C
+ 0.480 × D + 0.022 × A × B − 0.210 × A × C
− 0.180 × A × D + 0.330 × B × C + 0.200 × B × D
+ 0.170 × C × D − 0.520 × A2 + 0.640 × B2
− 0.230 × C2 − 0.770 × D2 [11]
K(ZnO) = 4.990 + 0.660 × A + 0.150 × B − 0.200 × C
+ 0.470 × D + 0.056 × A × B − 0.250 × A × C
− 0.077 × A × D + 0.240 × B × C + 0.180 × B × D
+ 0.110 × C × D − 0.350 × A2 + 0.370 × B2
− 0.200 × C2 − 0.590 × D2, [12]
where K(SiC), K(Al2O3), and K(ZnO) represent the specific wear ratefor SiC, Al2O3, and ZnO fillers, respectively. The ratio is greaterthan 4, which shows adequate model discrimination. These ob-tained models for the coefficient of friction and specific wear rateof the m-cresol novalac epoxy composites present the higher val-ues of the coefficient of determination (R2) and adequate preci-sion at the same time, as shown in Tables 3 and 4. This can beregarded as significant effects for fitting and predicting the exper-imental results.
Dow
nloa
ded
by [
Mos
kow
Sta
te U
niv
Bib
liote
] at
09:
18 1
6 Fe
brua
ry 2
014

164 K. DASS ET AL.
TABLE 4—THE ANOVA TABLE FOR SPECIFIC WEAR RATE
Source Sum of Squares df Mean Square F Value P Value Prob > F
(a) Results of ANOVA for Quadratic Model for SiC-Filled CompositesModel 32.11 14 2.29 22.21 <0.0001 SignificantResidual 1.55 15 0.10Lack of fit 1.26 10 0.13 2.20 0.1986 Not SignificantPure error 0.29 5 0.057Cor total 33.66 29SD 0.32 R2 0.9540Mean 4.67 Adj. R2 0.9110Coefficient of variation (%) 6.88 Predicted R2 0.8025PRESS 6.65 Adequate precision 16.870
(b) Results of ANOVA for quadratic model for Al2O3-filled compositesModel 25.51 14 1.82 15.17 <0.0001 SignificantResidual 1.80 15 0.12Lack of fit 1.24 10 0.12 1.10 0.4880 Not SignificantPure error 0.56 5 0.11Cor total 27.32 29SD 0.35 R2 0.9340Mean 4.66 Adj. R2 0.8724Coefficient of variation (%) 7.43 Predicted R2 0.6586PRESS 9.33 Adequate precision 13.785
(c) Results of ANOVA for Quadratic Model for ZnO-filled CompositesModel 20.26 14 1.45 20.45 <0.0001 SignificantResidual 1.06 15 0.071Lack of fit 0.79 10 0.079 1.48 0.3494 Not SignificantPure error 0.27 5 0.054Cor total 21.32 29SD 0.27 R2 0.9502Mean 4.53 Adj. R2 0.9037Coefficient of variation (%) 5.87 Predicted R2 0.7869PRESS 4.54 Adequate precision 16.138
RESULTS AND DISCUSSION
Mechanical Properties
The variation in hardness of m-cresol novalac epoxy compos-ites filled with SiC, Al2O3, and ZnO particulates (wt%) is pre-sented in Fig. 3. It can be observed from Fig. 3 that the hardnessof m-cresol novalac epoxy composites filled with above three par-ticulates increases with an increase in the filler content from 5 to10 wt%. However, there was slight decrease in the hardness ofthese composites with an increase in filler content of 15 wt%.It was also found that the m-cresol novalac epoxy compositesfilled with SiC particulates exhibit high hardness in comparisonto the Al2O3 and ZnO particulates. This is because of the highhardness and high strength of the SiC particulate and the three-dimensional network structures of the novalac epoxy resin. Inaddition, when the m-cresol novalac epoxy resin filled with theSiC particulates was cured at high temperature the final compos-ites formed became more brittle. The effect of filler content (SiC,Al2O3, and ZnO) on the mechanical properties such as tensilestrength, flexural strength, and compression strength of the m-cresol novalac epoxy composites is shown in Figs. 4a–4c.
From Figs. 4a and 4b it was observed that the tensile strengthand flexural strength of the m-cresol novalac epoxy compositesincrease with an increase in the filler content from 5 to 10 wt%and decrease at a filler content of 15 wt%. However, the compres-
sion strength of the m-cresol novalac epoxy composites increaseswith an increase in the filler content from 5 to 15 wt%. In com-pression the load applied is also borne by the matrix and hencehigher values are obtained. It is clear from Fig. 4c that the ten-sile strength, flexural strength, and compression strength of them-cresol novalac epoxy composites increase with an increase inthe filler content from 5 to 10 wt% and decrease at a filler con-tent of 15 wt%. From Figs. 4a–4c it was also found that the im-provement in strength can be attributed to the high strength, highcuring temperature, homogeneous distribution of the fillers in thecomposites, and good interfacial adhesion between the fillers andthe epoxy matrix. However, the reduction in strength at (15 wt%)may be due to the addition of a higher weight percentage of filler,which becomes conglomerated at one place due to which stressconcentration takes place and some cracking occurs and conse-quently the composite fails at lower values and a reduction instrength was observed.
Effects of Input Parameters on Coefficient of Frictionand Specific Wear Rate
From Tables 3 and 4 a model adequacy check was performedin order to verify that the quadratic model for the coefficient offriction and specific wear rate of the m-cresol novalac epoxy com-posites for the regression analysis are not violated. The normal
Dow
nloa
ded
by [
Mos
kow
Sta
te U
niv
Bib
liote
] at
09:
18 1
6 Fe
brua
ry 2
014

Meta-Cresol Novalac Epoxy Composites 165
5 10 15 200
5
10
15
20
25
30
35
40
45
50
55
60
65
Har
dnes
s (H
RC
)
Types of fillers (wt %)
SiC Al
2O
3
ZnO
Fig. 3—Variation in hardness of meta-cresol novalac epoxy composites filled with SiC, Al2O3, and ZnO fillers.
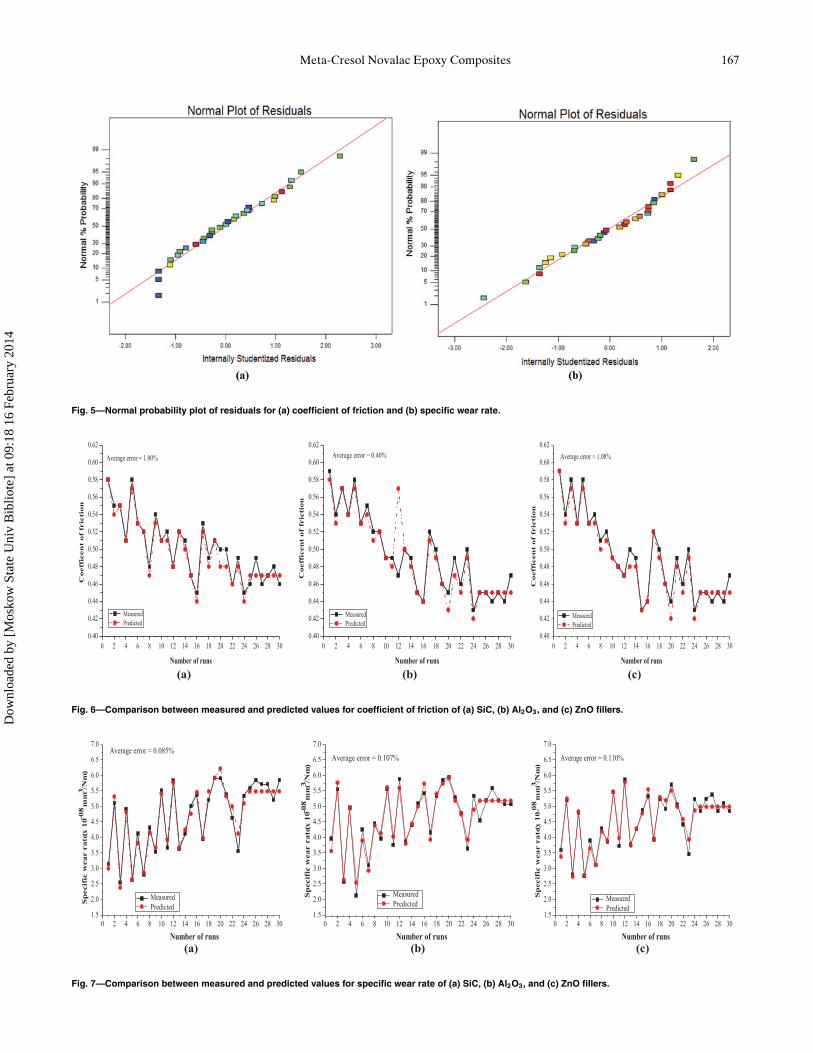
probability plots of the residual for the coefficient of friction andspecific wear rate are shown in Figs. 5a and 5b. The number ofdots represents the number of runs of the design matrix and thedifferent colored dots represent the input parameters. In Figs. 5aand 5b the color point represents the value of conversion of theoutput responses; that is, the coefficient of friction and specificwear rate according to the value of the input parameters givenin the design matrix. These plots show no sign of the violation ofindependence or constant assumption because each point in theplot follows a straight line pattern, implying that the errors aredistributed normally. The obtained model can be used to predictthe coefficient of friction and specific wear rate of these m-cresolnovalac epoxy composites within the limits of the factors studied.
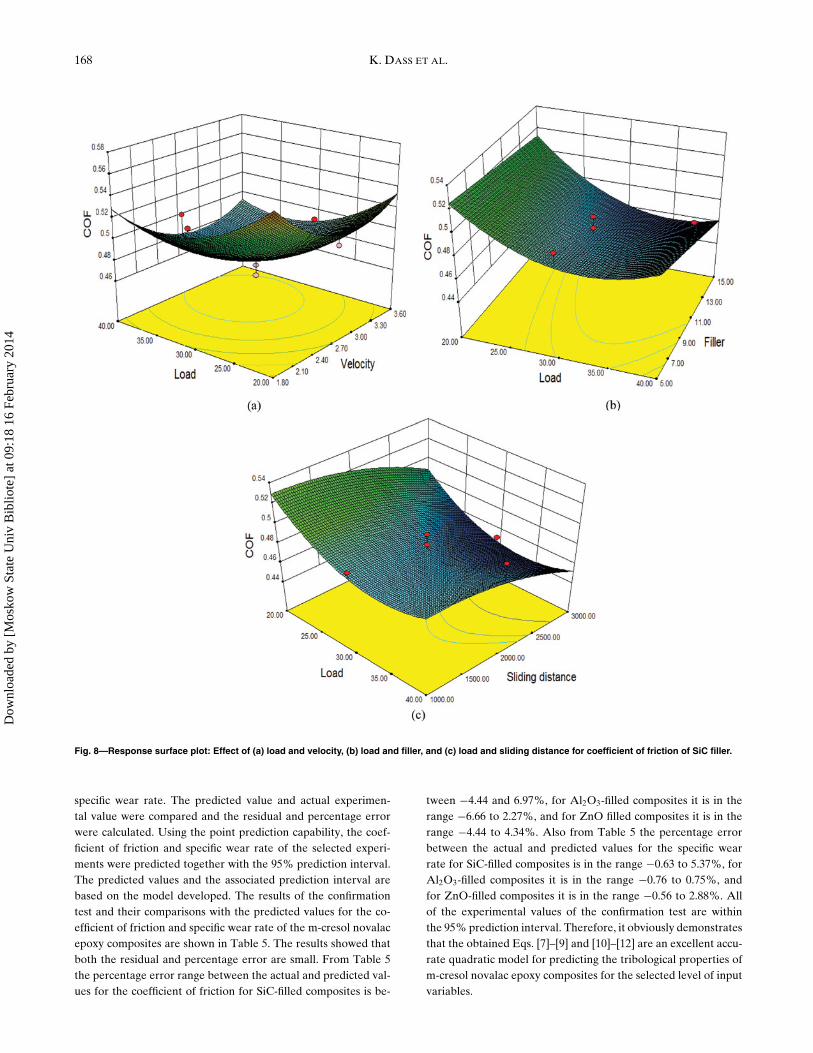
The quadratic model equations [7]–[12] show agreementabove 95% in the fit values. Hence, these equations can be usedto determine the effect on the coefficient of friction and specificwear rate of the m-cresol novalac epoxy composites. Figures 6and 7 show the predicted values of the coefficient of friction andspecific wear rate of (a) SiC, (b) Al2O3, and (c) ZnO fillers fromthe quadratic model of response equation and the measured val-ues. From Figs. 6 and 7 it is observed that the average error forthe coefficient of friction of m-cresol novalac epoxy compositesranges from 0.40 to 1.08% and for the specific wear rate the aver-age error ranges from 0.085 to 0.110%. In addition, the results ofthe comparison prove that the predicted values of the coefficientof friction and specific wear rate of the m-cresol novalac epoxycomposites are very close to those readings recorded experimen-tally. In order to investigate the effects of input parameters onthe coefficient of friction and specific wear rate of the m-cresolnovalac epoxy composites, response surface plots were drawn, asshown Figs. 8–11. Figures 8a–8c show the effect of (a) load and
velocity, (b) load and filler, and (c) load and sliding distance onthe coefficient of friction of m-cresol novalac epoxy compositesfilled with SiC filler. From Fig. 8a it is observed that the coeffi-cient of friction increases with an increase in the applied normalload and sliding velocity. This is because during sliding at highapplied normal load and high sliding velocity there are friction-induced thermal and mechanical effects, which may increase theactual contact area and the adherence between the frictional pairwith increased applied normal load. In addition, the contact tem-perature is elevated due to frictional heating, which could causean increase in the frictional coefficient (Chang, et al. (33)).
From Figs. 8b and 8c it was found that the coefficient of fric-tion decreases with an increase in the filler contents and slid-ing distance. This could be attributed to the fact that duringsliding under long sliding distances the surface of the compos-ite specimens and rough profile of the steel disc counterpart aresmoothened as a result of abrasiveness and a transfer film formson the surface of the steel counterpart and hence coefficient offriction decreases (Siddhartha, et al. (34)). A similar trend wasfound in case of coefficient of friction of the m-cresol novalacepoxy composites filled with Al2O3 and ZnO particulates (notshown in the figures). Figure 9 presents the effect of (a) load andvelocity, (b) load and filler, and (c) load and sliding distance onthe specific wear rate of m-cresol novalac epoxy composites filledwith SiC filler. It is observed from Fig. 9a that with an increasein the applied normal load and sliding velocity the specific wearrate increases. In Fig. 9b, the specific wear rate decreases withan increase in the filler content and increases with an increase inthe applied normal load; in Fig. 9c the specific wear rate increaseswith an increase in the sliding distance and decreases with an in-crease in the applied normal load. Figure 10 presents the effect
Dow
nloa
ded
by [
Mos
kow
Sta
te U
niv
Bib
liote
] at
09:
18 1
6 Fe
brua
ry 2
014

166 K. DASS ET AL.
5 10 1520
30
40
50
60
70
80
90
100
110
120
130
140St
reng
th (M
Pa)
Content of SiC filler (wt %)
Tensile Flexural Compression
5 10 1520
30
40
50
60
70
80
90
100
110
120
130
140
Stre
ngth
(MP
a)
Content of Al2O3 filler (wt %)
Tensile Flexural Compression
5 10 1520
30
40
50
60
70
80
90
100
110
120
130
140 Tensile Flexural Compression
Stre
ngth
(MPa
)
Content of ZnO filler (wt %)
(a)
(c)
(b)
Fig. 4—(a) Effect of SiC fillers (wt%) on the mechanical properties of meta-cresol novalac epoxy composite, (b) Effect of Al2O3 fillers (wt%) on themechanical properties of meta-cresol novalac epoxy composite, (c) Effect of ZnO fillers (wt%) on the mechanical properties of meta-cresolnovalac epoxy composite.
of (a) load and velocity, (b) load and filler, and (c) load and slid-ing distance on the specific wear rate of m-cresol novalac epoxycomposites filled with Al2O3 filler. From Figs. 10a and 10b it wasfound that the specific wear rate increases with an increase in theapplied normal load and sliding velocity and decreases with anincrease in the filler contents, and in Fig. 10c it was found thatspecific wear rate increases with an increase in the applied normalload and sliding distance. Figure 11 presents the effect of (a) loadand velocity, (b) load and filler, and (c) load and sliding distanceon the specific wear rate of m-cresol novalac epoxy compositesfilled with ZnO filler. From Fig. 11 it is clear that with an increasein the applied normal load, sliding velocity, and sliding distancethe specific wear rate increases, whereas with an increase in fillercontent the specific wear rate decreases. From Figs. 9–11 in mostof the cases it is found that the specific wear rate increases with anincrease in the applied normal load, sliding velocity, and sliding
distance. This could be because during sliding the two surfacesare in contact and move relative to each other and under highsliding conditions (i.e., high applied normal load, sliding velocity,and sliding distance), and the friction that exists between thesetwo surfaces converts kinetic energy into heat and also becauseof brittleness behavior of m-cresol novalac epoxy, which in turnraises the temperature and causes thermal softening of the com-posites as well as shear, which results in an increase in the specificwear rate. In addition, the higher contact temperature decreasesthe shear strength of the matrix, and this can also result in a highwear rate (Zhang, et al. (35)).
Confirmation Test
In order to verify the adequacy of the model developed, threeconfirmation experiments for each of the m-cresol novalac epoxycomposites were performed for the coefficient of friction and
Dow
nloa
ded
by [
Mos
kow
Sta
te U
niv
Bib
liote
] at
09:
18 1
6 Fe
brua
ry 2
014
Meta-Cresol Novalac Epoxy Composites 167
Fig. 5—Normal probability plot of residuals for (a) coefficient of friction and (b) specific wear rate.
0 2 4 6 8 10 12 14 16 18 20 22 24 26 28 300.40
0.42
0.44
0.46
0.48
0.50
0.52
0.54
0.56
0.58
0.60
0.62
Coef
fice
nt
of
fric
tion
Number of runs
Measured Predicted
Average error = 1.00%
(a)
0 2 4 6 8 10 12 14 16 18 20 22 24 26 28 300.40
0.42
0.44
0.46
0.48
0.50
0.52
0.54
0.56
0.58
0.60
0.62Average error = 0.40%
Measured Predicted
Coef
fice
nt
of
fric
tion
Number of runs(b)
0 2 4 6 8 10 12 14 16 18 20 22 24 26 28 300.40
0.42
0.44
0.46
0.48
0.50
0.52
0.54
0.56
0.58
0.60
0.62Average error = 1.08%
Measured Predicted
Coef
fice
nt
of
fric
tion
Number of runs(c)
Fig. 6—Comparison between measured and predicted values for coefficient of friction of (a) SiC, (b) Al2O3, and (c) ZnO fillers.
0 2 4 6 8 10 12 14 16 18 20 22 24 26 28 301.5
2.0
2.5
3.0
3.5
4.0
4.5
5.0
5.5
6.0
6.5
7.0Average error = 0.085%
Measured Predicted
Sp
ecif
ic w
ear
rate
(x 1
0-08
mm
3 /N
m)
Number of runs(a)
0 2 4 6 8 10 12 14 16 18 20 22 24 26 28 301.5
2.0
2.5
3.0
3.5
4.0
4.5
5.0
5.5
6.0
6.5
7.0
Measured Predicted
Sp
ecif
ic w
ear
rate
(x 1
0-08 m
m3 /N
m)
Number of runs
Average error = 0.107%
(b)
0 2 4 6 8 10 12 14 16 18 20 22 24 26 28 301.5
2.0
2.5
3.0
3.5
4.0
4.5
5.0
5.5
6.0
6.5
7.0
Sp
ecif
ic w
ear
rate
(x 1
0-08
mm
3 /N
m)
Number of runs
Measured Predicted
Average error = 0.110%
(c)
Fig. 7—Comparison between measured and predicted values for specific wear rate of (a) SiC, (b) Al2O3, and (c) ZnO fillers.
Dow
nloa
ded
by [
Mos
kow
Sta
te U
niv
Bib
liote
] at
09:
18 1
6 Fe
brua
ry 2
014
168 K. DASS ET AL.
Fig. 8—Response surface plot: Effect of (a) load and velocity, (b) load and filler, and (c) load and sliding distance for coefficient of friction of SiC filler.
specific wear rate. The predicted value and actual experimen-tal value were compared and the residual and percentage errorwere calculated. Using the point prediction capability, the coef-ficient of friction and specific wear rate of the selected experi-ments were predicted together with the 95% prediction interval.The predicted values and the associated prediction interval arebased on the model developed. The results of the confirmationtest and their comparisons with the predicted values for the co-efficient of friction and specific wear rate of the m-cresol novalacepoxy composites are shown in Table 5. The results showed thatboth the residual and percentage error are small. From Table 5the percentage error range between the actual and predicted val-ues for the coefficient of friction for SiC-filled composites is be-
tween −4.44 and 6.97%, for Al2O3-filled composites it is in therange −6.66 to 2.27%, and for ZnO filled composites it is in therange −4.44 to 4.34%. Also from Table 5 the percentage errorbetween the actual and predicted values for the specific wearrate for SiC-filled composites is in the range −0.63 to 5.37%, forAl2O3-filled composites it is in the range −0.76 to 0.75%, andfor ZnO-filled composites it is in the range −0.56 to 2.88%. Allof the experimental values of the confirmation test are withinthe 95% prediction interval. Therefore, it obviously demonstratesthat the obtained Eqs. [7]–[9] and [10]–[12] are an excellent accu-rate quadratic model for predicting the tribological properties ofm-cresol novalac epoxy composites for the selected level of inputvariables.
Dow
nloa
ded
by [
Mos
kow
Sta
te U
niv
Bib
liote
] at
09:
18 1
6 Fe
brua
ry 2
014

Meta-Cresol Novalac Epoxy Composites 169
Fig. 9—Response surface plot: Effect of (a) load and velocity, (b) load and filler, and (c) load and sliding distance for specific wear rate of SiC filler.
Fig. 10—Response surface plot: Effect of (a) load and velocity, (b) load and filler, and (c) load and sliding distance for specific wear rate of Al2O filler.
Fig. 11—Response surface plot: Effect of (a) load and velocity, (b) load and filler, and (c) load and sliding distance for specific wear rate of ZnO filler.
Dow
nloa
ded
by [
Mos
kow
Sta
te U
niv
Bib
liote
] at
09:
18 1
6 Fe
brua
ry 2
014
170 K. DASS ET AL.
TABLE 5—RESULTS OF CONFIRMATION TEST FOR COEFFICENT OF FRICTION AND SPECIFIC WEAR RATE
Input Parameters Coefficent of Friction (μ) Specific Wear Rate × 10−8 (mm3/Nm)
Fillers (A) (B) (C) (D) Actual Predicted Residual Error (%) Actual Predicted Residual Error (%)
SiC 1.80 20 5 1,000 0.58 0.57 0.01 1.72 3.14 3.16 −0.02 −0.632.70 30 10 2,000 0.45 0.47 0.02 −4.44 5.21 5.49 −0.28 5.373.60 40 15 3,000 0.43 0.46 −0.03 6.97 5.38 5.37 0.01 0.18
Al2O3 1.80 20 5 1,000 0.59 0.58 0.01 1.69 3.96 3.93 0.03 0.752.70 30 10 2,000 0.45 0.48 −0.03 −6.66 5.20 5.24 −0.04 −0.763.60 40 15 3,000 0.44 0.43 0.01 2.27 4.90 4.93 −0.03 −0.61
ZnO 1.80 20 5 1,000 0.59 0.57 0.02 3.38 5.38 5.36 0.02 0.182.70 30 10 2,000 0.46 0.48 0.02 4.34 4.85 4.99 −0.14 2.883.60 40 15 3,000 0.45 0.47 −0.02 −4.44 5.33 5.30 0.03 −0.56
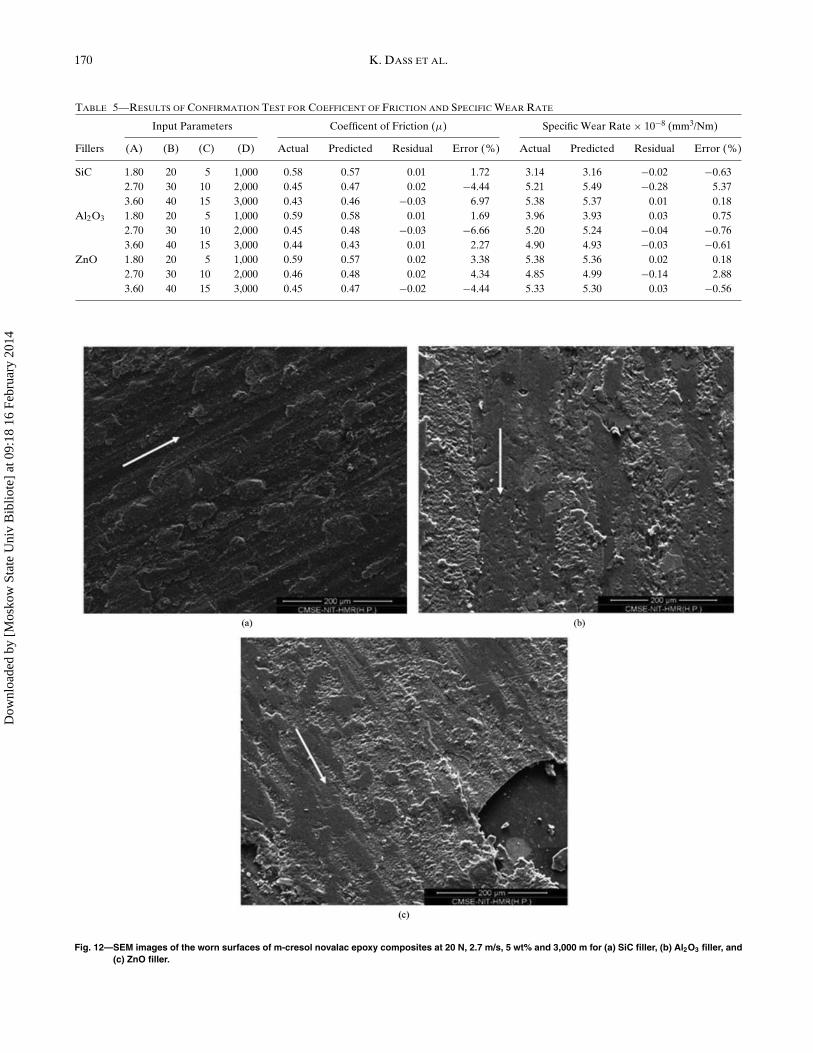
Fig. 12—SEM images of the worn surfaces of m-cresol novalac epoxy composites at 20 N, 2.7 m/s, 5 wt% and 3,000 m for (a) SiC filler, (b) Al2O3 filler, and(c) ZnO filler.
Dow
nloa
ded
by [
Mos
kow
Sta
te U
niv
Bib
liote
] at
09:
18 1
6 Fe
brua
ry 2
014

Meta-Cresol Novalac Epoxy Composites 171
Fig. 13—SEM images of the worn surfaces of m-cresol novalac epoxy composites at 40 N, 2.7 m/s, 5 wt% and 3,000 m for (a) SiC filler, (b) Al2O3 filler, and(c) ZnO filler.
Worn Surface Morphology
The worn surface morphology of the m-cresol novalac epoxycomposites was observed using SEM examination to find a corre-lation between the worn surface and sliding wear loss of the var-ious particulates. SEM images of the worn surfaces of m-cresolnovalac epoxy composites are presented in Figs. 12 and 13. FromFigs. 12a–12c it is seen that the worn appearance of the com-posite surfaces are completely different and rather smooth incomparison to those in Figs. 13a–13c. It is also observed fromFig. 12a that the composite material loss is caused by the ad-hesive wear mechanism in the form of hard particle asperities.Figures 13b and 13c also show some micrometer-size fragmentsand small scratches or traces on the worn surface of the com-posites, which is a clear indication of fatigue crack propagationgenerated under simultaneously acting pressure and shear loadsinduced by the movement of the steel counterpart. Fatigue wear
has been regarded as a main mechanism responsible for the slid-ing of epoxy against a hard counterpart (Li, et al. (28); Yam-aguchi (36)). During sliding at high applied normal load, as shownin Figs. 13a–13c, a large crack appeared on the composite sur-face and showed a relatively severe abrasive ferrous and splintedwear debris occurs, which helps to protect the material from se-vere wear. Also during sliding under high applied normal loads, itproduces high frictional temperature, this frictional temperaturecertainly arouses plastic deformation. This consequently mergesthe cracks or debris and helps to form a transfer film on the coun-terpart surface. This also helps to reduce the wear of the com-posites. However, an uneven stress concentration built up insidethe m-cresol novalac epoxy that might have been uniformly dis-tributed to some extent in the composites due to the effect ofdispersion strengthening of the particulates. This is beneficial forreducing the material loss of these composites (Rong et al. (37);Wetzel et al. (38)).
Dow
nloa
ded
by [
Mos
kow
Sta
te U
niv
Bib
liote
] at
09:
18 1
6 Fe
brua
ry 2
014

172 K. DASS ET AL.
CONCLUSIONS
Incorporation of microsized SiC, Al2O3, and ZnO particulatesinto m-cresol novalac epoxy resin resulted in improved mechani-cal and tribological properties.
1. The hardness, tensile strength, and flexural strength of m-cresol novalac epoxy composites filled with these particulatesincreases with an increase in the filler contents from 5 to10 wt% and decreases with an increase in the filler contentof 15 wt%.
2. The compression strength of the m-cresol novalac epoxy com-posites increases with an increase in the filler contents from 5to 15 wt%.
3. The coefficient of friction of the m-cresol novalac epoxy com-posites filled with these particulates decreases with an increasein the filler content and sliding distance.
4. The specific wear rate increases with an increase in the slidingvelocity, applied normal load, and sliding distance. The spe-cific wear rate decreases with an increase in filler contents ofthe m-cresol novalac epoxy composites filled with Al2O3 andZnO particulates.
5. The results of ANOVA and the confirmation experimentsproved that the mathematical models of the coefficient of fric-tion and specific wear rate of the m-cresol novalac epoxy com-posites provided a good fit and the predicted values of thecoefficient of friction and specific wear rate are very close tothose readings recorded experimentally within a 95% confi-dence interval.
REFERENCES(1) Biswas, S. and Satapathy, A. (2010), “A Study on Tribological Behavior
of Alumina-Filled Glass–Epoxy Composites Using Taguchi ExperimentalDesign,” Tribology Transactions, 53, pp 520–532.
(2) Friedrich, K. and Schlarb, A. K. (Eds.). (2008), “Tribology of PolymericNanocomposites,” Tribology and Interface Engineering Series [SpecialIssue], ;55.
(3) Guo, Q. B., Lau, K. T., Rong, M. Z., and Zhang, M. Q. (2010), “Optimiza-tion of Tribological and Mechanical Properties of Epoxy through HybridFilling,” Wear, 269, pp 13–20.
(4) Chang, L., Zhang, Z., Breidt, C., and Friedrich, K. (2005), “TribologicalProperties of Epoxy Nano Composites I. Enhancement of the Wear Resis-tance by Nano-TiO2 Particles,” Wear, 258, pp 141–148.
(5) Ellis, B. (1993), Chemistry and Technology of Epoxy Resins, Blackie:London.
(6) Bhattacharya, S. K. and Tummala, R. R. (2001), “Integral Passives forNext Generation of Electronic Packaging: Application of Epoxy/CeramicNanocomposites as Integral Capacitors,” Microelectronics Journal, 32, pp11–19.
(7) Bahadur, S. and Gong, D. (1992), “The Action of Fillers in the Modifica-tion of the Tribological Behavior of Polymers,” Wear, 158, pp 41–59.
(8) Vort, J. V. and Bahadur, S. (1995), “The Growth and Bonding of Trans-fer Film and the Role of CuS and PTFE in the Tribological Behavior ofPEEK,” Wear, 181, pp 212–221.
(9) Bhabani, K. S. and Bijwe, J. (2002), “Analysis of Simultaneous Influenceof Operating Variables on Abrasive Wear of Phenolic Composites,” Wear,253, pp 787–794.
(10) Schwarts, C. and Bahadur, S. (2001), “The Role of Filler Deforma-bility, Filler–Polymer Bonding, and Counterface Material on the Tri-bological Behaviour of Polyphenylene Sulfide (PPS),” Wear, 251,pp 1532–1540.
(11) Bahadur, S., Zhang, L., and Anderegg, J. W. (1997), “The Effect of Zincand Copper Oxides and Other Zinc Compounds as Fillers on the Tribo-logical Behavior of Thermosetting Polyester,” Wear, 203, pp 464–473.
(12) Zhao, Q. and Bahadur, S. (1998), “A Study of the Modification of the Fric-tion and Wear Behavior of Polyphenylene Sulfide by Particulate Ag2S andPbTe Fillers,” Wear, 217, pp 62–72.
(13) Padhi, P. K. and Satapathy, A. (2013), “Analysis of Sliding Wear Char-acteristics of BFS Filled Composites Using an Experimental Design Ap-proach Integrated with ANN,” Tribology Transactions, 56, pp 789–796.
(14) Friedrich, K., Lu, Z., and Hager, A. M. (1995), “Recent Advances in Poly-mer Composites Tribology,” Wear, 190, pp 139–144.
(15) Bahadur, S., Fu, Q., and Dong, D. (1994), “The Effect of Reinforcementand the Synergism between CuS and Carbon Fiber on the Wear of Nylon,”Wear, 178, pp 123–130.
(16) Yoo, J. H. and Eiss, N. S. (1993), “Tribological Behaviour of Blends ofPolyether-Ether-Ketone and Polyetherimide,” Wear, 164, pp 418–425.
(17) Bijwe, J., Indumathi, J., Rajesh, J. J., and Fahim, M. (2001), “Friction andWear Behavior of Poly Ether Imide Composites in Various Wear Modes,”Wear, 249, pp 715–721.
(18) Hager, A. M. and Davies, M. (1993), “Short-Fibre Reinforced, High Tem-perature Resistant Polymers for a Wide Field of Tribological Applica-tions,” Advances in Composite Tribology, 8, pp 107–157.
(19) Zhang, H. J., Zhang, Z. Z., and Guo, F. (2010), “A Study on the Slid-ing Wear of Hybrid PTFE/Kevlar Fabric/Phenolic Composites Filled withNanoparticles of TiO2 and SiO2,” Tribology Transactions, 53, pp 678–683.
(20) Chang, L. and Zhang, Z. (2006), “Tribological Properties of EpoxyNanocomposites: Part II. A Combinative Effect of Short Carbon Fibrewith Nano-TiO2,” Wear, 260, pp 869–878.
(21) Xing, X. S. and Li, R. K. Y. (2004), “Wear Behavior of Epoxy–MatrixComposites Filled with Uniform Sized Sub-Micron Spherical Silica Par-ticles,” Wear, 256, pp 21–26.
(22) Kishore, Sampathkumaran, P., Seetharamu, S., Vynatheya, S., Murali, A.,and Kumar, R. K. (2000), “SEM Observations of the Effect of Velocityand Load on the Sliding Wear Characteristics of Glass Fabric Epoxy Com-posites with Different Filler,” Wear, 237, pp 20–27.
(23) Shi, G., Zhang, M. Q., and Rong, M. Z. (2003), “Friction and Wear of LowNanometer Si3N4 Filled Epoxy Composites,” Wear 254, pp 784–796.
(24) Wang, L. Q., Jia, X. M., Cui, L., and Chen, G. C. (2009), “Effect of AramidFiber and ZnO Nanoparticles on Friction and Wear of PTFE Compositesin Dry and LN2 Conditions,” Tribology Transactions, 52, pp 59–65.
(25) Zhao, Q. and Bahadur, S. (1999), “The Mechanism of Filler Action and theCriterion of Filler Selection for Reducing Wear,” Wear, 225, pp 660–668.
(26) Suresha, B., Chandramohan, G., Sadananda, P. R., Rao, P., Sampathku-maran, and Seetharamu, S. (2007), “Iinfluence of SiC Filler on Mechanicaland Tribological Behavior of Glass Fabric Reinforced Epoxy CompositeSystems,” Journal of Reinforced Plastics and Composites, 26, pp 565–578.
(27) Bassani, R., Levita, G., Meozzi, M., and Palla, G. (2001), “Friction andWear of Epoxy Resin on Inox Steel: Remarks on the Influence of Velocity,Load and Induced Thermal State,” Wear, 247, pp 125–132.
(28) Li, J., Liao, H., and Coddet, C. (2002), “Friction and Wear Behaviour ofFlame-Sprayed PEEK Coatings,” Wear, 252, pp 824–831.
(29) Wetzel, B., Haupert, F., Friedrich, K., Zhang, M. Q., and Rong, M. Z.(2002), “Impact and Wear Resistance of Polymer Nanocomposites at LowFiller Content,” Polymer Engineering Science, 42, pp 1919–1927.
(30) Dean, K., Cook, W. D., Rey, L., Galy, J., and Sautereau, H. (2000), “Near-Infrared and Rheological Investigations of Epoxy–Vinyl Ester Interpene-trating Polymer Networks,” Macromolecules, 33, pp 6623–6630.
(31) Knall, D. W., Nelson, D. H., and Kenres, P. W. (1958), 134th Ameri-can Chemical Society Symposium. Chicago, Division of Paint, Plastics andPrinting Ink Chemistry, Paper No. 5, pp 20.
(32) Montgomery, D. C. (1991), Design and Analysis of Experiments, 5th ed.,Wiley: Singapore.
(33) Chang, L., Zhang, Z., Zhang, H., and Friedrich, K. (2005), “Effect ofNanoparticles on the Tribological Behaviour of Short Carbon Fibre Re-inforced Polyetherimide Composites,” Tribology International, 38, pp966–973.
(34) Siddhartha, Patnaik, A., and Bhatt, A. D. (2011), “Mechanical and DrySliding Wear Characterization of Epoxy TiO2 Particulate Filled Function-ally Graded Composites Materials Using Taguchi Design of Experiment,”Materials and Design, 32, pp 615–627.
(35) Zhang, G., Liao, H., Li, H., Mateus, C., Bordes, J. M., and Coddet, C.(2006), “On Dry Sliding Friction and Wear Behaviour of PEEK andPEEK/SiC-Composite Coatings,” Wear, 260, pp 594–600.
(36) Yamaguchi, Y. (1990), “Improvement of Lubricity,” Tribology of PlasticMaterials, 16, pp 143–202.
(37) Rong, M. Z., Zhang, M. Q., Liu, H., Zeng, H. M., Wetzel, B., andFriedrich, K. (2001), “Microstructure and Tribological Behavior of Poly-meric Nanocomposites,” Industrial Lubrication & Tribology, 53(2), pp72–77.
(38) Wetzel, B., Haupert, F., Friedrich, K., Zhang, M. Q., and Rong, M. Z.(2001), “Mechanical and Tribological Properties of Microparticulate andNanoparticulate Reinforced Polymer Composites,” Proceedings of theICCM-13, Beijing.
Dow
nloa
ded
by [
Mos
kow
Sta
te U
niv
Bib
liote
] at
09:
18 1
6 Fe
brua
ry 2
014