study on the cost of compliance with selected fsap...
TRANSCRIPT

Study on the Cost of Compliance with Selected FSAP Measures
Final Report by
Europe Economics
Europe Economics Chancery House
53-64 Chancery Lane London WC2A 1QU
Tel: (+44) (0) 20 7831 4717 Fax: (+44) (0) 20 7831 4515
www.europe-economics.com
5 January 2009

TABLE OF CONTENTS
EXECUTIVE SUMMARY ..........................................................................................I Introducing the Study........................................................................................................................i Our Approach.....................................................................................................................................i The Results........................................................................................................................................ii
1 INTRODUCTION............................................................................................1 Background .......................................................................................................................................1 The Structure of the Report.............................................................................................................2
2 CONTEXT OF THE STUDY..........................................................................3 Introduction .......................................................................................................................................3 Regulation in the Financial Services Sector.................................................................................3 The Costs of Compliance ................................................................................................................4 The Financial Services Action Plan and the Selected Directives ........................................... 10 The Participants in the Study....................................................................................................... 14 Intra-sample categorisations ....................................................................................................... 21
3 THE COMPLIANCE FUNCTION ................................................................24 Introduction .................................................................................................................................... 24 The Role of Compliance................................................................................................................ 24 The Drivers of Compliance Strategy and Resource Allocation .............................................. 25 Organisational Structure .............................................................................................................. 45 Intensity........................................................................................................................................... 46 Cost Control and Compliance...................................................................................................... 46
4 THE ONE-OFF COSTS OF COMPLIANCE...............................................50 Introduction .................................................................................................................................... 50 The Impact of Changing Financial Services Regulation.......................................................... 50 Synergies between the Measures ............................................................................................... 53 Banks and Financial Conglomerates.......................................................................................... 54 Asset Managers ............................................................................................................................. 70 Investment Banks.......................................................................................................................... 81 Financial Markets........................................................................................................................... 90
5 THE ONGOING COST OF COMPLIANCE................................................93 Introduction .................................................................................................................................... 93 The Impact of Changing Financial Services Regulation.......................................................... 93 Synergies between the Measures ............................................................................................... 96 Banks and Financial Conglomerates.......................................................................................... 96 Asset Managers ........................................................................................................................... 108 Investment Banks.........................................................................................................................116 Financial Markets......................................................................................................................... 121
APPENDIX 1: NOTE ON METHODOLOGY.......................................................124 Sample Selection......................................................................................................................... 124 The Design of the Structured Interview.................................................................................... 124

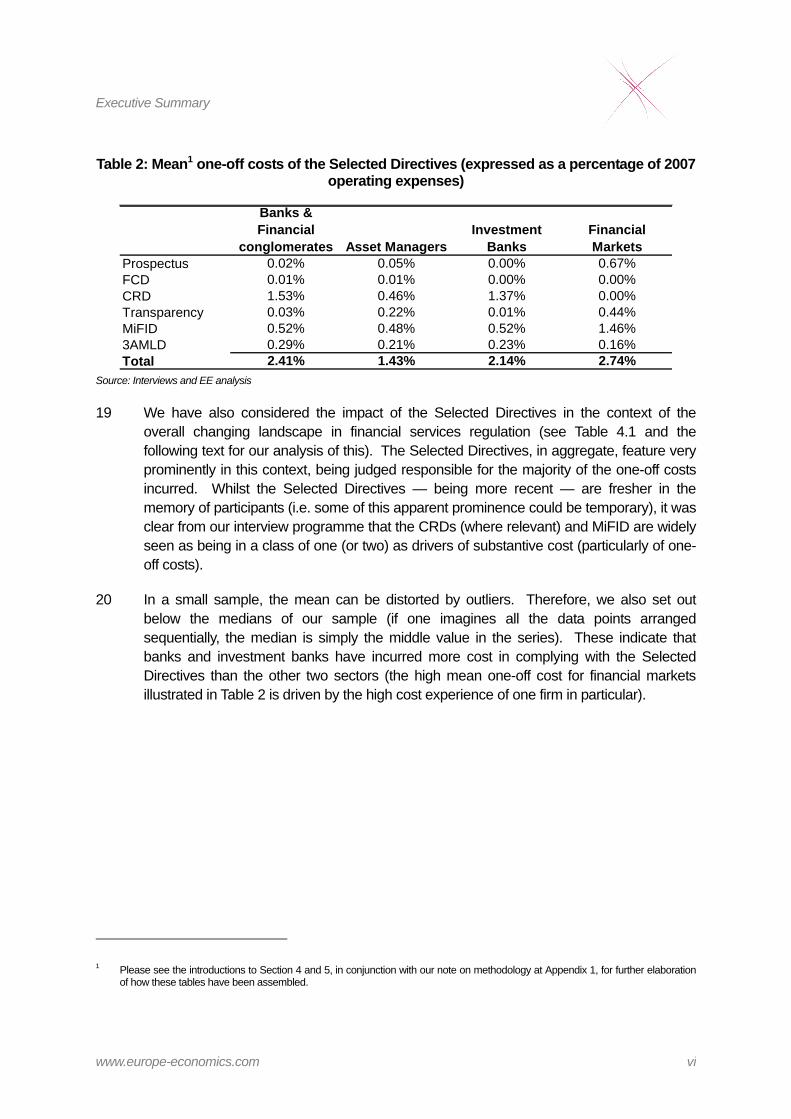
Interviews...................................................................................................................................... 127
APPENDIX 2: GOLD PLATING...........................................................................132 Towards a Definition of Gold-plating ........................................................................................ 132 The Scope of Gold-plating.......................................................................................................... 132 The Impact of Gold-plating......................................................................................................... 133
APPENDIX 3: ADDITIONAL SAMPLE ANALYSIS............................................135 One-off costs ................................................................................................................................ 135 Ongoing costs.............................................................................................................................. 139

Executive Summary
www.europe-economics.com i
EXECUTIVE SUMMARY
Introducing the Study
1 This study has the objective of quantifying the cost impact of compliance with financial services regulation.
2 In order to strike a balance between depth and breadth of coverage, we have focused our work upon the following Directives: the Capital Requirements Directives (the CRDs); the Transparency Directive; the Markets in Financial Instruments Directive (MiFID); the Third Anti-Money Laundering Directive (3AMLD); the Prospectus Directive and the Financial Conglomerates Directive (together, the Selected Directives). With the exception of the 3AMLD, these measures formed important parts of the Financial Service Action Plan (FSAP).
3 We have concentrated on firms from four sectors within the financial services industry in the EU: banks & financial conglomerates; asset managers; investment banks and financial markets.
4 We have adopted a broad definition of the cost of compliance. In particular, we have not restricted our focus to the impact on the compliance function in isolation from the rest of a business. In addition, in cases where a firm has been only indirectly impacted by a measure, we have sought to capture that cost, provided that it is sufficiently clear that it would not have been incurred in the absence of the particular regulatory change.
Our Approach
5 Our method has centred upon interviews with market participants. We have conducted structured interviews with seventy-eight firms. This has generated quantitative data suitable for further analysis from ninety-four entities (some interviewees operate across multiple sectors). The table below summarises the position. The figures in brackets indicate where we have obtained either quantitative and/or qualitative data. A full list of the individual firms is presented at Table 2.1 in Section 2. The geographic coverage obtained is illustrated in the map at Figure 2.1 (also in Section 2).

Executive Summary
www.europe-economics.com ii
Table 1: Data gathering summary
“Northern” “Southern” New TOTAL Banks and financial conglomerates 18 (21) 11 (12) 11 40 (44)
Asset managers 11 12 5 28
Investment banks 9 9 0 18
Financial markets 2 1 (2) 5 8 (9) 40 (43) 33 (35) 21 94 (99) “Northern” Member States covered were the UK, Ireland, Germany, Austria, Netherlands, Sweden, Finland and Denmark. “Southern” Member States covered were France, Spain, Italy, Greece, Portugal and Luxembourg. New Member States were Hungary, the Czech Republic, Bulgaria, Malta and Cyprus.
6 We have sought to achieve a sample that is broadly representative of the diversity of the European financial services industry (at least as covered by our chosen sectors). Naturally, there are restrictions upon how representative a (relatively) small sample can be — equally, not all firms that we asked to participate chose to do so. We discuss the sample’s coverage further at 2.52 to 2.58 within our report.
7 Given the relatively small sample size, this study’s results should not be viewed as the definitive answer in terms of the total cost of compliance with the Selected Directives — in particular, it is not intended that the results be extrapolated across the European financial services community as a whole.
8 The principal constraint in getting firms to participate in the study was a lack of resources on their part. Our study ran from January through to December 2008. The main body of interviews were conducted between May and November. This lack of resources may, in part, have been a result of the difficult prevailing market conditions, resulting in more compliance and operational resources being deployed on other matters or even, in extreme cases, resulting in reductions in headcount.
9 We wish to take this opportunity to thank all of those firms that participated in our study, and in particular those individuals who made the time to assist us in our work.
The Results
10 The fundamental interest of the compliance function is in ensuring that the business complies with existing external laws and regulations, and internally-defined policies and ethical standards. Beyond this, the compliance function is seen, by an increasing number of firms, as having a crucial role to play in the mitigation of reputational risk (we discuss the role of the compliance function at greater length in Section 3). It follows that some spending on compliance would occur even in the absence of regulation. Further, such compliance activity need not be restricted to the compliance function itself. We have set out to identify the incremental impact of the Selected Directives on the operating costs of financial services firms.

Executive Summary
www.europe-economics.com iii
11 Of course, it may be that those firms that were most interested in participating in the study were those who had incurred the most cost, so that the estimates received could be biased upwards. However, a notable feature of the study is the wide dispersion of the cost experience of the participants, including a number who reported minimal (or even nil) disruption or cost due to the Selected Directives — this implies that if there is such a bias, it is limited in scope.
12 We cross-checked our results with those of other studies (where appropriate) and we found that our results are broadly in line with them (in most cases). We have not found that our results are systematically either above or below the outcomes of these pre-existing studies. We have commented within Sections 4 and 5 where such comparisons have been made.
13 We have sought to identify separately cost impacts that were one-off from those that are recurring in nature. With regards to one-off costs (particularly where a change to the company’s IT architecture was envisaged) there was often an implementation budget that served as a starting point for the consideration of the cost impact involved. By contrast, the objective in most firms is to absorb recurring costs into the cost of “business as usual” as rapidly as possible. A natural corollary of this is that a separate identification of the ongoing cost impact from the “noise” of the firm’s running costs is made more difficult.
14 Given these challenges, we judged that it would be too demanding of participants to require the estimation of costs net of any associated tax impact. For instance, a business operating across a number of tax jurisdictions would be required to consider the effective tax rate applicable to the costs incurred. This might well be very different from the effective rate applicable to the group as a whole, and so necessitate a separate calculation. Adjustments would also need to have been made for the timing differences between costs being incurred and the tax relief upon them. This said, we recognise that an alternate presentation would be of costs net of tax (i.e. approximating more closely to net cash flow), which would result in lower cost figures than those presented in this report.
15 The ongoing costs of compliance for any given firm are typically lower than the one-off costs. Looking at the different sectors, recurring costs are mostly between 15 and 20 per cent of the implementation cost recorded (financial markets and the means recorded for asset managers represent something of an exception). To illustrate this divergence in scale, we show below the dispersion of the results obtained for the CRDs, MiFID and the 3AMLD.

Executive Summary
www.europe-economics.com iv
Figure 1: Dispersion of one-off and ongoing costs of the CRDs (expressed as a percentage of 2007 operating expenses)
one-off ongoing0
1
2
3
4
5%
of o
pera
ting
cost
s
Source: Interviews and EE analysis.
Figure 2: Dispersion of one-off and ongoing costs of MiFID (expressed as a percentage of 2007 operating expenses)
one-off ongoing0
1
2
3
4
5
6
7
% o
f ope
ratin
g co
sts
Source: Interviews and EE analysis.

Executive Summary
www.europe-economics.com v
Figure 3: Dispersion of one-off and ongoing costs of the 3AMLD (expressed as a percentage of 2007 operating expenses)
one-off ongoing0
1
2
3
4
5
6
11
12%
of o
pera
ting
cost
s
Source: Interviews and EE analysis.
16 The one-off costs relate in large part to investment in IT and the re-shaping of business processes. It is apparent from our work that firms have adopted different strategies in approaching the implementation of new regulations — in particular, in their willingness to put maximum reliance upon the automation of processes. The dispersion in the ongoing costs — and general business experience — suggest that firms have experienced differing levels of success in achieving this objective.
17 We use similar charts to Figures 1, 2 and 3 in order to illustrate the dispersion of results that we have gathered over the course of this study. These charts typically use the results broken down (at least) by Directive and by sector. Overall, it is worth observing that — whilst a number of themes emerge overall — one of the most significant is the wide dispersion of the results.
One-off Costs
18 The table below analyses the impact by sector of the implementation costs of the Selected Directives.
Executive Summary
www.europe-economics.com vi
Table 2: Mean1 one-off costs of the Selected Directives (expressed as a percentage of 2007 operating expenses)
Banks & Financial
conglomerates Asset ManagersInvestment
BanksFinancial Markets
Prospectus 0.02% 0.05% 0.00% 0.67%FCD 0.01% 0.01% 0.00% 0.00%CRD 1.53% 0.46% 1.37% 0.00%Transparency 0.03% 0.22% 0.01% 0.44%MiFID 0.52% 0.48% 0.52% 1.46%3AMLD 0.29% 0.21% 0.23% 0.16%Total 2.41% 1.43% 2.14% 2.74%
Source: Interviews and EE analysis
19 We have also considered the impact of the Selected Directives in the context of the overall changing landscape in financial services regulation (see Table 4.1 and the following text for our analysis of this). The Selected Directives, in aggregate, feature very prominently in this context, being judged responsible for the majority of the one-off costs incurred. Whilst the Selected Directives — being more recent — are fresher in the memory of participants (i.e. some of this apparent prominence could be temporary), it was clear from our interview programme that the CRDs (where relevant) and MiFID are widely seen as being in a class of one (or two) as drivers of substantive cost (particularly of one-off costs).
20 In a small sample, the mean can be distorted by outliers. Therefore, we also set out below the medians of our sample (if one imagines all the data points arranged sequentially, the median is simply the middle value in the series). These indicate that banks and investment banks have incurred more cost in complying with the Selected Directives than the other two sectors (the high mean one-off cost for financial markets illustrated in Table 2 is driven by the high cost experience of one firm in particular).
1 Please see the introductions to Section 4 and 5, in conjunction with our note on methodology at Appendix 1, for further elaboration of how these tables have been assembled.

Executive Summary
www.europe-economics.com vii
Table 3: Median one-off costs of the Selected Directives (expressed as a percentage of 2007 operating expenses)
Banks & Financial
conglomerates Asset ManagersInvestment
BanksFinancial Markets
Prospectus 0.02% 0.00% 0.02% 0.18%FCD 0.00% 0.00% 0.00% 0.00%CRD 1.23% 0.14% 1.09% 0.00%Transparency 0.01% 0.02% 0.04% 0.09%MiFID 0.56% 0.63% 0.68% 0.93%3AMLD 0.31% 0.24% 0.32% 0.03%Total 2.13% 1.03% 2.16% 1.23% Source: Interviews and EE analysis
21 The CRDs (reflecting Basel II) have been the most material drivers of cost in banks and investment banks. It is also apparent that MiFID has been a consistent driver of significant costs across all sectors. Of the other directives, the 3AMLD has had the greatest cost impact.
22 Further breakdowns of one-off costs by firm size and by geographical location are provided in Section 4. In the main, smaller firms have tended to incur proportionately higher cost. The driving factors here are that:
– In responding to regulatory change, there will be a sub-set of activities that are required irrespective of firm size. In absolute terms, some of the participants have been very small firms. Conceptually, there is an aspect of compliance that is necessary regardless of a firm’s scale and also a component that is broadly variable with its size. In the case of smaller firms, this fixed cost element shows up as a large percentage of operating cost. For a truly “small” institution, this fixed element may loom very large indeed.
– As indicated above, firms have choices about how they formulate their response — the reliance placed upon IT, and so on. For some firms, our study indicates that this set of choices may be more restricted: for example, the option of automation may be too expensive. This may make the recurring costs higher than would have otherwise been the case (although there should be some saving in implementation costs).
– For the smallest firms, a specialist compliance function may be absent. In such a case, in order to cover the compliance activities necessary, we have found that it is likely that more resources (and specifically more senior management resources) are required than if such a specialist team was present.
23 However, there are important exceptions to this. The most notable relates to the implementation of the CRDs, where larger banks have typically adopted the advanced approach. Our findings indicate that this is notably more expensive than the standard alternative. In theory, at least, a bank would only take this route if it anticipated that ongoing savings could be achieved in terms of the regulatory capital it is required to hold.

Executive Summary
www.europe-economics.com viii
However, current market conditions (and the resulting reappraisal of what an appropriate capital base might be), amongst other factors, have restricted the ability of banks to access such potential savings.
24 It is also noted that this effect (higher relative costs for small firms) was less apparent with the asset managers, with a notable exception in the impact, inter alia, of the Transparency Directive (please see also paragraphs 38 to 40 in this Executive Summary below).
25 We have found that some of the New Member State-based banks in our sample have been able to achieve lower cost implementations of at least some of the Selected Directives. A number of factors are at play here. Some of these banks are subsidiaries of large firms located elsewhere in the EU27, so the costs faced do not reflect what would have been incurred on a standalone basis. In addition, there has been a conscious focus on cost-effective rather than comprehensive solutions — this seems to be particularly the case with MiFID. As local customers become more sophisticated, these solutions may need to be revisited.
26 In addition, we set out in Section 4 our analysis of the drivers of these cost changes — in general, where substantial costs have been incurred, these have been driven in large part by expenditure upon the firms’ IT architecture.
Ongoing Costs
27 The tables below analyse the ongoing cost impact of the Selected Directives by sector. As with the one-off costs, the CRDs, MiFID and the 3AMLD are driving much of the cost. Looking at the medians (again, bearing in mind the relatively small sample), the pattern across the sectors matches up well to the one-off costs — the Selected Directives have a greater impact upon the ongoing costs of the banks and financial conglomerates and investment banks. It is clear that the level of ongoing cost is significantly below the implementation cost.
Table 4: Mean ongoing costs of the Selected Directives (expressed as a percentage of 2007 operating expenses)
Banks & Financial
conglomerates Asset ManagersInvestment
BanksFinancial Markets
Prospectus 0.01% 0.16% 0.01% -0.15%FCD 0.00% 0.01% 0.00% 0.00%CRD 0.23% 0.06% 0.14% 0.00%Transparency 0.01% 0.08% 0.03% 0.33%MiFID 0.10% 0.30% 0.08% 1.09%3AMLD 0.08% 0.07% 0.05% 0.13%Total 0.43% 0.68% 0.32% 1.41%
Source: Interviews and EE analysis
28 A firm may over time be able to manage down the costs of complying with a specific regulation (say, through a mechanism such as learning by doing so that the altered processes are increasingly absorbed into the costs of business as usual). This would

Executive Summary
www.europe-economics.com ix
imply that older regulation would be less prominent in any estimate of the recurring costs of a business.
29 This may have heightened the relative significance of the Selected Directives in the context of the overall changing landscape in financial services regulation (see also Table 5.1, in Section 5) — however, we do not believe that this effect would alter the basic conclusion that the Selected Directives represent some of the most prominent drivers of cost in recent times.
Table 5: Median ongoing costs of the Selected Directives (expressed as a percentage of 2007 operating expenses)
Banks & Financial
conglomerates Asset ManagersInvestment
BanksFinancial Markets
Prospectus 0.00% 0.00% 0.00% 0.00%FCD 0.00% 0.00% 0.00% 0.00%CRD 0.19% 0.00% 0.18% 0.00%Transparency 0.00% 0.01% 0.01% 0.00%MiFID 0.11% 0.07% 0.17% 0.14%3AMLD 0.09% 0.07% 0.08% 0.00%Total 0.39% 0.15% 0.45% 0.14%
Source: Interviews and EE analysis
30 There is little difference between the mean and median results in respect of banks and financial conglomerates. This is also the category with the largest number of results. On the other hand, it is worth noting that the asset manager means are heavily influenced by a few large firms that have experienced relatively high ongoing compliance costs. In addition, the means with regards to the financial markets is heavily influenced by the experience of a specific firm in that sector. The median is likely to be more indicative of the recurring impact on the participants’ businesses. As is apparent from Table 1, the sample achieved in this area was particularly small.
31 Further breakdowns of the ongoing incremental costs by firm size and by geographical location are provided in Section 5. These are presented both relative to operating expenses and as an average absolute value (in €’s) per firm. In addition, we analyse the drivers of these cost changes — the key drivers being increased staffing, ongoing IT spending and a heightened level of regulatory reporting.
32 These costs do not include the intangible costs associated with implementing change, such as the impact of the distraction of senior management away from the running the business and (even more subjectively) a less entrepreneurial culture (i.e. “safety first”, where legal and compliance officers are consulted before taking any action).
Synergies between the measures
33 In general, the study participants had not been able to achieve much, if any, cost synergy between the Selected Directives. The variation in the implementation dates was the most

Executive Summary
www.europe-economics.com x
frequently cited factor behind this. Another component to this problem was that firms felt that the detail necessary to properly prepare for IT changes (the most significant cost component) was not always forthcoming from the implementing authorities in a sufficiently timely manner.
34 Firms expressed some frustration here: if they had known at the outset what they knew now (i.e. at the end of the process), then it might have been possible to combine some of the requirements across different measures in order to save expense.
Gold-plating
35 We have not attempted to discretely quantify the impact of gold-plating within the data that we have gathered. As we note in Appendix 2, there is no uniformly accepted definition of what gold-plating is, either in theory or in practice. That said, a number of participants in our study did identify examples of what they, at least, considered to be examples of gold-plating in the implementation of the Selected Directives. It was evident that the majority of the participants who cited such examples considered these to be a source of additional cost (or at least missed opportunities to save cost). The instances of gold-plating reporting to us largely related to MiFID, the 3AMLD and the CRDs.
36 However, a more stringent approach by regulators was not seen as necessarily problematic in itself. For instance, the thought was proposed that, if anything, customers (or at least those customers willing and able to transfer business across national boundaries) appreciate a business operating in a tougher regulatory environment. Equally, other participants felt that a practical, day-to-day approach by the regulator towards guidance to firms typically compensated for an over-stringent implementation.
37 On the other hand, some participants were less concerned about gold-plating in their own Member State than a low level of (effective) implementation elsewhere. It was felt that this could result in an unlevel playing field.
The impact of minimum harmonisation
38 We considered the ongoing and one-off incremental costs of complying with the Transparency Directive for the asset managers surveyed, comparing the results for transnational asset managers with those that largely operate in just one Member State. The results were notably different. The latter consistently had a lower cost of compliance with the Transparency Directive. This analysis is summarised at Box 4.1, in Section 4.
39 The differentiated implementation across the EU27 must have complicated the design and management of the IT projects required to meet the flagging requirements after aggregating holdings across all portfolios. These systems tend not to be fully automated so that an ongoing incremental cost exists also.
40 Although it is not possible to quantify how much of the additional cost impact experienced by transnational asset managers has been driven by a minimum rather than maximum harmonisation approach, it is clear that there has been some contribution to the level of

Executive Summary
www.europe-economics.com xi
cost experienced by transnational asset managers due to this effect. This point was directly confirmed to us by at least some of the affected participants.
Conclusions
41 Banks and investment banks have typically experienced higher costs of compliance with the Selected Directives than either asset managers or financial markets. However, this should be seen as a function of the Directives studied rather than a more general observation.
42 Implementation costs significantly exceed ongoing costs. This is largely a reflection of the natural tendency of firms to adapt IT infrastructure, processes and culture upfront, so that to the greatest extent possible, and as soon as possible, (given a particular firm’s circumstances) the recurring costs are absorbed into business as usual.
43 MiFID, the CRDs (for banks and investment banks) and the 3AMLD have been the most prominent drivers of cost amongst the Selected Directives. In particular, for those affected, MiFID and the CRDs have been identified by many participants in the study as being the most significant causes of regulatory-driven increased cost in recent times.

Introduction
www.europe-economics.com 1
1 INTRODUCTION
Background
1.1 This Report was commissioned by DG Internal Market to investigate the cost of compliance with key FSAP measures. In brief, these Directives (the Selected Directives) are as follows:
(a) The Prospectus Directive.
(b) The Financial Conglomerates Directive.
(c) The Capital Requirements Directives.
(d) The Transparency Directive.
(e) The Markets in Financial Instruments Directive (MiFID).
(f) The Third Anti-Money Laundering Directive (3AMLD).
1.2 We discuss the above (in brief, and with the focus upon likely cost impacts) in the next Section.
1.3 The focus of our work has been the quantification of the incremental cost impact of implementing the selected regulations. Our assessment reviews the cost impact across a business as a whole, rather than a narrower definition that would focus only on the impact upon the compliance function itself.
1.4 We have investigated this across the following four sectors of the financial services industry:
(a) Banks and financial conglomerates.
(b) Asset managers.
(c) Investment banks.
(d) Financial markets.
1.5 A bank in this context refers to a commercial bank that engages predominantly in banking activities such as accepting deposits and making loans, as well as other fee based services. As such this category includes retail banks, cooperative banks, mortgage banks, savings banks, and universal banks. A financial conglomerate is as set out in the Financial Conglomerates Directive.
1.6 An asset manager administers financial assets such as stocks and bonds for private, corporate, institutional or sovereign clients.

Introduction
www.europe-economics.com 2
1.7 An investment bank helps businesses raise money from other firms in the form of bonds (debt) or stock (equity). It acts as underwriter or agent and serves as an intermediary between an issuer of securities and investing institutions. Investment banks also advise corporate, institutional and sovereign clients on their acquisitions, disposals, capital raising, structuring and risk management.
1.8 Financial markets in this context could include stock exchanges and multilateral trading facilities (also known as alternative trading systems).
The Structure of the Report
1.9 The remainder of this report is structured as follows:
(a) A summary of the context for the study. In section 2, we define more fully what we mean by the incremental cost of compliance, discuss the selected FSAP measures, and describe the context of the participants in the study against the wider back-drop of the EU27 financial services industry.
(b) Section 3 considers the changing role of the compliance function in the financial services sector.
(c) Sections 4 and 5 provide our analysis of the one-off and ongoing costs of the Selected Directives.
1.10 Appendix 1 describes the methodology adopted in the study.
1.11 Appendix 2 summarises the observations made to us by study participants on the nature and scope of gold-plating of the Selected Directives.
1.12 Appendix 3 includes additional analysis of the study results. This analysis further sub-divides the sample — however, as a corollary of this, the number of underlying data points becomes rather small and this analysis is inevitably less robust than that incorporated into the main body of the report.

Context of the Study
www.europe-economics.com 3
2 CONTEXT OF THE STUDY
Introduction
2.1 In this Section, we:
– Define what we mean by the incremental cost of compliance.
– Introduce the Selected Directives.
– Describe the participants in the study.
Regulation in the Financial Services Sector
2.2 Despite the drawbacks of regulating any industry2 there is extensive regulation of financial services markets in the EU and elsewhere. This is because it is considered that the benefits of regulation outweigh the costs. That is mainly because there is considered to be the potential for significant market failures in unregulated financial markets.
2.3 Potential areas of market failure commonly analysed in financial markets include:
(a) Information asymmetry: the problem that firms may know more about their products than consumers and may have incentives to exploit their informational advantages to the detriment of consumers. Markets may have mechanisms to address these problems — for instance, if a firm exploits customers, it may be exposed and lose business. However, these market mechanisms may not always be effective on short-term scales. For example, in the long-term companies that do not exploit their customers may gain a good reputation. But a company that already has a good reputation may exploit that in the short-term, and while in the long-term that will lead to reputational damage, in the short-term it may benefit at the expense of its customers.
2 Regulation of any industry generates direct and indirect costs of compliance. It also creates risks of: • Regulatory capture and rent seeking: companies or other vested interested may seek to capture the regulatory process and
use it to obtain advantage over rivals with less privileged access. • Undermining of market punishments (which may be more credible and effective than the regulation).

Context of the Study
www.europe-economics.com 4
(b) Many financial products are highly complex, and their value cannot easily be observed by consumers. This gives rise to problems of the value of information — one cannot, by definition, know precisely how much information is worth until one knows what it is. This may mean that proper markets for information are difficult to sustain. Hence instead of direct information consumers may rely on the reputation of a financial firm, in general, for the quality of its products. However, some financial services products are experienced only once (e.g. pensions), sometimes long after purchase (and even then consumers may rely on experts to tell them how much products are worth — such products are known as “credence” goods). Hence disciplining mechanisms that rely on reputational risk may be weak.
(c) Incentive mismatch. The managers of depository institutions have limited liability (so that even bankruptcy is a limited form of punishment). Therefore incentives exist to engage in risky activities that might return high rewards but also might lead to large losses — or alternatively to engage in many different very risky activities, each of which has only a relatively small chance of success. Such managers need to be monitored by depositors. However, many depositors are small (in fact a major function of banks is to collect relatively small deposits to use for relatively larger loans) so each depositor faces incentives to free-ride on the monitoring of other depositors. Hence markets may under-monitor banks to the detriment of some depositors, so that it is argued that there is a need for private or public “representatives” of depositors. This necessitates regulation.3
(d) Externalities: failure by one firm might harm not only its depositors, but also other firms by affecting the confidence of investors more widely. For example, because banks operate on the basis of fractional reserves, bank runs can occur on sound institutions and can sometimes cause the failure of banks that remain solvent (but have an insufficiently liquid asset base). Mis-selling also generates externalities: the fact that mis-selling occurs at one firm — or a group of firms — can lead to a lack of consumer confidence in the market as a whole.
The Costs of Compliance
2.4 Although arguments such as those set out above provide a rationale for regulation, they do not, by themselves, provide a sufficient justification for regulation. This is for two reasons. First, not just any regulation will address the issues raised above so as to generate benefits. This is an important point but will not detain us further here. The second is that regulation induces costs as well as benefits.
2.5 The drivers of the incremental compliance costs of financial regulation are largely associated with firms having to address the challenges of ensuring the following:
3 This is the famous Dewatripont and Tirole “representation hypothesis”. See Dewatripont, M. and Tirole, J. The prudential regulation of banks.

Context of the Study
www.europe-economics.com 5
(a) Any change or increase of regulations — forms, accounts to report, plans to submit, training required, etc — that firms now had to comply with. This would include that they are demonstrating their compliance with the relevant regulatory requirements; that they are embedding compliance within their organisation; that they are managing the costs of compliance; and that they are identifying and resolving regulatory failures to a greater extent than would have been the case in the absence of those regulations.
(b) Any changes in the quality of the compliance expected or recorded by local regulators. The higher the expected compliance quality, the higher the cost.
(c) A change in perception by firms as to the effectiveness of the monitoring of compliance — due to the effect of the FSAP as a body, say — so that firms are more wary of falling short of what is expected of them in terms of compliance and of being subsequently detected. Closely linked to this is the possibility that firms perceive the penalty for non-compliance with the FSAP regulations as being greater than that faced under the previous regulatory regime.
2.6 In a globalised industry such as financial services, the regulations driving compliance include those regulations that are imposed at the EU level (e.g. FSAP requirements) and those imposed at the international level (e.g. Sarbanes Oxley and Basel II requirements).
2.7 The determination of the degree of incremental compliance costs that firms may incur is through the interplay of these key drivers described above together with factors such as:
(a) The size of the firm — evidence suggests that smaller firms are likely to face proportionately higher incremental costs than are larger firms. This would be consistent with some incremental costs, such as those of firm registration and approved persons, being fixed (i.e. not directly linked to output).4
(b) The global approach the firm takes to regulation — incremental compliance costs may differ with respect to whether or not firms are regulated by one or more overseas regulator. For example, firms with global operations may also take a global approach to regulation in which they apply a common set of standards which incorporate all the necessary local regulatory requirements.
4 Europe Economics (2003), “The Costs of Compliance”.

Context of the Study
www.europe-economics.com 6
2.8 Among the obvious categories of additional expenditures that might constitute incremental compliance costs are (this is not an exhaustive list):
(a) Additional training costs. Many of the Selected Directives require or imply staff training (for instance, the Third Anti-Money Laundering Directive);
(b) Additional administrative costs. For instance, the data storage requirements of MiFID may be a source of added cost burden as the Directive mandates that firms must store tick data. Similarly, the Capital Requirements Directives may have substantial ongoing incremental costs in relation to extra employee time required in order to follow the procedures set out within it.
(c) Additional systems costs.
(d) Restructuring costs.
(e) Capital costs. These might be in terms of changed solvency margins or financial guarantees levels (as an aside, such changes could give rise to a negative cost of compliance in the case of the minimum capital requirement of a firm reducing).
(f) Additional consultancy and legal advice costs.
2.9 A distinction should be made between compliance costs that are of a one-off nature (i.e. those costs that only have to be incurred once in making the transition, for example changes to IT systems required for compliance under the new regulation) and those which are continuous as a result of regulation (i.e. those compliance costs that will be incurred on an ongoing basis, for example, written communication with customers).
The cost of the compliance department versus the costs of complying with regulation
2.10 When asked about the costs of complying with regulation it is natural to consider only costs incurred directly by the compliance department. However, simply taking the sum of such costs would not capture properly the costs of complying with regulation:
(a) Firms may adjust their businesses in many indirect ways in response to regulation. Costs arising include profits foregone on products never launched, markets never entered, and re-structuring of the company in response to regulation. Similarly, there are costs arising from firms exiting a market due to new regulations.

Context of the Study
www.europe-economics.com 7
(b) Firms would do many of the things that regulation obliges them to do, even in the absence of regulation. For example, firms would monitor sales staff even in the absence of regulation, if only to calculate their commissions. The nature and degree of monitoring might be different in the absence of regulation (for example, the self-selected intensity of monitoring might be higher or lower than the regulator-imposed intensity), but the fact of monitoring is not, typically, the result of regulation.
(c) Firms might have to do additional things in the absence of regulation. For example, in the UK being FSA regulated gives firms a “badge” they may be able to use to reassure customers of the quality of their internal procedures. In the absence of regulation firms might have to engage in additional expenditure on quality systems or brand positioning advertising to sustain the same portfolio of products. Another example is that in the absence of financial regulation capital markets may require firms to hold additional capital.
2.11 There is also the question of the “quality-adjusted compliance cost”. The firms affected by the FSAP vary greatly in their business lines, practice, and characteristics. A key finding of the Europe Economics’ study on the cost of compliance for the FSA was that firms may adopt different compliance strategies, which may lead to different quality-cost combinations.5
2.12 Complying with such regulation may be very cheap for those firms competing at the high quality/expensive end of the market, for their business strategy means that they comply automatically. On the other hand, firms competing at the low quality/cheap end of the market may find it relatively expensive to comply with regulation, but in many cases that will be because the regulation has its intended effect — making firms which would offer “too low” a quality of service raise their quality. Such firms may respond by raising their quality to the absolute minimum required, meeting the exact letter of the regulations while changing their market niche as little as possible (a form of “negative compliance”) or they could abandon the cheap-but-low-quality niche of the market — thereby reducing compliance costs.
2.13 It is debatable whether compliance costs exceeding the minimum required level due to different compliance strategies should be fully considered or discounted. We have adopted the former approach, so that the costs recorded fully reflect the experience of the firms participating in the study.
5 For instance, firms targeting the upper-end of the market may wish to increase their reputation by putting much more effort into compliance than required, while firms targeting the lower-end (price-sensitive segment) may only wish to ensure the minimum level of compliance required.

Context of the Study
www.europe-economics.com 8
Incremental compliance costs
2.14 For the purposes of this study, we are interested in what are known as “incremental compliance costs”. The notion of incremental compliance costs is set out in Alfon and Andrews (1999) as follows:6
“Compliance costs are the costs to firms and individuals of those activities required by regulators that would not have been undertaken in the absence of regulation. Thus the term ‘compliance costs’ as used here refers to the incremental costs of compliance caused by regulation, not to the total cost of activities that happen to contribute to regulatory compliance. Examples of compliance costs include the costs of any additional systems, training, management time and capital required by the regulator.”
2.15 As Alfon and Andrews explain, a crucial requirement in estimating incremental compliance costs is forming a judgement about how the world would look in the absence of regulation — what firms would do, how the market would evolve, and so on.
“One of the features of incremental compliance costs is that they depend on views about the activities that would be undertaken in the absence of regulation. Changes made on the introduction of regulations are not necessarily a wholly reliable guide to this because regulated firms often use the opportunity provided by a consultation on regulatory proposals to review procedures in broad business areas. Moreover, even for an individual regulatory measure, it is unlikely that only a single view about its incremental impacts would exist because many firms, competing in service characteristics, may be affected in different ways by the measure.”
2.16 Thus when assessing the costs of policy it is important to define a baseline (a “counterfactual”) against which to make comparisons. This counterfactual is normally the situation that would be expected to pertain had the regulation not been implemented. The challenge it presents is that the path financial services markets would have taken in the absence of regulation is inherently unobservable.
The counterfactual
2.17 In response to the anticipated challenge of the hypothetical nature of such a counterfactual, we adopted the following approach:
(a) We identified a sample of relevant firms that we expected to have been affected by the regulatory changes of interest in various different ways.
(b) We asked those firms to tell us their latest operating costs.
6 Alfon, I., and Andrews, P., 1999, “Cost-benefit analysis in financial regulation — how to do it and how it adds value”, FSA Occasional Paper Series 3.

Context of the Study
www.europe-economics.com 9
(c) To develop the counterfactual, we asked firms to tell us what their operating costs were in 1998, and to consider a number of factors that might have caused their operating costs to change, even in the absence of regulation, including developments in the firm’s place in the market, including mergers and organic sales growth; developments in the complexity and risk of products; developments in information technology and product design (“financial technology”); inflation (including wage inflation); and others.
2.18 Reflecting upon the impacts of these other effects, we asked the firms to consider to what extent the changes in their operating costs were the result of the relevant regulations.
2.19 However, we also had to be flexible in our approach — where the participating firms had not existed in 1998 (or, else, had changed radically since that date due to, say, restructuring or acquisition activity), we adapted our approach to focus more directly upon the cost impacts of changing financial services regulation itself. With regards to one-off costs (particularly where a change to the company’s IT architecture was envisaged) there was often an implementation budget that served as a starting point for the consideration of the cost impact involved. By contrast, the objective in most firms is to absorb recurring costs into the cost of “business as usual” as rapidly as possible. A natural corollary of this that a separate identification of the ongoing cost impact from the “noise” of the firm’s running costs was more difficult.
Gross or net costs
2.20 As noted above, we recognised at the outset that collecting the data necessary to analyse the costs of compliance would represent a significant challenge to participating companies. To estimate these costs net of any associated tax impact would be an additional complication too far. For instance, for a business operating across a number of tax jurisdictions it would require consideration of the effective tax rate applicable to the costs incurred. This might well be very different from the effective rate applicable to the group as a whole, and so necessitate a separate calculation.
2.21 This said, we recognise that an alternate presentation would be of costs net of tax (i.e. approximating more closely to net cash flow), which would of course result in lower cost figures than those presented in this report.
Long-term ongoing costs
2.22 It is important to recognise that any change in regulation would be expected to increase incremental compliance costs until firms have adjusted their portfolios and behaviour to be optimal given the new regulation. The questionnaire asked firms to consider how their costs would differ, in the absence of change in financial services regulation, if they were sustaining their present portfolio of products. But before revised regulation has become fully reflected in product portfolios (i.e. before firms have adjusted their portfolios to reflect the higher compliance costs of products and practices the regulation is attempting to discourage), firms are experiencing the incremental costs of regulation but not all of its

Context of the Study
www.europe-economics.com 10
benefits (such as increased consumer confidence or the ability to sell a different portfolio of products).
2.23 If the intention of regulation is to prevent detriment to one group, regardless of whether (in the absence of regulation) the gains to other groups might outweigh losses, then there will be positive incremental compliance costs under well-designed regulation. But for some regulations the aim will be to promote the existence of a market in a product that would be prohibitively expensive to supply in the absence of regulation (e.g. a product subject to considerable adverse selection or moral hazard problems). In such cases the regulation makes it cheaper to supply those products, and the incremental costs of regulation, based on a portfolio of the post facto products, will be negative. But an incremental cost calculation based on the pre-regulation product portfolio, shortly after the regulation is introduced (as has been the basis of the current study), will naturally (and properly — for it would be the intention of the regulation) show non-trivial positive incremental compliance costs.
2.24 Hence those aspects of regulation firms believe impose the greatest incremental costs should be expected to be recent, with older, fully incorporated regulations being less significant. One would expect this, not merely because of the difficulty firms may have in considering the effects of older regulations, but because well-directed older regulations should generate lower incremental compliance costs, other things being equal. Likewise, it may be the intention of new regulation to generate additional incremental compliance costs for certain pre-regulatory portfolios and practices. The proper response of firms is to change their portfolios and practices accordingly.
2.25 Once portfolios have adjusted, the incremental costs of regulation for sustaining that new portfolio should, if the regulation is well-directed, be low (or even negative). Thus incremental costs of very recent legislation can give a misleading account of the longer-term burden of that regulation.
The Financial Services Action Plan and the Selected Directives
2.26 The 42 measures of the Financial Services Action Plan (FSAP), commencing from December 1998, were intended to create a legal and regulatory environment supporting the integration of EU financial markets. Some FSAP measures take the form of EC Regulations, which apply directly in all Member States. Most take the form of EC Directives, which have to be transposed into the law of each Member State. Of these, some replace earlier Directives (e.g. on investment services), which were out-of-date. Others recast earlier proposals (e.g. on takeover bids). Some of the FSAP measures (e.g. on mutual funds) were already under negotiation when the FSAP was launched; others added subsequently.
2.27 Some particularly important FSAP measures were as follows.

Context of the Study
www.europe-economics.com 11
Prospectus Directive (Directive 2003/71/EC on "the prospectus to be published when securities are offered to the public or admitted to trading")
2.28 The Prospectus Directive requires issuers of securities in the EU to provide a prospectus containing certain information about the issuer. The Directive identifies two broad areas where a prospectus is required:
(a) When an offer of securities is made to the public; and
(b) When securities are admitted to trading on a regulated market.
2.29 As a means of increasing the level of investor protection, the Directive requires that any prospectus must comply with specified disclosure standards and that all prospectuses produced must be approved by a competent authority.
2.30 The Directive also provides a “passport” for issuers. This passport permits them to raise capital across the EU on the basis of a single prospectus. Thus, once the prospectus is approved by the competent authority in one Member State, it will then be accepted elsewhere in the EU without the need of additional approval from other Member State authorities.
Implementation timeframe of Directive
2.31 The Directive entered into force on 31 December 2003 and the deadline for transposition into the national law in Member States was 1 July 2005. According to the latest Commission’s update on the state of play (as of September 2008) on the transposition of the Directives, notification has now been received and checked for all Member States.
Financial Conglomerates Directive (Directive 2002/87/EC "on the supplementary supervision of credit institutions, insurance undertakings and investment firms in a financial conglomerate")
2.32 The Directive seeks to establish the supplementary supervision of regulated entities that form part of a conglomerate. To this end, the Directive focuses upon:
(a) The potential risks of contagion, risk concentrations and management complexity; and
(b) “Group risks”.
2.33 This Directive seeks to deal with these by:
(a) Imposing the requirement that financial conglomerates have sufficient capital to met a binding adequacy test and providing a method by which to calculate capital adequacy requirements for financial conglomerates to eliminate, for example, the scope for double counting capital and excessive leveraging; and
(b) Requiring that groups have the relevant systems and controls in place to monitor intra-group exposures and risks concentrations across sectors.

Context of the Study
www.europe-economics.com 12
Implementation timeframe of Directive
2.34 This Directive came into force on 20 November 2002 and the deadline for the transposition into national legislation was 11 August 2004. According to the Commission’s update on the state of play (as of September 2008) on the transposition of this Directive, notification has been received and checked for all Member States.
The Capital Requirements Directives (Directive 2006/48/EC relating to the taking up and pursuit of the business of credit institutions and Directive 2006/49/EC on the capital adequacy of investment firms and credit institutions)
2.35 These Directives updated European legislation (technically, by recasting two existing Directives; the Banking Consolidation Directive and the Capital Adequacy Directive) and introduce a new supervisory framework in line with the international Basel II rules on capital measurement and capital standards. The Directives apply to all credit institutions and certain investment institutions.
2.36 The objectives underlying Basel II are to enhance the level of consumer protection by limiting the possibility of consumer loss or market disruption that may arise as a consequence of prudential failure. The Directives aim to achieve this by striving to ensure that the financial resources held by a firm are commensurate to the risks they face (i.e. those risks associated with the external and internal profile of the business environment).
2.37 On 1 October 2008, the Commission published proposals to amend the Capital Requirements Directives. These amendments are, according to the Commission, designed to “reinforce the stability of the financial system, reduce risk exposure and improve supervision of banks that operate in more than one EU country. Under the new rules, banks will be restricted in lending beyond a certain limit to any one party, while national supervisory authorities will have a better overview of the activities of cross-border banking groups.”
Implementation timeframe of Directive
2.38 This Directive came into force on 14 June 2006 and the deadline for national implementation was the 31 December 2006. Until this date, credit institutions and investment firms (as defined by MiFID) were able to choose between the ‘Basel 1’ approach and the simple or medium sophisticated approaches under the new framework. According to the Commission’s update on the state of play (as of September 2008) on the transposition of Directive 2006/48/EC, all but one Member State had provided the Commission with notification which had been checked by the Commission. The remaining Member State had only partially notified the Commission. For Directive 2006/49/EC, the picture was broadly similar but there were two remaining Member States which had only partially notified the Commission.

Context of the Study
www.europe-economics.com 13
Transparency Directive (Directive 2004/109/EC on "the harmonisation of transparency requirements in relation to information about issuers whose securities are admitted to trading on a regulated market”)
2.39 This Directive aims to increase the level of transparency on EU capital markets. It seeks to achieve this by establishing rules for the disclosure of periodic financial reports and of major shareholdings of those companies whose securities are admitted to trading on an EU regulated market.
2.40 The Directive’s key objectives are:
(a) To improve annual financial reporting by issuers of securities by imposing the disclosure of an annual report within shorter deadlines and also to increase the disclosure of periodical financial information through a mix of quarterly and half yearly reports; and
(b) More frequent disclosure of changes to major shareholdings within a framework of stricter deadlines on disclosure.
Implementation timeframe of Directive
2.41 The Directive entered into force on 15 December 2004 and the deadline for implementation into the national law of Members States was 20 January 2007. According to the Commission’s update on the state of play (as of September 2008) on the transposition of the Directives, notification had been received and checked by the Commission with respect to most Member States. However, one Member State had yet to submit a notification to the Commission and another three had only partially notified the Commission.
Markets in Financial Instruments Directive (Directive 2004/39/EC on "markets in financial instruments")
2.42 This Directive was introduced to replace and expand the Investment Services Directive (ISD). It does this, partly by widening the scope of ISD, for example, by increasing the number of ‘core’ investment services and activities firms can passport and establishing competition among different order–execution systems (such as regulated markets, Multilateral Trading Facilities (MTF) and systematic internalisation) and partly by establishing the legal framework under which these operations will be carried out. The Directive will apply to all firms subject to the ISD including some that are currently not.
Implementation timeframe of Directive
2.43 This Directive came into force as European legislation on 30 April 2004 and the initial deadline for transposition was 30 April 2006 but was pushed back by the Commission to 31 January 2007. The deadline for technical implementation by firms was 1 November 2007. According to the Commission’s update on the state of play (as of September
Context of the Study
www.europe-economics.com 14
2008) on the transposition of this Directive, the Commission has received (at least partial) notification from all Member States.
The Third Anti-Money-Laundering Directive (Directive 2005/60/EC "on the prevention of the use of the financial system for the purpose of money laundering and terrorist financing")
2.44 This Directive was not part of the FSAP (the Second Anti-Money Laundering Directive was). However, since this directive repealed the previous directives, it is the 3AMLD that is relevant for the current study.
2.45 The aim of the Third Anti-Money-Laundering Directive is to update European Legislation to bring it in line with international recommendations (namely the internationally agreed Financial Action Task force recommendations) on anti-money laundering and counter terrorist financing measures. By doing this, the Directive takes account of new risks (e.g. including terrorist financing in the scope of the Directive) and vulnerable sectors (e.g. banning credit institutions from entering into correspondent relationship with shell banks). Further provisions include:
(a) Identity checks must be carried out on customers opening accounts (i.e. accounts cannot be held anonymously);
(b) Checks must be applied to any transaction over €15,000;
(c) Stricter checks must be carried out on “politically exposed persons” (PEPs); and
(d) Penalties can be imposed for failure to report suspicious transactions to national financial institutions.
Implementation timeframe of Directive
2.46 This Directive was adopted in October 2005 and the deadline for implementation into national legislation by all EU Member States was 15 December 2007. The Commission’s latest update (September 2008) on the state of play reported that twenty Member States had sent notification which had been checked by the Commission. Partial notification had been received from three Member States whilst the remaining four Member States had yet to send notification. Where the 3AMLD had yet to be implemented, we asked participants to estimate its incremental impact.
2.47 Together, these measures are referred to in the remainder of this report as the “Selected Directives”.
The Participants in the Study
Introduction
2.48 We have reviewed the cost impact upon companies in the following sectors:

Context of the Study
www.europe-economics.com 15
(a) Banks and financial conglomerates.
(b) Asset managers.
(c) Investment banks.
(d) Financial markets.
2.49 It is difficult to compare the relative importance of the above sectors — for instance, employment directly in financial markets is at a very small scale, certainly in comparison to banks and financial conglomerates. This would not be a good proxy for their relative importance in the broader financial services industry. Similarly, the impact of the Selected Directives was not experienced evenly across all of the sectors of interest to us in this study.
2.50 Therefore, looking across a number of dimensions, we placed greatest weight upon “banks and financial conglomerates”, so that this sector constitutes about 50 per cent of the participating firms, while the remaining three sectors account for the other half between them.
2.51 The principal constraint in getting firms to participate in the study was a lack of resources on their part. Our study ran from January through to December 2008. The main body of interviews were conducted between May and November. This lack of resources may, in part, have been a result of current market conditions, resulting in more compliance and operational resources being deployed on other matters or even, in extreme cases, resulting in reductions in headcount.
Participating institutions
2.52 A list of these institutions, analysed by the category or categories for which they have been considered, is presented below.

Context of the Study
www.europe-economics.com 16
Table 2.1: Identities of the all participating institutions
Banks and financial conglomerates (interviewee location) 1 AIB Group (Ireland) 2 Akbank N.V. (Netherlands) 3 Anadolubank Nederland N.V. (Netherlands) 4 Banco Português de Negócios S. A. (Portugal) 5 Banco de Sabadell S.A. (Spain) 6 Banif Bank plc (Malta) 7 Bank of Valletta plc (Malta) 8 Banque d'Escompte (France) 9 BCEE (Luxembourg) 10 BNP Paribas SA (France) 11 BRFBank A/S (Denmark) 12 Caixa D’Estalvis de Tarragona (Spain) 13 CIB Bank Zrt. (Hungary) 14 Citibank Europe plc, organizacni slozka (Czech Republic) 15 Danske Bank (Denmark) 16 Deutsche Bank AG (Germany) 17 Dexia Banque Internationale á Luxembourg s.a. (Luxembourg) 18 Dresdner Bank AG, Dresner Kleinwort (Germany) 19 Duncan Lawrie Limited (UK) 20 EMPORIKI Bank of Greece SA (Greece) 21 Erste Bank Hungary Nyrt. (Hungary) 22 Forstædernes Bank A/S (Denmark) 23 HSH Nordbank AG (Germany) 24 HVB Banque Luxembourg (Luxembourg) 25 HypoVereinsbank AG (Germany) 26 Intesa SanPaolo SpA (Italy) 27 K&H Bank Rt. (Hungary) 28 Kaupthing Bank Sverige AB (Sweden) 29 Lloyds TSB Bank plc (UK) 30 Lombard Bank Malta plc. (Malta) 31 MKB Bank Zrt. (Hungary) 32 Nordea AB (Denmark) 33 OTP Bank plc (Hungary) 34 Ruffler Bank plc (UK) 35 Sampo Bank (part of Danske Group) (Finland) 36 Skandinaviska Enskilda Banken (SEB) AB (Sweden) 37 Société Generale SA (France) 38 Spar Nord Bank A/S (Denmark) 39 Standard Chartered Bank (UK)

Context of the Study
www.europe-economics.com 17
40 Swedbank AB (Sweden) 41 Unicredit S.p.a. (Italy) 42 Unicredit bank Czech Republic a.s.(Czech Republic) 43 Volksbank AG (Austria) 44 Volksbank Limited (Malta)
Asset managers (interviewee location)
1 Aletti Gestielle SGR (Italy) 2 Allianz Global Investors (Germany) 3 Aria Structured Investments S.à.r.l. (Luxembourg) 4 Banco Português de Negócios S.A. (Portugal) 5 Banif Investment Bank (Portugal) 6 Banque d'Escompte (France) 7 Biggeorge's NV Real-Estate Investment Fund Management Company Limited (Hungary) 8 BNP Paribas SA (France) 9 Budapest Fund Management Company (part of Budapest Bank) (Hungary) 10 CACEIS BL (Luxembourg) 11 Capital International Limited (UK) 12 Credit Suisse Asset Management (UK) 13 CSOB Asset Management, a.s. (Czech Republic) 14 Duncan Lawrie Limited (UK) 15 EMPORIKI Asset Management M.F.M.C.(Greece) 16 Erste Alapkezelo Zrt. (Hungary) 17 Evli Fund Management Company Ltd (Finland) 18 Fidelity Investments International (UK) 19 HypoVereinsbank AG (Germany) 20 Intesa SanPaolo SpA (Italy) 21 Investicni Spolecnost Ceske Sporitelny a.s. (Czech Republic) 22 JP Morgan Asset Management Limited (UK) 23 Kaupthing Bank Sverige AB (Sweden) 24 Natixis Global Asset Management (France) 25 Skandinaviska Enskilda Banken AB (Sweden) 26 Société Generale SA (France) 27 Swedbank AB (Sweden) 28 Unicredit S.p.a. (Italy)
Investment banks (interviewee location)
1 AIB Group (Ireland) 2 Banco Português de Negócios S.A. (Portugal) 3 Banco Finantia (Portugal) 4 Banco Itaú Europa SA (Portugal) 5 Banif Investment Bank (Portugal)

Context of the Study
www.europe-economics.com 18
6 BNP Paribas SA (France) 7 Dresdner Kleinwort Investment Bank (UK) 8 Evli Fund Management Company Ltd (Finland) 9 HypoVereinsbank AG (Germany) 10 Intesa SanPaolo SpA (Italy) 11 Kaupthing Bank Sverige AB (Sweden) 12 Natixis (France) 13 Skandinaviska Enskilda Banken AB (Sweden) 14 Société Generale SA (France) 15 Standard Chartered Bank (UK) 16 Swedbank AB (Sweden) 17 Unicredit S.p.a.(Italy) 18 Volksbank AG (Austria)
Financial markets (interviewee location)
1 Athens Stock Exchange (Greece) 2 Budapest Stock Exchange (Hungary) 3 Bulgarian Stock Exchange (Bulgaria) 4 Cyprus Stock Exchange (Cyprus) 5 London Metals Exchange (UK) 6 Luxembourg Stock Exchange (Luxembourg) 7 Malta Stock Exchange (Malta) 8 NASDAQ OMX (Sweden) 9 Prague Stock Exchange (Czech Republic)

Context of the Study
www.europe-economics.com 19
2.53 We set out below a map indicating where the above listed institutions are headquartered.
Figure 2.1: Map of participating institutions’ headquarter locations (a purple pin for Banks & financial conglomerates; blue for Asset managers; green for Investment banks and
yellow for Financial markets)
Source: Smartdraw, EE analysis
2.54 Given the overall resource constraints to which any study such as this is subject to, we are broadly satisfied with the geographical coverage achieved. That said, we recognise that firms based in some Member States (in particular, in Spain and Italy) are under-represented given the prominence of the financial services community in those countries.

Context of the Study
www.europe-economics.com 20
Banks and financial conglomerates
2.55 Approximately half of the banks and financial conglomerates that we interviewed (nineteen in total) were in the top 100 European banks (by total assets).7 The shaded area in the chart below shows the total assets of the top 100 European banks while the darker columns represent those firms interviewed for the study that are also in the top 100 banks in Europe. As can be seen, several of the organisations interviewed were in the top 20.
Figure 2.2: Top 100 European banks ranked by total assets
0
500
1,000
1,500
2,000
2,500
3,000
Tota
l Ass
ets
(€bn
)
Source: Banker’s Almanac, EE analysis
Asset managers
2.56 Just under half of the participating asset managers in our study (ten firms) are in Europe’s top 50 (by assets under management).8 The shaded area in the chart below shows the assets under management of the top 50 European asset managers while the darker columns represent the asset managers in our sample that are also in the top 50 in Europe.
7 Bankers Almanac. 8 Institutional Investor.

Context of the Study
www.europe-economics.com 21
Figure 2.3: Top 50 European asset managers ranked by assets under management
0
200
400
600
800
1,000
1,200
1,400
1,600
1,800
2,000
AU
M (€
bn)
Source: Institutional Investor, EE analysis
Investment banks
2.57 We constructed a ranking of the top 30 investment banks based on information on investment banks ranked by bonds, equities and merger and acquisition activity.9 Of these some were stand-alone investment banks but more than half were parts of universal banks. We interviewed eight of these 30, which represents close to half of the investment banks in our sample.
Financial markets
2.58 As can be seen from the list of participating firms, we have interviewed nine markets across the EU27. However, as is also clear from this list, the participating markets are geared towards those based in the New Member States. As such the results generated may not be representative guides to other, larger markets operating elsewhere (such as the London Stock Exchange, Deutsche Börse and Euronext, who are not represented).
Intra-sample categorisations
2.59 To assist in our analysis, we have categorised study participants as follows:
(a) By size. This has been based upon criteria specific to each sector to divide the sample between “large” and “small” firms.
9 Sourced from www.euroweek.com.

Context of the Study
www.europe-economics.com 22
(b) By geography. We have divided respondents into three categories, according to the location of the interviewee’s location. Where the firm is a subsidiary or a branch, this may, of course, differ from the location of the parent firm’s headquarter location. Equally, some participants provided information relating to their operations in several Member States. We have only counted the presence once, in a single Member State (that of the interviewee).
2.60 Our categories are as follows:
– “Northern”: this includes firms based in the UK, Ireland, Germany, Austria, Netherlands, Sweden, Finland and Denmark.
– “Southern”: this includes firms based in France, Spain, Italy, Greece, Portugal, and Luxembourg.
– “New Member States”: this includes firms based in Hungary, the Czech Republic, Bulgaria, Malta and Cyprus.
2.61 The “New Member States” category represents Member States who acceded part way through the FSAP. As such, we anticipated that the cost experience of the affected firms might vary — for instance, because these firms would have learnt from what has occurred elsewhere.
2.62 The split between the groupings “Northern” and “Southern” categories is more subjective. It is not based simply or exclusively on a line of latitude. Rather, it is based upon the views expressed by study participants as to the regulatory culture of the country in question (in which they had operations, even if not necessarily headquartered there).
2.63 In essence, “Northern” represents a regulatory culture that is more risk-based in approach, “Southern” less so. Whilst these categorisations broadly correspond with our prior expectations, in some instances the split was not clear cut. Therefore, it is of course possible that a different sample of firms in the study might have resulted in a different categorisation from the one presented here.
2.64 We wish to be very clear that this categorisation is certainly not intended as a statement of the superiority of one regulatory approach to another. In particular, we wish to emphasise the following:
(a) Any analysis at this level — given the size of the overall sample — should be seen as illustrative rather than as robustly representative.
(b) As noted above, some of the participating firms provided data that covered several Member States. It was not possible to disaggregate these costs and apportion them robustly across the three categories. This means that there will be some contamination across the different categories.

Context of the Study
www.europe-economics.com 23
(c) Our study is focused upon the cost of compliance. We have not considered the benefits of compliance (say in terms of risk management) or the impact of a specific approach by a supervisor to its regulated entities upon the business opportunities available to those entities or the ease of seizing them.
2.65 We remind the reader of these caveats by referring to “Northern” and “Southern” rather than to Northern and Southern.

The Compliance Function
www.europe-economics.com 24
3 THE COMPLIANCE FUNCTION
Introduction
3.1 As outlined in the preceding section, the objective of this study is to measure the cost impact of the Selected Directives. We reviewed this impact upon operating expenditure as a whole (i.e. payroll, IT costs, and so on) and Sections 4 and 5 set out our results in this respect.
3.2 Clearly, what we have not done is restrict our analysis to the cost impact upon the compliance function alone, in isolation from the remainder of the business in which it operates. However, we believe that some consideration of that compliance function is a useful preliminary in order to further assist in the contextualisation of the subsequent analysis.
The Role of Compliance
3.3 The fundamental interest of a compliance function is with ensuring that the business complies with existing external laws and regulations, and internally-defined policies and ethical standards.
3.4 The major areas of responsibility for compliance departments vary from firm to firm but are likely to include some or all of the following:
– Identifying and addressing the systemic and process changes implied by regulatory change.
– The development and ongoing oversight of systems and processes for the conduct of business.
– The monitoring of the business, its people and the transactions undertaken.
– The provision of advice.
– Identifying and investigating problems.
– AML/CTF (Anti-Money Laundering/Combating Terrorist Funding).
– Approval of marketing documentation.
– Reporting to the executive (and/or supervisory) board on the performance of the business in respect of compliance and the management of compliance risk.
3.5 The compliance function is generally seen as having an important role to play in the mitigation of reputational risk for the enterprise. Therefore, some compliance activity is likely to occur in the absence of regulation.
The Compliance Function
www.europe-economics.com 25
3.6 It should be noted that reputational risk is not universally seen as a risk category in its own right, but even if seen as a sub-set of other risk types, damage to a business’s reputation can have severe financial consequences. A compliance function’s role here would not (primarily) be in dealing with crisis management in the event of actual reputational damage, rather in the day-to-day actions of ensuring compliance with all necessary legislative or regulatory obligations that may fall upon the business. Indeed, at least one previous study has indicated that non-compliance with regulation and relevant legal obligations is seen as the most significant source of reputational risk.10
3.7 Naturally, there will be a trade-off between the cost of protecting a reputation and the potential for diminution in its value. Equally, it is not a necessity that any management of reputational risk is focused upon a firm’s compliance function. However, many compliance departments have or are seeking such a positive role for themselves (in contrast, say, to simply being cast as a regulatory necessity). In these cases, it is natural for there to be an evolution in focus towards a more proactive role, with heightened emphasis upon activities such as business monitoring and training. The compliance function’s role is supporting the conduct of business and putting it onto a sustainable footing.
3.8 The Selected Directives (in particular, MiFID) have played a role here. A significant number of interviewees felt that this had given the compliance function an opportunity to re-define itself in a positive way — even as a source of competitive advantage — whereas previously it had been seen as more of a “necessary evil” or an afterthought. A concrete example of this would be an increased focus upon (new) product quality due to the implementation of MiFID that allowed the compliance function to present itself in a more positive way to senior management.
The Drivers of Compliance Strategy and Resource Allocation
3.9 In our interviews, we discussed the drivers of individual firm’s compliance strategies and (separately) resource allocation in order to enable a ranking of relative importance. We set out below a ranking based upon the composite results of the participants interviewed (where a rank of one represents the most important category). It follows that in these charts closeness to the outer ring represents the greater relative importance of that driver or resource.
10 Economist Intelligence Unit (2005), “Reputation: Risk of risks”, an Economist Intelligence Unit White Paper sponsored by Ace, Cisco Systems, Deutsche Bank, IBM and KPMG. This surveyed 269 senior executives, of which 36 per cent were drawn from financial services sector companies.

The Compliance Function
www.europe-economics.com 26
Banks and financial conglomerates
Drivers of compliance strategy
3.10 We set out below the ranking for the drivers of compliance strategy derived from all participating banks and financial conglomerates.
Table 3.1: The drivers of compliance strategy in banks and financial conglomerates by firm size (where 1 = the most important)
All "Northern" "Southern" New
Adapting to/anticipating the selected Directives 1 1 4 1
Adapting to other national regulatory changes 2 2 2 2
Culture of the national regulator 3 2 1 3
Perceived threat of regulatory sanctions 4 6 3 4
Industry best practice 5 5 5 6
Improving quality of service 6 4 6 9
Non-EU regulation 7 7 11 5
Adapting to/anticipating other FSAP Directives 8 10 7 7
Adapting to/anticipating EU requirements outside FSAP 9 9 8 9
Disciplinary action against other firms 10 8 10 11
Technological change 11 11 9 8

The Compliance Function
www.europe-economics.com 27
13579
11
Adapting to/anticipating theselected Directives
Adapting to other nationalregulatory changes
Culture of the national regulator
Perceived threat of regulatorysanctions
Industry best practice
Improving quality of serviceNon-EU regulation
Adapting to/anticipating otherFSAP Directives
Adapting to/anticipating EUrequirements outside FSAP
Disciplinary action against otherfirms
Technological change
Small Large
Source: Interviews and EE analysis. For this purpose, a “large” bank has in excess of €500 m in operating expenses.
3.11 We have already noted that the compliance function is widely seen as having a role to play in the mitigation of reputational risk and, as such, it is likely that some compliance activity would occur even in the absence of regulation. The relative significance of the various drivers above is consistent with the thought that the level of regulation is somewhat beyond this point. In fact, seventy per cent of participating banks and financial conglomerates who expressed a view ranked adapting to or anticipating regulatory change (regardless of the source) as the most important driver of strategy. Our findings indicate that there is not a significant variation between large and small firms in this respect. We now turn to the influence of geographical location.

The Compliance Function
www.europe-economics.com 28
Table 3.2: The drivers of compliance strategy in banks and financial conglomerates by geographical location (where 1 = the most important)
All "Northern" "Southern" New
Adapting to/anticipating the selected Directives 1 1 4 1
Adapting to other national regulatory changes 2 2 2 2
Culture of the national regulator 3 2 1 3
Perceived threat of regulatory sanctions 4 6 3 4
Industry best practice 5 5 5 6
Improving quality of service 6 4 6 9
Non-EU regulation 7 7 11 5
Adapting to/anticipating other FSAP Directives 8 10 7 7
Adapting to/anticipating EU requirements outside FSAP 9 9 8 9
Disciplinary action against other firms 10 8 10 11
Technological change 11 11 9 8

The Compliance Function
www.europe-economics.com 29
13579
11
Adapting to/anticipating theselected Directives
Adapting to other nationalregulatory changes
Culture of the nationalregulator
Perceived threat of regulatorysanctions
Industry best practice
Improving quality of serviceNon-EU regulation
Adapting to/anticipating otherFSAP Directives
Adapting to/anticipating EUrequirements outside FSAP
Disciplinary action againstother firms
Technological change
"Northern" "Southern" New
Source: Interviews and EE analysis. “Northern” Member States covered include UK, Ireland, Germany, Austria, Netherlands, Sweden, Finland and Denmark. “Southern” Member States covered include France, Spain, Italy, Greece, Portugal, and Luxembourg. New Member States include Hungary, the Czech Republic, Bulgaria, Malta and Cyprus.
3.12 Almost four out of five of the participating banks identified adapting to or anticipating some form of regulatory change as the prime mover of their compliance strategy. Of these, just under half signalled adapting to or anticipating the Selected Directives as the most important driver. This was most marked in “Northern” Member States, where over half considered the Selected Directives to be the primary driver of compliance strategy. By contrast, none of the banks headquartered in “Southern” Member States highlighted the Selected Directives as being the primary driver — albeit that this was still important. That said, as Table 3.3 illustrates, implementing and influencing regulatory change is prominent, but not the most prominent, amongst the tasks to which the resources of the compliance function are allocated.
3.13 It is also noted that a relatively high weight is given to the perceived threat of regulatory sanction in the “Southern” region, whereas improving quality of service and best practice are ranked more highly in study participants from the “Northern” Member States. This would be consistent with a view of compliance being capable of playing (or at least aspiring to play) a more positive role within the latter.
Resource allocation
3.14 Compliance is often intimately associated with the management of a firm’s reputational risk profile. Practitioners often incorporate a risk-based approach whereby different products or business activities are assessed in terms of risk (reputational and/or

The Compliance Function
www.europe-economics.com 30
pecuniary, calculated on a product by product or customer by customer basis) and resources are allocated accordingly. However, the choice made by other firms may be for a comprehensive approach.
3.15 The allocation of resources differs across the compliance functions of the firms participating in our study. We set out below a ranking based upon the composite study results.
Table 3.3: Resource allocation within the compliance function of banks and financial conglomerates by firm size (where 1 = the most important)
All Small Large
Money laundering responsibilities 1 1 1
Implementing and influencing regulatory change 2 2 2
Internal monitoring of business 3 3 3
Providing advice 4 4 3
Internal reporting 5 5 8
Product/business developments 6 8 5
External reporting 7 7 7
Remedial action 8 6 10
Special projects or reviews 9 9 8
Training 9 10 6

The Compliance Function
www.europe-economics.com 31
1
3
5
7
9
11
Money launderingresponsibilities
Implementing and influencingregulatory change
Internal monitoring of business
Providing advice
Internal reporting
Product/business developments
External reporting
Remedial action
Special projects or reviews
Training
Small Large
1
3
5
7
9
11
Money laundering responsibilities
Implementing and influencingregulatory change
Internal monitoring of business
Providing advice
Internal reporting
Product/business developments
External reporting
Remedial action
Special projects or reviews
Training
"Northern" "Southern" New
Source: Interviews and EE analysis. “Northern” Member States covered include UK, Ireland, Germany, Austria, Netherlands, Sweden, Finland and Denmark. “Southern” Member States covered include France, Spain, Italy, Greece, Portugal, and Luxembourg. New Member States include Hungary, the Czech Republic, Bulgaria, Malta and Cyprus.
3.16 The particular emphasis upon money-laundering within banks and financial conglomerates is a function of its importance in a bank’s operating model and the (potentially) resource-hungry nature of it.

The Compliance Function
www.europe-economics.com 32
3.17 The increased emphasis in larger firms on product/business development and training is (marginally) suggestive of a more proactive role for the compliance function rather than a reactive approach compared to smaller firms.
3.18 It is also noted that, in terms of geographical location, our findings indicate that the differences in resource allocation are relatively insignificant.
3.19 It was widely felt by interviewees that the resources dedicated to monitoring and to external reporting (driven by regulatory reporting) are likely to increase in the foreseeable future.
Product development
3.20 Leading practice has made the compliance function a key element within strategy formulation, with involvement at all stages of a product’s life cycle, including the initial design stage. This is frequently formalised into a new product protocol that requires the literal sign-off from either the Head of Compliance or the local compliance function representative (in a bank operating across various supervisory regimes, the latter is naturally likely to have better insight into local regulatory requirements).
3.21 This, of course, results in an in-built incentive to involve representatives of the compliance function early in the development process of a new product or service. Without such involvement, there would be an increased risk of wasted time and effort in developing something which required substantial re-engineering to make compliant at a later date.
Asset managers
Drivers of compliance strategy
3.22 We set out below the ranking for the drivers of compliance strategy derived from all participating asset managers.

The Compliance Function
www.europe-economics.com 33
Table 3.4: The drivers of compliance strategy in asset managers by firm size (where 1 = the most important)
All Small Large
Adapting to/anticipating the selected Directives 1 1 2
Adapting to other national regulatory changes 2 4 1
Culture of the national regulator 3 2 3
Perceived threat of regulatory sanctions 4 2 4
Improving quality of service 5 6 4
Industry best practice 6 5 6
Disciplinary action against other firms 7 7 7
Adapting to/anticipating EU requirements outside FSAP 8 7 10
Non-EU regulation 9 9 9
Technological change 10 11 7
Adapting to/anticipating other FSAP Directives 11 10 11
1
3
5
7
9
11
Adapting to/anticipating theselected Directives
Adapting to other nationalregulatory changes
Culture of the national regulator
Perceived threat of regulatory sanctions
Improving quality of service
Industry best practiceDisciplinary action against
other firms
Adapting to/anticipating EUrequirements outside FSAP
Non-EU regulation
Technological change
Adapting to/anticipating otherFSAP Directives
Small Large
Source: Interviews and EE analysis. For this purpose, a “large” asset manager has in excess of €150 m in operating expenses.

The Compliance Function
www.europe-economics.com 34
3.23 We note that an affirmative objective (improving quality of service) is more prominent in the large asset managers, whereas a reactive one (the perceived threat of sanctions) is more prominent in smaller ones — however, the differences are relatively minor.
Table 3.5: The drivers of compliance strategy in asset managers by geographical location (where 1 = the most important)
All "Northern" "Southern" New
Adapting to/anticipating the Selected Directives 1 1 1 1
Adapting to other national regulatory changes 2 2 2 7
Culture of the national regulator 3 4 3 2
Perceived threat of regulatory sanctions 4 3 4 3
Improving quality of service 5 5 6 6
Industry best practice 6 6 4 8
Disciplinary action against other firms 7 10 7 3
Adapting to/anticipating EU requirements outside FSAP 8 9 8 10
Non-EU regulation 9 8 11 3
Technological change 10 7 9 11
Adapting to/anticipating other FSAP Directives 11 11 10 9

The Compliance Function
www.europe-economics.com 35
1
3
5
7
9
11
Adapting to/anticipating theSelected Directives
Adapting to other nationalregulatory changes
Culture of the national regulator
Perceived threat of regulatory sanctions
Improving quality of service
Industry best practiceDisciplinary action against other
firms
Adapting to/anticipating EUrequirements outside FSAP
Non-EU regulation
Technological change
Adapting to/anticipating otherFSAP Directives
"Northern" "Southern" New
Source: Interviews and EE analysis. “Northern” Member States covered include UK, Ireland, Germany, Austria, Netherlands, Sweden, Finland and Denmark. “Southern” Member States covered include France, Spain, Italy, Greece, Portugal, and Luxembourg. New Member States include Hungary, the Czech Republic, Bulgaria, Malta and Cyprus.
3.24 Adapting to regulatory change has been a key driver of strategy — with particular reference to the Selected Directives. Matching good practice has been most prominent amongst the drivers of strategy in participating asset managers based in “Southern” Member States. Disciplinary action against other firms and the perceived threat of sanctions are notably more significant amongst the New Member State-based asset managers that participated in our study.
Resource allocation
3.25 We set out below the ranking for the resource allocation within the compliance function, derived from all participating asset managers.

The Compliance Function
www.europe-economics.com 36
Table 3.6: Resource allocation within compliance in asset managers by firm size (where 1 = the most important)
All Small Large
Implementing and influencing regulatory change 1 1 3
Internal monitoring of business 2 3 1
Providing advice 3 3 2
Money laundering responsibilities 4 2 7
Product/business developments 5 6 4
Internal reporting 6 9 5
External reporting 7 5 8
Training 8 10 6
Special projects or reviews 9 8 9
Remedial action 10 7 10
13579
11
Internal monitoring ofbusiness
Providing advice
Money launderingresponsibilities
Product/businessdevelopments
Internal reportingExternal reporting
Training
Special projects orreviews
Remedial action
Small Large
Source: Interviews and EE analysis. For this purpose, a “large” asset manager has in excess of €150m in operating expenses.
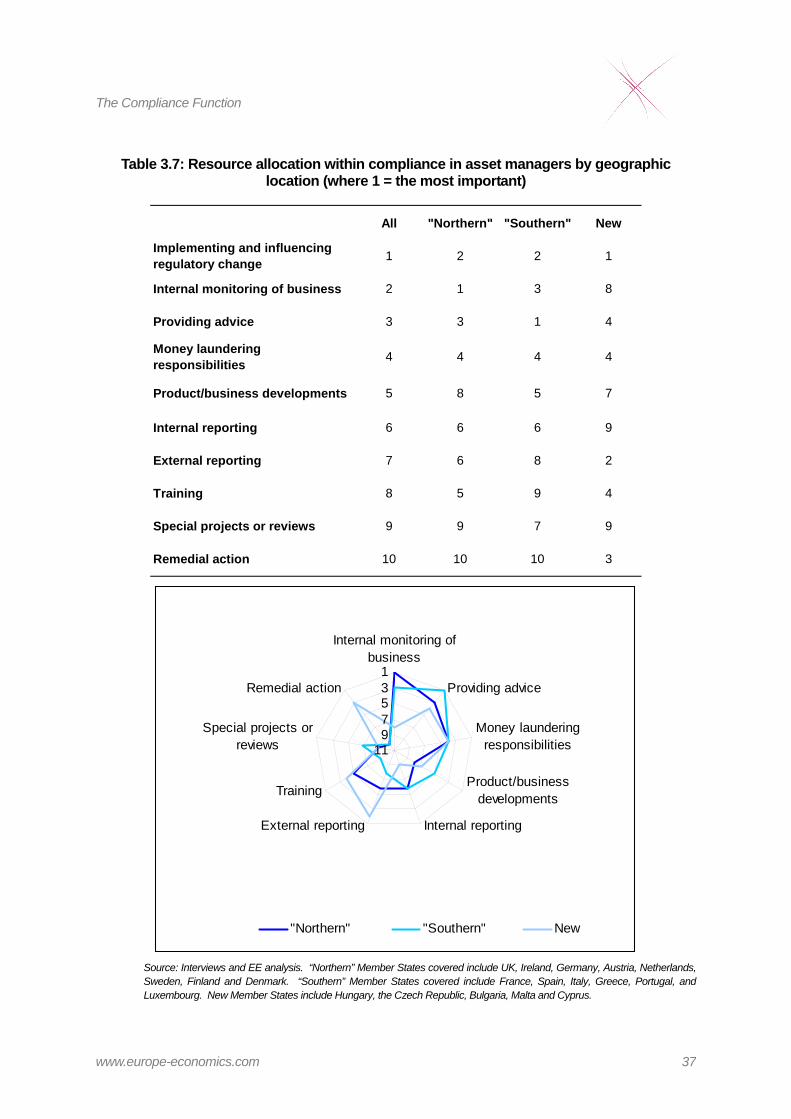
The Compliance Function
www.europe-economics.com 37
Table 3.7: Resource allocation within compliance in asset managers by geographic location (where 1 = the most important)
All "Northern" "Southern" New
Implementing and influencing regulatory change 1 2 2 1
Internal monitoring of business 2 1 3 8
Providing advice 3 3 1 4
Money laundering responsibilities 4 4 4 4
Product/business developments 5 8 5 7
Internal reporting 6 6 6 9
External reporting 7 6 8 2
Training 8 5 9 4
Special projects or reviews 9 9 7 9
Remedial action 10 10 10 3
13579
11
Internal monitoring ofbusiness
Providing advice
Money launderingresponsibilities
Product/businessdevelopments
Internal reportingExternal reporting
Training
Special projects orreviews
Remedial action
"Northern" "Southern" New
Source: Interviews and EE analysis. “Northern” Member States covered include UK, Ireland, Germany, Austria, Netherlands, Sweden, Finland and Denmark. “Southern” Member States covered include France, Spain, Italy, Greece, Portugal, and Luxembourg. New Member States include Hungary, the Czech Republic, Bulgaria, Malta and Cyprus.

The Compliance Function
www.europe-economics.com 38
3.26 In the larger asset managers, there is greater emphasis on internal monitoring and providing advice whilst regulatory change and obligatory activities (anti-money laundering activities and regulatory reporting) feature more prominently among the smaller asset managers. A number of participants believed that the resources dedicated to external reporting (driven by regulatory reporting) are likely to increase in the foreseeable future.
3.27 It is interesting to note that we have found that the compliance functions of the asset managers based in New Member States allocate (on average) markedly less resource to internal monitoring (i.e. preventative action) and rather more to remedial work (i.e. corrective action) than those headquartered elsewhere.
Investment banks
Drivers of compliance strategy
3.28 We set out below the ranking for the drivers of compliance strategy derived from all participating investment banks.
Table 3.8: The drivers of compliance strategy in investment banks, by firm size and geographic location (where 1 = the most important)
All Small Large
Adapting to/anticipating the selected Directives 1 1 1
Adapting to other national regulatory changes 2 2 2
Industry best practice 3 4 3
Perceived threat of regulatory sanctions 4 3 5
Culture of the national regulator 5 6 4
Improving quality of service 6 4 6
Disciplinary action against other firms 7 9 6
Non-EU regulation 8 11 8
Adapting to/anticipating EU requirements outside FSAP 9 7 9
Adapting to/anticipating other FSAP Directives 10 8 9
Technological change 11 9 11

The Compliance Function
www.europe-economics.com 39
13579
11
Adapting to/anticipating theselected Directives
Adapting to other nationalregulatory changes
Industry best practice
Perceived threat of regulatorysanctions
Culture of the nationalregulator
Improving quality of serviceDisciplinary action against
other firms
Non-EU regulation
Adapting to/anticipating EUrequirements outside FSAP
Adapting to/anticipating otherFSAP Directives
Technological change
Small Large
13579
11
Adapting to/anticipating theselected Directives
Adapting to other nationalregulatory changes
Industry best practice
Perceived threat of regulatorysanctions
Culture of the nationalregulator
Improving quality of serviceDisciplinary action against
other firms
Non-EU regulation
Adapting to/anticipating EUrequirements outside FSAP
Adapting to/anticipating otherFSAP Directives
Technological change
"Northern" "Southern"
Source: Interviews and EE analysis. For this purpose, a “large” investment bank has in excess of €500m in operating expenses. “Northern” Member States covered include UK, Ireland, Germany, Austria, Netherlands, Sweden, Finland and Denmark. “Southern” Member States covered include France, Spain, Italy, Greece, Portugal, and Luxembourg.

The Compliance Function
www.europe-economics.com 40
3.29 By comparison to the drivers of compliance strategy of the banks and financial conglomerates, there is no longer a consistent differentiation either on geography or size between the positive and the reactive drivers (disciplinary action, concern over sanctions).
3.30 This is consistent with the thought that the way that the compliance function operates across the European investment banking industry (at least as represented by participants in our study) is less differentiated than the compliance functions operating in banks.
Resource allocation
3.31 We set out below the ranking for the resource allocation within the compliance function, derived from all participating investment banks.
Table 3.9: The drivers of resource allocation in investment banks by firm size (where 1 = the most important)
All Small Large
Providing advice 1 3 1
Money laundering responsibilities 2 1 4
Implementing and influencing regulatory change 3 2 3
Internal monitoring of business 4 4 2
Product/business developments 5 4 5
Training 6 6 7
External reporting 7 6 8
Internal reporting 7 10 6
Special projects or reviews 9 8 9
Remedial action 10 9 10

The Compliance Function
www.europe-economics.com 41
13579
11
Money launderingresponsibilities
Implementing andinfluencing regulatory
change
Internal monitoring ofbusiness
Product/businessdevelopments
TrainingExternal reporting
Internal reporting
Special projects or reviews
Remedial action
Small Large
13579
11
Money launderingresponsibilities
Implementing andinfluencing regulatory
changeInternal monitoring of
business
Product/businessdevelopments
TrainingExternal reporting
Internal reporting
Special projects or reviews
Remedial action
"Northern" "Southern"
Source: Interviews and EE analysis. For this purpose, a “large” investment bank has in excess of €500m in operating expenses. “Northern” Member States covered include UK, Ireland, Germany, Austria, Netherlands, Sweden, Finland and Denmark. “Southern” Member States covered include France, Spain, Italy, Greece, Portugal, and Luxembourg.
3.32 The resource allocations are broadly similar to those of the banks and financial conglomerates generally. One exception is a greater focus placed upon training within investment banks by comparison to banks generally. Our findings suggest that this is

The Compliance Function
www.europe-economics.com 42
linked to the more complex activities — at least in compliance terms — undertaken by investment bank personnel.
Financial markets
Drivers of compliance strategy
3.33 We set out below the ranking for the drivers of compliance strategy derived from all participating financial markets.
Table 3.10: The drivers of compliance strategy in financial markets (where 1 = the most important)11
All
Adapting to/anticipating the selected Directives 1
Adapting to other national regulatory changes 2
Improving quality of service 3
Industry best practice 4
Culture of the national regulator 5
Technological change 6
Adapting to/anticipating EU requirements outside FSAP 7
Adapting to/anticipating other FSAP Directives 8
Perceived threat of regulatory sanctions 9
Disciplinary action against other firms 10
Non-EU regulation 10
11 The small sample obtained of financial markets does not permit greater sub-division.

The Compliance Function
www.europe-economics.com 43
1
3579
11
Adapting to/anticipating theselected Directives
Adapting to other nationalregulatory changes
Improving quality of service
Industry best practice
Culture of the national regulator
Technological changeAdapting to/anticipating EUrequirements outside FSAP
Adapting to/anticipating otherFSAP Directives
Perceived threat of regulatorysanctions
Disciplinary action againstother firms
Non-EU regulation
All
Source: Interviews and EE analysis.
3.34 Compliance within financial markets is focused upon ensuring confidence in the market (another dimension of reputational risk). In this light, the prominence of quality of service is not surprising. On the other hand, the primary focus is reacting to regulatory change.
Resource allocation
3.35 We set out below the ranking for the resource allocation within the compliance function, derived from all participating financial markets.

The Compliance Function
www.europe-economics.com 44
Table 3.11: The drivers of resource allocation (where 1 = the most important)
All
Implementing and influencing regulatory change 1
Internal monitoring of business 2
Product/business developments 3
Providing advice 4
Remedial action 5
External reporting 6
Special projects or reviews 7
Internal reporting 8
Training 9
Money laundering responsibilities 10
1
3
5
7
9
11
Implementing and influencingregulatory change
Internal monitoring ofbusiness
Product/businessdevelopments
Providing advice
Remedial action
External reporting
Special projects or reviews
Internal reporting
Training
Money launderingresponsibilities
All
Source: Interviews and EE analysis.
3.36 The relative importance of implementing regulatory change and of monitoring activity is unsurprising.

The Compliance Function
www.europe-economics.com 45
Organisational Structure
3.37 Most, but by no means all, of our interviewed sample have an independent, specialist compliance unit within their firm (i.e. it is not an integrated function within a larger department such as the legal or risk management department). However, this is a relatively recent phenomenon (i.e. within the last five years and, in a number of cases, in the last 12–18 months).
3.38 Even where compliance functions have been in establishment throughout the last ten years, this period has typically seen a very significant increase in headcount (i.e. in excess of 100 per cent). Drivers of this growth include increased regulatory expectations for specific operational compliance activities (e.g. anti-money laundering) and the switching of resources from internal audit to compliance (which, in essence, refocuses effort towards prevention rather than treatment).
3.39 Compliance models do vary somewhat across the firms that have been interviewed. There are a number of different organisational models:
(a) Larger firms have been able to establish compliance functions on a decentralised basis (giving a multiple lines of defence structure). The elements within such a strategy would variously include the ingrained attitudes of staff (achieved through corporate culture or training), the location of compliance people within individual Business Units, the centralised compliance function and Internal Audit as a final line of defence.
(b) The sharing of compliance functions across a number of departments is common to most banks — the compliance unit is responsible for addressing “classic” compliance roles and a risk control function that is responsible for compliance issues relating to, for example, Basel II and the Capital Requirements Directives.
(c) Where a discrete compliance function is absent, regulatory matters are integrated within larger departments such as those dealing with legal or risk management matters.
Reporting lines
3.40 In addition to the above changes, it is apparent that the role of compliance has become increasingly important at the executive Board level. In a small minority of cases the compliance function is directly represented on the executive Board. More normally, the head of compliance has direct and unfettered access to someone on it (for example the CEO), as well as access to the supervisory Board.
3.41 Alternately, the head of compliance may report to someone with such direct access, such as the firm’s Secretary General or Chief Counsel, who is also responsible for matters other than compliance. This model is more common where the compliance function is part of a larger, integrated department (e.g. Legal and Compliance).

The Compliance Function
www.europe-economics.com 46
3.42 Some respondents have made the point that a switch from “Legal” or “Legal and Compliance” to having a standalone compliance function may be a significant factor in developing a role that is more proactive rather than reactive (i.e. it is monitoring activity rather than simply proffering advice) and that has an increasing operational edge. Again, this increase in profile of the compliance unit is typically a recent development.
3.43 In larger firms with a decentralised compliance function (i.e. at least partially located within the business units), a matrix reporting structure is typical. This simply means that the local compliance head will have a reporting line to the local CEO, as well as a functional reporting line to the group compliance head.
Intensity
3.44 The ratio of compliance staff to all staff varies significantly both across the different sectors and between firms within the individual sectors. Although it is recognised that the working definition of compliance does differ between firms, it is the best available proxy for the intensity of resources allocated to the compliance function overall.
3.45 The average participating bank in our study had a ratio of compliance staff (including those performing anti-money laundering duties) to all staff of about 1:350–400. However, the results around this were highly dispersed. In particular, there is a de minimis level of activity required regardless of size to ensure compliance is achieved — the corollary of this is that in some very small banks, compliance activity features very prominently in the overall workload of the firm (taking up perhaps 4–5 per cent, or more, of employee time).
3.46 In addition, in such very small firms, it is harder to achieve specialisation in the compliance activities (resulting in lost efficiency and also meaning that the compliance activity is disproportionately a burden upon more senior management), increasing costs. Looking at larger banks, some “Northern”-based participants have a ratio as low as 1:90 (i.e. over one per cent of the work force work in compliance). This is an order of magnitude greater than in some of the banks headquartered in the “Southern” region or in New Member States.
3.47 The intensity of compliance staff in the asset management sector was also typically higher than in banks: within asset management businesses, a ratio of 1:100 or less was commonplace. Participating investment banks tended to have similar ratios to the asset managers. The financial markets (which are typically much smaller entities) had lower ratios still.
Cost Control and Compliance
3.48 Although some interviewees felt that it was not possible to aim to reduce the costs of the compliance department (without running the risk of reputational risk, or worse), this was not the general case.
3.49 We comment below upon the most common themes raised:

The Compliance Function
www.europe-economics.com 47
(a) Management and internal corporate culture.
Considerable importance was placed upon the active and visible endorsement and support from senior management for compliance-related initiatives.
Keeping the senior executives informed and on board therefore plays an important role in budgetary control (as in its absence, greater resources would need to be expended for the same result).
If culture is what is done in the absence of rules, then it is perhaps part of the mission of a compliance function to assist in the promotion of positive cultural norms (and if necessary cultural change). In other words, the compliance function can be seen as an essential management tool for achieving cultural change. There is a clear benefit in this to senior executive management in that a business with a good compliance culture should be more straight-forward to manage.
The pro-active involvement of senior executives (if not the CEO him- or herself) is crucial to instilling such a compliance-positive culture within the organisation. The appropriate methodologies to do this vary by organisation and circumstances, but are likely to include training (see also below) and similar ways of visibly demonstrating the value of good compliance to the operational units. In at least a few cases, the compliance functions have developed a “compliance index”, or similar, to compare the compliance performance of different divisions as a part of an overall incentivisation programme.
(b) The culture of the national regulator and the relationship with the regulator.
Although this factor is exogenous to individual organisations it has an important role with a tendency by the supervised entities to prefer risk- or principles-based approaches.
Regardless of the approach to regulation adopted by the regulator, it is seen as crucial that the regulator has a good understanding of what the entities actually do. A number of participants considered the industry knowledge base of the supervisors that they encountered to be inadequate.
In addition, a regulator that is both practical and approachable, with regular meetings, is seen as important in order to allow an open and honest dialogue. However, the nature of the relationship will vary — whilst an informal relationship may be attractive to the regulated firms, the regulators may prefer a more formalised set-up (e.g. the FSA in the UK rotates relationship managers).
(c) The skills of compliance personnel.
The compliance function is seen as demanding a diverse mix of skills (although these skills do not necessarily need to be embodied in each and every compliance operative). The core competencies seen as particularly important are an

The Compliance Function
www.europe-economics.com 48
understanding of the business and of its products and services, and (to a lesser extent) legal experience.
(d) The structure of the compliance function.
The decentralisation of compliance activities away from a central department is seen as important in order to embed a compliance culture throughout the firm. A number of study participants have devolved such activities even to individual members of staff to create three lines of defence against problems arising (the fee generator, the local compliance staff and the centralised function).
(e) Training.
The ongoing, systematic training of staff is a role that frequently involves compliance functions (although it is not always a major draw upon resources — the compliance unit might be involved in the design stage, but not necessarily the actual training itself). Investment in training is seen as a long-term route to savings, by instilling an improved corporate culture. In other words, well-trained staff are expected to ensure that compliance procedures are adhered to during day-to-day activities, reducing the requirement for intervention from the compliance department.
The most common areas for such training are in relation to anti-money laundering (including also combating terrorist financing and the monitoring of sanctions lists), anti-market abuse obligations and consumer protection matters).
E-learning was identified by a small number of interviewees as being an important route to cost reduction here (although it is still often seen as a “quick fix” that requires additional classroom-based training support).
(f) Automation.
IT solutions are seen as (more or less) necessary to fulfil some compliance activities. However, the point has been made by some participants that once an IT solution starts to be established for the larger and/or more innovative firms, it can sometimes be regulated into best practice. This means that some businesses are forced into an adoption of an IT solution that increases costs.
(g) Outsourcing.
This has only a limited direct impact upon the compliance function. Certain functions in relation to money-laundering have been outsourced by some study participants. However, our study suggests that this phenomena is relatively restricted (i.e. it is only an option in large financial centres).

The Compliance Function
www.europe-economics.com 49
(h) Remedial action.
Very strong record-keeping is seen as important as and when remedial action is required. This helps to underpin the setting of clear responsibilities for future change.
The One-off Costs of Compliance
www.europe-economics.com 50
4 THE ONE-OFF COSTS OF COMPLIANCE
Introduction
4.1 In this section we analyse the one-off costs of compliance with financial services regulation. It is stressed once again that we have sought to measure incremental expenditure — in other words, those costs incurred that would not have been incurred without regulatory change. In this section we present our results in a number of different ways in order to provide as full a picture as possible.
The Impact of Changing Financial Services Regulation
4.2 In the tables that follow we present three kinds of average:
(a) The median. If one imagines all the data points arranged sequentially, the median is simply the middle value in this series. The sequence from which we have selected the median is based upon the estimated one-off costs of compliance expressed as a percentage of the relevant firm’s most recent operating expenditure.12 This selection has been performed Directive by Directive within each category or sub-category shown.
(b) The mean (expressed as a percentage). This is the aggregate one-off costs of compliance expressed as a percentage of the relevant firms’ aggregated most recent operating expenditure. This implies that the experience of the larger firms will carry more weight in the sample or sub-sample presented. Again, this was performed on a Directive by Directive basis.
(c) The mean (in absolute values). This is the average value (expressed in euros) for each firm of the one-off costs incurred. Some firms were not able to provide an estimate of the cost impact of a specific measure or measures. We have shown the arithmetic mean for each Directive based only upon those firms providing an answer. The figure for operating costs is the average across all firms. This means that the mean cost per Directive compared to the average operating costs will not equate exactly to the means expressed in percentage terms (since in many cases the numerators and denominators would not be exactly comparable).
4.3 In addition, we present a number of charts illustrating the dispersion of results that we gathered. These show the one-off costs of compliance expressed either:
– as a percentage of the relevant firm’s most recent operating expenditure for each firm in the sub-sample; or
12 Operating expenditure has been defined as all of the expenses incurred between the gross profit line and EBITDA. This includes payroll costs, administrative overheads, IT costs, and costs associated with the occupancy of premises. Depreciation and amortisation are not included.

The One-off Costs of Compliance
www.europe-economics.com 51
– the estimated value (in euros) of those costs for each firm.
4.4 The table below analyses the scale of the Selected Directives, together with the impact of other regulatory change (due to the other FSAP measures, or other financial services regulation whether EU, nationally or extra-territorially derived).
Table 4.1: Mean one-off costs, expressed as a percentage of 2007 operating expenses
Banks & Financial
conglomerates Asset ManagersInvestment
BanksFinancial Markets
Prospectus 0.02% 0.05% 0.00% 0.67%FCD 0.01% 0.01% 0.00% 0.00%CRD 1.53% 0.46% 1.37% 0.00%Transparency 0.03% 0.22% 0.01% 0.44%MiFID 0.52% 0.48% 0.52% 1.46%3AMLD 0.29% 0.21% 0.23% 0.16%
2.41% 1.43% 2.14% 2.74%Other 0.49% 0.16% 0.11% 0.67% of which other FSAP 0.06% 0.05% 0.01% 0.40%Total 2.90% 1.58% 2.25% 3.40%
Source: Interviews and EE analysis
4.5 The Selected Directives comprise a significant element of the total: 83 per cent of the total impact for banks and financial conglomerates, 90 per cent for asset managers, 95 per cent for investment banks and 84 per cent for financial markets. The importance of the Selected Directives relative to the total impact of changing financial services regulation is greater in respect of implementation costs against recurring costs (see 5.6 below). This corresponds with our finding (discussed below) that significant resources were committed to the automation of the business and process changes implied by the regulatory changes in question.
4.6 Given that the focus of the study is upon the Selected Directives it is possible that they have gained greater prominence in the minds of the interviewees than is actually the case. Whilst plausible, it seems unlikely that this potential bias would affect the basic result (i.e. that the Selected Directives are, in aggregate, highly significant). Indeed, a number of interviewees considered that MiFID and the CRDs represented the most important regulatory changes of recent times.
4.7 The European financial services community is large and diverse. Whilst we have strived to make our study as representative as possible, a small sample can be affected by outlying results. Therefore, the mean should not be taken as a guide to the impact upon that overall community as a whole. We therefore also present the analysis of the one-off impact of the Selected Directives below as the medians in our sample range.

The One-off Costs of Compliance
www.europe-economics.com 52
Table 4.2: Median one-off costs of the Selected Directives, expressed as a percentage of 2007 operating expenses
Banks & Financial
conglomerates Asset ManagersInvestment
BanksFinancial Markets
Prospectus 0.02% 0.00% 0.02% 0.18%FCD 0.00% 0.00% 0.00% 0.00%CRD 1.23% 0.14% 1.09% 0.00%Transparency 0.01% 0.02% 0.04% 0.09%MiFID 0.56% 0.63% 0.68% 0.93%3AMLD 0.31% 0.24% 0.32% 0.03%Total 2.13% 1.03% 2.16% 1.23%
Source: Interviews and EE analysis
4.8 Finally, in order to provide an additional sense of scale, we present in Table 4.3 the average absolute value of the incremental cost changes attributed by interviewees to regulatory change, by sector.
Table 4.3: Mean one-off costs of the Selected Directives per firm (€000s)
Banks & Financial
conglomerates Asset ManagersInvestment
BanksFinancial Markets
Prospectus 323 87 91 137 FCD 165 37 34 0 CRD 23,923 1,832 15,042 1 Transparency 425 353 319 89 MiFID 8,016 1,834 5,397 298 3AMLD 4,588 825 2,507 33
37,442 4,968 23,391 558 Other 7,707 597 1,178 136 of which other FSAP 913 191 72 81 Total 45,149 5,565 24,569 694
Average of Operating Costs 1,558,072 384,582 1,030,071 20,403 Source: Interviews and EE analysis
4.9 Of course, it may be that the candidates that were most interested in participating in the study were those who had incurred the most cost, so that the estimates received could be biased upwards. That said, MiFID was seen by most asset managers as being in a class of one as a source of one-off costs. This is most clear from the median data presented, where it has more than double the relative impact of any other of the Selected Directives. Both the means and the average per firm are heavily influenced by the experience of larger asset managers (particularly those that are part of larger financial services groups).
4.10 For banks and investment banks, the CRD was typically the main source of one-off costs with MiFID and 3AMLD (the latter less so for investment banks, owing to a typically different client make-up) being significant. For some banks, MiFID was identified as the main source of incremental cost impacts.

The One-off Costs of Compliance
www.europe-economics.com 53
4.11 In terms of other EU regulation (outside of the Selected Directives) that had a material impact, the most significant were the Market Abuse Directive, changes in accounting rules and also the UCITS Directives (the latter specifically affecting certain asset management businesses).
4.12 The impact attributed to non-EU legislation is largely driven by US legislation (in particular, Sarbanes-Oxley). Firms that operate in the US as well as the EU tend to see this as potentially adding more complexity and cost to their business than operating across the EU alone (i.e. the intra-EU differences are of a lesser magnitude than US-EU ones) — however, this is not a universal thought. Firms have adopted different strategies here:
– The adoption of corporate structures that reduce the potential impact of US regulation (by restructuring such that there is no longer a US parent, but a US sister company).
– The voluntary adoption of aspects of US regulation into compliance and practice standards that are applied globally. We have found that this is most common in the AML/CTF field.
4.13 There are also some intangible costs arising as a result of the implementation of new measures: a large number of participants have stated that these have resulted in the distraction of senior management time and available resources from operational tasks.
Synergies between the Measures
4.14 As a general observation, it is noted that very few businesses believed that any significant cost-reducing synergies had been achieved in the implementation of the various measures.
4.15 The variation in the implementation dates was the most frequently cited factor behind this. Another component to this problem was that firms felt that the detail necessary to properly prepare for IT changes was not always forthcoming from the implementing authorities in a sufficiently timely manner.
4.16 There is an element of frustration here for some businesses: for instance, the comment was made that if the bank in question had known what it knew now (i.e. at the end of the process), then it might have been possible to combine some of the requirements of MiFID and 3AMLD with regards to re-organising its Customer Relationship Management (CRM) system. It was unable to achieve these synergies due to a lack of transparency sufficiently early in the implementation of these measures in the relevant Member State. Indeed, a small number of study participants expressed scepticism about how much scope for synergies there would have been anyway, regardless of the timing of the measures.
4.17 On the other hand, a small number of institutions did feel that synergies had been achieved (or could be achieved) between the “know your customer” requirements of 3AMLD and suitability tests of MiFID. In addition, in at least some cases, the same basic
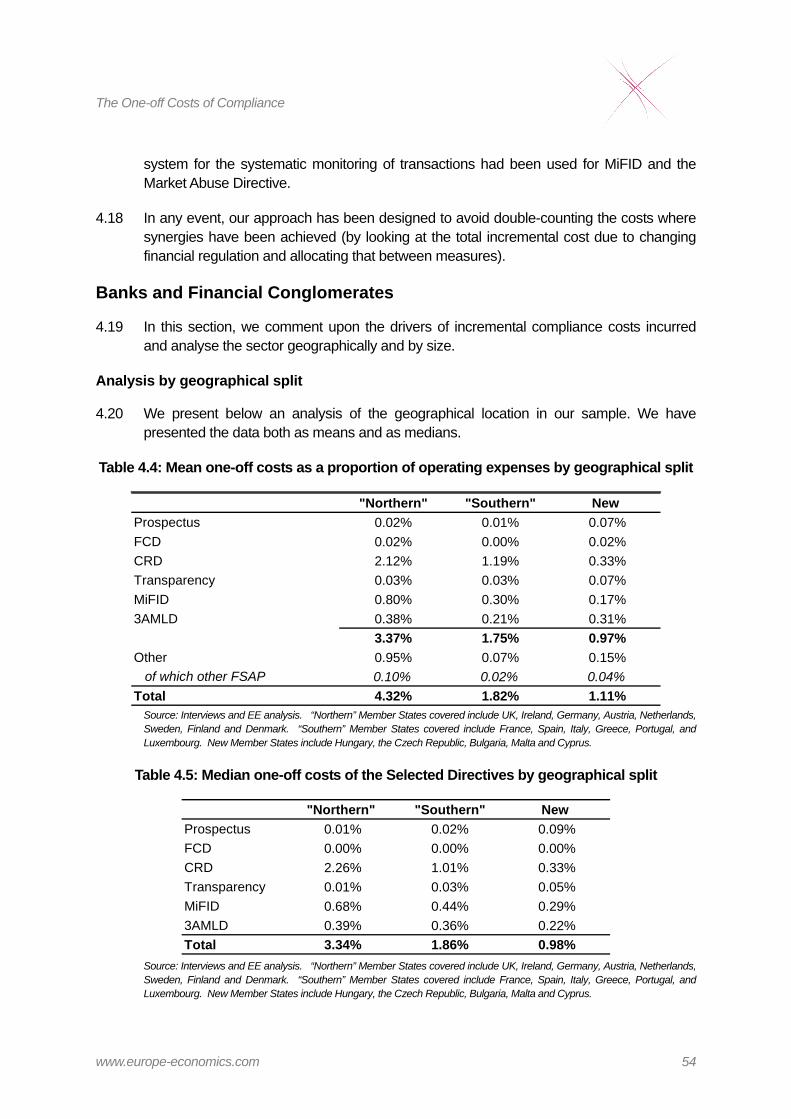
The One-off Costs of Compliance
www.europe-economics.com 54
system for the systematic monitoring of transactions had been used for MiFID and the Market Abuse Directive.
4.18 In any event, our approach has been designed to avoid double-counting the costs where synergies have been achieved (by looking at the total incremental cost due to changing financial regulation and allocating that between measures).
Banks and Financial Conglomerates
4.19 In this section, we comment upon the drivers of incremental compliance costs incurred and analyse the sector geographically and by size.
Analysis by geographical split
4.20 We present below an analysis of the geographical location in our sample. We have presented the data both as means and as medians.
Table 4.4: Mean one-off costs as a proportion of operating expenses by geographical split
"Northern" "Southern" New Prospectus 0.02% 0.01% 0.07%FCD 0.02% 0.00% 0.02%CRD 2.12% 1.19% 0.33%Transparency 0.03% 0.03% 0.07%MiFID 0.80% 0.30% 0.17%3AMLD 0.38% 0.21% 0.31%
3.37% 1.75% 0.97%Other 0.95% 0.07% 0.15% of which other FSAP 0.10% 0.02% 0.04%Total 4.32% 1.82% 1.11%
Source: Interviews and EE analysis. “Northern” Member States covered include UK, Ireland, Germany, Austria, Netherlands, Sweden, Finland and Denmark. “Southern” Member States covered include France, Spain, Italy, Greece, Portugal, and Luxembourg. New Member States include Hungary, the Czech Republic, Bulgaria, Malta and Cyprus.
Table 4.5: Median one-off costs of the Selected Directives by geographical split
"Northern" "Southern" New Prospectus 0.01% 0.02% 0.09%FCD 0.00% 0.00% 0.00%CRD 2.26% 1.01% 0.33%Transparency 0.01% 0.03% 0.05%MiFID 0.68% 0.44% 0.29%3AMLD 0.39% 0.36% 0.22%Total 3.34% 1.86% 0.98%
Source: Interviews and EE analysis. “Northern” Member States covered include UK, Ireland, Germany, Austria, Netherlands, Sweden, Finland and Denmark. “Southern” Member States covered include France, Spain, Italy, Greece, Portugal, and Luxembourg. New Member States include Hungary, the Czech Republic, Bulgaria, Malta and Cyprus.

The One-off Costs of Compliance
www.europe-economics.com 55
Table 4.6: Mean one-off costs in absolute terms per firm by geographical split (€000s)
"Northern" "Southern" New Prospectus 480 199 89 FCD 305 63 42 CRD 34,593 34,352 863 Transparency 508 443 107 MiFID 12,809 8,188 436 3AMLD 6,304 5,548 822
55,000 48,794 2,359 Other 15,772 1,830 386 of which other FSAP 1,686 465 97 Total 70,771 50,623 2,745
Average of Operating Costs 1,654,761 2,695,869 262,055 Source: Interviews and EE analysis. “Northern” Member States covered include UK, Ireland, Germany, Austria, Netherlands, Sweden, Finland and Denmark. “Southern” Member States covered include France, Spain, Italy, Greece, Portugal, and Luxembourg. New Member States include Hungary, the Czech Republic, Bulgaria, Malta and Cyprus.
4.21 Given that the impact of the selected FSAP measures has been the focus of the study, it is likely that these figures are the most developed and robust. We will therefore focus our analysis upon these.
4.22 From Table 4.4, it is apparent that (at least for the participants in our study), the experience of banks and financial conglomerates differed markedly between the different regions, with those located in the New Member States incurring significantly less incremental cost (both absolutely and relative to size) than anywhere else. This is illustrated below and discussed further within our commentary on particular directives (see, for example, the analysis relating to MiFID).

The One-off Costs of Compliance
www.europe-economics.com 56
Figure 4.1: The dispersion of one-off costs (expressed as a percentage of operating costs) by geographical region
Northern Southern New0
2
4
6
8
16
One
-off
cost
s of
com
plia
nce
(as
a %
of o
pera
ting
cost
s)
Source: Interviews and EE analysis.
4.23 As can be seen from the above, one bank in a New Member State had a particularly high cost experience. This was driven by the fact that in absolute terms it is rather small, so that the cost impact shows up as a large percentage of the firm’s operating cost. Conceptually, this is because there is an aspect of compliance that is necessary regardless of a firm’s scale and also a component that is broadly variable with its size. For a truly “small” institution, this fixed element may loom large.
Analysis by size
4.24 We present below an analysis by the geographic location of our sample.13 We have presented the data both as means and as medians.
13 For banks and financial conglomerates, “large” has been taken as in excess of €500 m of operating expenses in the latest financial year for which we had the data available.

The One-off Costs of Compliance
www.europe-economics.com 57
Table 4.7: Mean one-off costs as a proportion of operating expenses by size of firm
Small LargeProspectus 0.09% 0.02%FCD 0.03% 0.01%CRD 0.92% 1.57%Transparency 0.16% 0.02%MiFID 0.73% 0.51%3AMLD 0.49% 0.29%
2.42% 2.41%Other 0.31% 0.50% of which other FSAP 0.08% 0.06%Total 2.73% 2.92% Source: Interviews and EE analysis.
Table 4.8: Median one-off costs of the Selected Directives by size of firm
Small LargeProspectus 0.03% 0.01%FCD 0.00% 0.00%CRD 0.76% 1.82%Transparency 0.03% 0.01%MiFID 0.55% 0.59%3AMLD 0.28% 0.31%Total 1.66% 2.73% Source: Interviews and EE analysis.
Table 4.9: One-off costs per firm in absolute terms by size of firm (€000s)
Small LargeProspectus 121 626 FCD 39 382 CRD 1,152 67,568 Transparency 214 742 MiFID 880 19,434 3AMLD 585 10,594
2,991 99,346 Other 370 18,711 of which other FSAP 95 2,140 Total 3,362 118,057
Average of Operating Costs 120,029 3,715,136 Source: Interviews and EE analysis.
4.25 In the main, the cost impact for small firms was somewhat more than for larger firms. However, a particularly notable exception is the impact of the CRDs in the “Northern”

The One-off Costs of Compliance
www.europe-economics.com 58
region. Our study indicates that this is significantly driven by differential adoption of the advanced Internal Rating Based (IRB) programme (i.e. larger banks, all else being equal, are more likely to have pursued this) within study participants.
The spread of responses and cost drivers of the individual Directives
4.26 The cost drivers of the individual Directives are shown below.
Table 4.10: The cost drivers of the Selected Directives
Directive Prospectus FCD CRD Transparency MiFID 3AMLDFamiliarisation with Directive 49% 15% 2% 13% 3% 3%Consultancy fees 5% 11% 20% 5% 13% 11%Legal advice 23% 5% 5% 5% 7% 1%Training 13% 8% 5% 11% 15% 22%Staff recruitment costs 0% 2% 4% 1% 2% 2%Investment in/updating IT 2% 47% 57% 63% 52% 54%Project management 8% 9% 8% 3% 7% 7%Other 0% 2% 0% 0% 0% 0% Source: Interviews and EE analysis.
4.27 We comment on the different Directives and the drivers of cost in turn.
Prospectus Directive
4.28 This has not generally been a significant source of costs, hence the high proportion of the one-off cost incurred that relates to familiarisation with its contents. A very small number of the participants in the study have had to take action in terms of revising standard prospectus templates to ensure future compliance.
Financial Conglomerates Directive
4.29 Of the firms in the study, seven are currently categorised as financial conglomerates by the European Commission. In the vast majority of cases, then, the institution did not qualify as a financial conglomerate — the one-off cost was therefore a trivial one.
4.30 For the financial conglomerates, naturally, the Directive’s requirements had to be properly investigated and understood in order to assess what adaptation would be required. The implementation cost in respect of the Financial Conglomerates Directive largely related to the setting up of systems to extract the ongoing data requirements and/or monitoring systems to assist in the automation of group risk assessment. For the affected participants in our study, no significant implementation cost was incurred (e.g. most were able to acquire the data required for regulatory reporting from pre-existing sources), although the implementation cost was about double that of the sample as a whole (the mean implementation cost amongst financial conglomerates was 0.019 per cent, against 0.01 per cent for the entire sample).

The One-off Costs of Compliance
www.europe-economics.com 59
CRDs
4.31 The implementation of the CRDs (Basel II) has been a significant source of cost to most of the banks in the study — about 1.5 per cent of most recent year operating costs on average (with the median being just over 1.2 per cent of operating costs). The average cost to a firm was about €24m (although the average cost for a large firm was well above this level at just under €68 million).
4.32 The main sources of spending were:
– The development of risk weighting models, which typically included at least some involvement from external specialists. A fundamental aspect of these models is the prediction of default rates in different customer types with different product categories.
In the advanced programme, it was felt by a small minority of study participants that the relevant supervisors had been overly prescriptive in determining the parameters and the methodologies underlying the model development. This resulted in a long process of discussion and debate with the supervisors.
– IT development (whether in-house, with external contractors or a mixture of the two) to support internal and external reporting requirements (in some Member States, the ongoing reporting requirement is very resource heavy — see the ongoing costs below, in Section 5).
– The project management of a significant multi-disciplinary project, cutting across several departments (and potentially also involving external contractors).
4.33 However, there are significant differences in the experience of study participants, both by location and size. Figure 4.2 illustrates that the cost impact experienced by “Northern”-based banks was more diverse than in the other regions (as well as on average higher).
4.34 The impact of implementation in the New Member State-based banks was less. This is driven by, first, less frequent use of the advanced approach, and, second, by these institutions frequently being part of groups based elsewhere in the EU27 (and so, to some extent, able to leverage off costs incurred elsewhere). Indeed, the median implementation cost of all subsidiaries and branches (not just those based in New Member States) was 0.55 per cent — the median for the remainder of the sample was over twice this level.

The One-off Costs of Compliance
www.europe-economics.com 60
Figure 4.2: Dispersion of the one-off costs of the CRDs by geographical location
Northern Southern New0.0
0.5
1.0
1.5
2.0
2.5
3.0
3.5
4.0
4.5
5.0O
ne-o
ff co
sts
of c
ompl
ianc
e (a
s a
% o
f ope
ratin
g co
sts)
Source: Interviews and EE analysis. “Northern” Member States covered include UK, Ireland, Germany, Austria, Netherlands, Sweden, Finland and Denmark. “Southern” Member States covered include France, Spain, Italy, Greece, Portugal, and Luxembourg. New Member States include Hungary, the Czech Republic, Bulgaria, Malta and Cyprus.
4.35 As illustrated below, there is a notable difference in the cost drivers for “Northern” and “Southern” based banks by comparison to those based in New Member States — reliance upon external consultants is notably higher in the latter, whilst IT spending is lower. Interviewees linked this to the quantity of specialist resources available (leading to a greater reliance on external IT resources) and shorter implementation timetables in some of the New Member States.
Table 4.11: Cost drivers of the CRDs by geographic location
"Northern" "Southern" New Familiarisation with Directive 2% 5% 5%Consultancy fees 19% 21% 40%Legal advice 6% 1% 1%Training 6% 1% 3%Staff recruitment costs 4% 2% 0%Investment in/updating IT 57% 60% 39%Project management 7% 11% 9%Other 0% 0% 2%
Source: Interviews and EE analysis. “Northern” Member States covered include UK, Ireland, Germany, Austria, Netherlands, Sweden, Finland and Denmark. “Southern” Member States covered include France, Spain, Italy, Greece, Portugal, and Luxembourg. New Member States include Hungary, the Czech Republic, Bulgaria, Malta and Cyprus.
4.36 An important distinction needs to be drawn between those study participants who are adopting or have adopted the advanced (or foundation) programme which utilises internal

The One-off Costs of Compliance
www.europe-economics.com 61
ratings based models and those who adopted the standard approach. The larger banks in our study have typically adopted the former approach. This is considered to be more onerous in terms of cost and resources required, with a potential (but not certain) pay-off in reduced ongoing capital requirements once the internal models have been developed and have been approved by the relevant supervisor.
4.37 In other words, banks adopt the advanced programme because they anticipate that (in normal circumstances) the incremental cost of it will be at least self-financing. The Committee of Banking Supervisors’ (CEBS) Quantitative Impact study14 found evidence to demonstrate that just such an incentive structure existed to gravitate banks towards the more advanced approaches.
4.38 Large banks have, indeed, typically spent proportionately more on IT than their smaller peers (as well as significantly more, of course, in absolute terms).
Figure 4.3: Dispersion of the one-off costs of the CRDs by firm size
Small Large0.0
0.5
1.0
1.5
2.0
2.5
3.0
3.5
4.0
4.5
5.0
One
-off
cost
s of
com
plia
nce
(as
a %
of o
pera
ting
cost
s)
Source: Interviews and EE analysis.
Comparison to previous studies
4.39 Several studies estimated the initial implementation costs of the CRDs. These are summarised below.
14 CEBS (June 2006), Quantitative Impact Study 5: Overview on the Results of the EU countries (June 2006). This surveyed 262 banks, across 19 current Member States and Norway.

The One-off Costs of Compliance
www.europe-economics.com 62
Study Estimate Mercer Oliver Wyman Large banks will spend €90-180m Forrester Research Large European banks will spend €80m-€150m
Mid-range European banks will spend €60m-€70m Small European banks will spend €30m to €60m
Credit Suisse Group €90m per bank Datamonitor Larger banks will spend €100m on Basel II related
IT costs Accenture Most European Banks will spend at least €50m
4.40 To assist this comparison, we set out below the dispersion of the one-off costs related to the CRDs, expressed in monetary values.
Figure 4.4: Dispersion of the one-off costs of the CRDs by firm size (in €000s)
Small Large0
20,000
40,000
60,000
80,000
100,000
120,000
200,000
220,000
One
-off
cost
of c
ompl
ianc
e w
ith C
RD
(€00
0s)
Source: Interviews and EE analysis
4.41 Our results for the one-off costs associated with the implementation of the Capital Requirements Directive are generally lower than the estimates presented above — particularly with respect to the smaller banks that participated in our study. That said some of the largest banks and financial conglomerates that we interviewed did fall into the ranges estimated for large banks by Mercer Oliver Wyman, Forrester Research and the others (and in a few cases above these ranges).
4.42 As suggested by the Datamonitor survey, our analysis indicates that the main driver of implantation costs has been investment in IT. However, even for the largest banks and financial conglomerates interviewed the CRD related IT costs have been less than the €100m suggested by Datamonitor.
The One-off Costs of Compliance
www.europe-economics.com 63
Transparency Directive
4.43 This was not typically a major source of cost to banks although the innovation of parent company reporting introduced some additional cost to affected banks (i.e. largely those with asset management subsidiaries).
4.44 The ex ante impact assessment conducted in the UK indicated an expected cost to a bank of adapting its existing systems to be around €365,000 to €731,000 in the UK.15 Based on the average operating cost of all the banks and financial conglomerates in our sample, this would represent between 0.02 and 0.04 per cent of operating costs. The results of our analysis show a lower one-off cost of 0.01 per cent of operating costs across all participating banks (with the median result below this).
MiFID
4.45 As has been noted, the implementation of MiFID was a significant source of spending for nearly all banks participating in the study. Indeed, for a small minority of banks, MiFID was a more significant source of one-off cost than the CRD.
4.46 In terms of where cost was incurred, we highlight the following:
– The categorisation of clients to the extent required by MiFID. The categorisation required by MiFID was more or less novel in most Member States (Germany being a notable exception, at least in the opinion of certain of the German participants). The lack of familiarity with legislation of this type will itself have been a driver of additional cost.
– Communication with clients, largely achieved through mail-outs to customers. This was particularly expensive in respect of those clients where confirmation from the client was required.
– The amending of Client Relationship Management systems, for instance to incorporate this categorisation and to reflect the tracking of differentiated contact with these clients. Data entry was cited as a significant cost by some respondents (some of whom suggested that perhaps upwards of 30–40 new data points were required for at least some client categories). In a small but significant number of banks this triggered a data warehousing initiative in order to collect data from different sources (in these cases, only part of this element was typically attributable to MiFID, i.e. such initiatives were likely anyway).
– The development of revised policies on conflicts of interest, sometimes accompanied by investment in improved systems architecture. In some cases,
15 HM Treasury (2005): Implementation of the Transparency Directive.

The One-off Costs of Compliance
www.europe-economics.com 64
consultants were employed to map the potential for conflicts of interest to arise — although apparently not always with productive results.
– The development and validation of new training packages and one-off activities (both e-learning and class room based). Compliance staff were frequently involved in the design (if not necessarily the delivery) of these new training modules.
– Legal and operational gap analysis aimed at the identification of processes (for instance in relation to customer communication) that required amendment and/or documentation.
– The project management of the whole process over a period of (normally) around twelve months.
4.47 Discontinuance of products or services (which may have been rendered unprofitable or insufficiently profitable) was only atypically cited as a source of (opportunity) cost.
4.48 As an aside, it has been pointed out to us by some study participants that MiFID — by “forcing” contact with clients — represented an opportunity to get to know the customer better, not just in the sense of fulfilling regulatory requirements but also as a potential sales opportunity. Equally, at least some of the additional data capture regarding clients would (or perhaps should) have represented an increase in commercially valuable business intelligence.
Figure 4.5: Dispersion of the one-off costs of MiFID by geographical location
Northern Southern New0.0
0.2
0.4
0.6
0.8
1.0
1.2
1.4
1.6
1.8
2.0
2.2
3.4
3.6
One
-off
cost
s of
com
plia
nce
(as
a %
of o
pera
ting
cost
s)
Source: Interviews and EE analysis. “Northern” Member States covered include UK, Ireland, Germany, Austria, Netherlands, Sweden, Finland and Denmark. “Southern” Member States covered include France, Spain, Italy, Greece, Portugal, and Luxembourg. New Member States include Hungary, the Czech Republic, Bulgaria, Malta and Cyprus.
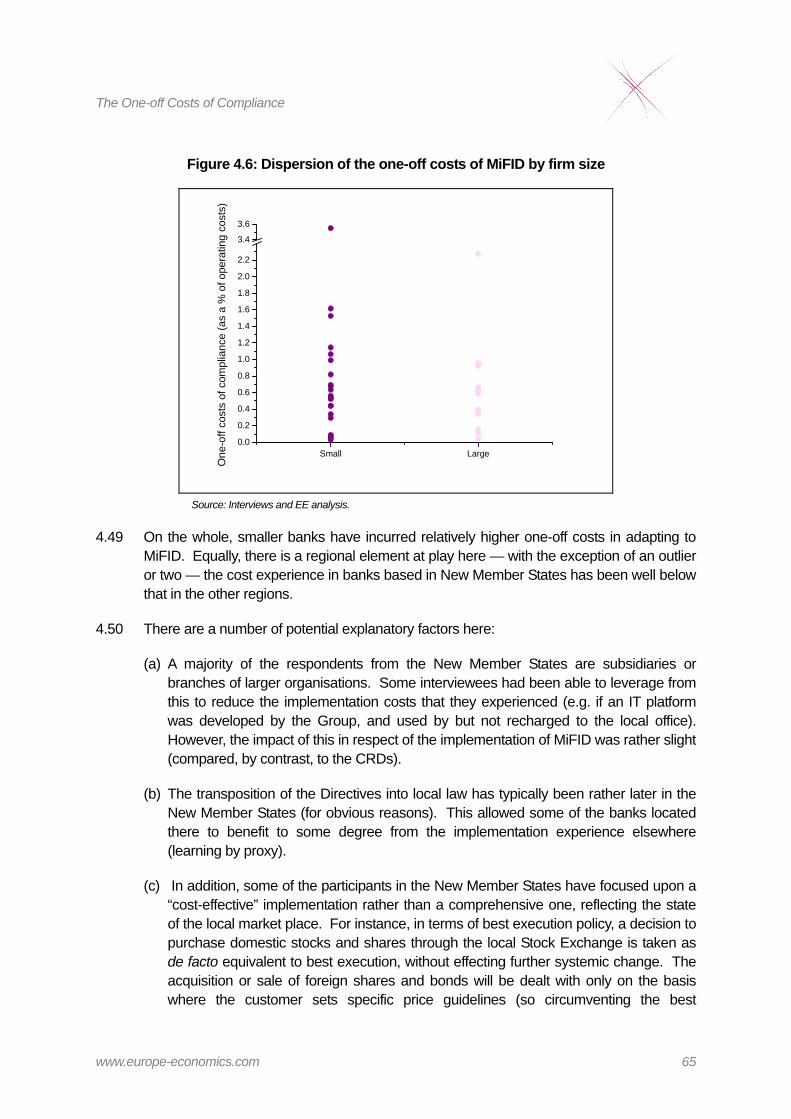
The One-off Costs of Compliance
www.europe-economics.com 65
Figure 4.6: Dispersion of the one-off costs of MiFID by firm size
Small Large0.0
0.2
0.4
0.6
0.8
1.0
1.2
1.4
1.6
1.8
2.0
2.2
3.4
3.6O
ne-o
ff co
sts
of c
ompl
ianc
e (a
s a
% o
f ope
ratin
g co
sts)
Source: Interviews and EE analysis.
4.49 On the whole, smaller banks have incurred relatively higher one-off costs in adapting to MiFID. Equally, there is a regional element at play here — with the exception of an outlier or two — the cost experience in banks based in New Member States has been well below that in the other regions.
4.50 There are a number of potential explanatory factors here:
(a) A majority of the respondents from the New Member States are subsidiaries or branches of larger organisations. Some interviewees had been able to leverage from this to reduce the implementation costs that they experienced (e.g. if an IT platform was developed by the Group, and used by but not recharged to the local office). However, the impact of this in respect of the implementation of MiFID was rather slight (compared, by contrast, to the CRDs).
(b) The transposition of the Directives into local law has typically been rather later in the New Member States (for obvious reasons). This allowed some of the banks located there to benefit to some degree from the implementation experience elsewhere (learning by proxy).
(c) In addition, some of the participants in the New Member States have focused upon a “cost-effective” implementation rather than a comprehensive one, reflecting the state of the local market place. For instance, in terms of best execution policy, a decision to purchase domestic stocks and shares through the local Stock Exchange is taken as de facto equivalent to best execution, without effecting further systemic change. The acquisition or sale of foreign shares and bonds will be dealt with only on the basis where the customer sets specific price guidelines (so circumventing the best

The One-off Costs of Compliance
www.europe-economics.com 66
execution guidelines). It is not clear whether such limitations would be considered fully acceptable by investment customers in more developed financial markets16 — and presumably such an approach has only a limited time horizon of acceptance where adopted in New Member States.
Comparison to previous studies
4.51 The average one-off cost attributable to MiFID is equivalent to just over 0.5 per cent of the operating costs, across all of the participating banks and financial conglomerates. A JP Morgan study reviewed the one-off cost impact of MiFID upon eight major banks as between €50 and €170 m. To scale these, we have calculated these costs relative to the recorded operating expenses of each of the banks in the JP Morgan study. This is shown in the table below.
Table 4.12: The one-off costs of MiFID as a proportion of operating expenses
UBS 0.28 Credit Suisse 0.35 BNP Paribas 0.75 Deutsche Bank 0.93 ABN AMRO 0.26 Société Générale 0.62 CASA 0.63 Barclays 0.99
Source: JP Morgan, company financial reports, EE calculations
4.52 Our sample has a small degree of overlap with those banks reviewed by JP Morgan. Although we will not discuss individual outcomes, it is apparent that our results for larger banks as a whole are — in the main — towards the middle or low end of the results in the JP Morgan study.
4.53 We set out below the dispersion of the one-off costs related to MiFID, expressed in monetary values.
16 The following quote from Richard Evans (Head of electronic trading products and services for Emea at Citigroup) implies it may have been: “At the outset, many customers were signing up to best-execution policies that required their broker to only trade on the primary exchange, which means they are compliant with MiFID but they were not giving the client the best chance of best execution”, reported in Financial News, 3 November 2008.

The One-off Costs of Compliance
www.europe-economics.com 67
Figure 4.7: Dispersion of the one-off costs of MiFID, by firm size (in €000s)
Small Large0
5,000
10,000
15,000
20,000
25,000
30,000
75,000
80,000O
ne-o
ff co
st o
f com
plia
nce
with
MiF
ID (€
000s
)
Source: Interviews and EE analysis
4.54 Vhayu, a technology company, predicted that the technology spend per firm would range between €4.8m and €28.8m and that smaller firms would incur proportionally greater compliance costs.17
4.55 Four of our study participants estimated the implementation cost of MiFID as being above Vhayu’s upper limit. The median of the large participating banks is an estimate of their one-off costs of about €16m. All of the “small” banks estimated the implementation costs relating to MiFID as being less than €5m (indeed, the average was about €900,000, and the median one-off cost experienced was just over €500,000).
4.56 By contrast, an ex ante study undertaken by the University of Frankfurt found that the majority of the (German) survey respondents expected compliance costs to be relatively limited at €500,000 to €1m per firm and would be proportional to firm size.18 The upper limit here is more than an order of magnitude below the actual cost experience of the larger participants in our study (of course, it may be that the participants in that study tended to be smaller firms).
3AMLD
4.57 The main sources of implementation spending here were on training, IT, and (for larger banks) external consultants. The importance of training is driven by it being more
17 Vhayu (2006), “Answering the technology challenges of MiFID” (http://www.vhayu.com/pdf/MiFID.pdf). The estimates were made in US dollars ($6–$36 m).
18 Gomber, P and Reininger, C (2006), “Die Umstezung der MiFID in der deutschen finanzindustrie”, Frankfurt University.

The One-off Costs of Compliance
www.europe-economics.com 68
generally applicable than the other Directives. In other words, the breadth of coverage of the training believed to be necessary to comply with this measure was greater than for the others.
4.58 In terms of IT spending, this included projects designed to:
– Meet the Know Your Customer informational requirements. This required some adaptation of the existing CRM systems and/or some new data entry needed to meet these increased data capture requirements. In a few instances, this triggered data warehousing projects to enhance inter-system data capture.
– Facilitate increased monitoring of suspicious transactions through increased automation of processes.
– Facilitate PEP screening.
– Assist in risk assessment.
4.59 The view was expressed by a few interviewees that a larger institution needed the evidence trail that the automated approach adopted — in the event of a problem arising, this would enable the firm to demonstrate that it had done all that it reasonably could.
4.60 There was also some cost associated with the re-design of training programmes and the roll-out of these.

The One-off Costs of Compliance
www.europe-economics.com 69
Figure 4.8: Dispersion of the one-off costs of 3AMLD by geographical location
Northern Southern New0.0
0.5
1.0
1.5
2.0
2.5O
ne-o
ff co
sts
of c
ompl
ianc
e (a
s a
% o
f ope
ratin
g co
sts)
Source: Interviews and EE analysis. “Northern” Member States covered include UK, Ireland, Germany, Austria, Netherlands, Sweden, Finland and Denmark. “Southern” Member States covered include France, Spain, Italy, Greece, Portugal, and Luxembourg. New Member States include Hungary, the Czech Republic, Bulgaria, Malta and Cyprus.
4.61 The “Northern” and “Southern” results are quite diverse, but are not significantly out of line with each other. The cost experience in the New Member States-based participants, on the other hand, is lower (notwithstanding these banks tending also to be smaller).
Figure 4.9: Dispersion of the one-off costs of 3AMLD by firm size
Small Large0.0
0.5
1.0
1.5
2.0
2.5
One
-off
cost
s of
com
plia
nce
(as
a %
of o
pera
ting
cost
s)
Source: Interviews and EE analysis.
4.62 As noted in Section 2, the implementation of the 3AMLD remains a work-in-progress. Transnational businesses have typically implemented its provisions on a group basis,

The One-off Costs of Compliance
www.europe-economics.com 70
either using the Directive itself as guidance or the implementation in their own Member State (if it has been implemented). The expectation is that it will be necessary at some future date to incur some additional spend to tweak implementation to fulfil the requirements of the local transposition. Some participants argued that this discouraged early adoption.
Asset Managers
4.63 In this section, we comment upon the drivers of incremental compliance costs incurred and analyse the sector geographically and by size.
Analysis by geographical split
4.64 We present below a geographical split of the costs incurred.
Table 4.13: Mean one-off costs as a proportion of operating expenses by geographical split
"Northern" "Southern" New Prospectus 0.01% 0.10% 0.00%FCD 0.04% 0.00% 0.00%CRD 0.53% 0.44% 0.05%Transparency 0.23% 0.01% 0.00%MiFID 1.09% 0.26% 0.64%3AMLD 0.34% 0.17% 0.11%
2.23% 0.98% 0.80%Other 0.41% 0.06% 0.33% of which other FSAP 0.18% 0.00% 0.11%Total 2.64% 1.04% 1.13%
Source: Interviews and EE analysis. “Northern” Member States covered include UK, Ireland, Germany, Austria, Netherlands, Sweden, Finland and Denmark. “Southern” Member States covered include France, Spain, Italy, Greece, Portugal, and Luxembourg. New Member States include Hungary, the Czech Republic, Bulgaria, Malta and Cyprus.
Table 4.14: Median one-off costs of the Selected Directives by geographical split
"Northern" "Southern" New Prospectus 0.02% 0.00% 0.00%FCD 0.00% 0.00% 0.00%CRD 0.40% 0.09% 0.00%Transparency 0.07% 0.00% 0.00%MiFID 0.82% 0.35% 0.02%3AMLD 0.32% 0.36% 0.00%Total 1.62% 0.81% 0.02%
Source: Interviews and EE analysis. “Northern” Member States covered include UK, Ireland, Germany, Austria, Netherlands, Sweden, Finland and Denmark. “Southern” Member States covered include France, Spain, Italy, Greece, Portugal, and Luxembourg. New Member States include Hungary, the Czech Republic, Bulgaria, Malta and Cyprus.

The One-off Costs of Compliance
www.europe-economics.com 71
Table 4.15: One-off costs per firm as absolute values by geographical split (€000s)
"Northern" "Southern" New Prospectus 29 220 - FCD 88 0 - CRD 1,285 3,347 5 Transparency 564 2 - MiFID 2,650 1,822 65 3AMLD 819 1,200 11
5,435 6,591 82 Other 999 450 34 of which other FSAP 447 18 11 Total 6,434 7,041 116
Average of Operating Costs 243,913 695,408 10,238 Source: Interviews and EE analysis. “Northern” Member States covered include UK, Ireland, Germany, Austria, Netherlands, Sweden, Finland and Denmark. “Southern” Member States covered include France, Spain, Italy, Greece, Portugal, and Luxembourg. New Member States include Hungary, the Czech Republic, Bulgaria, Malta and Cyprus.
4.65 At this level of aggregation, at least, the smaller asset management firms have incurred proportionately significantly more implementation costs than their larger peers (particularly with regard to MiFID in asset managers based in “Northern” Member States).
4.66 Looking outside of the Selected Directives, the UCITS measures were identified (by affected firms) as a key piece of legislation resulting in significant costs. A small number of interviewees considered it somewhat anomalous that UCITS applies divergent regulatory requirements to MiFID with regard to (at least superficially) similar actions.
Analysis by firm size
4.67 We present below a split of the costs incurred by size of firm.

The One-off Costs of Compliance
www.europe-economics.com 72
Table 4.16: Mean one-off costs as a proportion of operating expenses by firm size19
Small LargeProspectus 0.03% 0.05%FCD 0.00% 0.01%CRD 0.14% 0.47%Transparency 0.02% 0.24%MiFID 0.48% 0.72%3AMLD 0.54% 0.20%
1.21% 1.69%Other 0.52% 0.14% of which other FSAP 0.08% 0.05%Total 1.73% 1.83% Source: Interviews and EE analysis.
Table 4.17: Median one-off costs of the Selected Directives by size of firm
Small LargeProspectus 0.00% 0.00%FCD 0.00% 0.00%CRD 0.00% 0.33%Transparency 0.00% 0.23%MiFID 0.63% 0.64%3AMLD 0.27% 0.22%Total 0.90% 1.42% Source: Interviews and EE analysis.
4.68 We have found that the larger asset managers participating have incurred greater proportionate expenditure. One particular source of this relates to the Transparency Directive. We explore this point further, in Box 4.1 below.
19 For the purposes of this report, we have taken €150m in operating expenses as the cut-off between large and small asset managers.

The One-off Costs of Compliance
www.europe-economics.com 73
Table 4.18: One-off costs per firm as absolute values by size of firm (€000s)
Small LargeProspectus 5 196 FCD 0 80 CRD 29 3,935 Transparency 6 800 MiFID 92 4,012 3AMLD 105 1,724
236 10,749 Other 100 1,218 of which other FSAP 15 411 Total 336 11,967
Average of Operating Costs 19,266 841,228 Source: Interviews and EE analysis.
Cost drivers
4.69 The table below analyses the split of costs incurred in respect of Selected Directives.
Table 4.19: The drivers of one-off costs by Directive
Directive Prospectus FCD CRD Transparency MiFID 3AMLDFamiliarisation with Directive 6% 53% 5% 2% 6% 4%Consultancy fees 30% 0% 19% 25% 16% 9%Legal advice 21% 0% 0% 32% 4% 4%Training 0% 2% 0% 0% 9% 17%Staff recruitment costs 0% 0% 2% 0% 3% 3%Investment/updating IT 24% 0% 62% 23% 48% 51%Project management 19% 45% 11% 19% 14% 12%Other 0% 0% 0% 0% 0% 0% Source: Interviews and EE analysis.
4.70 Before turning to the individual Directives, as a general point, an important factor in determining the relative cost experience for asset managers is their client profile. In other words, a focus upon retail clients is likely to attract significantly more cost (particularly in connection with MiFID and the 3AMLD) than an otherwise equivalent asset manager that has only institutional clients. This said, most of the firms participating in our study had both types of client.
4.71 In addition, a small number of large asset managers (located in “Northern” Member States) had incurred significant investment in pre-execution compliance systems prior to the regulatory change initiated by the selected directives, so reducing the incremental impact of the regulatory change itself (although not necessarily overall cost levels).

The One-off Costs of Compliance
www.europe-economics.com 74
Prospectus Directive
4.72 In the main, this was not identified as a significant source of costs beyond sufficient familiarisation with the Directive in order to assess the extent (or not) of its applicability. However, a small number of (generally larger) asset managers have incurred significant non-recurring project expenditure in respect of this measure.
4.73 By way of context, in the recent CSES Study on the Impact of the Prospectus Regime on EU Financial Markets (2008), the survey respondents estimated the average cost of an equity prospectus to be in excess of €900,000 (with the bulk of this expended on legal and accounting-related costs). The average costs of the other prospectus types in that survey were substantially less. This cost is typically borne by the issuer.
4.74 However, respondents to the CSES survey were not able to clearly identify the incremental cost of the Prospectus Directive. Although the majority of respondents who expressed an opinion believed that the cost of issuing a prospectus had increased, it was also found that the cost increase in prospectus preparation was due to the general evolution of the market and the de facto adoption of US market standards before the Prospectus Directive came into force.
4.75 This is broadly in line with our results, namely that the Prospectus Directive has not in itself typically generated significant incremental costs in order to achieve compliance.
Financial Conglomerates Directive
4.76 Again, as with banks, this was not a significant source of cost within our study sample. However, some asset managers are part of larger financial services groups and as such attract some allocation of the costs discussed under the sub-section “Banks and Financial Conglomerates” above.
4.77 However, for one, large, asset manager based in the UK, some specific cost was incurred. The business fell within the discretionary part of the FCD and a small project was required to convince the FSA that reporting by exception, based on specified capital levels, would be sufficient.
The CRDs
4.78 Although the applicability of CRD to asset managers is limited, some costs were incurred either directly or through the allocation of costs from being within an overall financial conglomerate. The drivers of cost are broadly in line with the experience of banks, and similar comments apply.
Transparency Directive
4.79 The requirement for parent company reporting meant that for some asset managers a large IT project was or is required in order to allow such an aggregation of holdings across

The One-off Costs of Compliance
www.europe-economics.com 75
all portfolios. However, as is clear from Figure 4.10 below, the cost impacts of this measure were widely distributed.
4.80 Specific issues identified within such projects for flagging share-holdings include:
– The total actual outstanding shares in companies is not held within a single database (this information is required for the denominators in calculating an asset manager’s positions). The requirement to look across various databases incurs direct costs (through data licenses on both a one-off and ongoing basis) and as a potential trigger to establishing data warehousing facilities.
– Where the limit was previously five per cent and is now lower, this has magnified the importance of such flagging as share-holdings on such a scale are markedly more commonplace.
– The need to consider derivative positions is a further complication.
Figure 4.10: Dispersion of the one-off costs of the Transparency Directive by firm size
Small Large0.0
0.1
0.2
0.3
0.4
0.5
One
-off
cost
s of
com
plia
nce
(as
a %
of o
pera
ting
cost
s)
Source: Interviews & EE analysis
4.81 The Transparency Directive was a minimum harmonisation measure. Box 4.1 below considers some of the cost issues arising from this.

The One-off Costs of Compliance
www.europe-economics.com 76
Box 4.1: The impact of minimum harmonisation on asset managers
The approach adopted for the implementation of the Transparency Directive has been of minimum harmonisation. A number of the asset managers surveyed operate in multiple jurisdictions and therefore need to monitor the local implementation in each of the countries in which they operate. Indeed, some of the larger, transnational asset managers participating in our study view the Directive as something of a “missed opportunity” to reduce costs for this reason. There are three broad areas of the implementation of the Transparency Directive which vary across the Member States.20 First, the initial threshold for disclosure of the major holdings of voting rights by investors. The Directive states that investors should declare when the proportion of voting rights reaches, exceeds or falls below the thresholds of 5 per cent, 10 per cent, 15 per cent, 20 per cent, 25 per cent, 30 per cent, 50 per cent and 75 per cent. With regards to the initial disclosure Italy and Portugal have imposed a lower threshold of two per cent, and Germany, Ireland, Spain and the UK have adopted three per cent. Whilst Belgium and France are at the Directive level of five per cent, they allow issuers to set a lower threshold in their own articles of association. Second, the deadlines for reporting major holdings of voting rights by investors vary. The Directive states that investors should report major holdings of voting rights as soon as possible after they have crossed the aforementioned thresholds, but no later than four days. Some Member States have imposed more stringent timetables: both Greece and Romania have set a limit of three days; Austria, Hungary, Ireland and the UK have imposed a deadline of two days; Cyprus, Denmark and Sweden have opted for just one day, with Finland requiring reporting without delay. A further source of differentiation in implementation is with regards to the calculation of group holdings — voting rights are not aggregated in a similar fashion in all Member States. In Germany, for example, group exemptions to report just at the parent level only apply to share-holdings and not voting rights; thus, each legal entity in a group is required to file in respect of what are essentially the same voting rights. This issue of aggregation is complicated by the treatment of derivative positions and is further clouded by the different approaches to this matter in different Member States. Looking at both the ongoing and one-off incremental costs of complying with the Transparency Directive for the asset managers surveyed, the results for transnational asset managers compared to those that largely operate in just one Member State are markedly different. The latter consistently had a lower cost of compliance with the Transparency Directive. The mean ongoing cost of compliance with the Transparency Directive was 0.05 per cent (of total operating expenses) more for transnational asset managers compared to asset managers that operate largely in just one country. The one-off incremental costs were 0.12 per cent (of operating expenses) higher. Looking at the medians, the results are consistent (in the sense that transnational players have higher costs) but are geared more towards a higher differential in the one-off costs — where the gap is 0.23 per cent of operating costs. However, the median difference in ongoing costs is lower, at just 0.02 per cent. Looking at the kind of costs incurred, the differentiated implementation across the EU27 must have complicated the design and management of the IT projects required to meet the flagging requirements after aggregating holdings across all portfolios. These systems tend not to be fully automated so that an ongoing incremental cost exists also. Although it is not possible to quantify how much of the additional cost impact experienced by transnational asset managers has been driven by a minimum rather than maximum harmonisation approach, it is clear that there has been some contribution to the level of cost experienced by transnational asset managers due to this effect. This point was directly confirmed to us by at least some of the affected participants.
Source: European Commission, interviews and EE analysis
20 European Commission, DG Internal Market (2008), Report on more stringent national measures concerning Directive 2004/109/EC on the harmonisation of transparency requirements in relation to information about issuers whose securities are admitted to trading on a regulated market.

The One-off Costs of Compliance
www.europe-economics.com 77
MiFID
4.82 The scale of the one-off costs incurred by asset managers depended to a large extent upon the make-up of their client base. Such costs were typically higher for those operating with a significant retail client base. Sources of these costs included:
– The categorisation of clients.
– The making (and storage) of suitability assessments.
– Communication with clients, largely achieved through mail-outs to customers, and also, in some cases, requiring signed proof of receipt (the latter being known as two-way papering).
– The amending of Client Relationship Management systems, for instance to incorporate this categorisation and to reflect the tracking of differentiated contact with these clients (and to maintain such data recording).
– Refinement of best execution systems and associated IT investment.
– The development of revised policies on mapping conflicts of interest, sometimes accompanied by investment in improved systems architecture.
– The development and validation of new training packages and one-off activities (both e-learning and class room based).
– The project management of the whole process over a period of (normally) around twelve months.
4.83 Those asset managers focused solely upon institutional clients had a much more limited cost associated with this Directive.
4.84 The evidence we have suggests that the cost impact of MiFID was somewhat greater in “Northern” Member State-based asset managers than elsewhere (although there are some outliers in our sample, particularly from the New Member States — the relatively high cost impact of MiFID here is in large part driven by the specific asset managers affected being very small).

The One-off Costs of Compliance
www.europe-economics.com 78
Figure 4.11: Dispersion of the one-off costs of MiFID by geographical location
Northern Southern New0
1
2
3
4
5
6O
ne-o
ff co
sts
of c
ompl
ianc
e (a
s a
% o
f ope
ratin
g co
sts)
Source: Interviews & EE analysis. “Northern” Member States covered include UK, Ireland, Germany, Austria, Netherlands, Sweden, Finland and Denmark. “Southern” Member States covered include France, Spain, Italy, Greece, Portugal, and Luxembourg. New Member States include Hungary, the Czech Republic, Bulgaria, Malta and Cyprus.
Figure 4.12: Dispersion of the one-off costs of MiFID by firm size
Small Large0
1
2
3
4
5
6
One
-off
cost
s of
com
plia
nce
(as
a %
of o
pera
ting
cost
s)
Source: Interviews & EE analysis
The One-off Costs of Compliance
www.europe-economics.com 79
4.85 The ex ante assessment on behalf of the UK FSA estimated one-off implementation costs on investment firms would be €112,500 for small firms, €2.7m for medium-sized firms and €5.95 m for large firms.21 This is not significantly out of line with our study, where the mean of small firms was below €100,000, but just over €4m for the larger asset managers.
3AMLD
4.86 As stated previously, a major determinant of the relative cost impact here was the client make-up of the business, with retail-orientated asset managers typically incurring more cost.
4.87 Looking at individual drivers of this spending, the IT impact of this included adapting systems to the Know Your Customer informational requirements and automating monitoring and screening (against various databases of PEPs, and so on).
4.88 As with banks, there was also some implementation cost associated with the re-design of training programmes and the roll-out of these.
Figure 4.13: Dispersion of the one-off costs of 3AMLD by geographical location
Northern Southern New0.0
0.5
1.0
1.5
2.0
2.5
10.5
11.0
11.5
One
-off
cost
s of
com
plia
nce
(as
a %
of o
pera
ting
cost
s)
Source: Interviews & EE analysis. “Northern” Member States covered include UK, Ireland, Germany, Austria, Netherlands, Sweden, Finland and Denmark. “Southern” Member States covered include France, Spain, Italy, Greece, Portugal, and Luxembourg. New Member States include Hungary, the Czech Republic, Bulgaria, Malta and Cyprus.
21 LECG (2006), MiFID Implementation. Cost Survey of the UK Investment Industry, October (see: http://www.fsa.gov.uk/pubs/international/mifid_cost_survey.pdf). Estimates were £90,000 for small firms, £2.15 m for medium-sized
firms and £4.75 m for large firms. However, it must be noted that the participants in the LECG study were quite mixed. Most of the participants were asset managers and stock brokers, but also included stock exchanges, lawyers and share registrars amongst others.

The One-off Costs of Compliance
www.europe-economics.com 80
4.89 The different experience between “Northern” and “Southern”-based participants is driven in large part by some significant outliers in the latter group. The implementation cost in both has tended to exceed that in the participating asset managers based in New Member States.
Figure 4.14: Dispersion of the one-off costs of 3AMLD by firm size
Small Large0.0
0.5
1.0
1.5
2.0
2.5
10.5
11.0
11.5
One
-off
cost
s of
com
plia
nce
(as
a %
of o
pera
ting
cost
s)
Source: Interviews & EE analysis
4.90 One asset management firm had a particularly high implementation cost, relative to its size by comparison to the remainder of our sample. This firm’s business model was somewhat different to the majority of the asset managers in our sample in ways which complicated its compliance with the Third Anti-money Laundering Directive. The fact that the firm is rather small has amplified the impact of this.
4.91 It is apparent from the below that large and small asset managers have tended to adopt quite different approaches — with larger firms more reliant on the automation of processes, whereas we have found that the smaller asset managers (in the main) have focused upon increased training in order to internalise changed behaviours and processes (see also 5.58 below).

The One-off Costs of Compliance
www.europe-economics.com 81
Table 4.20: Analysis of one-off cost drivers of 3AMLD by firm size
Small LargeFamiliarisation with Directive 7% 4%Consultancy fees 0% 10%Legal advice 8% 4%Training 58% 11%Staff recruitment costs 2% 3%Investment/ updating IT 21% 55%Project management 4% 14%Other 0% 0%
Source: Interviews & EE analysis
Investment Banks
4.92 In this section, we comment upon the drivers of incremental compliance costs incurred and analyse the sector geographically and by size.
Analysis by geographical split
4.93 We present below the costs incurred by geographical location.
Table 4.21: Mean one-off costs as a proportion of operating expenses by geographical split
"Northern" "Southern" Prospectus 0.01% 0.02%FCD 0.00% 0.00%CRD 2.04% 1.12%Transparency 0.03% 0.05%MiFID 1.02% 0.34%3AMLD 0.27% 0.21%
3.36% 1.75%Other 0.15% 0.09% of which other FSAP 0.01% 0.00%Total 3.51% 1.83% Source: Interviews and EE analysis. “Northern” Member States covered include UK, Ireland, Germany, Austria, Netherlands, Sweden, Finland and Denmark. “Southern” Member States covered include France, Spain, Italy, Greece, Portugal, and Luxembourg.

The One-off Costs of Compliance
www.europe-economics.com 82
Table 4.22: Median one-off costs of the Selected Directives by geographical split
"Northern" "Southern" Prospectus 0.02% 0.02%FCD 0.00% 0.00%CRD 2.71% 0.87%Transparency 0.03% 0.07%MiFID 0.89% 0.36%3AMLD 0.46% 0.20%Total 4.11% 1.53% Source: Interviews and EE analysis. “Northern” Member States covered include UK, Ireland, Germany, Austria, Netherlands, Sweden, Finland and Denmark. “Southern” Member States covered include France, Spain, Italy, Greece, Portugal, and Luxembourg.
Table 4.23: One-off costs per firm as absolute values (€000s) by geographical split
"Northern" "Southern" Prospectus 44 170 FCD 1 73 CRD 11,897 18,187 Transparency 204 510 MiFID 5,240 5,576 3AMLD 1,838 3,368
19,224 27,885 Other 1,018 1,384 of which other FSAP 70 74 Total 20,242 29,269
Average of Operating Costs 686,998 1,416,029 Source: Interviews and EE analysis. “Northern” Member States covered include UK, Ireland, Germany, Austria, Netherlands, Sweden, Finland and Denmark. “Southern” Member States covered include France, Spain, Italy, Greece, Portugal, and Luxembourg.
Analysis by firm size
4.94 The smaller firms participating in our study found the implementation of the Selected Directives more expensive than their larger peers (the CRDs proved a partial exception to this).

The One-off Costs of Compliance
www.europe-economics.com 83
Table 4.24: Mean one-off costs of the Selected Directives by firm size
Small LargeProspectus 0.03% 0.01%FCD 0.00% 0.00%CRD 1.93% 1.32%Transparency 0.08% 0.04%MiFID 0.86% 0.50%3AMLD 0.70% 0.20%
3.60% 2.07%Other 0.42% 0.09% of which other FSAP 0.01% 0.01%Total 4.02% 2.16% Source: Interviews and EE analysis.
Table 4.25: Median one-off costs of the Selected Directives by firm size
Small LargeProspectus 0.03% 0.00%FCD 0.00% 0.00%CRD 0.76% 1.32%Transparency 0.04% 0.03%MiFID 0.84% 0.44%3AMLD 0.46% 0.23%Total 2.14% 2.02% Source: Interviews and EE analysis.
Table 4.26: One-off costs per firm as absolute values (€000s) by firm size
Small LargeProspectus 13 135 FCD 1 72 CRD 2,997 27,088 Transparency 29 487 MiFID 1,222 10,169 3AMLD 1,001 4,014
5,263 41,965 Other 597 1,759 of which other FSAP 9 134 Total 5,860 43,724
Average of Operating Costs 126,349 2,046,759 Source: Interviews and EE analysis.

The One-off Costs of Compliance
www.europe-economics.com 84
Cost drivers
4.95 The table below analyses the split of costs incurred in respect of Selected Directives.
Table 4.27: The drivers of one-off costs by Directive
Directive Prospectus FCD CRD Transparency MiFID 3AMLDFamiliarisation with Directive 9% 7% 3% 7% 6% 5%Consultancy fees 13% 0% 19% 10% 16% 12%Legal advice 18% 10% 2% 4% 4% 6%Training 14% 15% 2% 4% 10% 13%Staff recruitment costs 4% 0% 1% 10% 1% 0%Investment/ updating IT 27% 39% 62% 36% 49% 53%Project management 14% 29% 10% 29% 14% 12%Other 0% 0% 1% 0% 1% 0% Source: Interviews and EE analysis.
4.96 In large part, the make-up of costs is similar to that experienced by banks. We focus our commentary below upon some of the differentiating factors.
CRDs
4.97 It is clear that the larger investment banks in our study were much more reliant on external consultants than the smaller ones (even allowing for the fact that some portion of the IT spend may have been with external contractors so that the allocation between the two would be subject to judgement).
Table 4.28: One-off cost drivers of the CRDs by firm size
Small LargeFamiliarisation with Directive 6% 3%Consultancy fees 8% 21%Legal advice 4% 2%Training 5% 2%Staff recruitment costs 0% 1%Investment/ updating IT 67% 60%Project management 9% 10%Other 0% 1% Source: Interviews and EE analysis

The One-off Costs of Compliance
www.europe-economics.com 85
Figure 4.15: Dispersion of the one-off costs of CRDs by geographical location
Northern Southern0.0
0.5
1.0
1.5
2.0
2.5
3.0
3.5
4.0O
ne-o
ff co
sts
of c
ompl
ianc
e (a
s a
% o
f ope
ratin
g co
st)
Source: Interviews and EE analysis. “Northern” Member States covered include UK, Ireland, Germany, Austria, Netherlands, Sweden, Finland and Denmark. “Southern” Member States covered include France, Spain, Italy, Greece, Portugal, and Luxembourg.
4.98 The dispersion of costs is notably wider for the smaller investment banks. Our interviews clearly indicate that this reflects different approaches taken to the implementation of Basel II (a smaller institution adopting the IRB route would almost certainly incur proportionately high costs).
Figure 4.16: Dispersion of the one-off costs of CRDs by firm size
Small Large0.0
0.5
1.0
1.5
2.0
2.5
3.0
3.5
4.0
One
-off
cost
s of
com
plia
nce
(as
a %
of o
pera
ting
cost
)
Source: Interviews and EE analysis

The One-off Costs of Compliance
www.europe-economics.com 86
MiFID
4.99 Again, external consultants have played a significant role for the larger investment banks. Although there may be some interplay between the allocation of costs between project management spending and IT, it is likely that larger firms have relied more on automation (or at least the attempted automation) of adapting to regulatory change. (This is supported by the analysis of ongoing costs, where spending on IT has a proportionately more significant role in the ongoing costs of the larger firms).
4.100 The main sources of cost identified were:
– The categorisation of clients, coupled to the making and storage of suitability assessments.
– Refinement of best execution systems and investment in the IT infrastructure necessary to support pre- and post-trade transparency obligations.
– The development of revised policies on mapping conflicts of interest, sometimes accompanied by investment in improved systems architecture.
– The development and validation of new training packages and one-off activities (both e-learning and classroom based).
– The project management of the whole process over a period of (normally) around twelve months.
4.101 A summary of the identified cost drivers, analysed by geographic location of the parent business, is shown below.
Table 4.29: One-off cost drivers of MiFID by geographic location
"Northern" "Southern"Familiarisation with Directive 3% 10%Consultancy fees 19% 11%Legal advice 1% 8%Training 7% 16%Staff recruitment costs 0% 3%Investment/ updating IT 56% 37%Project management 13% 15%Other 1% 0% Source: Interviews and EE analysis. “Northern” Member States covered include UK, Ireland, Germany, Austria, Netherlands, Sweden, Finland and Denmark. “Southern” Member States covered include France, Spain, Italy, Greece, Portugal, and Luxembourg.
4.102 The large and small investment banks participating in our study are reasonably evenly distributed in terms of geographic location — in other words, this apparent regional divergence is not simply due to a skew in the spread of large and small participants. Instead, “Northern” located firms have tended to incur greater implementation costs, and

The One-off Costs of Compliance
www.europe-economics.com 87
to have spent absolutely and proportionately more on IT than their “Southern” located peers.
Figure 4.17: Dispersion of the one-off costs of MiFID by geographical location
Northern Southern0.0
0.5
1.0
1.5
2.0
5.0
5.5
6.0
6.5
One
-off
cost
s of
com
plia
nce
(as
a %
of o
pera
ting
cost
)
Source: Interviews and EE analysis. “Northern” Member States covered include UK, Ireland, Germany, Austria, Netherlands, Sweden, Finland and Denmark. “Southern” Member States covered include France, Spain, Italy, Greece, Portugal, and Luxembourg.
Figure 4.18: Dispersion of the one-off costs of MiFID by firm size
Small Large0
1
2
5
6
One
-off
cost
s of
com
plia
nce
(as
a %
of o
pera
ting
cost
)
Source: Interviews and EE analysis
4.103 As can be seen in the charts above, two firms had a much higher cost experience for the implementation of MiFID than the other firms in the sample. Both of these firms are

The One-off Costs of Compliance
www.europe-economics.com 88
relatively small institutions — as with previous outliers identified, this has magnified the relative impact. In particular, some aspects of implementation will be required regardless of the size of the business — naturally, the relative cost will be magnified for a smaller business. Equally, for the smallest institutions, these may not be large enough to permit a specialist compliance officer to exist (we have found this to have been the case in certain of the smallest study participants). This frequently meant that more senior staff (maybe even the Chief Executive Officer) became involved in the implementation of business-critical regulatory changes. The inevitable corollary of this is a relatively high cost to the business.
4.104 Estimates from 2006 indicated that investment banks could face a bill of €18m each, and that a typical broker-dealer classified as an internaliser would need to spend at least €17m to comply with MiFID. Half of the latter would be spent on IT supporting variously: algorithmic trading; work flow; business process outsourcing; market connectivity; Financial Information eXchange (FIX) Protocols; service-oriented architectures and data warehousing.22
4.105 Our findings are largely below these levels (although we highlight that the large, “bulge bracket” investment banks were mostly non-participants). Indeed, features such as algorithmic trading were of growing importance regardless of MiFID (although this measure will have provided added impetus to this development). It is interesting to note that the drivers of cost indentified in our study are, however, in line with these findings.
3AMLD
4.106 Again, with the exception of an outlier, “Northern” located firms have tended to have had to incur greater incremental implementation costs as a response to the 3AMLD than “Southern” peers.
22 http://www.hatstand-ltd.com/mifid_faqs.html
The One-off Costs of Compliance
www.europe-economics.com 89
Figure 4.19: Dispersion of the one-off costs of 3AMLD, by geographical location
Northern Southern0.00
0.25
0.50
0.75
1.00
1.25
5.50
5.75
6.00O
ne-o
ff co
sts
of c
ompl
ianc
e (a
s a
% o
f ope
ratin
g co
st)
Source: Interviews and EE analysis. “Northern” Member States covered include UK, Ireland, Germany, Austria, Netherlands, Sweden, Finland and Denmark. “Southern” Member States covered include France, Spain, Italy, Greece, Portugal, and Luxembourg.
Figure 4.20: Dispersion of the one-off costs of 3AMLD, by firm size
Small Large0.00
0.25
0.50
0.75
1.00
1.25
5.50
5.75
6.00
One
-off
cost
s of
com
plia
nce
(as
a %
of o
pera
ting
cost
)
Source: Interviews and EE analysis
4.107 The outlier was again driven by the very small size of the business in question.

The One-off Costs of Compliance
www.europe-economics.com 90
Financial Markets
4.108 In this section, we comment upon the drivers of incremental compliance costs incurred. We do not provide any analysis of the sector geographically or by size — the sample is sufficiently restricted in scale that further sub-division like this would be inappropriate.
4.109 A number of the Selected Directives were not directly relevant to this category. In particular, some — such as the Transparency Directive — are not directly applicable to financial markets. Notwithstanding this, our study illustrates that there are clear costs accruing within financial markets due to the implementation of these Directives.
Analysis by Directive
4.110 We present below a split of the costs incurred by Directive.
Table 4.30: Mean one-off costs as a proportion of operating expenses
Prospectus 0.67%FCD 0.00%CRD 0.00%Transparency 0.44%MiFID 1.46%3AMLD 0.16%
2.74%Other 0.67% of which other FSAP 0.40%Total 3.40%
Source: Interviews and EE analysis.
4.111 The high proportionate one-off costs incurred relate to:
– An outsourcing transaction by a specific exchange. This involved a significant initial outlay on IT to facilitate the transfer of activities to another party (to some extent, then, this high initial cost represents the capitalisation of the anticipated ongoing savings). This event was triggered by the implementation of the Prospectus and Transparency measures (see also 5.72 below).
– The very high cost experience of one of the other exchanges participating in the study.
4.112 The exceptional nature of these is clearly suggested by the marked gap between this mean and the much lower median.

The One-off Costs of Compliance
www.europe-economics.com 91
Table 4.31: Median one-off costs of the Selected Directives
Prospectus 0.18%FCD 0.00%CRD 0.00%Transparency 0.09%MiFID 0.93%3AMLD 0.03%Total 1.23%
Source: Interviews and EE analysis.
Table 4.32: One-off costs per firm as absolute values (€000s)
(€ 000s)Prospectus 137 FCD 0 CRD 1 Transparency 89 MiFID 298 3AMLD 33
558 Other 136 of which other FSAP 81 Total 694
Average of Operating Costs 20,403 Source: Interviews and EE analysis.
Cost drivers
4.113 The table below analyses the split of costs incurred in respect of Selected Directives.
Table 4.33: The drivers of one-off costs by Directive
Directive Prospectus FCD CRD Transparency MiFID 3AMLDFamiliarisation with Directive (%) 7% 100% 100% 30% 19% 41%Consultancy fees (%) 0% 0% 0% 0% 20% 0%Legal advice (%) 73% 0% 0% 1% 4% 16%Training (%) 18% 0% 0% 4% 8% 0%Staff recruitment costs (%) -18% 0% 0% 0% 0% 0%Investment/ updating IT (%) 2% 0% 0% 53% 31% 37%Project management (%) 18% 0% 0% 12% 19% 7%Other (%) 0% 0% 0% 0% 0% 0% Source: Interviews and EE analysis.
4.114 The main focus of compliance effort here is aimed at ensuring confidence in the market — that the market is demonstrably a fair market. This is seen as necessary in order to promote business, and particularly international business.

The One-off Costs of Compliance
www.europe-economics.com 92
4.115 It perhaps follows that the one-off costs of the financial markets have been extremely small in absolute terms by comparison to those incurred by firms in the other sectors. This is also in large part due to the measures studied having greater significance for market participants than for the markets themselves. For this reason, familiarisation with the directives is a highly significant category in a number of cases (i.e. understanding the measure sufficiently well to understand the ways in which it may be applicable).
4.116 Where changes to processes were involved, the implementation costs were heavily focused on IT spending. Again, it is stressed that the absolute sums involved were small in comparison to those incurred in the other sectors — however, the firms within the financial markets category are also typically much smaller organisations. Therefore, the relative impact (whilst relatively smaller) is not trivial. We report on the most significant directives only here.
Prospectus Directive
4.117 Apart from familiarisation with its content, the main drivers of cost have been activities such as the re-working of rulebooks (involving the sourcing of a significant level of legal advice) and the re-training of staff (surveillance staff) and/or the development of automated surveillance tools in the larger exchanges.
4.118 Some financial markets were also impacted as issuers in their own right.
Transparency Directive
4.119 Whilst financial markets were not typically directly affected by this Directive, there was an impact upon market participants that resulted in incremental costs being incurred that would not otherwise have been. Again, the re-writing of the Exchange's rulebooks is a prominent component here, together with some re-training of relevant surveillance staff.
MiFID
4.120 A number of the markets covered by our study incurred costs in looking at the potential opportunities around this measure. More direct compliance costs were incurred in changing the trading rules (and in some cases trading systems) and the inevitable re-training associated with that.
4.121 The ex ante assessment on behalf of the UK FSA (referred to above) included both the London Stock Exchange and ofex among those firms surveyed by LECG. This estimated the one-off costs for small investment firms (less than 100 employees) to be €112,500. This is broadly similar to the results obtained in our study — however, we stress that the LECG study was not limited to financial markets and was exclusively UK focused.

The Ongoing Cost of Compliance
www.europe-economics.com 93
5 THE ONGOING COST OF COMPLIANCE
Introduction
5.1 In this section we analyse the ongoing costs of compliance with financial services regulation. It is stressed that we have sought to measure incremental expenditure — in other words, those costs incurred that would not have been incurred without regulatory change.
5.2 To the extent that participating firms have been able to manage down the costs of complying with specific regulation (say, through a mechanism such as learning by doing so that the changed processes are increasingly absorbed into the costs of business as usual), then we have tried to capture this effect in the estimate of the recurring costs.
The Impact of Changing Financial Services Regulation
5.3 As with the previous section we present our results in a number of different ways in order to provide as full a picture as possible.
5.4 In the tables that follow we present three kinds of average:
(a) The median. If one imagines all the data points arranged sequentially, the median is simply the middle value in this series. The sequence from which we have selected the median is based upon the estimated ongoing costs of compliance expressed as a percentage of the relevant firm’s most recent operating expenditure.23 This selection has been performed Directive by Directive within each category or sub-category shown.
(b) The mean (expressed as a percentage). This is the aggregate ongoing costs of compliance expressed as a percentage of the relevant firms’ aggregated most recent annual operating expenditure. This implies that the experience of the larger firms will carry more weight in the sample or sub-sample presented. Again, this was performed on a Directive by Directive basis.
(c) The mean (as an absolute value). This is the average value (expressed in euros) for each firm of the ongoing costs incurred. Some firms were not able to provide an estimate of the cost impact of a specific measure or measures. We have shown the mean for each Directive based only upon those firms providing an answer. The figure for operating costs is the average across all firms. This means that the mean ongoing cost per Directive compared to the average operating costs will not necessarily
23 Operating expenditure has been defined as all of the expenses incurred between the gross profit line and EBITDA. This includes payroll costs, administrative overheads, IT costs, and costs associated with the occupancy of premises. Depreciation and amortisation are not included.

The Ongoing Cost of Compliance
www.europe-economics.com 94
equate exactly to the means expressed in percentage terms (since in many cases the numerators and denominators would not be exactly comparable).
5.5 The table below analyses the relative scale of the selected Directives, together with the impact of the other FSAP measures, and other regulation whether EU, nationally or extra-territorially derived.
Table 5.1: Mean ongoing costs expressed as a percentage of 2007 operating expenses
Banks & Financial
conglomerates Asset ManagersInvestment
BanksFinancial Markets
Prospectus 0.01% 0.16% 0.01% -0.15%FCD 0.00% 0.01% 0.00% 0.00%CRD 0.23% 0.06% 0.14% 0.00%Transparency 0.01% 0.08% 0.03% 0.33%MiFID 0.10% 0.30% 0.08% 1.09%3AMLD 0.08% 0.07% 0.05% 0.13%
0.43% 0.68% 0.32% 1.41%Other 0.16% 0.17% 0.07% 0.29% of which other FSAP 0.02% 0.02% 0.02% 0.24%Total 0.59% 0.85% 0.38% 1.70%
Source: Interviews and EE analysis.
5.6 It can be seen that the Selected Directives comprise a significant element of the total change: 74 per cent of the total impact for banks and financial conglomerates, 76 per cent for asset managers, 80 per cent for investment banks and 83 per cent for financial markets.24 Again, we set out the medians and the average absolute cost per firm below.
Table 5.2: Median ongoing costs of the Selected Directives
Banks & Financial
conglomerates Asset ManagersInvestment
BanksFinancial Markets
Prospectus 0.00% 0.00% 0.00% 0.00%FCD 0.00% 0.00% 0.00% 0.00%CRD 0.19% 0.00% 0.18% 0.00%Transparency 0.00% 0.01% 0.01% 0.00%MiFID 0.11% 0.07% 0.17% 0.14%3AMLD 0.09% 0.07% 0.08% 0.00%Total 0.39% 0.15% 0.45% 0.14% Source: Interviews and EE analysis.
24 Of course, given that the focus of the study is upon the Selected Directives it is possible that they have gained greater prominence in the minds of the interviewees than is actually the case. Whilst this bias is plausible, it seems highly unlikely that it would significantly affect the result (i.e. we do not believe that the Selected Directives are, in aggregate, anything less than significant). See also our discussion at 2.22 to 2.25 considering how the adjustment of product portfolios may tend to reduce the incremental ongoing cost impact of older regulations (the implementation of the Selected Directives is relatively recent, even ongoing in some cases in certain Member States).

The Ongoing Cost of Compliance
www.europe-economics.com 95
Table 5.3: Ongoing costs of the Selected Directives per firm in absolute terms (€000s)
Banks & Financial
conglomerates Asset ManagersInvestment
BanksFinancial Markets
Prospectus 143 301 72 -30FCD 51 57 41 0 CRD 3,163 242 1,445 0 Transparency 147 127 245 67 MiFID 1,316 830 832 223 3AMLD 1,195 278 464 27
6,015 1,833 3,098 287 Other 2,526 699 708 60 of which other FSAP 245 62 158 49 Total 8,540 2,532 3,807 347
Average of Operating Costs 1,558,072 384,582 1,030,071 20,403 Source: Interviews and EE analysis.
5.7 Most of the participants in our study found the estimate of ongoing costs an (even) more challenging exercise than the estimation of the one-off costs. With regards to one-off costs (particularly where a change to the company’s IT architecture was envisaged) there was often an implementation budget that served as a starting point for the consideration of the cost impact involved. By contrast, the objective in most firms is to absorb recurring costs into the cost of “business as usual” as rapidly as possible. A natural corollary of this is that the separate identification of the ongoing cost impact from the “noise” of the firm’s running costs is more difficult.
5.8 A number of previous studies have found recurring costs to be approximately 10 per cent of the implementation costs.25 Our data implies a higher ratio: with ongoing costs typically between 15 and 20 per cent of the one-off costs. The position with regard to financial markets is more complex — looking at the medians, ongoing costs are slightly above 10 per cent of the one-off costs, relative to operating costs. The means indicate that ongoing costs are significantly higher with reference to the implementation costs. The figures are heavily influenced by the high recurring costs experience of a particular market. The mean shown for the asset managers is also well above this band.
5.9 We have noted already that firms may be expected to manage down the recurring cost impact of regulation over time. The relative recentness of the Selected Directives should then, in part, account for the higher relationship that we have encountered.
25 See, for instance, the study conducted by Deloitte on behalf of the ABBL (http://www.abbl.lu/download/26550/0/Presentation.PDF).

The Ongoing Cost of Compliance
www.europe-economics.com 96
Synergies between the Measures
5.10 As noted in the previous section, very few businesses believed that any significant cost-reducing synergies had been achieved in the implementation of the various measures, and this has largely tracked through to the impact upon ongoing costs.
5.11 As has been noted in Section 4 above, a small number of institutions did feel that synergies had been achieved (or could be achieved) between 3AMLD and aspects of the MiFID. For the avoidance of doubt, our approach has been designed to avoid double-counting the costs where synergies have been achieved.
Banks and Financial Conglomerates
5.12 In this section, we comment upon the drivers of incremental compliance costs incurred and analyse the sector geographically and by size.
Analysis by geographical split
5.13 We present below an analysis by the geographical location of firms in our sample.
Table 5.4: Mean ongoing costs as a proportion of operating expenses by geographical split
"Northern" "Southern" New Prospectus 0.01% 0.02% 0.01%FCD 0.00% 0.00% 0.00%CRD 0.36% 0.09% 0.21%Transparency 0.01% 0.02% 0.02%MiFID 0.12% 0.07% 0.10%3AMLD 0.11% 0.05% 0.18%
0.61% 0.25% 0.52%Other 0.30% 0.02% 0.07% of which other FSAP 0% 0.01% 0.02%Total 0.92% 0.26% 0.59%
Source: Interviews and EE analysis. * For banks and financial conglomerates, “large” has been taken as in excess of €500m of operating expenses in the latest financial year for which we had the data available. “Northern” Member States covered include UK, Ireland, Germany, Austria, Netherlands, Sweden, Finland and Denmark. “Southern” Member States covered include France, Spain, Italy, Greece, Portugal, and Luxembourg. New Member States include Hungary, the Czech Republic, Bulgaria, Malta and Cyprus.
The Ongoing Cost of Compliance
www.europe-economics.com 97
Table 5.5: Median ongoing costs as a proportion of operating expenses of the Selected Directives by geographical split
"Northern" "Southern" New Prospectus 0.00% 0.07% 0.00%FCD 0.00% 0.00% 0.00%CRD 0.24% 0.33% 0.07%Transparency 0.00% 0.02% 0.00%MiFID 0.14% 0.05% 0.09%3AMLD 0.09% 0.34% 0.07%Total 0.46% 0.82% 0.23%
Source: Interviews and EE analysis. “Northern” Member States covered include UK, Ireland, Germany, Austria, Netherlands, Sweden, Finland and Denmark. “Southern” Member States covered include France, Spain, Italy, Greece, Portugal, and Luxembourg. New Member States include Hungary, the Czech Republic, Bulgaria, Malta and Cyprus.
5.14 The mean results for the “Southern” group are influenced by relatively low cost impacts for some of the larger participating banks in that segment.
Table 5.6: Ongoing costs as average absolute values by geographical split (€000s)
"Northern" "Southern" New Prospectus 130 263 7 FCD 81 43 12 CRD 5,940 2,072 256 Transparency 136 235 33 MiFID 1,984 1,337 267 3AMLD 1,775 955 466
10,045 4,904 1,040 Other 5,030 590 188 of which other FSAP 399 182 49 Total 15,075 5,494 1,229
Average of Operating Costs 1,654,761 2,695,869 262,055 Source: Interviews and EE analysis. “Northern” Member States covered include UK, Ireland, Germany, Austria, Netherlands, Sweden, Finland and Denmark. “Southern” Member States covered include France, Spain, Italy, Greece, Portugal, and Luxembourg. New Member States include Hungary, the Czech Republic, Bulgaria, Malta and Cyprus.

The Ongoing Cost of Compliance
www.europe-economics.com 98
Figure 5.1: The dispersion of ongoing costs (expressed as a percentage of operating costs) by geographical region
Northern Southern New0
1
2
3
4
5
24
25
26O
ngoi
ng c
osts
of c
ompl
ianc
e (a
s a
% o
f ope
ratin
g co
sts)
Source: Interviews and EE analysis. “Northern” Member States covered include UK, Ireland, Germany, Austria, Netherlands, Sweden, Finland and Denmark. “Southern” Member States covered include France, Spain, Italy, Greece, Portugal, and Luxembourg. New Member States include Hungary, the Czech Republic, Bulgaria, Malta and Cyprus.
5.15 One firm based in the New Member States experienced ongoing costs well in excess of the incremental cost impact for the other banks and financial conglomerates in our sample. This firm had significantly higher ongoing costs than its peers. Clearly, this firm’s experience is an outlier, however, it is worth noting that this bank is very small and had an extremely low implementation cost for the Selected Directives.
Analysis by firm size
5.16 We present below an analysis by the size of firms in our sample.

The Ongoing Cost of Compliance
www.europe-economics.com 99
Table 5.7: Mean ongoing costs as a proportion of operating expenses by size of firm*
Small LargeProspectus 0.09% 0.01%FCD 0.01% 0.00%CRD 0.31% 0.23%Transparency 0.07% 0.01%MiFID 0.31% 0.09%3AMLD 0.23% 0.07%
1.01% 0.40%Other 0.23% 0.15% of which other FSAP 0.07% 0.01%Total 1.24% 0.55% Source: Interviews and EE analysis. * For banks and financial conglomerates, “large” has been taken as in excess of €500m of operating expenses in the latest financial year for which we had the data available.
Table 5.8: Median ongoing compliance costs of the Selected Directives by size of firm
Small LargeProspectus 0.00% 0.00%FCD 0.00% 0.00%CRD 0.20% 0.17%Transparency 0.00% 0.01%MiFID 0.16% 0.07%3AMLD 0.17% 0.08%Total 0.52% 0.33% Source: Interviews and EE analysis.
5.17 Looking at the Selected Directives, the ongoing relative cost impact has been higher in smaller banks by comparison to their larger peers (although the differential is less marked with reference to the median results).

The Ongoing Cost of Compliance
www.europe-economics.com 100
Table 5.9: Ongoing costs as average absolute values by size of firm (€000s)
Small LargeProspectus 116 183 FCD 12 117 CRD 381 9,559 Transparency 101 216 MiFID 367 3,068 3AMLD 276 2,667
1,254 15,810 Other 280 6,120 of which other FSAP 83 503 Total 1,533 21,929
Average of Operating Costs 120,029 3,715,136 Source: Interviews and EE analysis.
Figure 5.2: The dispersion of ongoing costs (expressed as a percentage of operating
costs) size of firm
Small0
1
2
3
4
5
24
25
26
Ong
oing
cos
ts o
f com
plia
nce
(as
a %
of o
pera
ting
cost
s)
Source: Interviews and EE analysis.
Cost drivers
5.18 The table below analyses the split of costs incurred in respect of Selected Directives.
The Ongoing Cost of Compliance
www.europe-economics.com 101
Table 5.10: The drivers of ongoing costs by Directive
Prospectus FCD CRD Transparency MiFID 3AMLDAdditional staff 37% 6% 43% 15% 35% 37%Internal reporting 2% 7% 8% 4% 7% 4%IT 15% 6% 26% 49% 28% 31%External reporting 16% 65% 10% 8% 10% 5%Training 19% 4% 6% 8% 10% 13%Audit 10% 11% 7% 15% 9% 10%Other 0% 0% 0% 0% 0% 0% Source: Interviews and EE analysis.
Financial Conglomerates Directive
5.19 Ongoing costs here include information gathering for the calculation of capital adequacy tests (to the extent that this has not been automated) and the internal monitoring and external reporting on risk concentrations and net exposure (at a group level).
5.20 The ongoing costs of the participating financial conglomerates alone were (in line with the implementation costs) approximately double those of the sample as a whole (the mean ongoing cost amongst financial conglomerates was 0.006 per cent, against 0.003 per cent for the entire sample — i.e. relatively twice as much).
5.21 The financial conglomerates participating in our study did not identify other costs relating to this measure. One participant stated a belief that the Financial Conglomerates Directive had restricted certain business opportunities, but was not able to provide further detail of its own experience.
CRDs
5.22 We represent the dispersion of the ongoing cost impacts experienced by study participants below.

The Ongoing Cost of Compliance
www.europe-economics.com 102
Figure 5.3: Dispersion of the ongoing costs of the CRDs by geographical location
Northern Southern New0.0
0.5
1.0
1.5
2.0
2.5
8.0
8.5
9.0O
ngoi
ng c
osts
of c
ompl
ianc
e (a
s a
% o
f ope
ratin
g co
sts)
Source: Interviews and EE analysis. “Northern” Member States covered include UK, Ireland, Germany, Austria, Netherlands, Sweden, Finland and Denmark. “Southern” Member States covered include France, Spain, Italy, Greece, Portugal, and Luxembourg. New Member States include Hungary, the Czech Republic, Bulgaria, Malta and Cyprus.
Figure 5.4: Dispersion of the ongoing costs of the CRDs by firm size
Small Large0.0
0.5
1.0
1.5
2.0
2.5
8.0
8.5
9.0
Ong
oing
cos
ts o
f com
plia
nce
(as
a %
of o
pera
ting
cost
s)
Source: Interviews and EE analysis.
5.23 As indicated in the previous section, for most participants implementation of the CRD involved a significant IT project, and this is linked to on-going expenditure on licensing fees and/or in-house maintenance and trouble-shooting.

The Ongoing Cost of Compliance
www.europe-economics.com 103
5.24 The additional people have been largely recruited to maintain risk models (for instance the ongoing validation of the models themselves and the associated parameters that populate them) and monitor and/or meet external reporting requirements. The extent of the reporting requirements varies across Member States: in the UK it is largely by exception only, whereas in, say, Sweden, mandatory quarterly reporting is required (and with a significant increase in the volume of data reported on). The view was expressed by many transnational participants that some harmonisation of the regulator’s reporting requirements across Member States would be helpful to the future control of costs.
5.25 The benefits of Basel II have not been felt evenly. A number of interviewees believed it to be particularly favourable to banks with a significant retail loan book. Indeed, this is exactly what one would expect. The CEBS Quantitative Impact Study26 found the largest decrease in regulatory capital was then expected to be due to residential mortgage exposures, followed by other retail exposures (all with reference to the framework prior to the CRDs). The reductions reported in this CEBS study were larger for the IRB approach (either Foundation or Advanced) by comparison to the standard approach. Corporate exposures (including SMEs) accounted for the third largest expected reduction. Charges for operational risk capital represented the largest increase in minimum required capital levels due to the implementation of the CRDs.
5.26 It is highlighted that a number of banks which could have benefitted under CRD from reducing their risk-weighted capital have not in fact done so. The main factors cited were:
– The need to satisfy investors/the market (even if not a quoted entity) in order to maintain share-holder value and facilitate any future capital-raising requirements.
– The difficult current market conditions have encouraged banks to maintain additional capital over and above what their risk models indicate is necessary (which, if the risk models have been recalibrated to reflect current market conditions, would presumably be higher now anyway).
5.27 This means that savings that might have been expected to arise in the medium term have not yet done so (and are not expected to do so any time soon). Indeed, CEBS in its Quantitative Impact Study noted that the reductions in regulatory capital identified in its survey might have been influenced by the then prevailing “favourable macroeconomic situation”.
MiFID
5.28 The provisions of MiFID will apply where individual portfolio management is undertaken (a business operating exclusively collective portfolio management would fall under the
26 CEBS, Quantitative Impact Study 5: Overview on the Results of the EU countries (June 2006). This surveyed 262 banks.

The Ongoing Cost of Compliance
www.europe-economics.com 104
UCITS regime — indeed, a number of asset managers are organised in a legal structure to reflect this, i.e. sister MiFID and UCITS businesses).
5.29 Where a high degree of automation has been achieved, the ongoing costs in respect of MiFID are much less significant than the original implementation. The typical sources of ongoing cost include:
– Monitoring of best execution, pre- and post-trade transparency requirements (this has been largely automated so that the cost is either in the form of internal IT spending or licensing fees to external vendors).
– Data storage costs.
– Additional staff to conduct transaction reporting on an ongoing basis (however, the headcount increase is typically not more than one or two FTEs).27
5.30 A small number of participants believed themselves to be spending proportionately more each year due to MiFID than was spent on its original implementation. This may reflect an incomplete automation of the relevant processes.
5.31 Some study participants felt that transaction times themselves had increased due to the impact of MiFID. However, the impact of this was not significant (although this effect may have been dampened in some instances by current market conditions reducing overall activity levels anyway).
5.32 We represent the dispersion of the ongoing cost impacts experienced by study participants below.
27 An FTE or Full-Time Equivalent is a concept to convert all workers, including temporary and part-time workers, into the equivalent number as if employed on a full-time basis.

The Ongoing Cost of Compliance
www.europe-economics.com 105
Figure 5.5: Dispersion of the ongoing costs of MiFID by geographical location
Northern Southern New0.0
0.2
0.4
0.6
0.8
1.0
3.6
3.8O
ngoi
ng c
osts
of c
ompl
ianc
e (a
s a
% o
f ope
ratin
g co
sts)
Source: Interviews and EE analysis. “Northern” Member States covered include UK, Ireland, Germany, Austria, Netherlands, Sweden, Finland and Denmark. “Southern” Member States covered include France, Spain, Italy, Greece, Portugal, and Luxembourg. New Member States include Hungary, the Czech Republic, Bulgaria, Malta and Cyprus.
Figure 5.6: Dispersion of the ongoing costs of MiFID by firm size
Small Large0.0
0.2
0.4
0.6
0.8
1.0
3.6
3.8
Ong
oing
cos
ts o
f com
plia
nce
(as
a %
of o
pera
ting
cost
s)
Source: Interviews and EE analysis.
5.33 Again, our evidence suggests that smaller firms are incurring slightly greater proportionate expenses in respect of MiFID. As an aside, participants noted that by giving a legal framework to MTFs, MiFID has reduced trading costs and encouraged new business.

The Ongoing Cost of Compliance
www.europe-economics.com 106
3AMLD
5.34 In a few Member States there remains some uncertainty over the 3AMLD. The fact that this measure remains under discussion creates a saliency for it that might potentially increase its apparent weighting amongst FSAP costs.
Figure 5.7: Dispersion of the ongoing costs of 3AMLD by geographical location
Northern Southern New0.0
0.5
1.0
3.5
4.0
Ong
oing
cos
ts o
f com
plia
nce
(as
a %
of o
pera
ting
cost
s)
Source: Interviews and EE analysis. “Northern” Member States covered include UK, Ireland, Germany, Austria, Netherlands, Sweden, Finland and Denmark. “Southern” Member States covered include France, Spain, Italy, Greece, Portugal, and Luxembourg. New Member States include Hungary, the Czech Republic, Bulgaria, Malta and Cyprus.
Figure 5.8: Dispersion of the ongoing costs of 3AMLD by firm size
Small Large0.0
0.5
1.0
3.5
4.0
Ong
oing
cos
ts o
f com
plia
nce
(as
a %
of o
pera
ting
cost
s)
Source: Interviews and EE analysis

The Ongoing Cost of Compliance
www.europe-economics.com 107
5.35 A small number of participants regard the anti-money laundering regime in general as involving costs disproportionate to any plausible beneficial effect. The majority, however, viewed it as an inevitable part of business as usual, with a few believing there to be benefits in being “ahead of the game” in this regard (for instance, from the perspective of better managing reputational risk). In addition, a number of participants have welcomed aspects of the 3AMLD — specifically, that it contains risk-based features. A not uncommon view would be that its ongoing incremental impact would have been slight (or even negative) were it not for the broadened scope (to include, for instance, PEPs). However, a few participants expressed the view that the money laundering directives (in general) involved costs disproportionate to any plausible beneficial effect.
5.36 Ongoing training is not insignificant, as illustrated in the table below (although interviewees were not in agreement as to whether the 3AMLD increased the intensity of training required — i.e. whether or not the duration of the training sessions increased or were rolled out to a broader set of employees). However, it is highlighted that once e-learning or class-based training modules are developed (see one-off costs), the ongoing requirement in cash cost terms is mitigated.
5.37 Some participants remain sceptical about e-learning generally. It is seen by such firms as a “quick fix”, in essence allowing maximum access to training for more people in less time. However, these firms considered it inevitable that it would require supplementation by more traditional (and more expensive) classroom-based approaches.
5.38 It is noted that whereas large banks spent proportionately more than small ones on training as a one-off cost, the proportion of training within ongoing costs is less. This would be consistent with larger banks being more reliant on e-learning and e-training.
Table 5.11: The drivers of ongoing costs due to 3AMLD by firm size
Small LargeAdditional staff 30% 38%Internal reporting 4% 4%IT 21% 32%External reporting 2% 6%Training 26% 11%Audit 15% 9%Other 0% 0% Source: Interviews and EE analysis.
5.39 As noted in our analysis of one-off costs, a number of firms have invested in automated approaches to the tracking and screening of relevant parties. This typically involves access costs to various databases (of PEPs, watch lists, and so on), hence justifies the relatively high ongoing IT spend.
5.40 However, whilst some firms (generally larger banks) see automation as the only way to provide the necessary evidence of an audit trail to the regulatory authorities in the event of

The Ongoing Cost of Compliance
www.europe-economics.com 108
problems arising (as well as being cost effective by comparison to manual effort), a number of firms have retained significant (or total) human oversight in this area.
Asset Managers
5.41 In this section, we comment upon the drivers of incremental compliance costs incurred and analyse the sector geographically and by size.
Analysis by geographical split and size
5.42 We present below a geographical split of the costs incurred.
Table 5.12: Mean ongoing costs as a proportion of operating expenses by geographical split
"Northern" "Southern" New Prospectus 0.01% 0.39% 0.00%FCD 0.05% 0.00% 0.00%CRD 0.20% 0.01% 0.00%Transparency 0.08% 0.00% 0.00%MiFID 0.30% 0.28% 1.65%3AMLD 0.13% 0.05% 0.01%
0.77% 0.74% 1.66%Other 0.23% 0.14% 2.32% of which other FSAP 0.02% 0.00% 2.25%Total 0.99% 0.88% 3.98%
Source: Interviews and EE analysis. “Northern” Member States covered include UK, Ireland, Germany, Austria, Netherlands, Sweden, Finland and Denmark. “Southern” Member States covered include France, Spain, Italy, Greece, Portugal, and Luxembourg. New Member States include Hungary, the Czech Republic, Bulgaria, Malta and Cyprus.
Table 5.13: Median ongoing costs of the Selected Directives by geographical split
"Northern" "Southern" New Prospectus 0.00% 0.00% 0.00%FCD 0.00% 0.00% 0.00%CRD 0.02% 0.00% 0.00%Transparency 0.01% 0.00% 0.00%MiFID 0.07% 0.05% 1.27%3AMLD 0.05% 0.18% 0.00%Total 0.16% 0.23% 1.27%
Source: Interviews and EE analysis. “Northern” Member States covered include UK, Ireland, Germany, Austria, Netherlands, Sweden, Finland and Denmark. “Southern” Member States covered include France, Spain, Italy, Greece, Portugal, and Luxembourg. New Member States include Hungary, the Czech Republic, Bulgaria, Malta and Cyprus.
5.43 The medians presented above — particularly for large firms based in both “Northern” and “Southern” Member States — differ from the means due to the influence of relatively high-cost outlying large firms influencing the mean upwards.

The Ongoing Cost of Compliance
www.europe-economics.com 109
Table 5.14: Ongoing costs per firm (€000s) by geographical split
"Northern" "Southern" New Prospectus 29 860 - FCD 129 5 - CRD 479 102 0 Transparency 202 1 - MiFID 720 1,330 169 3AMLD 307 384 1
1,868 2,682 170 Other 557 1,085 237 of which other FSAP 37 6 230 Total 2,425 3,767 407
Average of Operating Costs 243,913 695,408 10,238 Source: Interviews and EE analysis. “Northern” Member States covered include UK, Ireland, Germany, Austria, Netherlands, Sweden, Finland and Denmark. “Southern” Member States covered include France, Spain, Italy, Greece, Portugal, and Luxembourg. New Member States include Hungary, the Czech Republic, Bulgaria, Malta and Cyprus.
Analysis by firm size
5.44 We present below a split of the costs incurred by firm size.
Table 5.15: Mean ongoing costs as a proportion of operating expenses by firm size
Small LargeProspectus 0.01% 0.17%FCD 0.00% 0.01%CRD 0.02% 0.06%Transparency 0.01% 0.09%MiFID 0.36% 0.29%3AMLD 0.12% 0.07%
0.51% 0.69%Other 0.54% 0.16% of which other FSAP 0.42% 0.00%Total 1.05% 0.86% Source: Interviews and EE analysis.

The Ongoing Cost of Compliance
www.europe-economics.com 110
Table 5.16: Median ongoing compliance costs of the Selected Directives by firm size
Small LargeProspectus 0.00% 0.00%FCD 0.00% 0.00%CRD 0.00% 0.02%Transparency 0.00% 0.02%MiFID 0.08% 0.05%3AMLD 0.08% 0.05%Total 0.16% 0.14% Source: Interviews and EE analysis.
5.45 The medians presented differ significantly from the averages set out previously. This is driven by a significant minority of asset managers (of all sizes) having a very low (even nil) identifiable cost impact due to some of the Selected Directives (which, in particular, drives down the median value) and a few large firms having a relatively high cost experience (which, in particular, drives up the mean).
Table 5.17: Ongoing costs per firm as absolute values by firm size (€000s)
Small LargeProspectus 2 699 FCD 0 122 CRD 3 521 Transparency 1 288 MiFID 72 1,794 3AMLD 24 574
102 3,998 Other 112 1,383 of which other FSAP 88 33 Total 214 5,381
Average of Operating Costs 19,266 841,228 Source: Interviews and EE analysis.
Cost drivers
5.46 The table below analyses the split of costs incurred in respect of Selected Directives.
Table 5.18: The drivers of ongoing costs by Directive
Directive Prospectus FCD CRD Transparency MiFID 3AMLDAdditional staff 50% 0% 25% 69% 20% 13%Internal reporting 0% 3% 6% 0% 12% 3%IT 50% 0% 13% 17% 28% 27%External reporting 0% 97% 30% 1% 17% 14%Training 0% 0% 11% 1% 7% 22%Audit 0% 0% 15% 12% 16% 21%Other 0% 0% 0% 0% 0% 0% Source: Interviews and EE analysis

The Ongoing Cost of Compliance
www.europe-economics.com 111
Transparency Directive
5.47 Even in those participants who made specific IT investment in order to automate their ongoing disclosure requirements, typically there has been a requirement to increase staffing levels in order to maintain such systems and ensure some oversight of them.
Figure 5.9: Dispersion of the ongoing costs of the Transparency Directive by firm size
Small Large0.00
0.05
0.10
0.15
0.20
0.25
Ong
oing
cos
ts o
f com
plia
nce
(as
a %
of o
pera
ting
cost
s)
Source: Interviews and EE analysis.
5.48 Some larger asset managers view the Transparency Directive as something of a missed opportunity to reduce costs (e.g. through reduced fines for late or non-disclosure of holdings) due to the minimum harmonisation approach adopted in its implementation. The key issue encountered is the need to keep an eye on the local implementation which has not (in many cases) reduced the number of share-holding limits that a transnational business needs to be aware of.
5.49 A specific issue was raised in respect of the application of this Directive in Germany, in connection with the application of the major shareholding notification rules to corporate group structures. The problem identified was that the criteria which trigger major shareholder reporting obligations (e.g. direct shareholding, the exercise of proxy voting rights) apply to a number of legal entities within the group and, in the absence of appropriate aggregation rules or a group exemption to report only at parent level (which in Germany applies to share-holdings, but not voting rights), each of these legal entities is required to file in respect of what are essentially the same voting rights.
5.50 Aside from the cost incurred, a potentially more material concern would be that such “over-reporting” of holdings could confuse the market (i.e. if the market takes each entity reporting a share-holding to be discrete and simply aggregates the reported holdings rather than treating then as being essentially the same). However, it was noted in the
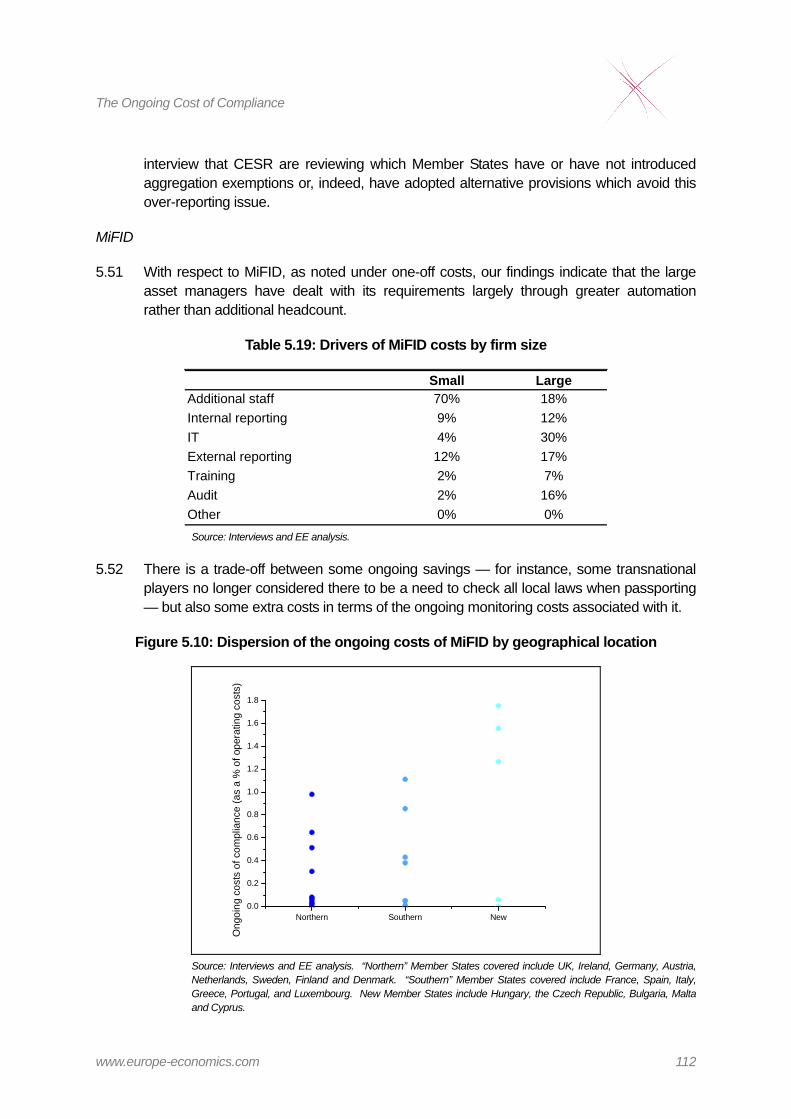
The Ongoing Cost of Compliance
www.europe-economics.com 112
interview that CESR are reviewing which Member States have or have not introduced aggregation exemptions or, indeed, have adopted alternative provisions which avoid this over-reporting issue.
MiFID
5.51 With respect to MiFID, as noted under one-off costs, our findings indicate that the large asset managers have dealt with its requirements largely through greater automation rather than additional headcount.
Table 5.19: Drivers of MiFID costs by firm size
Small LargeAdditional staff 70% 18%Internal reporting 9% 12%IT 4% 30%External reporting 12% 17%Training 2% 7%Audit 2% 16%Other 0% 0% Source: Interviews and EE analysis.
5.52 There is a trade-off between some ongoing savings — for instance, some transnational players no longer considered there to be a need to check all local laws when passporting — but also some extra costs in terms of the ongoing monitoring costs associated with it.
Figure 5.10: Dispersion of the ongoing costs of MiFID by geographical location
Northern Southern New0.0
0.2
0.4
0.6
0.8
1.0
1.2
1.4
1.6
1.8
Ong
oing
cos
ts o
f com
plia
nce
(as
a %
of o
pera
ting
cost
s)
Source: Interviews and EE analysis. “Northern” Member States covered include UK, Ireland, Germany, Austria, Netherlands, Sweden, Finland and Denmark. “Southern” Member States covered include France, Spain, Italy, Greece, Portugal, and Luxembourg. New Member States include Hungary, the Czech Republic, Bulgaria, Malta and Cyprus.

The Ongoing Cost of Compliance
www.europe-economics.com 113
5.53 It is noteworthy that some smaller asset managers — based in the New Member States — are experiencing significant ongoing costs in respect of MiFID. Our work indicates this is in part a reflection of relatively low one-off costs (in other words, by spending less on upfront, automated solutions, compliance requires greater ongoing effort, e.g. in additional staffing).
Figure 5.11: Dispersion of the ongoing costs of MiFID by firm size
Small Large0.0
0.2
0.4
0.6
0.8
1.0
1.2
1.4
1.6
1.8
Ong
oing
cos
ts o
f com
plia
nce
(as
a %
of o
pera
ting
cost
s)
Source: Interviews and EE analysis.
5.54 The median ongoing cost impact of MiFID for larger asset managers was in the order of €300,000. The LECG study of investment firms in the UK (which included but was not focused exclusively on asset managers) had a median ongoing cost of €110,000 and €667,000 for medium and large investment firms respectively. Our definition of large would approximately cover both of these categories, and so our study’s findings are broadly in line with these results.
5.55 For small investment firms, the median ongoing cost for asset managers in our study was estimated at a mere €14,000 — LECG’s estimate for small investment firms (i.e. not just asset managers) was about €33,000. The participants in our study, of course, are more geographically diverse — in particular, a number of the smaller asset managers are based in the New Member States (and had generally low ongoing costs).
5.56 It is noted that a small but not insignificant number of interviewees would welcome the application of MiFID to all product categories. For instance, the view was expressed that businesses dealing in different products could perform essentially the same processes but apply different standards depending on whether MiFID or the UCITS Directives applied.
5.57 However, there are some concerns with the application of MiFID on a day-to-day basis. For example, the practical application of the “inducements” clause differs as to what is

The Ongoing Cost of Compliance
www.europe-economics.com 114
taken to constitute gifts and entertainment between the UK and Germany. Issues such as these consume the time of both compliance and operational workers.
3AMLD
5.58 Focused on asset managers with a largely retail client base, there has been an increase in headcount dedicated to AML and CTF activities, typically supported by an increased IT commitment (particularly for the larger firms). This mirrors the non-recurring cost experience (where significant IT investment was made by larger firms). In particular, a number of firms have moved towards automated pre-client acceptance checks and ongoing checks against external databases of PEPs, and so on. The cost of access to such databases is non-trivial.
Table 5.20: Cost drivers of the 3AMLD
Small LargeAdditional staff 10% 13%Internal reporting 7% 3%IT 17% 28%External reporting 12% 15%Training 43% 21%Monitoring/audit 12% 21%Other 0% 0% Source: Interviews and EE analysis.

The Ongoing Cost of Compliance
www.europe-economics.com 115
5.59 With the exception of a small number of outliers, the ongoing cost experience has been higher for “Southern”-based asset managers.
Figure 5.12: Dispersion of the ongoing costs of 3AMLD by geographical location
Northern Southern New0.0
0.1
0.2
0.3
0.4
0.5
0.6
0.7
0.8
0.9
4.9
5.0
5.1
Ong
oing
cos
ts o
f com
plia
nce
(as
a %
of o
pera
ting
cost
s)
Source: Interviews and EE analysis. “Northern” Member States covered include UK, Ireland, Germany, Austria, Netherlands, Sweden, Finland and Denmark. “Southern” Member States covered include France, Spain, Italy, Greece, Portugal, and Luxembourg. New Member States include Hungary, the Czech Republic, Bulgaria, Malta and Cyprus.
Figure 5.13: Dispersion of the ongoing costs of 3AMLD by firm size
Small Large0.0
0.1
0.2
0.3
0.4
0.5
0.6
0.7
0.8
0.9
4.9
5.0
5.1
Ong
oing
cos
ts o
f com
plia
nce
(as
a %
of o
pera
ting
cost
s)
Source: Interviews and EE analysis.

The Ongoing Cost of Compliance
www.europe-economics.com 116
5.60 As can be seen in the charts above, one asset management firm has ongoing costs of compliance with the Third Anti-money Laundering Directive several orders of magnitude larger than the other asset managers interviewed. The same firm had the highest one-off cost of compliance with the Third Anti-money Laundering Directive as well; this is largely due to the exceptional nature of their business model.
Investment Banks
5.61 In this section, we comment upon the drivers of incremental compliance costs incurred and analyse the sector geographically and by size.
Analysis by geographical split
5.62 We present below a geographical split of the costs incurred.
Table 5.21: Mean ongoing costs as a proportion of operating expenses, by geographical split
"Northern" "Southern" Prospectus 0.00% 0.02%FCD 0.00% 0.01%CRD 0.20% 0.12%Transparency 0.03% 0.04%MiFID 0.17% 0.08%3AMLD 0.05% 0.04%
0.45% 0.31%Other 0.09% 0.06% of which other FSAP 0.04% 0.00%Total 0.54% 0.36% Source: Interviews and EE analysis. “Northern” Member States covered include UK, Ireland, Germany, Austria, Netherlands, Sweden, Finland and Denmark. “Southern” Member States covered include France, Spain, Italy, Greece, Portugal, and Luxembourg.
Table 5.22: Median ongoing costs of the Selected Directives, by geographical split
"Northern" "Southern" Prospectus 0.00% 0.07%FCD 0.00% 0.00%CRD 0.14% 0.33%Transparency 0.01% 0.10%MiFID 0.15% 0.17%3AMLD 0.05% 0.19%Total 0.34% 0.86% Source: Interviews and EE analysis. “Northern” Member States covered include UK, Ireland, Germany, Austria, Netherlands, Sweden, Finland and Denmark. “Southern” Member States covered include France, Spain, Italy, Greece, Portugal, and Luxembourg.
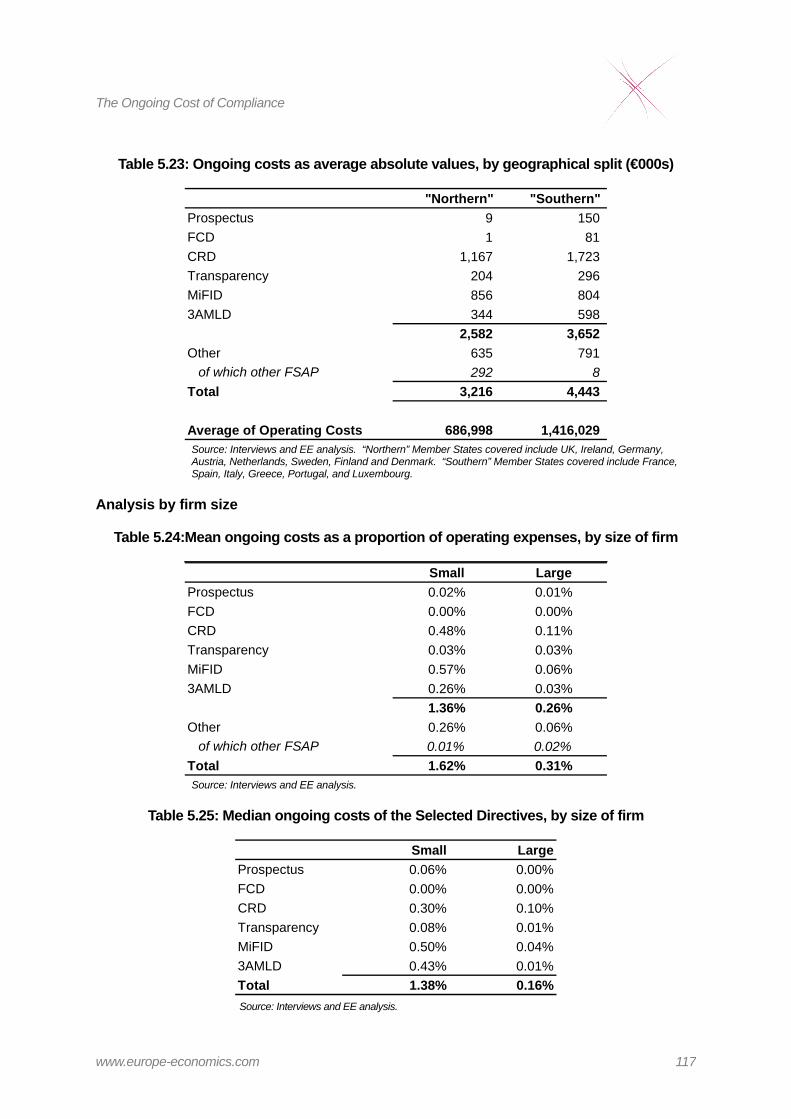
The Ongoing Cost of Compliance
www.europe-economics.com 117
Table 5.23: Ongoing costs as average absolute values, by geographical split (€000s)
"Northern" "Southern" Prospectus 9 150 FCD 1 81 CRD 1,167 1,723 Transparency 204 296 MiFID 856 804 3AMLD 344 598
2,582 3,652 Other 635 791 of which other FSAP 292 8 Total 3,216 4,443
Average of Operating Costs 686,998 1,416,029 Source: Interviews and EE analysis. “Northern” Member States covered include UK, Ireland, Germany, Austria, Netherlands, Sweden, Finland and Denmark. “Southern” Member States covered include France, Spain, Italy, Greece, Portugal, and Luxembourg.
Analysis by firm size
Table 5.24:Mean ongoing costs as a proportion of operating expenses, by size of firm
Small LargeProspectus 0.02% 0.01%FCD 0.00% 0.00%CRD 0.48% 0.11%Transparency 0.03% 0.03%MiFID 0.57% 0.06%3AMLD 0.26% 0.03%
1.36% 0.26%Other 0.26% 0.06% of which other FSAP 0.01% 0.02%Total 1.62% 0.31% Source: Interviews and EE analysis.
Table 5.25: Median ongoing costs of the Selected Directives, by size of firm
Small LargeProspectus 0.06% 0.00%FCD 0.00% 0.00%CRD 0.30% 0.10%Transparency 0.08% 0.01%MiFID 0.50% 0.04%3AMLD 0.43% 0.01%Total 1.38% 0.16% Source: Interviews and EE analysis.

The Ongoing Cost of Compliance
www.europe-economics.com 118
Table 5.26: Ongoing costs as average absolute values, by size of firm (€000s)
Small LargeProspectus 6 123 FCD 1 92 CRD 646 2,511 Transparency 9 431 MiFID 719 1,002 3AMLD 330 614
1,712 4,773 Other 329 1,135 of which other FSAP 11 325 Total 2,040 5,908
Average of Operating Costs 126,349 2,046,759 Source: Interviews and EE analysis
Cost drivers
5.63 The table below analyses the split of costs incurred in respect of Selected Directives.
Table 5.27: The drivers of ongoing costs by Directive
Directive Prospectus FCD CRD Transparency MiFID 3AMLDAdditional staff 0% 0% 34% 33% 26% 23%Internal reporting 0% 23% 7% 7% 6% 12%IT 1% 35% 32% 19% 45% 29%External reporting 48% 12% 10% 8% 13% 9%Training 47% 31% 6% 12% 6% 16%Monitoring/audit 3% 0% 10% 21% 4% 10%Other 0% 0% 0% 0% 0% 0% Source: Interviews and EE analysis.
5.64 Again, there is significant common ground between the experience of banks and investment banks. We comment on some of the more major differentiating factors below.
CRDs
5.65 Bearing in mind the relatively small number of participants, there is little differentiation between how smaller investment banks have adapted to the CRDs by comparison to the larger ones (additional staff and IT costs represent the majority of the compliance costs in both cases).

The Ongoing Cost of Compliance
www.europe-economics.com 119
Table 5.28: Ongoing cost drivers of the CRDs
Small LargeAdditional staff 35% 34%Internal reporting 1% 10%IT 34% 31%External reporting 15% 8%Training 8% 5%Monitoring/audit 7% 12%Other 0% 0% Source: Interviews and EE analysis.
MiFID
5.66 In respect of MiFID, there is a clear demarcation apparent suggesting that “Northern” based firms have placed greater reliance on automation (this mirrors the balance of allocation within one-off costs).
Table 5.29: Ongoing cost drivers of MiFID
"Northern" "Southern"Additional staff 26% 26%Internal reporting 2% 12%IT 59% 22%External reporting 4% 30%Training 3% 10%Monitoring/audit 6% 0%Other 0% 0% Source: Interviews and EE analysis. “Northern” Member States covered include UK, Ireland, Germany, Austria, Netherlands, Sweden, Finland and Denmark. “Southern” Member States covered include France, Spain, Italy, Greece, Portugal, and Luxembourg.
5.67 There is no significant differentiation in the mix of spending by firm size.

The Ongoing Cost of Compliance
www.europe-economics.com 120
Figure 5.14: Dispersion of the ongoing costs of MiFID by geographical location
Northern Southern0.0
0.2
0.4
0.6
0.8
2.2
2.4
2.6
2.8
3.0O
ngoi
ng c
osts
of c
ompl
ianc
e (a
s a
% o
f ope
ratin
g co
st)
Source: Interviews and EE analysis. “Northern” Member States covered include UK, Ireland, Germany, Austria, Netherlands, Sweden, Finland and Denmark. “Southern” Member States covered include France, Spain, Italy, Greece, Portugal, and Luxembourg.
Figure 5.15: Dispersion of the ongoing costs of MiFID by firm size
Small Large0.00
0.25
0.50
2.25
2.50
2.75
3.00
Ong
oing
cos
ts o
f com
plia
nce
(as
a %
of o
pera
ting
cost
)
Source: Interviews and EE analysis.
5.68 Two “Southern” investment banks have much larger ongoing costs of compliance with MiFID than the other investment banks that were interviewed. Both of these firms were rather small, and the impact of additional staff, external reporting requirements and ongoing IT costs represented a large proportion of operating expenses.

The Ongoing Cost of Compliance
www.europe-economics.com 121
3AMLD
5.69 The majority of ongoing costs are clearly focused upon people, IT and training. This is in line with the experience of the banks and asset managers.
Table 5.30: Ongoing cost drivers of 3AMLD
Small LargeAdditional staff 35% 15%Internal reporting 12% 12%IT 28% 30%External reporting 5% 12%Training 17% 15%Monitoring/audit 4% 15%Other 0% 0% Source: Interviews and EE analysis.
Financial Markets
5.70 In this section, we comment upon the drivers of incremental compliance costs incurred and analyse the sector geographically and by size.
Analysis
5.71 We present below the split of the costs incurred.
Table 5.31: Mean ongoing costs as a proportion of operating expenses
Prospectus -0.15%FCD 0.00%CRD 0.00%Transparency 0.33%MiFID 1.09%3AMLD 0.13%
1.41%Other 0.29% of which other FSAP 0.24%Total 1.70%
Source: Interviews and EE analysis.
5.72 The negative costs relating to the Prospectus has been driven by a specific transaction described in the previous section (see 4.111). As noted previously, another exchange had a high cost experience (particularly with reference to MiFID and the Transparency Directive). These factors drive a marked distinction between the means and the median recurring costs (as illustrated below).
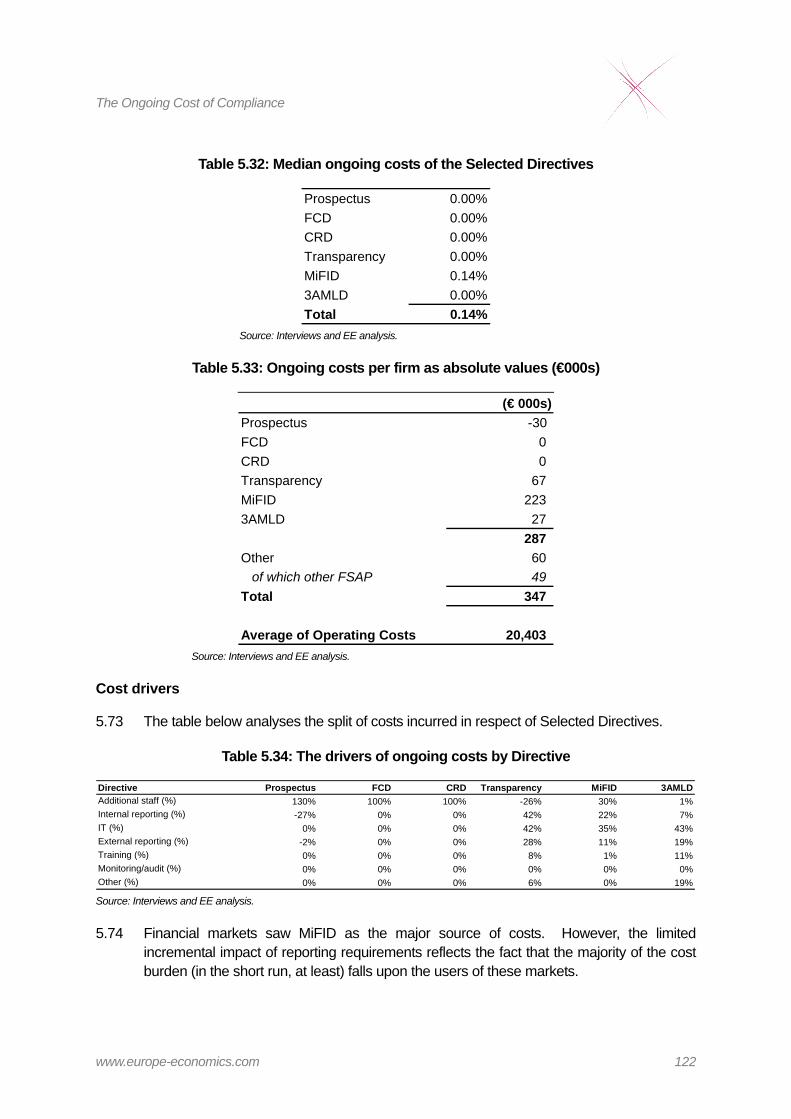
The Ongoing Cost of Compliance
www.europe-economics.com 122
Table 5.32: Median ongoing costs of the Selected Directives
Prospectus 0.00%FCD 0.00%CRD 0.00%Transparency 0.00%MiFID 0.14%3AMLD 0.00%Total 0.14%
Source: Interviews and EE analysis.
Table 5.33: Ongoing costs per firm as absolute values (€000s)
(€ 000s)Prospectus -30 FCD 0 CRD 0 Transparency 67 MiFID 223 3AMLD 27
287 Other 60 of which other FSAP 49 Total 347
Average of Operating Costs 20,403 Source: Interviews and EE analysis.
Cost drivers
5.73 The table below analyses the split of costs incurred in respect of Selected Directives.
Table 5.34: The drivers of ongoing costs by Directive
Directive Prospectus FCD CRD Transparency MiFID 3AMLDAdditional staff (%) 130% 100% 100% -26% 30% 1%Internal reporting (%) -27% 0% 0% 42% 22% 7%IT (%) 0% 0% 0% 42% 35% 43%External reporting (%) -2% 0% 0% 28% 11% 19%Training (%) 0% 0% 0% 8% 1% 11%Monitoring/audit (%) 0% 0% 0% 0% 0% 0%Other (%) 0% 0% 0% 6% 0% 19% Source: Interviews and EE analysis.
5.74 Financial markets saw MiFID as the major source of costs. However, the limited incremental impact of reporting requirements reflects the fact that the majority of the cost burden (in the short run, at least) falls upon the users of these markets.

The Ongoing Cost of Compliance
www.europe-economics.com 123
5.75 That said, there is likely to be a de minimis spend attached to applicable pieces of regulation that will apply regardless of the firm’s size. This fixed component shows up more visibly in the financial markets segment simply because the scale of these as businesses is so much smaller than the other sectors reviewed (the average asset manager has operating costs 19 times that of the average financial market; the average bank/financial conglomerate has been nearly 77 times larger).
5.76 In addition, a number of the participants — particularly those based in New Member States — considered it the case that the Selected Directives coincided with a cultural change that was due anyway. A switch to a more proactive approach has necessitated more, higher quality human resources (although, clearly, not all of this is attributable to the Selected Directives).

The Ongoing Cost of Compliance
www.europe-economics.com 124
APPENDIX 1: NOTE ON METHODOLOGY
A1.1 In this section, we comment briefly upon the main aspects of the methodology underpinning our study.
Sample Selection
A1.2 Within each of the sectors, firms were chosen based on numerous dimensions to ensure the sample broadly reflected the diversity of the European financial services industry, namely:
– Business size (e.g. based on total assets)
– Geographical location, based on the firm’s headquarters
– Coverage, i.e. firms with both international and national coverage
A1.3 The main sources used were:
– Bankers Almanac (www.bankersalmanac.com)
– International Capital Market Association (www.icma-group.org)
– European Fund and Asset Management Association (www.efama.org)
– Federation of European Securities Exchanges (www.fese.be)
– Thomson Reuters (www.thomsonreuters.com)
– DG Internal Market and Services Identification of Financial Conglomerates (November 2007)
A1.4 The actual coverage achieved is described in Section 2 (in particular, 2.48 to 2.58).
The Design of the Structured Interview
Frame of reference for the structured interview
A1.5 We attempted to break down the challenge of quantifying the impact of the Directives into a series of steps and thought experiments. Whilst this resulted in a lengthy list of questions, we stressed to participants that we were seeking the best estimates available from experienced practitioners, which we hoped to be, in large part, intuitive.
A1.6 Where appropriate, we participated in the thought experiments associated with the project, either at the interview or beforehand. Where a Directive had not had a measurable effect on the business in question, then we accepted a nil return in respect of that particular measure.

The Ongoing Cost of Compliance
www.europe-economics.com 125
Design of questions
A1.7 We undertook some theoretical research conducted as part of designing the framework for the structured interview question template. We have listed below the documents reviewed. These were chosen, first, to identify previous estimates of the costs of compliance with the chosen directives, and, second, to identify the drivers of those costs (even if specific cost estimates were not provided).
(a) HM Treasury (2004), UK Implementation of the Prospectus Directive: Consultation document.
(b) CSES (2008), Study on the Impact of the Prospectus Regime on EU Financial Markets.
(c) ESME (2007), Report on Prospectus Directive.
(d) CESR (2007), Report on Prospectus Directive.
(e) Linklater’s survey (2006), Unintended Consequences: How the EU’s Prospectus Directive is threatening employee share plans for workers of non-EU companies.
(f) International Financial Law Review (2005) (Portugal supplement), The pros and cons of the Prospectus Directive.
(g) International Primary Market Association, Life under the Prospectus Directive.
(h) HM Treasury and FSA (2003), FSA Consultation Paper 204: Financial Groups, Annex 3.
(i) Banque France (2002), Risk management in financial conglomerates and prudential supervision.
(j) ECMI Policy Brief (2006), The MiFID Implementing Measures: Excessive Detail or Level Playing Field?
(k) EBF Response to Call for Evidence, Transposition of Directive 2004/39/EC on MiFID.
(l) ECMI Policy Brief, (November 2006), Jean-Pierre Casey and Karel Lannoo, The MiFID Revolution.
(m) JP Morgan European Equity Research (2006), MiFID Report II.
(n) HM Treasury (2005), UK Implementation of the EU Markets in Financial Instruments Directive: Consultation document.
(o) Business Wire (2007), S Perrin, The Transparency Directive: Countdown to Compliance.

The Ongoing Cost of Compliance
www.europe-economics.com 126
(p) HM Treasury (2005), Implementation of the Transparency Directive (Major shareholdings notification): Partial Impact Assessment.
(q) European Commission, DG Internal Market (2008), Report on more stringent national measures concerning Directive 2004/109/EC on the harmonisation of transparency requirements in relation to information about issuers whose securities are admitted to trading on a regulated market.
(r) Journal of Financial Regulation and Compliance (2002), A Milne, Minimum capital requirements and the design of the new Basel accord: a constructive critique.
(s) PricewaterhouseCoopers (2005), The Capital Requirements Directive Non-capital Compliance Costs.
(t) HM Treasury (2006), Transposition of the Capital Requirements Directive: Regulatory Impact Assessment.
(u) Centre of European Policy Studies (2004), R Ayadi & F De Rossi, Practical Implications of the New Basel Capital Accord for the European Banking System.
(v) Datamonitor (2003), Credit risk management and Basel II in European Financial Services.
(w) Forrester Research (2003), Basel II: Benchmarking the Cost of Compliance.
(x) Mercer Oliver Wyman (2003), The New Rules of the Game: Implications of the New Basel Capital Accord for the European Banking Industries.
(y) Irish Bankers Federation, Impact assessment of the Third anti-Money Laundering Directive.
(z) NetPractice.org, H Pernot (2007), Implementing the Third EU Directive in the Netherlands.
(aa) HM Treasury (2000), The Third Money Laundering Directive: Regulatory Impact Assessment.
(bb) Open Europe (2006), K Boyfield, Selling the City Short? A Review of the EU’s Financial Services Action Plan.
(cc) ABBL/Deloitte (2006), Impact of Compliance on Financial Institutions in Luxembourg.
(dd) CEBS Quantitative Impact Study.
A1.8 We summarise in the table below a summary of the cost drivers identified in the literature reviewed.

The Ongoing Cost of Compliance
www.europe-economics.com 127
Table A1.2: Cost driver summary
Cost Prospectus Directive
Financial Conglom-
erates Directive
CRDs Trans-
parency Directive
MiFID Third anti-
money laundering Directive
Ongoing Additional staff * Internal reporting * **28 * IT * * External reporting **29 * * ** Training * Audit *30 * * Other *31 *32 *33 *34 One-off Familiarisation with Directive * * * External consultancy fees * Legal advice * * * Training * * * * * Staff recruitment * Updating IT systems * ** ** Other *35*36 *37 *38
Source: Europe Economics. * = identified by literature as a significant driver of cost; **= identified by literature as a very significant driver of costs
Interviews
A1.9 The majority of the seventy-eight interviews conducted have been face-to-face, with some follow-up by telephone or e-mail. However, for logistical reasons — or to match the preference of the interviewee(s) — we also conducted some interviews by conference call.
28 Including data collection costs. 29 Involves compiling information; filing it through a regulatory information service; and producing required documentation. 30 Based upon expert opinion. 31 Additional cost associated with lower gearing. 32 Greater information dissemination. 33 Information dissemination. 34 Additional work time for current staff. 35 Threshold tests. 36 Capital adequacy requirement tests. 37 Data storage costs. 38 Centralisation of compliance function.

The Ongoing Cost of Compliance
www.europe-economics.com 128
A1.10 Typically, the interview with a particular firm involved participants from a mix of functions. Most commonly these were individuals from compliance, risk control and finance, or some combination between these. For smaller businesses, we have had — on occasion — access to senior operational management.
A1.11 Initial direct contact was made via email and telephone. In addition, we involved industry associations in order to indirectly approach potential interviewees. DG Internal Market and Services supplied us with letters of support in order to assist in attracting the interest of institutions to the study.
Industry associations
A1.12 The following associations aided us in the task of contacting some of their members (as selected by us in accordance with the initial sample of survey candidates). Some of them chose to contact their members directly, while others provided us with contact details.
– Associacão Portuguesa de Fundos de Investimento, Pensões e Patrimónios
– Association of German Banks
– Association Luxembourgeoise des Fonds d'Investissement
– Association of Funds and Asset Management of the Czech Republic
– Association of Hungarian Investment Fund and Asset Management Companies
– Austrian Bankers’ Association
– British Bankers’ Association
– The Council of Mortgage Lenders (UK)
– Czech Banking Association
– Danish Bankers’ Association
– European Fund and Asset Management Association
– Febelfin (Belgium)
– The Federation of Danish Investment Associations
– Federation of Finnish Financial Services
– French Banking Federation
– Hellenic Banking Association
– Hungarian Banking Association
The Ongoing Cost of Compliance
www.europe-economics.com 129
– Irish Banking Federation
– Italian Banking Association
– Luxembourg Bankers’ Association
– Malta Bankers’ Association
– Netherlands Bankers’ Association
– Polish Bank Association
– Portuguese Bankers’ Association
– Swedish Bankers’ Association
– The Swedish Investment Fund Association
A1.13 We would like to take this opportunity to thank all of these associations, as well, of course, as the institutions that actually chose to participate, for the contribution made to this study.
Challenges encountered
A1.14 Several difficulties were encountered during the process of contacting the sample candidates, both when we contacted firms directly, and when associations have contacted their members on our behalf. The principal constraint in getting financial institutions to participate in the study was a lack of resources on their part. Given the timing of the study, this may well be a result of the fall-out from the credit crunch, resulting in more compliance and operational resources being deployed on other matters or even, in extreme cases, resulting in reductions in headcount.
A1.15 Another hurdle was the existence of competing surveys. Some firms contacted said that they would not participate either because they had already agreed to participate in another study, or because they had received several requests for participation and had decided not to take part in any of the studies given their resource constraints.
A1.16 These problems were also encountered by almost all the associations who contacted their members on our behalf.
A1.17 Investment banks and the financial markets have been least receptive to the invitation to participate. This may be because of:
– Lack of interest, perhaps in the case with financial markets due to the limited applicability of many of the Directives directly to the market itself (as opposed to participants on the market).
– Specific re-structuring issues around recent consolidation.

The Ongoing Cost of Compliance
www.europe-economics.com 130
– Residual concerns about the level of confidentiality around the use of the data.
A1.18 An important point to recognise is that, given these difficulties, the most willing participants may be those who considered the implementation of the Directives to be the most onerous. This gives a potential for bias that we would not be able to eliminate through the conduct of the interviews. However, the dispersion of our results suggest that this potential source of upwards bias, if present, was not material.
Summary
A1.19 We conducted seventy-eight interviews. A number of these organisations operate across more than one of the three sectors (excluding financial markets) that we are looking at, and some firms operate as all three (i.e. a firm may qualify as a bank and financial conglomerate, an asset manager and an investment bank).
A1.20 The following table summarises the number of firms in each of our sub-categories that provided some quantitative material on the cost impact of at least some of the Selected Directives. The figures in brackets include also those firms that provided either quantitative or qualitative material (e.g. relating to the compliance function).
Table A1.1: Summary of those institutions that have agreed to participate
“Northern” “Southern” New TOTAL Banks and financial conglomerates
18 (21) 11 (12) 11 40 (44)
Asset managers 11 12 5 28
Investment banks 9 9 0 18
Financial markets 2 1 (2) 5 8 (9) 40 (43) 33 (35) 21 94 (99) “Northern” Member States covered are the UK, Ireland, Germany, Austria, Netherlands, Sweden, Finland and Denmark. “Southern” Member States covered are France, Spain, Italy, Greece, Portugal and Luxembourg. New Member States are Hungary, the Czech Republic, Bulgaria, Malta and Cyprus.
A1.21 It should be noted that it was not the intention of the study to incorporate firms from all Member States. Rather, we aimed to include firms from around 20 Member States in our sample. We made the judgement that to do otherwise would risk spreading the sample coverage too thinly.39
A1.22 In terms of the estimation of one-off costs (particularly where a change to the company’s IT architecture was envisaged) there was often an implementation budget that served as
39 An exception to this was made in the case of financial markets. For the purposes of building a sample, at least, there was a risk recognised at the inception of the study that there was no scope for imposing such a restriction in respect of this segment.

The Ongoing Cost of Compliance
www.europe-economics.com 131
a starting point for the consideration of the cost impact involved. By contrast, the objective in most firms is to absorb recurring costs into the cost of “business as usual” as rapidly as possible. A natural corollary of this is that the separate identification of the ongoing cost impact from the “noise” of the firm’s running costs is made more difficult.
The conversion of interviews into useable results
A1.23 This in itself was a non-trivial task. As expected, many survey participants found it very challenging to think through the hypothetical questions set, despite the careful efforts in the questionnaire to break down questions into small steps. The interviews were very important in helping firms to understand the intuitive and approximate nature of the responses sought. Moreover, a process of iteration post-interview was sometimes necessary to extract all of the information that we required.
A1.24 Where internal discrepancies arose, we attempted to settle these with the interviewee, either at the interview or subsequently. Where necessary, judgement was required on the part of the Europe Economics team in deciding upon which set of answers to put more weight.
A1.25 Nonetheless, we are satisfied that, despite the challenges mentioned above, our interviewers have been largely successful in guiding participants, and the vast majority of responses have been useful and informative. Survey participants appeared to find the exercise interesting and feedback has been positive.
Approach where firm operates in two or three sectors
A1.26 Where we had responses on a multi-sector group-basis, we allocated the identified costs of compliance to individual units (i.e. banking, asset management, investment banking). The basis for this allocation was as follows:
(a) Based upon the input of the interviewee, ideally on a Directive by Directive basis.
(b) Allocations based upon key metrics: so that the costs relating to MiFID and the 3AMLD were made on the basis of affected customer numbers; the CRDs on the basis of the share of risk-weighted assets.
(c) Where the information for (a) and (b) was not available for some reason, we used the division’s share of group operating expenses.

The Ongoing Cost of Compliance
www.europe-economics.com 132
APPENDIX 2: GOLD PLATING
Towards a Definition of Gold-plating
A2.1 A number of different components are conceivable for a definition of gold-plating of EU legislation by the implementing national authorities. These include:
(a) The imposition (or retention) of additional requirements to those set out in the Directive by means of the implementing legislative measure in that Member State.
(b) The application of the measures incorporated into the Directive to a larger universe of firms than that proposed in the Directive itself.
(c) Where the Directive contains options that could impose greater or lesser degrees of regulatory burden upon firms, the enactment of the former could be counted as gold-plating.
A2.2 We have not included (c) within what we view as gold-plating and with regard to the Selected Directives, study participants did not identify to us instances of category (b). In addition, we note that the retention of additional requirements by a Member State will not of necessity incur incremental costs (although it is possible).
A2.3 However, we stress that there is not a universally accepted definition of gold-plating.
The Scope of Gold-plating
A2.4 We have not attempted a legal analysis of the implementation of the Selected Directives across the EU27. However, we took the opportunity within the interviews conducted as part of our study to get the assessment of market participants on the extent of gold-plating under this definition. Inevitably, this introduced an element of value judgement on their part.
A2.5 Overall, a majority of the interviewees did not believe that the national regulators in their respective sectors had engaged in a noticeable degree of gold-plating with regards to the Selected Directives in question. The instances of gold-plating reporting to us largely related to the MiFID, the 3AMLD and the Capital Requirements Directive.40
40 Participants did not make significant reference to gold-plating with respect to the Transparency Directive. However, the European Commission, DG Internal Market (2008), report on more stringent national measures concerning Directive 2004/109/EC on the harmonisation of transparency requirements in relation to information about issuers whose securities are admitted to trading on a regulated market does provide some extra detail on this subject.

The Ongoing Cost of Compliance
www.europe-economics.com 133
MiFID
A2.6 Study participants provided several examples of apparent gold-plating in respect of MiFID implementation (or, so-called, “silver-plating” around the guidance and interpretation of the measures), including:
– The Danish and Italian competent authorities extended the trading transparency obligations of the MiFID to include bonds. However, this was supported by a number of market participants in Denmark and reflected (at least to some extent) existing practice in Italy.
– It was suggested that the UK FSA implemented MiFID early and in a more stringent manner than a literal interpretation of the Directive required (however, this was not the unanimous view of interviewees with a UK presence).
– According to participants with operations in those countries (but not necessarily headquartered there), the competent authorities in Finland, the Czech Republic and Bulgaria may have gold-plated aspects of the MiFID implementation.
Third Anti-Money Laundering Directive
A2.7 Some study participants (but not all of those affected) stated that the local interpretation of this Directive was more stringent than necessary in the Czech Republic, United Kingdom and Malta (however, it is noted that the Third Anti-Money Laundering Directive is yet to be implemented in Malta).
Capital Requirements Directives
A2.8 Some of the UK-based respondents felt that the local implementation of the CRDs had made the requirements rather more complex than the language used in the Directive.
Other measures
A2.9 A number of respondents cited the UK’s implementation of the Market Abuse Directive as an example of past gold-plating (but also felt that the UK FSA had learned something from this and was now more conscious of this potential problem).
The Impact of Gold-plating
A2.10 It was evident that the majority of the participants who cited examples of gold-plating considered these to be a source of cost (or at least missed opportunity). The extent of this cost impact was not seen as separately distinguishable from the overall impact.
A2.11 However, a more stringent approach by regulators was not seen as necessarily problematic. For instance, the thought was proposed that, if anything, customers (or at least those customers willing and able to transfer business across national boundaries) appreciate a business operating in a tougher regulatory environment. Equally, other

The Ongoing Cost of Compliance
www.europe-economics.com 134
participants felt that a practical, day-to-day approach by the regulator towards guidance compensated for an over-stringent implementation.
A2.12 On the other hand, some participants were less concerned about gold-plating in any particular Member State than a low level of (effective) implementation elsewhere. It was felt that this could result in an unlevel playing field. This could, perhaps, be termed “tin-plating”.
A2.13 Some of the participants in Hungary were less concerned about gold-plating than about incorrect implementation of measures. Aspects of the MiFID (relating to customer classification) and the 3AMLD (relating to the beneficial ownership obligations) implementations were explicitly cited as examples of this. The eventual rectification of these issues is expected to incur further cost at some future date.

The Ongoing Cost of Compliance
www.europe-economics.com 135
APPENDIX 3: ADDITIONAL SAMPLE ANALYSIS
A3.1 In this Appendix, we set out additional tables providing further sub-division of our sample, specifically looking at divisions by both region and by size of firm. Given the overall size of our sample, these sub-categories are inevitably rather small. As such, they are more prone to be skewed up or down by outliers and the like. We include this sub-analysis for reference, but clearly these tables need to be treated with proper caution.
A3.2 “Northern” Member States covered include UK, Ireland, Germany, Austria, Netherlands, Sweden, Finland and Denmark. “Southern” Member States covered include France, Spain, Italy, Greece, Portugal and Luxembourg. New Member States include Hungary, the Czech Republic, Bulgaria, Malta and Cyprus.
A3.3 We have only shown a sub-category where there are at least three firms within it. This is aimed at safeguarding the confidentiality of the study participants.
A3.4 Some firms were not able to provide an estimate of the cost impact of a specific measure or measures. In the table illustrating the average cost impact per firm, we have shown the average for each Directive based only upon those firms providing an answer. However, the figure for operating costs is the average across all firms. This means that the results can not in all cases be directly compared to the means expressed in percentage terms (since in many cases the numerators and denominators would not be exactly comparable).
One-off costs
Banks and financial conglomerates
Table A3.1: Mean one-off costs as a proportion of operating expenses by geographical split and size of firm
New Small firms Large Firms Small firms Large Firms
Prospectus 0.02% 0.02% 0.15% 0.00% 0.07%FCD 0.00% 0.02% 0.05% 0.00% 0.02%CRD 0.70% 2.12% 1.48% 1.18% 0.33%Transparency 0.01% 0.03% 0.34% 0.00% 0.07%MiFID 0.78% 0.80% 1.27% 0.28% 0.17%3AMLD 0.24% 0.38% 0.96% 0.18% 0.31%
1.75% 3.37% 4.26% 1.65% 0.97%Other 0.14% 0.98% 0.41% 0.06% 0.15% of which other FSAP 0.07% 0.10% 0.08% 0.02% 0.04%Total 1.90% 4.35% 4.68% 1.71% 1.11%
"Northern" "Southern"

The Ongoing Cost of Compliance
www.europe-economics.com 136
Table A3.2: Median one-off costs as a proportion of operating expenses of the Selected Directives by geographical split and size of firm
New Small firms Large Firms Small firms Large Firms
Prospectus 0.02% 0.01% 0.07% 0.01% 0.09%FCD 0.00% 0.00% 0.00% 0.00% 0.00%CRD 1.40% 2.62% 1.00% 1.04% 0.33%Transparency 0.02% 0.01% 0.19% 0.02% 0.05%MiFID 0.66% 0.84% 1.34% 0.35% 0.29%3AMLD 0.39% 0.48% 1.08% 0.20% 0.22%Total 2.48% 3.95% 3.67% 1.61% 0.98%
"Southern" "Northern"
Table A3.3: Mean one-off costs by geographical split and size of firm (€000s)
NewSmall firms Large Firms Small firms Large Firms
Prospectus 30 870 244 88 89 FCD 1 647 77 35 42 CRD 797 68,390 2,077 82,764 863 Transparency 6 1,010 550 175 107 MiFID 787 23,496 1,784 15,873 436 3AMLD 247 11,150 1,356 10,578 822
1,868 105,562 6,088 109,513 2,359 Other 144 28,273 580 3,330 386 of which other FSAP 69 2,979 110 890 97 Total 2,013 133,836 6,668 112,843 2,745
Average of Operating Costs 101,070 2,897,714 140,564 5,762,235 262,055
"Southern" "Northern"
Asset managers
Table A3.4: Mean one-off costs as a proportion of operating expenses by geographical split and size of firm
New Small firms Large Firms Small firms Large Firms Small firms
Prospectus 0.03% 0.01% 0.03% 0.11% 0.00%FCD 0.00% 0.04% 0.00% 0.00% 0.00%CRD 0.40% 0.53% 0.02% 0.45% 0.05%Transparency 0.05% 0.24% 0.01% 0.00% 0.00%MiFID 0.86% 1.09% 0.21% 0.26% 0.64%3AMLD 0.51% 0.33% 0.71% 0.16% 0.11%
1.85% 2.24% 0.97% 0.98% 0.80%Other 0.26% 0.41% 0.73% 0.05% 0.33% of which other FSAP 0.07% 0.19% 0.07% 0.00% 0.11%Total 2.11% 2.66% 1.70% 1.03% 1.13%
"Northern" "Southern"

The Ongoing Cost of Compliance
www.europe-economics.com 137
TableA3.5: Median one-off costs as a proportion of operating expenses of the Selected Directives by geographical split and size of firm
New Small firms Large Firms Small firms Large Firms Small firms
Prospectus 0.02% 0.00% 0.00% 0.06% 0.00%FCD 0.00% 0.00% 0.00% 0.00% 0.00%CRD 0.42% 0.33% 0.00% 0.49% 0.00%Transparency 0.04% 0.23% 0.00% 0.00% 0.00%MiFID 0.94% 0.75% 0.45% 0.34% 0.02%3AMLD 0.32% 0.35% 0.77% 0.14% 0.00%Total 1.74% 1.66% 1.22% 1.03% 0.02%
"Northern" "Southern"
Table A3.6: Mean one-off costs by geographical split and size of firm (€000s)
New Small firms Large Firms Small firms Large Firms Small firms
Prospectus 8 38 7 750 - FCD 1 120 0 - - CRD 114 1,724 5 8,358 5 Transparency 14 800 1 - - MiFID 245 3,552 45 4,933 65 3AMLD 146 1,071 154 3,031 11
528 7,306 212 17,072 82 Other 73 1,347 158 962 34 of which other FSAP 21 606 16 21 11 Total 601 8,652 370 18,033 116
Average of Operating Costs 28,486 324,698 21,763 1,874,287 10,238
"Northern" "Southern"
Investment Banks
Table A3.7: Mean one-off costs as a proportion of operating expenses by geographical split and size of firm
Small firms Large Firms Small firms Large FirmsProspectus 0.03% 0.01% 0.06% 0.02%FCD 0.00% 0.00% 0.01% 0.00%CRD 2.05% 2.04% 0.21% 1.13%Transparency 0.06% 0.03% 0.17% 0.05%MiFID 0.89% 1.06% 0.48% 0.34%3AMLD 0.74% 0.17% 0.18% 0.21%
3.77% 3.30% 1.11% 1.75%Other 0.44% 0.09% 0.15% 0.09% of which other FSAP 0.01% 0.01% 0.03% 0.00%Total 4.21% 3.39% 1.26% 1.84%
"Southern""Northern"

The Ongoing Cost of Compliance
www.europe-economics.com 138
Table A3.8: Median one-off costs as a proportion of operating expenses of the Selected Directives by geographical split and size of firm
Small firms Large Firms Small firms Large FirmsProspectus 0.03% 0.00% 0.03% 0.00%FCD 0.00% 0.00% 0.00% 0.00%CRD 1.87% 2.71% 0.76% 2.71%Transparency 0.04% 0.03% 0.09% 0.03%MiFID 0.94% 0.63% 0.44% 0.63%3AMLD 0.70% 0.13% 0.07% 0.13%Total 3.59% 3.50% 1.40% 3.50%
"Northern" "Southern"
Table A3.9: Mean one-off costs by geographical split and size of firm (€000s)
Small firms Large Firms Small firms Large FirmsProspectus 21 59 6 250 FCD - 2 2 125 CRD 5,207 20,818 50 31,791 Transparency 42 311 15 750 MiFID 1,886 10,831 115 9,672 3AMLD 1,576 2,165 32 5,862
8,732 34,187 220 48,450 Other 934 1,123 27 2,395 of which other FSAP 11 144 5 125 Total 9,666 35,310 247 50,845
Average of Operating Costs 212,822 1,279,718 18,259 2,813,800
"Southern" "Northern"

The Ongoing Cost of Compliance
www.europe-economics.com 139
Ongoing costs
Banks and financial conglomerates
Table A3.10: Mean ongoing costs as a proportion of operating expenses by geographical split and size of firm
NewSmall firms Large Firms Small firms Large Firms
Prospectus 0.00% 0.01% 0.21% 0.00% 0.01%FCD 0.00% 0.00% 0.02% 0.00% 0.00%CRD 0.21% 0.37% 0.53% 0.07% 0.21%Transparency 0.00% 0.01% 0.17% 0.00% 0.02%MiFID 0.34% 0.12% 0.49% 0.05% 0.10%3AMLD 0.15% 0.11% 0.50% 0.02% 0.18%
0.71% 0.61% 1.93% 0.14% 0.52%Other 0.07% 0.31% 0.49% 0.01% 0.07% of which other FSAP 0.05% 0.02% 0.12% 0.00% 0.02%Total 0.77% 0.92% 2.42% 0.15% 0.59%
"Northern" "Southern"
Table A3.11: Median ongoing costs as a proportion of operating expenses of the Selected Directives by geographical split and size of firm
New Small firms Large Firms Small firms Large Firms
Prospectus 0.00% 0.00% 0.11% 0.01% 0.00%FCD 0.00% 0.00% 0.00% 0.00% 0.00%CRD 0.64% 0.19% 0.38% 0.08% 0.07%Transparency 0.00% 0.01% 0.07% 0.01% 0.00%MiFID 0.17% 0.11% 0.17% 0.05% 0.09%3AMLD 0.23% 0.08% 0.36% 0.01% 0.07%Total 1.05% 0.39% 1.10% 0.16% 0.23%
"Southern""Northern"
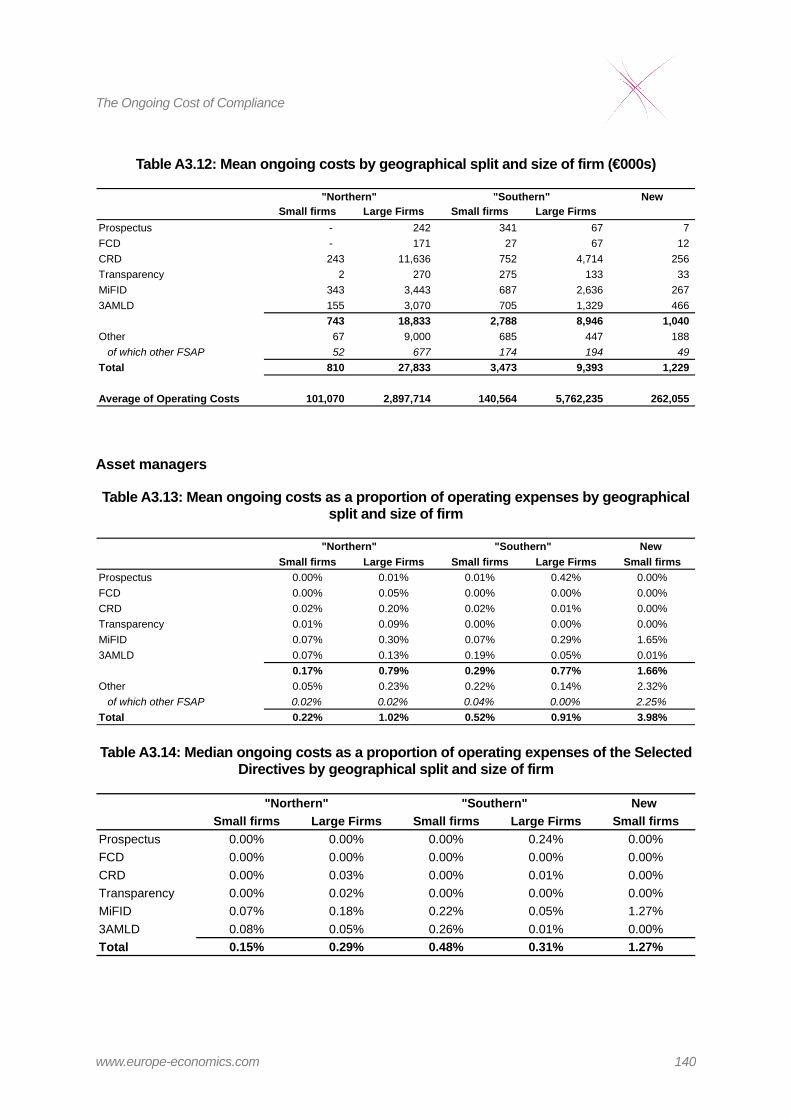
The Ongoing Cost of Compliance
www.europe-economics.com 140
Table A3.12: Mean ongoing costs by geographical split and size of firm (€000s)
NewSmall firms Large Firms Small firms Large Firms
Prospectus - 242 341 67 7 FCD - 171 27 67 12 CRD 243 11,636 752 4,714 256 Transparency 2 270 275 133 33 MiFID 343 3,443 687 2,636 267 3AMLD 155 3,070 705 1,329 466
743 18,833 2,788 8,946 1,040 Other 67 9,000 685 447 188 of which other FSAP 52 677 174 194 49 Total 810 27,833 3,473 9,393 1,229
Average of Operating Costs 101,070 2,897,714 140,564 5,762,235 262,055
"Southern" "Northern"
Asset managers
Table A3.13: Mean ongoing costs as a proportion of operating expenses by geographical split and size of firm
New Small firms Large Firms Small firms Large Firms Small firms
Prospectus 0.00% 0.01% 0.01% 0.42% 0.00%FCD 0.00% 0.05% 0.00% 0.00% 0.00%CRD 0.02% 0.20% 0.02% 0.01% 0.00%Transparency 0.01% 0.09% 0.00% 0.00% 0.00%MiFID 0.07% 0.30% 0.07% 0.29% 1.65%3AMLD 0.07% 0.13% 0.19% 0.05% 0.01%
0.17% 0.79% 0.29% 0.77% 1.66%Other 0.05% 0.23% 0.22% 0.14% 2.32% of which other FSAP 0.02% 0.02% 0.04% 0.00% 2.25%Total 0.22% 1.02% 0.52% 0.91% 3.98%
"Southern""Northern"
Table A3.14: Median ongoing costs as a proportion of operating expenses of the Selected Directives by geographical split and size of firm
New Small firms Large Firms Small firms Large Firms Small firms
Prospectus 0.00% 0.00% 0.00% 0.24% 0.00%FCD 0.00% 0.00% 0.00% 0.00% 0.00%CRD 0.00% 0.03% 0.00% 0.01% 0.00%Transparency 0.00% 0.02% 0.00% 0.00% 0.00%MiFID 0.07% 0.18% 0.22% 0.05% 1.27%3AMLD 0.08% 0.05% 0.26% 0.01% 0.00%Total 0.15% 0.29% 0.48% 0.31% 1.27%
"Northern" "Southern"

The Ongoing Cost of Compliance
www.europe-economics.com 141
Table A3.15: Mean ongoing costs by geographical split and size of firm (€000s)
New Small firms Large Firms Small firms Large Firms Small firms
Prospectus 1 42 4 3,000 - FCD - 178 1 11 - CRD 7 657 4 249 0 Transparency 2 288 1 - - MiFID 19 983 17 3,956 169 3AMLD 20 415 44 893 1
49 2,562 71 8,109 170 Other 15 760 57 2,628 237 of which other FSAP 7 49 9 1 230 Total 64 3,322 128 10,737 407
Average of Operating Costs 28,486 324,698 21,763 1,874,287 10,238
"Northern" "Southern"
Investment banks
Table A3.16: Mean ongoing costs as a proportion of operating expenses by geographical split and size of firm
Small firms Large Firms Small firms Large FirmsProspectus 0.00% 0.00% 0.15% 0.02%FCD 0.00% 0.00% 0.02% 0.01%CRD 0.49% 0.11% 0.32% 0.12%Transparency 0.01% 0.03% 0.19% 0.04%MiFID 0.57% 0.02% 0.50% 0.08%3AMLD 0.23% 0.01% 0.72% 0.04%
1.30% 0.18% 1.89% 0.30%Other 0.23% 0.06% 0.70% 0.05% of which other FSAP 0.00% 0.05% 0.06% 0.00%Total 1.53% 0.24% 2.60% 0.35%
"Northern" "Southern"
Table A3.17: Median ongoing costs as a proportion of operating expenses of the Selected Directives by geographical split and size of firm
Small firms Large Firms Small firms Large FirmsProspectus 0.00% 0.00% 0.29% 0.00%FCD 0.00% 0.00% 0.00% 0.00%CRD 0.24% 0.11% 0.40% 0.11%Transparency 0.01% 0.01% 0.37% 0.01%MiFID 0.32% 0.03% 1.42% 0.03%3AMLD 0.12% 0.01% 0.90% 0.01%Total 0.69% 0.15% 3.38% 0.15%
"Southern""Northern"

The Ongoing Cost of Compliance
www.europe-economics.com 142
Table A3.18: Mean ongoing costs by geographical split and size of firm (€000s)
Small firms Large Firms Small firms Large FirmsProspectus 3 13 13 288 FCD - 3 3 158 CRD 1,233 1,080 59 3,941 Transparency 6 336 17 575 MiFID 1,220 250 92 1,754 3AMLD 490 162 131 1,066
2,952 1,844 315 7,782 Other 489 817 128 1,453 of which other FSAP 10 645 12 4 Total 3,440 2,661 443 9,236
Average of Operating Costs 212,822 1,279,718 18,259 2,813,800
"Northern" "Southern"