studying the expression of a novel microsatellite mrna in
TRANSCRIPT

Seton Hall UniversityeRepository @ Seton HallSeton Hall University Dissertations and Theses(ETDs) Seton Hall University Dissertations and Theses
2000
Studying the Expression of a Novel MicrosatellitemRNA in Chironomous RipariusMina RanzurmalSeton Hall University
Follow this and additional works at: https://scholarship.shu.edu/dissertations
Part of the Biology Commons, and the Genetics Commons
Recommended CitationRanzurmal, Mina, "Studying the Expression of a Novel Microsatellite mRNA in Chironomous Riparius" (2000). Seton Hall UniversityDissertations and Theses (ETDs). 2431.https://scholarship.shu.edu/dissertations/2431

STUDYING THE EXPRESSION OF A NOVEL
MICROSATELLITE mRNA IN Chironomous rivarius •
by
MINA RANZURMAL
Submitted in partial fulfillment of the requirements for the degree of Master Of Science in Biology from the Department of Biology of Seton Hall
University 2000

Approved By:
&+ s fff.t�'cJ<>(r$1<A- Men or I
Dr. Carolyn S. Bentivegna
<,
�ff.J?ao� Committee Member Dr. Maria MacWilliams
Co�� Dr. Eliot Krause
arrperson, 10 ogy ep �ent Dr. Solie L. Chang
Ch�J'i;y/-D �
ii

Acknowledgments
I would like to thank Dr. Carolyn Bentivegna whom without her help I would have not been able to get this far. She has impressed me with her devotion and love of science. I will always remember her as a dedicated, intelligent, strong, and enthusiastic professor.
I would like to thank Dr. Eliot Krause and Dr. Maria MacWilliams for taking their time to review my research work and providing me with constructive suggestions.
I am thankful to Dr. Gerald Ruscingno for his help and support for the past two years. Thanks for making me laugh.
I am also very thankful to my parents (Aref and Amena Ranzurmal), my brothers (Abdullah, Amid, and Safi), and my sisters (Nida and Turkan) who have always supported me financially and emotionally. I would have not come this far without their encouragement and believing in me.
iii

Table of Contents
Approval Page .. , . . . . . . . . . . . . . . . . . . . . . . . . . . . . . . . . . . . . . . . . . . . . . . . . . . . . . . . . . . . . . . . • . . , ii
Acknowledgments . . . . . . . . . . . • . . . . . . . . . . . . . . . . . . . . . . . . . . . . . . . • . . . . . . . . . . . , .iii
Table of Contents . . . . . . . . . . . • . . . . . . . . . . . . . . . . . . . . . . . . . . . . . . . . . . . . . . . . . . . . . . . . . . , iv
List of Tables . . . . . . . . . . . . . . . . . . . • . . . . . . . . . . • • . . . . . . . . . . . . . . . . . . . . . . . . . . . . . . . . • . . . . . . . . . . . . . . . . . . . . . . . . . v
List ofFigures . . . . . . . . . . . . . . . . . . . . . . . . . . . . . . . . . . . . . . . • . . . . . . . . . . • . . . . . . . . . . • . . . . . . . • • . . . . . . . . . . . . . . . . . . vi
Abstract . . . . . . . . . . . . . . . . . . . . . . . . . . . . . . . . . . . • . . . . . . . . . • . . . . . . . . . . • . . . . . . . . . . . . . . . . . . . . . . . . . . . . . . . . . . . . . . vii
Introduction . . . . . . . . . . . . . . . . . . . . . . . . . . . . . . . . . . . . . . . . . . . . . . . . . . . . . . • • . . . . . . . . . . . . . . . . . . . . . . . . . . . . . . . . . . . . 1
Materials and Methods 6
Results 13
Discussion . . . . . . . . . . . . . . . . . . . . . . . . . . . . . . • . . . . . . . . . • . . . . . . . . . • . . . . . . . . . . . . . . . . . . . . . . . . • . . . . . . . . . . . . . . . . 31
Summary 36
Literature Cited 38
iv

List of Tables
Table 1. Sequence and position of MS primers in the C. riparius . . . . . . . . . . . . . . . . . . . . . . . . . . . . . . . . . . . . . . . . . . . . . . . . . . . . . . . . . . • . . . . . . . . . . . . . . . . . . . . . . . . . . 15
Table 2. MS mRNA expression (area) and mortality(%) in different Cd experiments in C. riparius . . . . . . . . . . . . . . . . . . . . . . . . . . . . . • . . . . . . . . . . . . . . . . . . . . . . . . . 22
Table 3. MS mRNA expression (area) and mortality(%) in heat shock experiments in C. riparius . . . . . . . . . . . . . . . . . . . . . . . . . . . . . . . . . • . . . . . . . . . . . . . . . . . . . . . 27
Table 4. MS mRNA expression (area) and mortality(%) in ActD experiments in C. riparius 30
v

List of Figures
Figure I. PCR products for genomic and cDNA of MS gene from C. riparius 14
Figure 2. Sequence of cDNA MS gene 15
Figure 3. Effects of Cd (mM) on MS mRNA expression at 24 h . . . . . . . . . . . . . . . . • . . . . . . . . . . . .16
Figure 4. Effects of low Cd (mM) on MS mRNA expression at 24 h 18
Figure 5. Effects oflow Cd (mM) on MS mRNA expression at 48 h .19
Figure 6. Effects of high Cd (mM) on MS mRNA expression at 48 h 20
Figure 7. Effects of high Cd (mM) on MS mRNA expression in fed larvae of C. riparius at 48 h 21
Figure 8. Effects of heat shock on MS mRNA expression at 30 min 24
Figure 9. MS mRNA expression (area) vs. temperature (°C) 25
Figure IO. Effects of heat shock on ribosomal mRNA expression at 30 min 26
Figure 11. Effects of ActD on MS mRNA expression at 24 h 28
Figure 12. MS mRNA expression (area) vs. ActD (nM) 29
vi
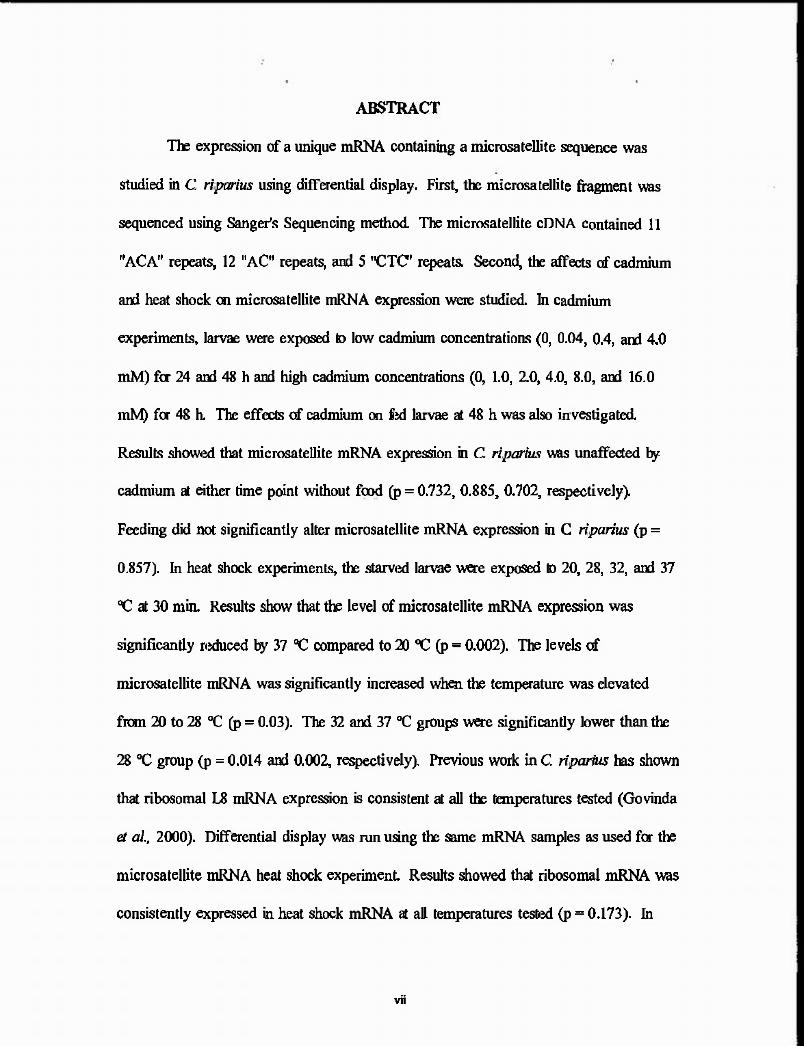
ABSTRACT
The expression of a unique mRNA containing a microsatellite sequence was
studied in C. riparius using differential display. First, the rnicrosatellite fragment was
sequenced using Sanger's Sequencing method. The microsatellite cDNA contained 11
"ACA" repeats, 12 "AC" repeats, and 5 "CTC" repeats. Second, the affects of cadmium
and heat shock on rnicrosatellite mRNA expression were studied. In cadmium
experiments, larvae were exposed to low cadmium concentrations (0, 0.04, 0.4, and 4.0
mM) for 24 and 48 h and high cadmium concentrations (0, 1.0, 2.0, 4.0, 8.0, and 16.0
mM) for 48 h. The effects of cadmium on fed larvae at 48 h was also investigated.
Results showed that microsatellite mRNA expression in C. riparius was unaffected by
cadmium at either time point without food (p = 0.732, 0.885, 0.702, respectively).
Feeding did not significantly alter microsatellite mRNA expression in C. riparius (p =
0.857). In heat shock experiments, the starved larvae were exposed to 20, 28, 32, and 37
°ҴC at 30 min. Results show that the level of microsatellite mRNA expression was
significantly reduced by 37 °C compared to 20 °C (p - 0.002). The levels of
microsatellite mRNA was significantly increased when the temperature was elevated
from 20 to 28 °C (p = 0.03). The 32 and 37 °C groups were significantly lower than the
28 °C group (p = 0.014 and 0.002, respectively). Previous work in C. ripartus has shown
that ribosomal L8 mRNA expression is consistent at all the temperatures tested (Govinda
et al., 2000). Differential display was run using the same mRNA samples as used for the
microsatellite mRNA heat shock experiment. Results showed that ribosomal mRNA was
consistently expressed in heat shock mRNA at all temperatures tested (p = 0.173). In
vii
actinomycin D experiments, a concentration of96 nM actinomycin D down regulated
microsatellite mRNA transcription in C. riparius (p = 0.054). The following was learned
from this project: 1) Results from the heat shock experiment showed that differential
display is a sensitive method to detect gene expression. 2) Results from cadmium studies
suggested that microsatellite mRNA can be used as a negative control in future cadmium
toxicity tests in C. riparius. 3) Results from heat shock studies indicated that this type of
stress does modify microsatellite mRNA expression in C. riparius ..
viii
INTRODUCTION
All eukaryotes carry random repeated sequences through out their genome mostly
in non-coding regions (Stephan and Soowon, 1993). The functions of these tandem
repeated sequences are not completely known (Griffith et al., 1996). Microsatellites, a
class of tandem repeated sequences, contain a high degree of polymorphism, thus they
can be used for population genetic studies (Rongnoparut et al., 1999). This work
describes a unique mRNA containing a microsatellite sequence. Its expression in
response to cadmium (Cd) elevated temperatures (heat shock), and a transcription
inhibitor {ActD) was investigated.
Based on their repeat lengths and array sizes, the tandem-repetitive sequences are
categorized into three groups of satellite, minisatellite, and microsatellite (Levinson and
Gutman, 1987). Satellite DNAs are more ordered, and they are the largest of the repeated
sequences. "Satellite DNA is found to consist of multiple tandem repeats of short
nucleotide sequences, stretching up to hundreds ofkilobases in length." (Griffith et al.,
1996). Satel1ite DNAs are located in heterochromatic regions close to centromeres and
telomers, where meiotic recombination is very low (Mather, 1939). The large size and
ordered structure of satellites are due to their location in the region of low recombination
(Charlesworth et al., 1986). In contrast, minisatellites are found in euchromatic regions
near subtelomers where the recombination rate is very high (Royle et al., 1988).
Minisatellites are also known as VNTRs (variable number tandem repeats). The number
of repeated units could be 15-100 base pairs long (Griffith et al., 1996). Minisatellites
have variable numbers of repeated sequences at different loci, and they vary from
1

individual to individual (Griffith et al., 1996). Microsatellites (MS), another class of
tandem repeated sequences, are close to minisatellites in terms of size. Like
minisatellites, MS have variable numbers of repeated sequences, and they vary from
individual to individual. MS are rich in sequences of'CA' (Griffith et al., 1996). MS
consist of repeats of dinucleotide, trinucleotide, or quatronucleotide base pairs. Each
repeated unit is usually less than 100 base pairs long. MS are mostly located in non
coding regions. Surprisingly, during the course of this project, we determined that MS is
also found in coding regions. "Because their high level of variation makes them a
powerful tool for identifying individuals and measuring gene flow, microsatcllites have
been used in genome mapping, in paternity exclusion, and in population genetic studies"
(Michalakis and Veuille, 1996; Colson and Goldstein, 1999). Since MS is used to
determine kinship or relations within a population, we wanted to study MS mRNA
expressed in Chironomous riparius in preparation for future ecological studies.
Why chiromonids? Chironomids are the larvae of midge fly. They are found in
freshwater and estuaries. Chironomids are the most abundant and the most widely
distributed groups of insects worldwide (Armitage et al., 1997). There are 15,000
different species of chironomids (Armitage et al., 1997). Chironomids spend most of
their life cycle (the larval stage) in water and sediments. The life cycle of chironomids
starts by the adult female laying eggs on water. Subsequently, the larvae hatch and live
in sediments. After four instars, larvae pupate. The pupae swim to the surface, and the
young adults emerge leaving the water (Pinder, 1986). Chironomids are a very good
source of food for fish, invertebrates, and some vertebrates living in water. The larval
stage is crucial in an ecological context (Oliver, 1971) as well as to study freshwater
2

toxicology (McCahon and Pascoe, 1988a). Chironomids are the most dominant species
found in polluted ponds, lakes, and rivers (Yamamura et al., 1983). They are an EPA
approved sediment test organism (US EPA, 1996) and can be used to measure water
quality.
Pollution caused by heavy metals, either natural or anthropomorphic, has been a
major concern and problem in aquatic ecosystems (K.aviraj and Konar, 1982). Natural
sources of heavy metal contamination are volcanic activities and forest fires (Nriagu,
1977). Sources of anthropomorphic pollution are industries such as mining and
manufacturing, automotive combustion, sewage. and agriculture chemicals (Nriagu,
1977; Nriagu and Pacyna, 1988). Examples of heavy metals that contaminate water and
sediment are cadmium (Cd), copper, silver, mercury, lead, and zinc (Sanders et al., 1993;
Al-Madfa et al., 1994). Research scientists are working hard to develop new techniques
that can be used to measure such contamination and develop bioassays that are crucial in
establishing good water quality criteria (Khangart and Ray, 1989).
Aquatic organisms resist toxicants by overexpressing or downregulating certain
genes. A good example of a heavy metal detoxification mechanism is metallothionein
(MT), which is also known as a metal-binding protein. Margoshes and Vallees first
isolated MT in 1957 from horse kidney. It was called the Cd-binding protein. Mrs are a
small protein rich in cysteine (Fowler et al .• 1987). Further research proved that MT
could be induced by Cd in a number of species including mammals (Kagi & Nordberg,
1979), fish (Noel-Lambot et al., 1976), limpets (Howard & Nickless, 1977) and crabs
(Olafson et al., 1979). These animals build tolerance to metal exposure by over
expressing MT (Yamamura et al., 1983). MT is widely distributed and found in
3

prokaryotes, protists, fungi, plants, as well as animals (Higham et al., 1986; Kagi &
Kojima, 1987).
Heat shock proteins, another class of stress proteins, are induced in response to a
variety ofstressors such as heat (Bauman et al., 1993), ethanol (Li, 1983), transition
series metals (Burdon et al., 1982; Levinson et al., 1980), sodium arsenite (Burden et al.,
1982), thiol reagents (Burden, 1986), and amino acids (Thomas & Mathews, 1989).
Since heat shock proteins can be induced by many agents, it's difficult to know the exact
mechanism responsible for induction (Burdon, 1986). Heat shock proteins are used by
the organisms to provide protection from environmentally induced cellular damage
(Sanders, 1993). Ritossa (1962) first isolated heat shock proteins. He reported dramatic
changes in gene activity of Drosophila hydei larvae by observing changes in "puffing"
patterns in the salivary gland polytene chromosomes. Heat shock proteins are also
referred to as stress proteins (Sanders, 1993). Heat shock proteins are very conserved and
found in many different types of organisms such as bacteria, molluscs, and humans
(Schlesinger, 1986; Margulis et al., 1989). When Brachionus plicatlis (rotifer) is
exposed to different concentrations of copper sulfate, an increase in level of stress protein
is observed (Cochrane et al., 1991). In our laboratory, we have used Cd as a chemical
specific stressor and heat shock as a general stressor in gene expression studies in C.
riparius.
To study the effects of environmental stressors such as Cd and heat shock on MS
mRNA expression in C. riparius, differential display (DD) was used. DD is a DNA
fingerprinting method developed by Pardee and Liang in 1992 that is used to study and
identify differentially expressed genes. In this method, mRNAs are isolated and
4

subjected to reverse transcription using an oligo dT primer, which binds the poly A tail of
mRNAs. Subsequently, the product of reverse transcription (cDNA) is subject to PCR,
using the same oligo dT primer plus a non-specific forward primer. Finally, the products
are separated on a sequencing gel and visualized by autoradiography. The bands can be
sequenced and/or cloned for identification of known genes or novel genes. In this
project, primers specific for MS mRNA were used instead of random primers.
This study was pursued because MS mRNA was identified in Cd-induced larvae
of C. riparius. Based on this observation, we hypothesized that MS might respond to
stressors. Our primary objective was to study the expression of MS mRNA in C. riparius
exposed to different concentrations of Cd. Thus, we could determine whether or not MS
was a stress responsive gene. As far as we know, there have been no reports on MS
containing mRNAs or their induction by stressors. Another reason for pursuing this
mRNA was that it might be used in future studies to measure genetic diversity in
populations of chironomids. This was based on the literature described earlier, in which
MS has been used to determine genetic diversity in other organisms. Studies have shown
that pollution can play a crucial role in natural selection among aquatic organisms
(Postma et al., 1994). The expression of MS mRNA was studied by experiments
involving the exposure of C. riparius to different strcssors such as Cd and heat shock.
The ability of DD to measure MS mRNA expression was also evaluated.
5

MATERIALS AND METHODS
A. Animals
Tue test organism was 4lh instar larvae of C. riparius. Chironomus larvae
(Chironomus riparius) were a gift from Dr. Alan Mcintosh. University of Vermont.
The larvae were maintained at 20 ± l °C [room temperature (RT)] with a 12:12 hours
light:dark photoperiod. The Chironomus larvae were raised on a substrate consisting
of acid-washed sand and cerophyll. Water for cultures and experiments was particle
and carbon filtered [CDPRM1206 and CDFC01204, respectively (Millipore Corp.,
MA)] and allowed to-stand 48 hours in order to remove residual chlorine. It had a pH
of 7.3 (Sentron Model 2001 pH System, Sentron Inc., WA) and hardness of 136 mg/L
(Model PHT-CM-DR-LT, Ward's Natural Science Establishments, Inc., USA). Acid
washed sand was prepared by placing sterilized, natural play sand (American Stone
Mix, Inc., MD) in IO percent HCI for 3 - 4 hours, washing it copiously in deionized
water and oven drying it overnight. Cerophyll is a dehydrated cereal of grass leaves
used by larvae to construct their tubes (Ward's Natural Science Establislunent, Inc.,
NY). Larvae were fed twice a week with a suspension of ground TetraDoro Green®
Floating Food Sticks (Tetra, Germany).
B. Total RNA Extraction and Preparation for Differential Display
Total cellular RNA was isolated using TriReagent (Sigma Biosciences, St. Louis,
MO). First, 10-12, 4th instar larvae of C. riparius were homogenized in 1 ml of
TriReagent using a 2 ml glass mortal and pestle. The homogenate was centrifuged at
12,000 rpm and 4 °C for 15 min. Then the supernatant containing DNA and RNA
6

and protein was transferred into an Eppendorf tube. Second, 0.2 ml of chlorofonn
was added, and the mixture was allowed to stand for 15 min at room temperature
(RT). After centrifuging as above, the RNA in the upper layer was transferred to a
clean Eppendorf tube. The RNA pellet was formed by precipitating with 0.5 ml of
cold isopropanol followed by 10 min of centrifugation as above. The RNA pellet was
washed with 0.5 ml of75% ethanol. The supernatant was removed, and the RNA
pellet dissolved in l 00 µl of pretreated with diethyl pyrocarbonate (depc-water)
(Sigma Chemicals, Co., St. Louis, MO). Total RNA was then subjected to Message
Clean (GenHunter Corporation, Nashville-lN). The purpose of message clean was to
get rid of any DNA contamination. The following steps were perfonned for Message
Clean. First, total RNA was subjected to DNase I digestion. This step ensured
digestion of any traces of DNA present in the RNA. Here, 50 µI of total RNA
(containing 20 µg) was added to 5.7 µl of !OX reaction buffer and l.O µl of
DNase I (10 U/µl) followed by incubation for 30 min at 37 °C. Second, samples were
extracted with 40 µI of phenol/chloroform (3:1) to remove Dnase I. The samples
were vortexed for 30 seconds and allowed to stand on ice for 10 min. Then the
mixture was centrifuged for 5 min at 4 °C and 12,000 rpm. Subsequently, the upper
aqueous phase was collected into another clean Eppendorftube. Third, clean total
RNA was precipitated using 5 µl of3 M sodium acetate and 200 µl of 100 % ethanol.
The samples were allowed to stand at - 70 °C for more than 60 min. Next, the
samples were centrifuged for 10 min at 4 °C and 12,000 rpm. The supernatant was
discarded, and the RNA pellet was washed using 0.5 ml of70 % ethanol by
centrifugation as above. The supernatant was then discarded, and the RNA pellet was
7

dissolved in 10 - 15 µI of depc-water. The RNA concentration was determined by
making a 5:995 dilution of the cleaned RNA followed by measuring the absorbance at
260 run. RNA samples were stored at - 70 °C.
C. Sequencing
MS specific primers were used to generate genomic DNA and cDNA. The
sequence for the positive primer (MSP5) was -AGCCCATACCTACCTGTGG and
the sequence for the negative primer (MSM25) was -
GGCATACAAGAGCAGCTATTGC. The PCR products were run on a 1.5 %
agarose gel. The major PCR products were cut out, and the DNA was recovered.
Sequencing was performed using the Ampli - Taq Cycle Sequencing kit (Life
Technologies, Gaithersburg, MD), which is based on the Sangers Sequencing method
(Sanger and Coulson, 1975). Bands obtained by DD were visualized by randomly
incorporating a.[32P]d.A TP. The sequencing products were separated on a 6 %
polyacrylamide gel by electrophoresis using a SequinGen II apparatus (BioRad,
Hercules, CA). The dried gel was exposed to X-ray film (Wolf Scientific
Autoradiography, Wolf X-ray Corp., W. Hempstead, NY) for 24 hand developed
manually. In addition, 3 major bands generated by DD were cut out and sequenced as
above.
D. Experimental Design
This project was divided into three major experimental sections. The first part
involved Cd experiments. The second part consisted of heat shock experiments. In
the third part, ActD experiments were performed.
8

Part I. Cd Experiments
In this part, the larvae were exposed to different concentrations of Cd. Tue Cd
experiments were further divided into fed versus starved larvae. Experiments
involving starved larvae were as follows: 0, 1, and 2 mM Cd for 24 h; 0.0, 0.04, 0.4,
and 4.0 mM of Cd for 24 hand 48 h; and 0, I, 2, 4, 8, and 16 mM Cd for48 h.
Experiments involving fed larvae were as follows: 0, I, 2, 4, 8, and 16 mM Cd for 48
h. All of the above experiments were run in duplicate or triplicate. The experimental
system consisted of 60 g of acid washed sand and 250 ml of test water prepared as
above. Total RNA was isolated from larvae as described above and subjected to DD
using primers specific for microsatellite mRNA. See Table 1 in the Results Section
for primer information.
Part II. Heat Shock Experiments
Starved larvae were exposed to 20, 28, 32, and 37 °C for 30 min. Experiments
were run in triplicate. The test system consisted of 60 ml of test water in a 150 ml
beaker. The beaker was placed in a waterbath and brought to appropriate temperature
before larvae were added. Total RNA was isolated from larvae as described above
and subjected to DD using primers specific for microsatellite mRNA.
Part III. ActD Experiments
Starved larvae were exposed to 0, 8.0, 24.0, 48.0, and 96.0 nM of ActD for
24 h. Experiments were run in triplicate. Total RNA was isolated from larvae as
described above and subjected to DD using primers specific for microsatellite
mRNA.
9
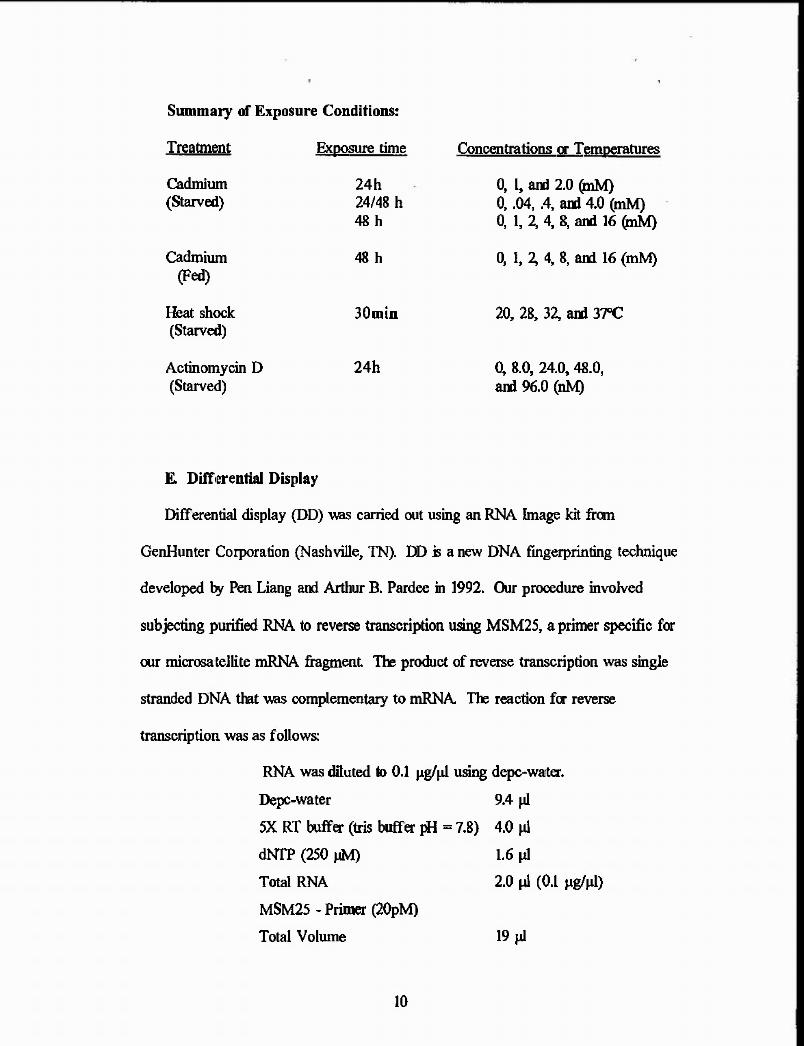
Summary of Exposure Conditions:
Treatment Exposure time Concentrations or Temperatures
Cadmium 24h 0, I, and 2.0 (mM) (Starved) 24/48 h 0, .04, .4, and 4.0 (mM)
48 h 0, r, 2, 4, 8, and 16 (mM)
Cadmium 48 h 0, I, 2, 4, 8, and 16 (mM) (Fed)
Heat shock 30min 20, 28, 32, and 37°C (Starved)
Actinomycin D 24h 0, 8.0, 24.0, 48.0, (Starved) and 96.0 (nM)
E. Differential Display
Differential display {DD) was carried out using an RNA Image kit from
GenHunter Corporation (Nashville, TN). DD is a new DNA fingerprinting technique
developed by Pen Liang and Arthur B. Pardee in 1992. Our procedure involved
subjecting purified RNA to reverse transcription using MSM25, a primer specific for
our microsatellite mRNA fragment. The product of reverse transcription was single
stranded DNA that was complementary to mRNA. The reaction for reverse
transcription was as follows:
RNA was diluted to 0.1 µg/µ1 using depc-water.
Depc-water 9.4 µ!
5X RT buffer (tris buffer pH - 7.8)
dNTP (250 µM)
Total RNA
MSM25 - Primer (20pM)
Total Volume
10
4.0 µI
1.6 µ!
2.0 µI (0.1 µg/µl)
19 µ!

Reverse transcription was carried out in a Gene Amp PCR System 2400
thennocycler (Perken Elmer, Branchburg, NJ). Samples were heated for 5 min at
65 °C, 60 min at 37 °C, 5 min at 75 °C, and stored at 4 °C. After IO min at 37 °C, the
thermocycler was paused and the reverse transcriptase (MML V) was added; samples
then finished the 60 min incubation at 37 °C.
Next, the products from reverse transcription were subjected to PCR (Polymerase
Chain Reaction). The PCR kit was obtained from Life Technologies (Gaithersburg,
MD). The PCR reaction for DD consisted of the following:
Deionized water 11.8 µI
!OX PCR buffer 2.0 µI
dNTP (25 µM) l.6 µI
MSP5 (20 pmol) 1.0 µI
MSM25 (20 pmol) 1.0 µI
Reverse transcription mix 2.0 µI
[32P]dATP (3000 Ci/rmuol) 0.2 µI
Taq DNA polymerase (5 U/ul) 0.2 µI
Total Volume 20.0 µI
PCR conditions were as follows: 94 °C for 3 min, then 35 cycles of94 °C for 30 sec
� 57 °C for 2 min-e 75 °C for 30 sec, followed by heating at 75 °C for 3 min, and
storage at 4 °C. The PCR products were separated by polyacrylamide gel
electrophresis (PAGE) and visualized as described for DD.
11

F. Quantification of MS mRNA
Bands from PAGE were analyzed by densitometry using SigmaGcl lanes (Sigma
Chemical Company, MS). Background was subtracted from total area. Statistical
analysis was done by one way ANOV A followed by Tukey Post-Hoc Test, where if p
� 0.05, the results were considered significant.
12

RESULTS
A. Sequence of MS mRNA
Prior to studying gene expression, the genomic and cDNA bands were sequenced.
Total RNA was subjected to reverse transcription using the MSM25 primer. Then, the
cDNA products were amplified using MSM25 and MSP5 primers (Table 1). Genomic DNA
was amplified at the same time as the cDNA using the same primers. Both genomic and
cDNA products were run on a 1.5 % agarose gel (Figure 1). On the gel, lane I was the 100
base pairs (bp) ladder, lane 2 was the genomic band, and lane 3 was the cDNA band. The
genomic band was slightly bigger(-290 bp) than the cDNA MS band (-260 bp). Both
bands were isolated from the gel and sequenced using the Sanger Sequencing method. Both
sequences contained the MS mRNA previously found in Cd induced larvae of C. riparius.
Based on the sequencing information, the genomic band apparently contained a piece of
intron at 5' end of the MS gene. The sequencing information indicated that the MS mRNA
consisted of 13 "ACA" repeated codons, 5 "CTC11 repeated codons, and 12 "AC" repeated
base pairs (Figure 2). It was 168 hp in length.
B. Cadmium experiments using differential display
This part of the study involved experiments with Cd in starved or fed larvae using
differential display as a technique to measure gene expression. The first study was
conducted on starved larvae with Cd concentrations of 0, 1, and 2 mM at 24 h (Figure 3).
Samples were run in triplicate. Results indicated that the MS primers were binding to three
major bands. After sequencing, band A was identified as ribosomal mRNA, band B was
unknown, and band C was identified as MS mRNA. Band C was sequenced and found to be
shorter than the cDNA above, 168 hp. This suggested. that our forward primer was binding
13

I 2 3
3JO bp Genomic
cDNA
Figure 1. PCR products generated from genomic and cDNA of MS gene from
C. riparius.
PCR products were separated by 1.5 % agarose gel. Lane 1 was 100 hp ladder, lane
2 was the PCR product obtained from genomic DNA, and lane 3 was the cDNA obtained
from MS mRNA. The genomic band was -290 bp and the cDNA band was - 260 bp.
The primers were MSP5 and MSM25.
14

5' CTAAATAGCCCATACCTACCTGTGGATGTGTCAAACCACATCTACGACTAGCT CAACAACTACCACTAGCTCGACAACAACAACCTCAACCACAACAACCCCTT
CAACAACAACAACAACAACAACTACCAATTGTCCTCCTCCACCTTGTTGCAA
TAGCTGCTCTTGTATGCC-3'
Figure 2. Sequence of cDNA MS gene
Primers are underlined and italized. The negative primer sequence is reversed and
complementary. Bold letters indicate the repeats of"ACA", "CTC", and "AC" base
pairs. The sequence contains, 13 repeats of"ACA", 5 "CTC", 12 "AC" and 16 "CAA"
base pairs. This sequence was obtained from Band C in Figure 3. It is smaller than the
band in Figure I. lane 3, which contained the MS sequence.
Table 1. Primer pairs with *Tm values and location on Sequence
Primers Primer Sequence ( 5' 4 3') Tm• Location in Figure 2
MS MPS AGCCCATACCTACCTGTGG 50 6-24
MSM25 GGCATACAAGAGCAGCTATTGC 54 149 -170
"Tm is the temperature at which half of the primer population is annealed, which was
determined by PC Gene (IntelliGenetics, Mountainview, CA). After a series of
experiments, it was determined that an annealing temperature of 57 °C was more specific.
15

Cd (mM): (OJ [I.OJ (2.0]
Band A
BandC
Figure 3. Effect of Cd (mM) on RNA expression at 24 b.
The results obtained from DD showed that the MS primers generated three bands. After
sequencing bands A and C, band A was determined to be a ribosomal RNA, and band C was
identified as MS mRNA. Band B could not be identified. The study focused on MS mRNA
expression (band C). This result also showed an induction of MS mRNA at 1.0 and 2.0 mM Cd.
All of the samples were run in triplicate.
16

to more than one site on the MS gene. The remainder of the project focused on the MS mRNA
band only. Also, the resnlts from Figure 3 suggested that the MS mRNA bands was induced at l
and 2 mM of Cd. That was why we continued with the project.
The next step was to use low Cd concentrations (0.0, 0.04, 0.4, and 4.0 mM) in starved
larvae to study MS mRNA expression using DD. First, larvae were exposed to low Cd
concentrations at 24 h (Figure 4). Results indicated that the level of MS mRNA expression was
not affected at these concentrations. The samples were run in duplicates, p = 0. 732. The
mortality rate was low. There was 15 % mortality rate at the highest concentration, 4.0 mM Cd
(Table 2). Second, the larvae were given low Cd concentrations but the exposure period was
increased to 48 h (Figure 5). This result suggested that increasing time did not have any effects
on level of expression. The samples were run in duplicates, p = 0.885. However, the mortality
rate increased by one fold (Table 2). Larval mortality rate was 30 % at the highest concentration,
4.0 mM Cd. Third, larvae were exposed to high Cd concentrations (0, l, 2, 4, 8, and 16 mM) at
48 h {Figure 6). The level of MS mRNA expression was not affected at high Cd concentration.
The MS mRNA expression was very consistent. The samples were run in duplicate, p = 0. 702.
Larval mortality rate was very high; 65% of larvae died at the highest concentration of Cd (16.0
mM) at 48 h (Table 2).
Finally, the larvae were fed and exposed to high Cd concentrations (Figure 7). The
purpose of this study was to see if feeding was important for toxicity. Feeding did not affect MS
mRNA expression significantly. Samples were run in duplicates, p = 0.857. Larval mortality
rate was high; 55% of larvae died at the highest concentration of Cd (16.0 mM) at 48 h (Table 2).
17

Cd (mM): (OJ (0.04] (0.4] (4.0]
Figure 4. Effects of low Cd (mM) on MS mRNA expression at 24 h.
The results indicated that the expression of MS mRNA was not affected at 0, 0.04, 0.4,
and 4.0 mM of Cd at 24 h, p = 0.732. Larval mortality was negligible, ranging from Oto 15%.
Samples were run in duplicate.
18

Cd(mM):
Mortality:
(OJ
5%
(.04)
20%
(0.4) (4.0]
20% 30%
Figure 5. Effects of low Cd (mM) on MS mRNA expression at 48 b.
The level of MS mRNA expression were not significantly altered at 0, 0.04, 0.4, and 4.0
mM of Cd at 48 h, p = 0.885. However, larval mortality increased by one fold compare to that
at 24 h. Samples were run in duplicate.
19

Cd (mM): [OJ
Mortality: 0°/o
[1.0J [2.0J [4.0J [8.0J
Figure 6. Effects of high Cd (mM) on MS mRNA expression at 48 h.
Tue levels of MS mRNA expression were not significantly altered by 0, 1.0, 2.0, 4.0, 8.0, and
16.0 mM of Cd at 48 h, p - 0.702. However, larval mortality rate increased drastically compared to
low concentrations at 24 and 48 h. Samples were run in duplicate.
20

Cd(mM): [OJ [I.OJ [2.0] [4.0] (8.0] (16.0J
- - - - -
Mortality: 0% 10% 10% 400fct 40% SS%
Figure 7. Effects of high Cd (mM) on MS mRNA expression in fed larvae at48 h.
Statistical analysis showed that there was no difference in the levels of MS mRNA
expression at high Cd concentration with feeding, p = 0.857. The exposure period was 48 h,
and the larvae were fed with a fish food suspension during Cd exposure. Samples were run in
duplicate.
21

Table 2. MS mRNA expression (area) and mortality (o/o) in different Cd
experiments at 24 and 48 b.
Low Cd at24 h Low Cd at48 b High Cd at 48 h High Cd at 48 h (starved larvae) (starved larvae) (starved larvae) (fed larvae)
Cd mRNA M Cd mRNA M Cd mRNA M Cd mRNA M
(mM) (Area) (%) (mM) (Area) (%) (mM) (Area) (%) (mM) (Area) (%)
0 2805 0 601 0 1981 0 1310 0 2891 5 0 688 5 0 1421 0 0 1236 0
0.04 2918 0.04 779 l 1922 l 1342 0.04 2776 0 0.04 856 20 l 1994 20 l 1343 10 0.4 2289 0.4 1016 2 1878 2 1171 0.4 2987 0 0.4 400 20 2 1877 25 2 1322 10 4 2590 4 627 4 1761 4 1507 4 2684 15 4 757 30 4 1961 45 4 1232 40
8 1969 8 1528 8 1930 50 8 445 40 16 1889 16 1193 16 1983 65 16 1157 55
Area = the area determined by "lanes" using SigmaGel
% M = Percent Larval Mortality
n = IO for each sample
22

C. Heat shock experiment using differential display
The second part of the project involved heat shock experiments using differential
display. Toe larvae were exposed to 20 °C, 28 °C, 32 °C, and 37 °C for 30 min (Figures
8 and 9). Samples were run in triplicate, p - 0.002. The results showed that there was a
significant reduction in the level of MS mRNA expression when exposed to 37 °C but not
the lower temperatures. See Table 3 for larval mortality rate and band intensity (area)
determine by the SigmaGel.
To ensure that the heat shock study was accurate, the heat shock RNA was tested
with ribosomal primers. Previous work (Govinda et al., 2000) has shown that ribosomal
protein mRNA does not respond to heat shock or Cd. Results showed that the ribosomal
protein mRNA expression was very consistent, indicating that the reduction in MS
mRNA was real (Figure 10). Samples were run in triplicate, p = 0.173. See Table 3 for
larval mortality rate and band intensity (area) determine by the SigmaGel.
D. ActinomycinD experiment using differential display
Larvae were exposed to different concentrations of ActD (0, 8, 24, 48, and 96
nM) at 24 h. ActD was used to ensure that the expression of the MS mRNA could be
modulated. This was another assay control. Results indicated that there was a significant
difference between the control group (no ActD added) and the Wghest concentration of
ActD, 96 nM (Figures 11 and 12). Samples were run in triplicate, JF 0.054. Larval
mortality and band intensity (area) determined by the Sigam Gel are reported in Table 4.
23

HS: 20'C 28°C 32°C 37°C
Figure 8. Effects of heat shock on MS mRNA expression at 30 min.
The levels of MS mRNA expression were significantly affected when exposed to
different temperatures for 30 min. p = 0.002. At28 °C, the levels of MS mRNA were
increased, when compared to room temperature (20 °C), p = 0.033. The expression of MS
mRNA was significantly reduced at 32 °C and 37 °C, p = 0.014 and 0.002, respectively, when
compared to 28 °C. Samples were run in triplicate.
24

900 •
800
-..- 00 e = II, 00 e
00 Q
!
� 00
00 a
"' :e 00
100
0 20 28 32 37
Temperature (°C)
Figure 9. MS mRNA vs. Temperature.
MS mRNA was significantly affected by elevated temperatures, p = 0.002. The level of
MS mRNAexpression was induced at 28 •c ( +p-0.003), but reduced at 32 •c (•p-0.014)
aud 37 °C (*p-0.002) compared to 28 °C. Error Bar- S.D.
25

Ribosomal 28°C 32°C 37°C
- - -
Figure 10. Effects of heat shock on ribosomal protein mRNA expression at 30 min.
The levels of ribosomal protein rnRNA expression were not affected by heat shock,
p = 0.173. This was a control for MS rnRNA expression in the heat shock experiment.
Samples were run in triplicate.
26

Table 3. MS mRNA expression (area) and mortality(%) in beat shock
Experiment at 30 min.
Temperature MSmRNA Ribosomal mRNA Mortality
("C) (Area) (Area) (%)
20 264 647 0
20 445 462 0
20 469 588 0
28 635 529 0
28 645 557 0
28 829 671 0
32 503 670 0
32 288 545 0
32 217 682 0
37 195 387 0
37 176 496 0
37 153 529 0
Area = the area determine by "lanes" using Sigma Gel
n = 10 for each sample
27

ActD (nM): (OJ [8] (24) (48] (96)
Mortality:
Figure 11. Effects of Actinomycin (nM) on MS mRNA expression at 24 h.
The levels of MS mRNA expression were significantly reduced at the highest
concentration of ActD (96 nM), p = 0.054. Larval mortality rate was low at 24 h, ranging
from O to 0. 7%. Samples were run in triplicate.
28

480
- "' e sec
"' " � � 240 - <( z
..:
E 120 rn ::;;
0
Actinomycin D (nM)
Figure 12. MS mRNA vs. ActD.
The level of MS mRNA was significantly reduced at 96 nM ActD compared to control,
* p = 0.054. Error Bar= S.D.
29
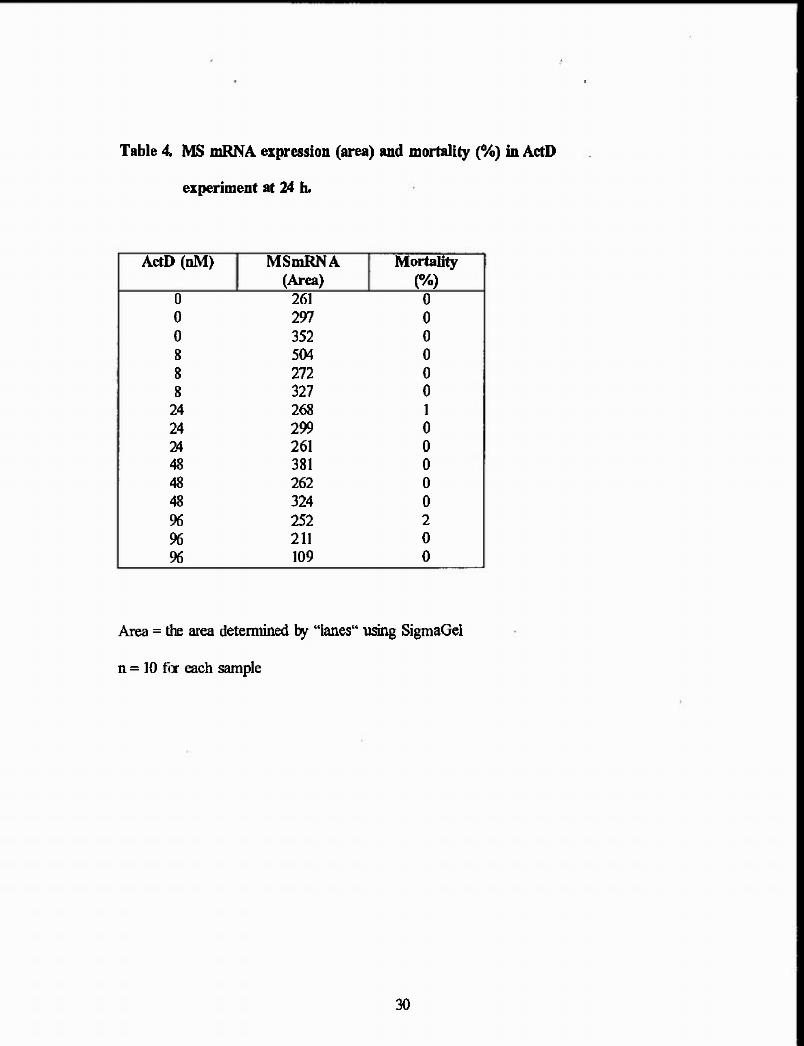
Table 4. MS mRNA expression (area) and mortality (o/o) in ActD
experiment at 24 h.
ActD (nM) MSmRNA Mortality (Area) (%)
0 261 0
0 297 0
0 352 0
8 504 0
8 272 0
8 327 0
24 268 1
24 299 0
24 261 0
48 381 0
48 262 0
48 324 0
96 252 2
96 211 0
96 109 0
Area = the area determined by "lanes" using SigmaGel
n = 10 for each sample
30
DISCUSSION
The expression of MS mRNA was studied in C. riparius. Chironomids were the
organism of choice due to many reasons: I) It is an EPA approved sediment teste organism
(US EPA, 1996). 2) It is easy to handle in the lab (McCahone and Pascoe, 1988a). 3) It is
the most abundant and diverse insect geographically (Taylor et al., 1991). 4) It is the
predominate animal found in sediments of most polluted ponds, lakes, and rivers (Y amamura
et al., 1983; Pinder, 1986). 5) Our laboratory is interested in studying diversity in
chironomids population using MS mRNA. Studies conducted on other organisms such as
manunals (Dib et al., 1996), protozoa (Su and Willems, 1996), mosquitoes (de Sousa et al.,
1996; Lehmann et al., 1996; Boyce et al., 1997; Estoup et al., 1996; Lanzaro et al., 1995;
Lelunann et al., 1997; Schlottere et al., 1997), and plants (Causse et al., 1994) have used MS
as a tool for genetic mapping. MS has high levels of polymorphism, and it is very abundant in
genomes (Rongnoparut et al., 1999). For these reasons, MS has been used for determining
kinship (Queller et al., 1993; Blouin et al., 1996) and assessing intrapopulation variability and
substructtne (Bowcock et al., 1994: England et al., 1996; Favre et al., 1997).
The sequences for MS cDNA and genomic DNA were obtained from a composite
often larvae (Figure 1). The chironomid MS sequencing information was similar to MS
sequences documented for other organisms (Colson and David B.G., 1999). The size of the
MS band in C. riparius was within the expected range of 100 - 200 base pairs (Stephon and
Cho, 1993). The sequence had 13 "ACA" repeats, 12 "AC" repeats, 5 "CTC" and 16 "CAA"
repeats (Figure 2). This was comparable to other MS sequences in that it had repeats of
dinucleotides and trinucleotides which were rich in adenine and cytosine (Colson and
Goldstein, 1999; Griffith et al., 1996). Using the MS primers, DD showed that there were
31
three bands produced that were close in size (Figure 3). All three bands were sequenced.
Band A was identified as ribosomal mRNA, band B was unknown, and band C was identified
as MS mRNA. Attempts were made to increase the stringency of the PCR condition by
increasing primer annealing temperatures. These attempts significantly reduced the number of
bands on DD. Therefore, the PCR cycle was modified in later experiments by increasing the
annealing temperature from 54 °C to 57 °C.
Cadmium is a heavy metal that is a carcinogen. It has been found to induce
expression of stress responsive genes (Liao and Freedman. 1998), including metallothionein
in most organisms. The expression of the metallothionein gene was increased by 5.6 fold
when Drosophila was exposed to 0.01 mM Cdat 24 h (Maroni eta/., 1986), and 15 fold when
molluscs was exposed to 0.2 µM Cd at 24 h (Roesijadi et al., 1994).
DD was used to determine if MS mRNA, in C. riparius, would respond to
cadmium. Low and high cadmium concentrations were tested. Low cadmium concentration
were 0.04, 0.4, and 4.0 mM (Figures 4 and 5). These concentrations were similar to the
cadmium concentrations that cause metallothionein gene induction in Drosophila
melanogaster (Maroni, 1995). The results from DD indicated that MS mRNA expression was
not induced at low cadmium concentrations. Cadmium concentrations were increased to more
lethal levels (1.0 mM, 2.0 mM, 4.0 mM, 8.0 mM, and 16.0 mM). Toe results from DD
indicated that MS mRNA expression was comparable to control at these concentrations. The
24 and 48 h exposure times used in the low and high cadmium experiments were the same as
those used in metallothionein gene induction in Drosophila (Maroni et al., 1986) and molluscs
(Roesijadi et al., 1994).
32

The last Cd experiment, involving high cadmium toxicity, was conducted on fed
larvae (Figure 7). The purpose of this experiment was to see if feeding would induce the
level of MS mRNA expression. Research done by Postma (1994) and Pascoe (1990) has
suggested that feeding increases cadmium toxicity. Feeding larvae during cadmium
exposure might have increased, hypothetically, ingestion of cadmium as cadmium binds
to food particles. However, the data did not show any induction of MS mRNA
expression (Figure 7). In future studies, the feeding experiment should be repeated
because certain factors were not taken into consideration. These factors, include the
amount and kind of food given to the larvae and body weight, which plays a crucial role
in cadmium exposure and should affect expression of stressed-genes as suggested by
Lanno (1989) and Krantzber (1989).
There is no published data indicating the response of MS mRNA during acute
cadmium exposure in other organisms. Based on our results it can be concluded that MS
mRNA expression is unaffected by low or high cadmium concentrations in C. riparius.
Additionally, feeding the larvae during the cadmium exposure made no difference.
Therefore, MS mRNA can be used as an internal control for studying cadmium toxicity
using other genes of C. riparius.
Many organisms have been found to respond to environmental stressors such as
heat or chemical exposure by inducing certain genes (Bond et al., 1993). For example,
Drosophila bus/di has a heat shock response when temperature is increased from 25 °C to
30 °C (Ritossa, 1962). Another study showed a heat shock response in Drosophila
melanogaster when the temperature was increased from 20 °C to 28 °C and 32 °C
(Govinda et al., 2000). In order to see if MS mRNA would respond to elevated
33
temperatures in C. riparius, a heat shock experiment was perfonned. Toe larvae were
exposed to 20 °C, 28 °C, 32 °C, or 37 °C for 30 min (Figures 8 and 9). The exposure
period for heat shock response in C. riparius was similar to the exposure time used to
cause a heat shock gene induction in Dorosophila (Govinda el al., 2000). Results from
DD indicated that MS mRNA expression was induced when exposed to 28 °C. However,
when the temperature increased to 37 °C, the expression decreased. The change in
expression suggested that the high levels of stress at 32 and 37 °C down regulated MS
mRNA.
Since MS mRNA was significantly affected by heat shock, a control study was
conducted. Previous work in C. riparius has shown that ribosomal protein mRNA
expression is consistent at all of the temperatures tested (Govinda et al., 2000).
Therefore, ribosomal protein mRNA can be used as a control when studying heat shock
in C. riparius. DD was run using the same mRNA as used for MS mRNA heat shock
experiments (Figure 10). The level of ribosomal protein mRNA was unchanged by heat
shock as expected. These results verify that the changes seen with MS mRNA were gene
specific.
Studies done in our laboratory have indicated that Chironomus gene transcription
is inhibited by ActD (Govinda et al., 2000). ActD is an antibiotic that binds to DNA and
causes a decrease in the level of transcription in all genes (Govidna et al., 2000). As the
concentration of ActD increases, the level of gene transcription should decrease. The
level of MS mRNA expression was significantly reduced at the highest concentration of
ActD, 96 nM (Figures 11 and 12).
34

During this project, the ability of DD to measure differentially expressed genes
was evaluated. Some problems that were encountered are as followings: the bands were
sometimes smeary and hard to distinguish. which could also be caused by many factors
including poor RNA quality. old reagents, or gel conditions (Linskens et al., 1998). Also
high background and intense bands made it difficult to read the results. Can DD be used
to measure differentially expressed genes? Yes, the results presented here indicate that
significant changes in gene expression can be measured. A modified DD technique has
been developed, recently, called enhanced differential display (EDD; Linskens et al.,
1998). EDD is more specific and gives reproducible results. In this method, the primers
are allowed to bind nonspecifically for the first 10 cycles by reducing the optimal
annealing temperature. For the remaining 20 cycles, the primer annealing temperature is
increased to the optimal annealing temperature. This method reduces the number of
bands produced in DD. In addition, certain things should be considered when performing
DD. (I) RNA obtained should be subject to the Message Clean, which will degrade any
protein and DNA contamination. (2) The reagents in the protocol should be fresh. (3)
The running buffer should be made with the right pH and concentration. ( 4) The bands
look better (less dark) when a[32P] dATP is one week past its zero day. (5) Most
importantly, the exact amount of each sample should be loaded on the gel. Any leakage
of the sample in the buffer will result in inaccurate results. This skill is acquired with
practice.
35

SUMMARY
The expression of MS mRNA was studied in C. riparius. The first part of the
project involved sequencing a fragment of the MS gene from both the genomic DNA
(Figure 1, lane 2) and cDNA (Figure 1, lane 3). The genomic MS band was-290 base
pairs long and the cDNA MS band was -260 base pairs long. Subsequently, the
sequences showed that the size difference was probably due to a piece of intron at the 5
end. The cDNA MS band in DD was 168 hp, indicating that the positive primer was
binding to more than one site along the MS gene. Tue sequencing information indicated
13 "ACA" repeats, 12 "AC" repeats, and 5 "CTC" repeats (Figure 2). The primers used
during rPCRand PCR were MSM25 and MSP5 (Table 1). The primer anoealing
temperature was modified from 54 °C to 57 °C, which gave more specific products on
DD. The primers generated multiple bands only one of which was MS mRNA. DD
allowed us to quanitate the MS mRNA in exclusion of the other two.
The second part of this project was to study the effects of Cd on MS mRNA
expressicin in C. riparius using DD. Experiments above showed that when larvae were
exposed to low Cd concentrations for 24 h, the expression of MS mRNA was not induced
(p = 0. 732). Increasing the Cd exposure period to 48 h showed that the level of MS
mRNA was still unaffected (p = 0.885). However, as the Cd exposure period increased
by a day, the mortality rate increased by one fold (Table 2). Since, exposure to low Cd
concentration at 48 h did not show induction of MS mRNA, the Cd concentration was
increased to a more lethal dose (16 mM-high Cd concentration). Results clearly indicated
that the level of MS mRNA expression was not affected at high Cd concentration (p =
0.702). However, the mortality rate increased drastically (Table 2). The last experiment,
36

involving high Cd toxicity at 48 h, was conducted on larvae of C. riparius that were fed.
Results showed that MS mRNA was not induced in the fod larvae (p • 0.857). Overall
results showed that MS mRNA was not affected by any Cd concentrations tested in fed or
starved larvae. Thus, MS mRNA can be used as an internal control for studying Cd
toxicity in other genes of C. riparius.
The third part of the project involved exposing C. riparius to different
temperatures. The heat exposure period was 30 min. Results showed that the level of
MS mRNA expression was significantJy decreased at 37 °C compared to control (p =
0.002). The level of MS mRNA was significantly increased when the temperature was
elevatod from 20'C lo 28'C ( p = 0.033). In addition, the 32 and 37 'C groups were
significantly lower than the 28'C group (p- 0.014 and 0.002, respectively.)
Since the effects of temperatures were significant, a control study was conducted.
When studying gene expression in C. riparius, ribosomal LS mRNA is used as an internal
control because it is not induced by Cd or heat shock (Govinda et al., 2000). The mRNA
from the heat shock experiment was reverse transcribed and amplified using specific
primers for ribosomal L8 mRNA. Results showed no induction of ribosomal LS mRNA,
as expected (p = 0.173). This indicates that the changes in MS mRNA in heat shock
studies were gene specific.
In the last part of this project, ActD was used to show the down regulation of MS
m.RNA ActD is a chemical that binds to DNA and causes a decrease in the level of
transcription in all genes. As the concentration of ActD increases the level of gene
transcription should decrease (Govinda et al., 2000). The level of MS mRNA expression
was significantly reduced at the highest concentration of ActD, 96 nM (p - 0.054).
37

LITERATURE CITED
Al-Madfa, H., Aboul Dahab 0., and Holail H. (1994). Mercury pollution in Doha
(QATAR) coastal environment. Environmental Toxicology and Chemistry
13: 725-735.
Annitage, P., Cranston P.S. and Pinder L.C.V. (eds). The Chironomidae: the biology
and ecology of non-biting midges. Chapman & Hall. NY: 1995, 1-24.
Bauman, J.W., Liu Jiklaassen C.D. (1993). Production ofmetallothionein and heat
shock proteins in response to metals. Fundam Appl Toxicol 21 (1 ): 15-22.
Bentivegna, C.S. and Cooper K.R. (1993). Reduced chromosomal puffing in
Chironomus tentans as a biomarker for potentially genotoxic substances.
Environmental Toxicology and Chemistry 12: 1001-1011.
Blouin, M.S., Parsons M., Lacaille V. and Lotz S. (1996). Use ofmicrosatellite loci to
classify individuals by relatedness. Mol. Ecol. 5: 393 -401.
Bond, J.A., Carole R.M.G and Brian P.B. (1993). Age-dependent expression of
proteins in the cladoceran Daphnia magna under nonnal and heat-stress
conditions. Comp. Biochem. Physio/. 1068 (4): 913-917.
Bowcock, A.M., Linares A.R., Tomfohrde J., Minch E., Kidd J.R. (1994). High
resolution of human evolutionary tree with polymorphic microsatellites. Nature.
368: 455 - 457.
Boyce, W .M., Hedrick P .W., Muggli-Cockett N.E., Kalinowski S., Cecilia M., Penedo
T., Ramey II R.R. (1997). Genetic variation of major histocompatibillity
complex and microsatellite loci: a comparison in bighorn sheep. Genetics.
145: 421 -433.
38

Estoup, A., Solignac M., Comuet J.M., Goudent J., Scholl A. (1996). Genetic
differentiation of continental and island populations of Bombus terrestris
(Hymenoptera: Apidae) in Europe. Mo/ Ecol. 5: 19 - 31.
Favre, L., Balloux F., Goudet J. and Perrin N. (1997). Female biased dispersal in the
monogamous mammal Crocidura russula: evidence from field data and
microsatellite patterns. Proc. R. Soc. Lond. Ser. B 264: 127 - 132.
Fowler, B.A., Hildbrand C.E., Kojima Y. and Webb M. (1987). Nomenclature of
metallothionein. In Metallothionein II, edited by J.H.R. K.agi and Kojima Y.
Birkhause-Ver/ag, Basel: 19-22.
Griffith, A.J.F., Miller J.H., Suzuki D.T., Lewontin R.C., Gielort W.M. Genetic
Analysis. 6th ed. W.H. Freeman and Company. New York: 1996.
Higham, D.P., Sadler P.J. and Scawen M.D. (1986). Cadmium-binding proteins in
Pseudomonas putida: Psedothioneins. Environ. Health Perspec. 65: 5-11.
Howard, A.G. and Nicless G. (1977). Heavy metal complexation in polluted molluscs I.
Limpets (Patella vulgata and Patella intermedia). Chem.-Biol. Interact.
16: 107-114.
Kagi, J.H.R. and Nordberg M., eds (1979). Metallothionein. BirkhauseN-Verlag, Basel.
Kagi, J.H.R. and Kojima Y. (1987). Chemistry and biochemistry of metallothioneins.
In: Metallothioneins II; Experiential Supplementum 52, J.H.R. K.agi
and Y. Kojima, ed. Birkhausen-Verlag. Basel: 25-61.
K.aviraj, A. and Konar S.K. (1982). Acute toxicity of mercury, chromium, and cadmium
to fish, plankton, and worms. Giobos 9: 97-100.
40
K.hangarot, B.S. and Ray P.K. (1989). Sensitivity of midge larvae of Chironomus
tentans fabricius (Diptera Chironomidae) to heavy metals. Bull. Environ.
Con/am. Toxicol. 42: 325-330.
Krantzberg, G. (1989). Metal accumulation by chironomids larvae: the effects of age
and body weight on metal body burdens. Hydrobiologia 188/189: 497-506.
Kreamer, G.L., Squibb K., Gioeli D., Wirgin I. (1991). Cytochrome P 4501A mRNA
expression in feral Hudson River tomcod. Environmental Research 55: 64-78.
Lanno, R.P., Hickie B.E., Dixon D.G. (1989). Feeding and nutritional considerations in
aquatic toxicology. Hydrobiologia 188/189: 525-531.
I.anzaro, G.C., Zheng L., Toure Y.T., Traore S.F., Kafatos F.C., Vemick K.D. (1995).
Microsatellite DNA and isozyme variability in a West African population of
Anopheles gambiae. Insect Mo/ Biol. 4: 105 - 112.
Lehmann, T., BesanskyN.J., Hawley W.A., Fahey T.G., Kamau L., Collins F.H. (1997).
Microgeographic structure of Anopheles gambiae in western Kenya based on
mtDNA and microsatellite loci. Mo/ Ecol. 6: 243 - 253.
Lehmann, T., Hawley W.A., Kauau L., Fontenille D., Simard F., Collins F.H. (1996).
Genetic differentiation of Anopheles gambiae populations from East and West
Africa: comparison of microsatellite and allozyme loci. Heredity. 11: 192 - 208.
Levinson, G., and Gutman G.A. (1987). Slipped-strand mispairing: A major mechanism
for DNA sequence evolution. Mol. Biol. Evol. 4: 203-221.
Levinson, W., Opperman H. and Jackson J. (1980). Biochim. Biophys. Acta
606: 170-180.
Li, G.C. (1983). J. Cell Physiol. ll5: ll6-122.
41

Linskens, M.H.K., Tonkin A.L., and Saati M.S. (1998). Enhanced differential
display: a reproducible method for the analysis of differential gene
expression. Cell Biology. 2nd Ed. 4: 275-280.
Margoshes, M. and Vallee B.L. (1957). A cadmiwn protein from equine kidney cortex.
J. Am. Chem. Soc. 79: 4813-4814.
Margulis, B. A., Antropova 0. Y., and Kharazova A.D. (1989). 70kDa heat shock
proteins from mollusc and human cells have common structural and functional
domains. Comp. Biochem. Physiol., 94: 621.
Maroni, G., Lastowski-Perry D., Otto E., and Watson D. (1986). Effects of heavy
metals on Drosophila larvae and a metallothionein cDNA. Environmental Health
Perspectives 65: 107-116.
Mather, K. (1939). Crossing over and heterochromatin cluomosomes of Drosophila
me/anogaster. Genetics 24: 413-435.
Mee.hon, C.P. Pascoe D. (1988a). Culture technique for three fresh water
macroinvertebrates species and their use in toxicity tests. Chemosphere
17: 2471-2480.
Yannis, M. and Veuille M. (1996). Length Variation ofCAG/CAA trinucleotide repeats
in natural populations of Drosophila melanogaster and its relation to the
recombination rate. Genetics 143: 1713-1725.
Nrigu, J.O. (1977}. Global inventory of natural and anthropogenic emissions of trace
metals to the atmosphere. Nature 279: 409-411.
Nrigu, J.O. and Pacyna J.M. (1988). Quantitative assessment of worldwide
contamination of air, water, and soils by trace metals. Nature 333: 134-139.
42

Noel-Lambot, F. (1976). Distribution of cadmium, zinc, and copper in the mussel,
Mytilus edulis. Existence of cadmium-binding proteins similar to
metallothioneins. Experientia 32: 324-326.
Noel-Lambot, F., Gerday C.H. and Disteche A. (1978). Distribution of Cd, Zn, and Cu
in liver and gills of the eel Anguilla anguilla with special reference to
metallothioneins. Comp. Biochem. Physiol. 61C: 177-187.
Olafson. R. W. and Thompson J.A.J. (1974). Isolation of heavy metal binding proteins
from marine vertebrates. Mar. Biol. 28: 83-86.
Olafson, R.W., Sim R.G. and Boto K. G. (1979). Isolation and chemical characterization
of the heavy metal-binding protein, metallothionein, from marine invertebrates.
Comp. Biochem. Physiol. 628: 207-416.
Oliver, D.R. (1971). Life history of the Chironomidae. Ann. Rev. Entomol.
16: 211-30.
Ovemell, J. and Trewhella E. (1979). Evidence for the natural occurrence of (cadmium,
copper)-metallothionein in the crab Cancer pagurus. Comp. Biochem. Physiol.
64C: 69-76.
Pascoe, D., Brown A.F., Evans B.M.J., McKavanagh C. (1990). Effects and fate of
cadmium during toxicity tests with Chironomus riparius the influence of food and
artifical sediment. Arch Environ Contam Toxicol 19: 872-877.
Pinder, L.C. V. (1996). Biology of fresh water Chironom.idae. Annual Review
of Entomology 31: 1-23.
43

Postma, J.F., Buckert-de Jong M.C., Staats N., Davids C. (1994). Chronic toxicity of
cadmium to Chironomus riparius (Diptera: Chironomidae) at different food
levels. Arch Environ. Contam. Toxico/ 26: 143-148.
Postma, J.F. and Cees D. (1995). Tolerance induction and life cycle changes in
cadmium-exposed Chironomus ripartus (Diptera) during consecutive
generations. Ecotoxicology and Environmental Safety 30: 195-202.
Queller, D.C., Strassmann J.E. and Hughes C.R. (1993). Microsatellites and kinship.
Trends Ecol. Evol. 8: 285 - 288.
Ritossa, F. (1962). Experiential 18: 571-573.
Rongnoparut, P., Nuntaree S., Rampa R., Sarapee Y., and Kenneth J.L. (1999).
Estimates of gene flow among Anopheles maculatus populations in Thailand
using microsatellite analysis. Am. J Trop. Med. Hyg. 60(3): 508-515.
Roesijadi, G. (1994). Metallothionein induction as a measure of response to metal
exposure in aquatic animals. Environ. Health. Perspect. 12: 91 - 96.
Royle, N.J., Clarkson R.E., Wong Z. and Jeffrey A.J. (1988). Clustering of
hypervariable minisatellites in the protenninal regions of human autosomes.
Genomics 3: 352-360.
Sanders, M.B. (1993). Stress proteins in aquatic organisms: an environmental
perspective. Critical Reviews in Toxicology 23(1): 49-75.
Sander, G., Jones K.C. and Hamilton-Taylor J. (1993). Concentrations and deposition
fluxes of polynuclear aromatic hydrocarbons and heavy metals in the dated
sediments of a rural English lake. Environ. Toxico. and Chem. 12: 1567-1581.
44

Schlesinger, M.J. (1986). Heat shock proteins: the search for functions. J. Cell Biol.
103: 321.
Schlotterer, C., Vogl C. and Tautz D. (1997). Polymorphism and locus-specific effects
on polymorphism at microsatellite loci in natural Drosophila melanogaster
populations. Genetics. 146: 309 -320.
Stephan, W. and Cho S. (1993). Possible role of natural selection in the formation of
tandem-repetitive noncoding DNA. Genetics 136: 333-341.
Su, X.Z. and Williams T.E. (1996). Towards a high-resolution Plasmodiumfalciparum
linkage map _polymorphic markers from hundreds of simple sequence repeats.
Genomics. 33: 431 -444.
Taylor, E.J., Maund S.J. and Pascoe D. (1991). Toxicity of four common
pollutants to the freshwater macroinvertebrates Chironomous riparius
Meigen (Insecta: Diptera) and Gammarus pulex (L.) Arch. Environ. Contam.
Toxico/. 21: 371-376.
Thomas, G.P. and Mathews M.B. (1984). Mo/. Cell. Biol. 1063-1072.
United States Environmental Protection Agnecy Prevention. (1996). Chironomids
Sediment Toxicity Test. Ecological Effects Test Guidelines, OPPTS 850.1790.
Pesticides and Toxic Substances (7101). EPA. 712-C.96-313.
Y amamura, M., Suzuki T.K., Shigehisa H. and Kentaro K. (1983). Tolerance to
cadmium and cadmium-binding proteins induced in midge larvae.
Chironomus Yoshimatsni (Diptera, Chironomidae). Comp. Biochem. Physio/.
75C (1): 21-24.
45
