sub - actcoss · web viewthe report also notes that the high cost of driving lessons is raised as a...
TRANSCRIPT

Transport: A ‘wicked problem’ we have the strengths and assets to solve
September 2016

About ACTCOSSACTCOSS acknowledges Canberra has been built on the land of the Ngunnawal people. We pay respects to their Elders and recognise the strength and resilience of Aboriginal and Torres Strait Islander peoples. We celebrate Aboriginal and Torres Strait Islander cultures and ongoing contribution to the ACT community.
The ACT Council of Social Service Inc. (ACTCOSS) is the peak representative body for not-for-profit community organisations, people living with disadvantage and low-income citizens of the Territory.
ACTCOSS is a member of the nationwide COSS network, made up of each of the state and territory Councils and the national body, the Australian Council of Social Service (ACOSS).
ACTCOSS’ vision is to live in a fair and equitable community that respects and values diversity, human rights and sustainability and promotes justice, equity, reconciliation and social inclusion.
The membership of the Council includes the majority of community based service providers in the social welfare area, a range of community associations and networks, self-help and consumer groups and interested individuals.
ACTCOSS receives funding from the ACT Government.
ACTCOSS advises that this document may be publicly distributed, including by placing a copy on our website.
Contact DetailsPhone: 02 6202 7200Fax: 02 6288 0070Address: Weston Community Hub, 1/6 Gritten St, Weston ACT 2611Email: [email protected] Web: www.actcoss.org.au
Director: Susan HelyarDeputy Director: Wendy ProwsePolicy Officer: Dr Angie Bletsas
September 2016
ISBN 978-1-876632-30-4 (electronic version)© Copyright ACT Council of Social Service Incorporated
This publication is copyright, apart from use by those agencies for which it has been produced. Non-profit associations and groups have permission to reproduce parts of this publication as long as the original meaning is retained and proper credit is given to the ACT Council of Social Service Inc. (ACTCOSS). All other individuals and Agencies seeking to reproduce material from this publication should obtain the permission of the Director of ACTCOSS.
2
Table of contentsAcronyms...........................................................................................................4
Introduction.......................................................................................................5
Recommendations............................................................................................6
Transport disadvantage....................................................................................7Unmet transport need in the ACT...............................................................9
Aboriginal and/or Torres Strait Islander peoples................................9Accessible transport for people with a disability...............................10Marginalised families........................................................................11Young people...................................................................................12Transport and food insecurity...........................................................12Transport and access to health services..........................................13Cross-border issues: failing to connect people and services............14
Transport failures – people share personal stories...................................15
Transport costs in the ACT............................................................................16
The policy context...........................................................................................19Policy challenges, trade-offs and people left behind.................................21Community Transport...............................................................................25Policy solutions: Engaging communities, improving mainstream services and creating new and tailored initiatives...................................................26
Reference list...................................................................................................28
Appendix 1.......................................................................................................32
Appendix 2.......................................................................................................33
3

AcronymsABS Australian Bureau of Statistics
ACT Australian Capital Territory
ACTCOSS ACT Council of Social Service Inc.
ATODA Alcohol, Tobacco and Other Drug Alliance
CFCA Child, Family and Community Australia
HCCA Health Care Consumers’ Association of the ACT
NILS No interest loan scheme
OTS Opioid treatment services
SEIFI Socio-economic index for individuals
WCHM Women’s Centre for Health Matters
WHO World Health Organisation
WWDACT Women with Disability ACT
4

IntroductionIn this position paper we explore the policy issues related to addressing transport disadvantage in our city. We note that, as used broadly in existing literature, the term ‘transport disadvantage’ is separate to social disadvantage and that it can affect both socially disadvantaged and socially advantaged people. Who is affected by transport disadvantage largely depends on the direction of infrastructure investment. We provide evidence that the policy directions of the ACT Government prioritise addressing the transport issues experienced by socially advantaged Canberrans – issues related to congestion and availability in times of peak demand. We find that the transport needs of socially disadvantaged Canberrans are not being comprehensively addressed within current policy settings.
The paper outlines the policy imperatives, challenges and opportunities currently available to significantly reduce transport disadvantage for people who experience social disadvantage in the ACT. We argue that residents have a vital role to play in developing the solutions to Canberra’s transport challenge and that the ACT has social and economic assets and administrative arrangements that provide a firm foundation for implementing these solutions. We advocate a strengths-based, community-led approach to understanding needs and determining transport service and infrastructure design, investment and future planning.
Fundamentally, transport is a social determinant of health. In this paper we have incorporated evidence, anecdotes from literature, and personal stories to illustrate the range of ways that transport impacts on health and wellbeing, and why it is so important to address transport disadvantage in our community.
5

Recommendations Update the transport disadvantage map, utilising existing SEIFI data.
Upgrade the entire bus fleet to meet accessibility standards.
Develop a vision and implementation plan for transport that is firmly grounded in an understanding of transport as a social determinant of health.
Undertake a comprehensive needs assessment of transport disadvantage in the ACT. This study should explore the needs, preferences and practices of Canberrans with a special emphasis on population groups who are acknowledged as likely to experience transport disadvantage.
All passenger surveys should include questions which look at improving the experience of passengers who travel within and outside of peak hours.
Provide funding to remedy the layouts of bus interchanges and location of taxi ranks to make them accessible for people with disabilities.
Introduce license concessions for learner, probationary and restricted licenses.
Align the discount on license fees for Health Care Card holders (currently 50% of costs) with Pension Card Holders (100%).
Undertake a study of transport costs in order to examine how individuals on low and fixed incomes meet costs of vehicle operation and maintenance and if and to what extent this involves reliance on sub-prime loans. Address any findings on the broader relationship between transport costs and indebtedness for people on low and moderate incomes.
Collect data to monitor whether and how people with disability benefit from the introduction of ride sharing services in the ACT, e.g. track impacts on number and quality of services and impact of ride sharing on ride costs for accessible vehicles.
Assess investment in transport against the impact of transport infrastructure spending on increasing the affordability and accessibility of transport for people who are transport disadvantaged to access work, health and education facilities, food and other shopping amenities, and social networks.
Improve and increase access to public transport in neighbourhoods and regional centres, with a focus on increasing affordable and accessible transport for east-west travel.
Further expand the already committed investment to improve accessibility of bus stops, lighting and pedestrian infrastructure.
Expand eligibility for and promotion of Flexi-bus to all residents in the areas covered who are transport disadvantaged.
Address the gaps in cross-border public transport services, specifically for Queanbeyan and Oaks Estate through improved integration of existing service providers and by increasing services where they are lacking.
6

Fund community transport at sustainable levels and in a manner that will ensure that community transport continues to be available to all in our community who are in need of it. That means ensuring a community transport system that is not only available to people eligible for an individualised funding package through Commonwealth initiatives like the NDIS or an aged care package.
7
Transport disadvantage Transport disadvantage can be experienced by anyone because capacity to travel is not dependent on personal attributes but on the accessibility of physical and social infrastructure such as roads and public transport services. Because it is governments who make the largest infrastructure investments it is government policy decisions that ultimately impact on whether or not transport disadvantage exists, to what degree it exists, and which groups in the community are most likely to experience it.
In a paper on transport disadvantage in Australia, researchers from Child Family Community Australia (CFCA) note:
Both socially advantaged and socially disadvantaged people can experience transport disadvantage, however the nature of this disadvantage differs. For socially disadvantaged groups transport difficulties tend to relate to the ability to access transport and the costs of travel whereas for socially advantaged groups transport difficulties tend to relate to traffic congestion and time availability. (Rosier and McDonald 2011)
Reviewing the literature we find that people on low and fixed incomes, particularly if they have young children; people with disability, particularly if they rely on taxis; and people in remote parts of the city are most likely to experience transport disadvantage. Young people and older people who rely exclusively on public transport are also more likely to experience transport disadvantage as are Aboriginal and/or Torres Strait Islander peoples.
A 2006 Australian Bureau of Statistics (ABS) analysis of transport found that Australians in the bottom income quintiles experience transport difficulties far more frequently than those in the top quintile: ‘9.9% and 1.3% respectively’ (as cited in Rosier and McDonald 2011). Additionally, in a 2013 report, the ABS state that:
In 2010, nearly half (48%) of adults without access to a passenger vehicle felt they sometimes or often had difficulty getting to places. However, for people who had access to a passenger vehicle, 1 in 10 adults (10%) felt that they sometimes or often had difficulty getting to places. (ABS 2013)
This data shows a correlation between income and transport dis/advantage particularly where income enables or impedes ownership of or access to a passenger vehicle.
Research also highlights that particular population groups are more likely to experience transport disadvantage, including: ‘families with young children, people with a disability and Indigenous Australians’ (Rosier and McDonald 2011). Importantly, this should not be interpreted to mean that these groups experience transport disadvantage because of innate personal characteristics. It is not the capacities and characteristics of these population groups that make them more likely to experience transport disadvantage. It is the design of services that fails to make them accessible – for example, streets and/or buses that are not accessible for people with mobility aids or to parents with young children in prams.
8

The ACT Government has acknowledged the importance of infrastructure design for community access with the trial of the ‘age friendly neighbourhoods’ initiative in Ainslie and in Weston Creek announced in 2015 (Gentleman 2015). This initiative is very welcome. However, more is needed to address the impact of infrastructure on access to and quality of transport across the ACT.
Research demonstrates that geographic location also has an impact on transport disadvantage. CFCA highlight that:
In addition to being more prevalent amongst some groups, transport disadvantage is also more prevalent in some geographical locations. For example, households in outer-urban areas of Australia typically have less frequent, less available (e.g., nights and weekends) and less accessible (i.e., stops and stations are not in a convenient location) public transport than urban areas. Because of their location, residents living in these areas are often required to travel longer distances to work or access services than residents in inner and middle suburbs. These areas are described as transport disadvantaged areas. (Rosier and McDonald 2011)
In 2012 the ACT Government commissioned a study into transport disadvantage. The study, Coverage Service Feasibility Study (MRCagney 2012) developed a methodology for assessing transport disadvantage that mapped areas where transport was inaccessible and analysed this in conjunction with data on socio-economic disadvantage. The report is useful in highlighting that there are discrepancies in the level and frequency of public transport delivered in Canberra creating areas of geographic transport disadvantage. Unfortunately, despite a commitment to update the map with more recent census data (Environment and Sustainable Development Directorate 2012, p. 30), this work, to the best of our knowledge, has not been updated since 2012. However, a separate 2015 study by academics Nathan Pittman and Jennifer Eve Day finds a similar trend, that outer areas have higher incidence of transport disadvantage.
Reviewing the literature below we conclude that while transport disadvantage can affect everyone, it more frequently affects people experiencing social disadvantage.
Recommendations
Update the transport disadvantage map, utilising existing socio-economic index for individuals (SEIFI) data.
9

Unmet transport need in the ACTExisting literature allows some insight into which population groups in our community are not well served by our existing transport systems. Below we have compiled illustrative data drawn from a broad range of local ACT studies that highlight the impact of transport disadvantage in people’s lives.
This material is not comprehensive, as the reports from which it is drawn are not all explicitly on the issue of transport disadvantage. However, the data is illustrative of how not having adequate access to transport disadvantages people in a range of ways. ACTCOSS recommends that a more systematic analysis of unmet transport need and its consequences be undertaken by the ACT Government and that this analysis focus on broader and more inclusive transport needs then those experienced by 9-5 commuters.
Aboriginal and/or Torres Strait Islander peoples
Passing the Message Stick is a 2014 publication by the ACT Human Rights Commission that explores the experiences of Aboriginal and/or Torres Strait Islander people engaging with services in the ACT. The report highlights that access to transport is a concern in the community:
A lack of transport options was consistently reported by participants, with participants reporting that public transport does not provide timely, affordable options for Aboriginal and Torres Strait Islander people within the ACT, particularly those who have a number of small children and young people, or who have complex needs such as mental health issues, general health issues, or a disability. (ACT Human Rights Commission 2014, p. 27)
The report also notes that the high cost of driving lessons is raised as a cost barrier to driving by families participating in the research (ACT Human Rights Commission 2014, pp. 27-28; see Appendix 1, this document, for estimate of license costs for new drivers). The institutional setting in which the Road Ready course is offered is also identified as a barrier in the report (ACT Human Rights Commission 2014, p. 27). Gugan Gulwan Youth Corporation has in the past offered the Road Ready course but, despite the success of the course, due to limited resources is ‘not able to offer this program on a regular basis’ (ACT Human Rights Commission 2014, p. 28). Consequently, there is currently a gap in addressing this need.
The Human Rights Commission report further notes that:
Services reported that when they offer transport for participants they generally have a significantly larger number of attendees then when they are unable to offer transport. One service advised that they run a small group program and that when they are unable to offer transport they see a decrease in attendees by up to 50%. Another service reported that they could not offer transport on one occasion for their weekly group as the bus they use was not available. This led to the group being cancelled that week
10

as there was no other transport available for participants. (ACT Human Rights Commission 2014, p. 27)
Winnunga Nimmityjah Aboriginal Health Service, as the report also notes, offers transport services including a free community bus service. However, the bus service is only available to transport people to and from medical appointments.
Accessible transport for people with a disability
Transport is a barrier to community life for people living with disability (for example ABS 2009; Gough 2015, p.12; Carnovale 2012). A 2009 data report by the Australian Bureau of Statistics finds that the large majority of people with disability (82%) live in proximity to public transport (ABS 2009). The ABS report also finds that people with disability do not have high rates of public transport use: ‘Out of the 2.0 million people with a specific limitation or restriction who do not use public transport, over 1.5 million did have it available in their local area’ (ABS 2009).
The report also finds that:
Of the estimated 3.8 million people aged 5 years or more with reported disabilities, 1.2 million had difficulty using public transport, 2.6 million had no difficulty using public transport and 37,000 did not leave home (Graph 50). Those with greater restrictions or limitations were more likely to report having difficulty using public transport, except those with schooling or employment restrictions. People with schooling or employment restrictions only are those who need extra support in their schooling or occupation because of their disability but who do not fall into any of the other categories of disability status. (ABS 2009)
It should not be interpreted from this that it is necessarily functional impairment that restricts people with disability from using public transport. Rather, accessibility for people with disability is largely an issue of design of public transport infrastructure:
People with profound core activity limitations reported the most common difficulties they had using public transport were getting to stops or stations (38%) and getting in or out of vehicles or carriages due to steps (48%). In contrast, the main difficulties people with mild core activity limitations reported were due to difficulty getting into or out of vehicles because of steps (23%) and fear and anxiety (14%). (ABS 2009)
11

Accessibility for people with disability is a right recognised in Article 9 of the United Nations Convention on the Rights of People with Disability. Like all other jurisdictions in Australia, the ACT also has obligations under the Disability Standards for Accessible Public Transport Act (Cwth) 2002, and Commonwealth, as well as local, Discrimination Acts to ensure that it meets accessibility standards.
The reason that all of these legislative instruments enshrine standards of accessibility for transport is that access to transport is fundamental to living an independent and socially integrated life. A recent report by Women with Disability ACT includes comments from participants that underscore the significance of transport to everyday life. Participants in the research project were asked what they felt would improve their social connections and transport emerged as one of several key themes:
“Good, reliable public transport would be the most helpful thing for me.”
“Transport is the key to connectedness, but for those who are unable to use buses, things become increasingly difficult.”
“Provision of a Usable wheelchair & a practical lift to get it in the car, so I can go out without so much difficulty & also visit my family interstate sometimes.” (Carnovale 2012, p. 26)
For people with disability, transport is also a barrier because of its high cost, a point that the ACTCOSS 2016 Cost of Living Report (Pilbrow 2016), discussed below in the paper, clearly demonstrates.
Marginalised families
In 2013 an evaluation was undertaken of the ‘Improving Services with Families’ initiative (now known as the ‘Strengthening Families’ program). The initiative involved ‘participants […] drawn from marginalized [sic] groups that have
1 Graph reproduced exactly from Australian Bureau of Statistics 2009, 4446.0 - Disability, Australia, 2009, Australian Bureau of Statistics, Canberra, accessed 17 June 16, 2016, <http://www.abs.gov.au/ausstats/[email protected]/Lookup/4446.0main+features122009>.
12

experienced consistent difficulties in navigating and accessing the service system’ (Evans 2013, p. 2). The evaluation of this initiative noted that 13% of participants involved experienced transport problems (Evans 2013, p. 2).
Young people
Public transport is fundamental in meeting the transport needs of young people. Yet the needs of young people do not seem to be addressed in mainstream transport planning. In the 2012 Youth Coalition Rate Canberra survey: ‘60% of survey respondents aged 12 – 25 identified that the bus was one of their most common forms of transport’ (Youth Coalition of the ACT 2013, p.1). The 2012 Rate Canberra survey also identified that lack of transport is one of the ‘key barriers to participation in activities’ (Youth Coalition of the ACT 2013, p.1). The Youth Coalition have repeatedly investigated this issue and their findings are consistent:
In a 2007 Youth Coalition submission that surveyed over 200 young people in the ACT on public transport, the frequency of services was highlighted as the most important issue. Also, in a 2012 consultation, young people identified that there is a need for additional evening, late night and weekend services. This is particularly important for young people who are more likely than the general population to be engaged in part-time employment or recreational activities during the evenings and weekends, or those who live in Canberra’s outer suburbs. (Youth Coalition of the ACT 2013, p.1)
Transport and food insecurity
Access to transport has been found to impact on access to affordable, healthy food in the ACT. A detailed analysis of the data and research related to food insecurity in the ACT was published by Anglicare ACT and the Australian Red Cross in 2013. The report stated that:
Transport accessibility is a crucial part of food security, particularly in a car - oriented city like Canberra. Two thirds of respondents to our client survey listed bus, foot or bike as the form of transport they used. A current proposition by ACTION to increase the average walking distance to access a bus[2] could have unintended consequences negatively affecting people who depend on public transport to do grocery shopping, as well as older people or those with disabilities. (Anglicare ACT & Red Cross 2013, p. 28)
Transport and access to health services
Transport has been acknowledged as an issue impacting on access to health services. In their 2014 Comprehensive Needs Assessment, which documents health needs in the ACT, Capital Health Network3 state:
2 This proposal was considered as part of the ‘straightening’ of routes on which the government consulted in 2013.
3 Now known as the Capital Health Network, the report was published when the organisation was known as the ACT Medicare Local.
13
Difficulty accessing transport is a significant barrier for accessing primary health care and specialist services. Access to safe and timely transport is a social determinant of health and is a significant need particularly for older people, mental health consumers and the homeless. Limited availability of cross border transport is a particular issue for Aboriginal and Torres Strait Islander people who access services in the ACT and live in surrounding NSW. (ACT Medicare Local 2014)
Transport needs and the challenge of meeting transport costs are also raised in research and analysis by the Health Care Consumers’ Association of the ACT (HCCA). The HCCA submission to the 2014 Commonwealth Senate Inquiry into Out-of-Pocket Costs in Australian Healthcare (Kerdo 2014), for example, identifies transport costs to specialist appointments as a major cost issue for health care consumers. The following anecdote illustrates transport challenges faced by people with chronic healthcare needs:
I see one specialist weekly and when I cannot drive, Cab Charge [taxi subsidy scheme] pays 50% of my fee, leaving me out of pocket $40 per visit. My husband takes carer’s leave from work every few months so we can drive from Canberra to Sydney to see my Neurologist. There is no rebate for travelling costs and the resultant overnight stay in Sydney. (Kerdo 2014, p. 14)
In their 2011 submission to the ACT Government on expanding opioid maintenance treatment and needle and syringe programs the Alcohol, Tobacco and Other Drug Alliance (ATODA) offer the following example of the challenges that public transport in a geographically dispersed territory can raise:
Case study: Sarah
A single mother in her 20s, has two children under five and is accessing drug treatment as part of tier one OTS [Opioid Treatment Services]. She did not complete year 10, she has never been employed, she was a child in care, has experienced repeated homelessness, is a Centrelink recipient and does not have family and social supports in Canberra. The only health and community service she accesses is through the OTS program. She is in poor health, particularly for her age, began using heroin in her teens and after 10 years began treatment as part of the OTS program. She, and her two children, is required to attend The Canberra Hospital daily via public transport for her to receive her medication. They reside in Gungahlin in public housing, their house is a bus ride from the Gungahlin towncentre. On the weekend, her small family will spend 5 hours a day travelling to and from Woden to access the mother’s treatment. The demands on her family to access treatment mean that she is not able to engage in education and training and therefore her chances of reaching economic and social independence are limited. Currently, Sarah would have to choose between accessing drug treatment and engaging in employment / education / training – and this is incongruous with the evidence. Sarah’s chances of relapsing into heroin use, and potential overdose, are greatly increased if she ceases OTS. (ATODA 2011, p. 6)
As well as demonstrating the difficulties experienced around access to medical appointments, this example illuminates the broader ways in which transport is a social determinant of health. The stressful and time consuming journey that this family must regularly undertake impacts on their time and, consequently, the
14

time that they have available for developmentally appropriate activities for the children and on the time that the mother, Sarah, has to invest in education, employment and training – all of which are protective factors that correlate to better long term health outcomes.
Cross-border issues: failing to connect people and services
Because public transport is a state/territory government responsibility, transport systems are designed to operate within jurisdictional borders despite the fact that for many ACT residents and commuters these jurisdictional borders are arbitrary. Pittman and Day, for example, report that:
approximately 11,500 workers commute from [Queanbeyan] to any employment location within the ACT; and conversely some 37.4% of jobs in Queanbeyan are filled by residents of the ACT. (Pittman & Day 2015, p.327)
Despite the significant demand for cross-border services established by this data, Pittman and Day (2015) find that there is no integration of cross-border services travelling from ACT into Queanbeyan and that, moreover, the Queanbeyan region is significantly lacking in public transport provision.
Oaks Estate, which is within the ACT border, presents another area that must be considered significantly transport disadvantaged. Oaks Estate has a relatively high number of residents whose incomes put them in the bottom income quintiles – as indicated by the relatively high number of public housing properties in the area. At the same time Oaks Estate reportedly has some of the worst public transport access in terms of frequency of bus service in Canberra.4 We acknowledge and welcome the new QCity Transport services to Oaks Estate that were announced in August 2016. These additional services will benefit the local community. However, we would still like to see services that connect Oaks Estate directly with Canberra city and with the Woden interchange as this would create important through-ways to services.
Transport failures – people share personal storiesThe following anecdotes, taken from the real life experiences of public transport users who are also community service clients, illustrate the impact of the failures of the current transport system. The people who have shared these anecdotes have given their permission for us to reproduce them here.
A client on Disability Support Pension with numerous financial issues was provided with St Johns details for a food hamper which she received. She was standing up on the bus going home and accidently fell back into another person. She was then asked to leave the bus. She had no money and so couldn’t get a taxi or another bus, and so she had to leave the food as it was too heavy for her to carry home. She ended up walking several kilometres home and had no food until next pension day.
4 With thanks to ACU students Margo Bulic, Johann Deraadt, Patricia Finkel, Jonathan Grady and Rebekah Spann for their research into this issue.
15

***
A person who vomited on a bus was asked to leave the bus, and had no way of getting home. She had to wait two hours by the side of the road for a friend to finish work and come and pick her up. She is in receipt of a Centrelink allowance and didn’t have enough money to catch a taxi. She later found out she was pregnant and this was probably the cause of the vomiting as she wasn’t sick with a cold or flu and did not remember eating anything that might have given her an upset stomach.
***
Some bus drivers don’t automatically open the back doors at stops and some people don’t speak up or aren’t loud enough to let the driver know and they miss their stop. The bus is usually crammed full so it is near impossible for the person to get to the front of the bus. A client who was in this situation started to have a panic attack and got off at the next stop she could – this was on a suburban route. The next bus broke down and did not arrive and she had no money for a taxi and her phone was out of credit to ring her mum to pick her up, so she had to wait for over an hour and twenty minutes in hot sun.
These anecdotes highlight the kinds of everyday experience that is not currently being recorded or captured in any systematic way. Yet the information contained in these anecdotes is vital to improving existing mainstream services. It is therefore imperative that the government undertake a detailed analysis of unmet transport need in the ACT.
Recommendations
Develop a vision and implementation plan for transport that is firmly grounded in an understanding of transport as a social determinant of health.
Undertake a comprehensive needs assessment of transport disadvantage in the ACT. This study should explore the needs, preferences and practices of Canberrans with a special emphasis on population groups who are acknowledged as likely to experience transport disadvantage.
All passenger surveys should include questions which look at improving the experience of passengers who travel outside of peak hours.
Provide funding to remedy the layouts of bus interchanges and location of taxi ranks to make them accessible for people with disabilities.
Address the gaps in cross-border public transport services, specifically for Queanbeyan and Oaks Estate through improved integration of existing service providers and by increasing services where they are lacking.
16

Transport costs in the ACTTransport disadvantage is very much impacted by transport costs and, in turn, transport costs can have a very significant impact on household spending decisions. ACTCOSS recently published a Cost of Living Report on transport costs in Canberra (Pilbrow 2016). The findings reported below are reproduced from that document.5
Based on the most recent Household Expenditure Survey (HES) data (ABS 2011, Table 23A), Canberra has the second highest expenditure on transport amongst capital cities in the country. Darwin, the city with the highest transport expenditure was $233.78, with Canberra only marginally behind on $232.23. In terms of the proportion of household income expended on transport, Canberra sits at third highest (spending 15.1 percent of weekly expenditure), behind Darwin and Melbourne. Only housing (19.6 percent) and food (15.4 percent) constitute greater expenditure areas for Canberra households (ABS 2011, Table 23A). In fact, Canberra households spend almost as much on transport ($232) as they do on food ($235) (ABS 2011, Table 23A). Apart from Darwin (and the NT as a whole), where expenditure on transport in fact does exceed expenditure on food, all other capital cities spend between $15 and $40 more per week on food than on transport (ABS 2011, Tables 231, 27A).6
While households in the ACT spend significantly more ($40) per week than the national expenditure on transport, ACT households also have the second highest average income levels in the country ($2537 per week) when compared with greater capital city areas across the country, behind only greater Perth ($2686) (ABS 2015, Table 18). Despite their high average income, Canberra households still have the third highest expenditure on transport in terms of the proportion of the weekly household budget when compared with all capital cities (ABS 2011, Table 23A), which indicates that transport costs are high.
It is also important to bear in mind that the expenditure figures above are averages and do not reflect the reality of transport costs for all households in the ACT, particularly low-income households. Many low-income households – for example, households with people on disability and carer payments – would pay above 15.1 percent of their weekly income in transport costs and face very real pressures because of this.
In addition, the income figures do not reflect the reality for all households in the ACT, as not all ACT households earn anywhere near $2537 per week. A household with one full-time worker earning the minimum wage and one part-time (0.5) worker earning the minimum wage would be earning $1403.37 per week – nearly $1134 under the ACT average household income for 2013–14 (Fair Work Commission 2016; Centrelink 2015, pp. 2, 5). A sole-parent household, with two children, relying on Newstart would be receiving $627.14
5 For a full discussion of transport costs in the ACT please see the ACTCOSS 2016 Cost of Living Report (Pilbrow 2016).
6 In terms of states/territories, as compared to capital cities, the gap between the expenditure on food and transport is much narrower – in the NT transport expenditure is greater than food expenditure; and in Queensland food expenditure is only $1 more than transport expenditure. The narrower gap in states and territories partly reflects the increased costs of transport in states/territories with larger remote populations (ABS 2011, Table 27A).
17

per week (Centrelink 2015, pp. 2, 5, 25). Yet these households have to pay the same fuel prices, vehicle registration costs and taxi fares as the highest income earners.
With a single age pensioner receiving around $498 per week, a single unemployed person receiving around $330 per week and a young person receiving $260 per week, transport costs are going to be felt more keenly and, in particular, any rises in transport costs for these households will put immediate pressure on weekly budgets. Even a single person working full-time and earning the minimum wage ($656 per week) is earning around $1700 per week under the ACT average (Centrelink 2015, pp. 2, 5, 13, 25). All of these households have to pay the same bus fare and taxi fare rates (unless they are eligible for a concession or subsidy) or cost of petrol at the bowser (for which there are no concessions).
The transport needs of people living with disability are a particular focus of our 2016 Cost of Living Report. Accessible transport options are a key cost of living factor for people with disability that impacts on access to work, health care, services, social, community and other events and opportunities (see for example Gough 2015, p.12). People living with disability who do not drive currently face limited choices when it comes to accessible travel options in the ACT. In particular, people living with disability have a heightened reliance on transport options such as taxis and therefore have a heightened need for an affordable, accessible, high-quality and safe taxi system.
In relation to taxi costs, for peak rates, Canberra, as at April 2016, has: the highest flag fall rate; the third highest distance per kilometre rate; the third highest waiting time per hour rate and equal third highest airport rank fee (Taxi Fare Calculator 2016). While not as high, the general off-peak rates for Canberra are still some of the highest in the country (ranking second to fourth in the corresponding categories above).
The impact Uber may or may not have on these costs is not yet clear. In our work on the Taxi Industry Innovation reforms we identify the need to examine whether these reforms will result in improved services and costs for people with disability who currently rely heavily on taxi based transport (ACTCOSS 2015a; ACTCOSS 2015b). In order to do so it is necessary to capture systematic data on changes to the market.
Transport costs are considerable in the ACT. And as the anecdotes above demonstrate when people are unable to meet these costs it can result in hardship including going without food. In our submission to the Concessions Review (ACTCOSS 2016) we argue that concessions need to be reviewed to keep up with cost of living pressures for people on low-income Health Care Cards and also expanded to include concessions for learner, probationary and restricted licenses. We reiterate these recommendations as vital to addressing transport disadvantage in the ACT.
We also request that the government fund a scoping project exploring the issue of transport-related costs and whether and to what extent meeting such costs involves the accrual of personal debt for individuals living on low incomes. We know, anecdotally, that individuals on low incomes frequently inquire into
18

whether the no interest loan scheme (NILS) can be accessed to cover registration and other vehicle operation costs. We also know that the NILS is not available for this purpose. What is not known is what alternative financial products people are turning to in the absence of a NILS product to cover these essential transport costs. It is reasonable to conclude that people may be turning to pay day lenders and other sub-prime loan arrangements and that transport costs contribute to cycles of indebtedness for people living on low incomes in the ACT. A scoping study would determine whether and to what extent this is an issue in our community.
Recommendations
Introduce license concessions for learner, probationary and restricted licenses. Align the discount on license fees for Health Care Card holders (currently 50% of costs) with Pension Card Holders (100%).
Collect data to monitor whether and how people with disability benefit from the introduction of ride sharing services in the ACT, e.g. track impacts on number and quality of services and impact of ride sharing on ride costs for accessible vehicles.
Undertake a study of transport costs in order to examine how individuals on low and fixed incomes meet costs of vehicle operation and maintenance and if and to what extent this involves reliance on sub-prime loans. Address any findings on the broader relationship between transport costs and indebtedness for people on low and moderate incomes.
The policy contextThe ACT Government’s policy vision for transport includes a range of objectives – improving the health of Canberrans by promoting walking over driving; achieving the ACT Government’s emissions reduction targets through transport mode shift from private car to walking, the bus and light rail; addressing transport disadvantage; and reducing congestion (Environment and Sustainable Development Directorate 2012, pp. 4-5; ACT Government 2015a, p. 2). In practice, major transport infrastructure spending is directed at improving the commuter experience, easing congestion and encouraging commuter mode shift from cars to other, more sustainable, transport options.
The 2015-16 Budget, for example, indicates expenses for light rail totalling $51,777,000 across the forward estimates (ACT Government 2015b, p. 71). The 2015-16 Budget also details investments in walking and cycling infrastructure including the Civic and Braddon public realm improvements totalling $1,500,000 in capital expenses (p. 112), the Acton – Sullivans Creek cycle upgrades totalling $1,500,000 in capital expenses (p. 129), the Barton – Bowen cycle path totalling $600,000 in capital expenses (p. 130), Belconnen Town Centre improved cycling connections totalling $100,000 in associated expenses (p. 130), pedestrian and cycling accessibility improvements at the
19

Kingston Group Centre totalling $150,000 in capital expenses (p. 131), the Molonglo to the City cycle highway totalling $200,000 in capital expenses (p. 131), Oaks Estate river corridor heritage walk improvements totalling $230,000 in capital expenses (p. 131), Tuggeranong town centre improved cycling connections totalling $100,000 of associated costs (p. 132), West Belconnen to the City improved cycling connection totalling $100,000 of associated expenses (p. 133), Woden – Canberra hospital pedestrian and cycle connections totalling $532,000 in capital expenses (p. 133), Woden Town Centre cycle and pedestrian network totalling $250,000 in associated expenses (p. 133).
The 2014-15 Budget included new weekend bus services in new suburbs including Wright, Casey, Harrison and West Macgregor totalling $2,000,000 across the forward estimates (ACT Government 2014, p.109). A one-off expense of $500,000 for improved community transport coordination was also included in the 2014-15 Budget (p.111). Capital expenses in that year’s Budget included $900,000 for the Erindale station upgrade (p.148) and $2,500,000 in capital initiatives for Stage 4 of walking and cycling infrastructure improvements (p.149) – at least some of which is presumably covered in the more detailed pedestrian and cycle initiatives detailed in the 2015-16 Budget and noted above. There was also $112,000 allocated in 2015 for the ‘maintenance and management of the Taxi Subsidy Scheme (TSS) smartcard program’ (ACT Government 2015b, p. 88).
In the 2016-17 Budget additional initiatives to expand bus services to new suburbs in Molonglo were announced (ACTION Network 16) totalling $3,476,000 across the forward estimates (ACT Government 2016, p.79). Additional active travel initiatives were also funded with $380,000 across the forward estimates for ‘Active travel for schools and shopping centres’ (p.79). The 2016-17 Budget also included $47,100,000 to ‘Improved delivery of ACTION services’ (p.79).
In the 2016-17 Budget a further $600,000 was allocated to the Flexible Bus service to allow expansion into the Gungahlin area (ACT Government 2016, p.122). This funding allocation is only for one year, pending a review of the ACT transport system. This is in addition to a 2015-16 Budget measure of a one-off expense of $496,000 for the Community Coordination Centre (ACT Government 2015b, p. 99). The Flexible Bus service does address the transport disadvantage of older people and some people with a disability who use the service. However, people who are socially disadvantaged but do not experience a mobility impairment are not eligible for this service.
These are considerable expense initiatives clearly directed at delivering on multiple transport goals – reducing peak hour congestion; encouraging mode shift to meet the objective of reduced carbon emissions; and the promotion of ‘active travel’ and improvement in physical activity, health and wellbeing.
Nonetheless, when considering recent transport infrastructure expense initiatives, it appears that addressing transport needs for commuters attracts more government investment than the transport needs of people experiencing transport disadvantage. While ACTCOSS does support creative, innovative citizen-led solutions to our transport challenges we do not think that this should mean that mainstream transport services do not have a role in addressing
20

transport disadvantage. It is simply inefficient, as well as unfair, to commit transport infrastructure in a way that creates transport disadvantage then seek creative ways to ameliorate the transport disadvantage that has been created by the design of infrastructure investments. Instead of treating this disadvantage as if it were a ‘special problem’, we need investment in accessible and inclusive transport infrastructure alongside specialist services and innovative transport initiatives that cater specifically to the needs of people currently experiencing transport disadvantage.
The commitment by the government in 2016-17 to allocate $47,100,000 to ‘Improved delivery of ACTION services’ (ACT Government 2016, p.79) presents a prime opportunity to review the way public transport is designed and delivered in the ACT and the extent to which it is integrated with the surrounding region. It is imperative that any ‘efficiencies’ pursued through reform to the public transport system be conceptualised broadly to take into account the costs to wellbeing of failing to provide high quality frequent public transport to all citizens in need of it. Transport is a social determinant of health and when it is not provided adequately, and individuals are not able to absorb the costs involved in private transport, research shows that social and economic outcomes will be negatively affected (Dodson et al 2006; Hine 2009).
Recommendations
Assess investment in transport against the impact of transport infrastructure spending on increasing the affordability and accessibility of transport for people who are transport disadvantaged to access work, health and education facilities, food and other shopping amenities, and social networks.
Improve and increase access to public transport in neighbourhoods and regional centres, with a focus on increasing affordable and accessible transport for east-west travel.
Further expand the already committed investment to improve accessibility of bus stops, lighting and pedestrian infrastructure.
Policy challenges, trade-offs and people left behindThe delivery of public transport involves costs – financial and social. It also often involves trade-offs. ACTCOSS is concerned that trade-offs in the design of public transport in the ACT prioritise people who are socially and economically advantaged to the detriment of people who experience disadvantage.
The ACT Government’s policy document Transport for Canberra notes that ‘frequency can be increased by providing fewer bus routes, but the trade-off is that some people might need to walk a little further’ (Environment and Sustainable Development Directorate 2012, p. 28). Frequency and coverage
21

are treated as requiring a necessary trade-off. A frequent service will involve shorter wait times; and shorter travel times. The trade-off for a frequent service will be less coverage – meaning more people are more likely to live further from a bus stop.
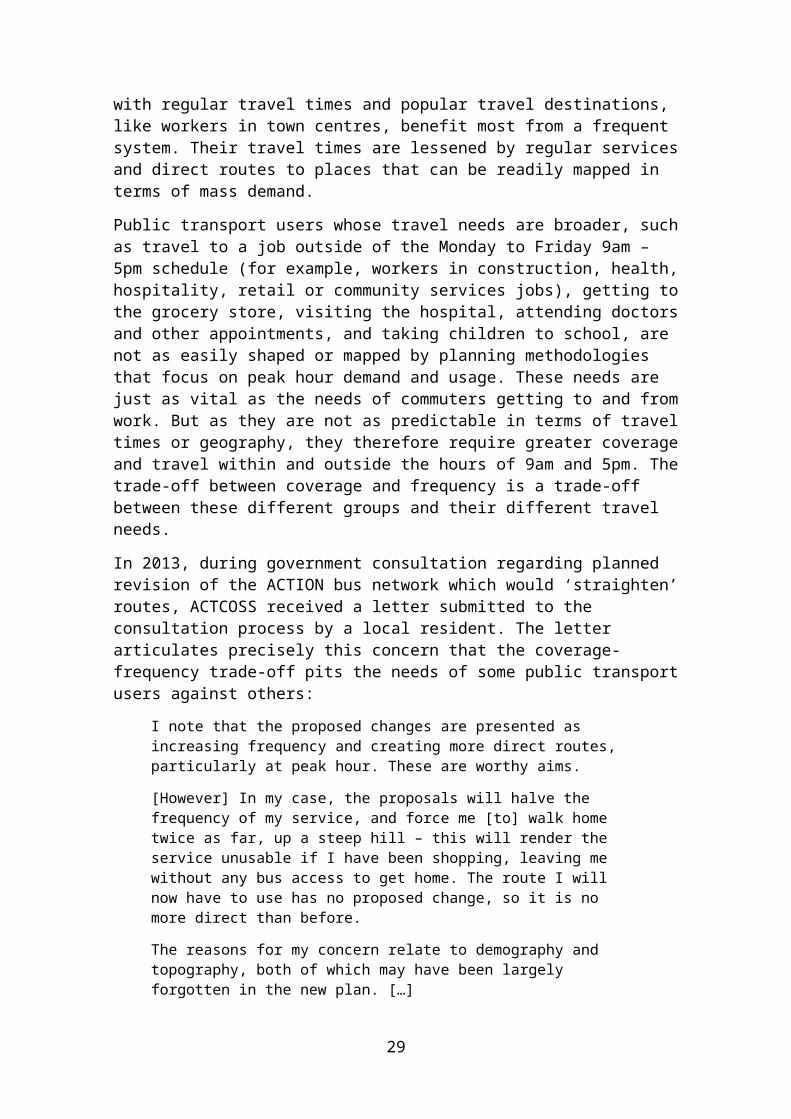
The risk inherent in a trade-off between frequency and coverage is that the transport needs of different transport user groups are played off against each other. Commuters with regular travel times and popular travel destinations, like workers in town centres, benefit most from a frequent system. Their travel times are lessened by regular services and direct routes to places that can be readily mapped in terms of mass demand.
Public transport users whose travel needs are broader, such as travel to a job outside of the Monday to Friday 9am – 5pm schedule (for example, workers in construction, health, hospitality, retail or community services jobs), getting to the grocery store, visiting the hospital, attending doctors and other appointments, and taking children to school, are not as easily shaped or mapped by planning methodologies that focus on peak hour demand and usage. These needs are just as vital as the needs of commuters getting to and from work. But as they are not as predictable in terms of travel times or geography, they therefore require greater coverage and travel within and outside the hours of 9am and 5pm. The trade-off between coverage and frequency is a trade-off between these different groups and their different travel needs.
In 2013, during government consultation regarding planned revision of the ACTION bus network which would ‘straighten’ routes, ACTCOSS received a letter submitted to the consultation process by a local resident. The letter articulates precisely this concern that the coverage-frequency trade-off pits the needs of some public transport users against others:
I note that the proposed changes are presented as increasing frequency and creating more direct routes, particularly at peak hour. These are worthy aims.
[However] In my case, the proposals will halve the frequency of my service, and force me [to] walk home twice as far, up a steep hill – this will render the service unusable if I have been shopping, leaving me without any bus access to get home. The route I will now have to use has no proposed change, so it is no more direct than before.
The reasons for my concern relate to demography and topography, both of which may have been largely forgotten in the new plan. […]
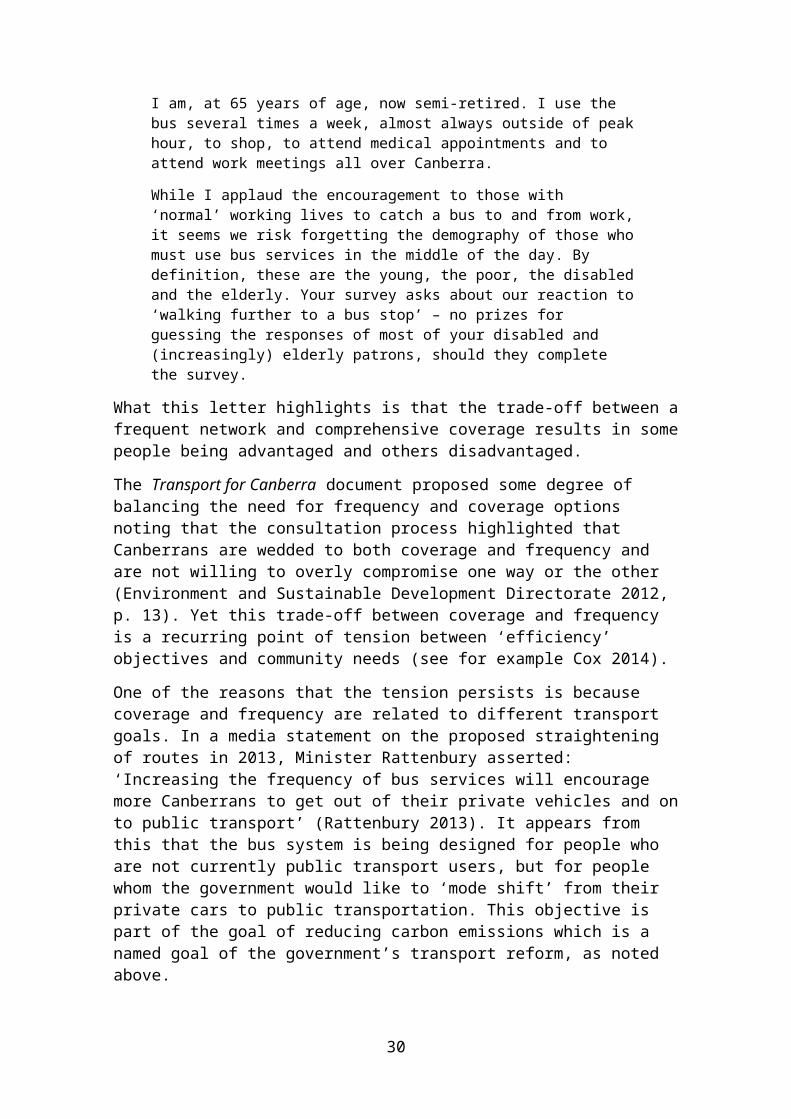
I am, at 65 years of age, now semi-retired. I use the bus several times a week, almost always outside of peak hour, to shop, to attend medical appointments and to attend work meetings all over Canberra.
While I applaud the encouragement to those with ‘normal’ working lives to catch a bus to and from work, it seems we risk forgetting the demography of those who must use bus services in the middle of the day. By definition, these are the young, the poor, the disabled and the elderly. Your survey asks about our reaction to ‘walking further to a bus stop’ – no prizes for guessing the responses of most of your disabled and (increasingly) elderly patrons, should they complete the survey.
22

What this letter highlights is that the trade-off between a frequent network and comprehensive coverage results in some people being advantaged and others disadvantaged.
The Transport for Canberra document proposed some degree of balancing the need for frequency and coverage options noting that the consultation process highlighted that Canberrans are wedded to both coverage and frequency and are not willing to overly compromise one way or the other (Environment and Sustainable Development Directorate 2012, p. 13). Yet this trade-off between coverage and frequency is a recurring point of tension between ‘efficiency’ objectives and community needs (see for example Cox 2014).
One of the reasons that the tension persists is because coverage and frequency are related to different transport goals. In a media statement on the proposed straightening of routes in 2013, Minister Rattenbury asserted: ‘Increasing the frequency of bus services will encourage more Canberrans to get out of their private vehicles and on to public transport’ (Rattenbury 2013). It appears from this that the bus system is being designed for people who are not currently public transport users, but for people whom the government would like to ‘mode shift’ from their private cars to public transportation. This objective is part of the goal of reducing carbon emissions which is a named goal of the government’s transport reform, as noted above.
There would be benefits from such a mode shift beyond the environmental benefits – but the benefits would not be for the existing transport users like the author of the letter cited above. The benefits would be to the health and wellbeing of private car users who would save money on their transport costs and potentially see improvements in their general health through moderate increase in physical activity that a shift from car to bus entails.
By prioritising the transport needs and targeting the preferences of socially advantaged Canberrans, public transport in the ACT does not only fail to remedy health inequities, it potentially exacerbates them. Promoting frequency – without any additional investment in resources for coverage – effectively redirects public services and public funds from those who experience the greatest need for improvements in their access to transport to those who are already advantaged by their access to diverse transport options that maximise their ability to navigate a city designed around private vehicle ownership and use.
This situation is by no means unique to the ACT. In a literature review on public transport in Australia, researchers Christl, Harris and Wise (2009, p. 6) state that:
An analysis of data on public transport and private motor vehicle use from Australian Government sources found that most public transport is provided in central business district areas, and that it benefits higher income earners more than lower income earners. (Christl, Harris and Wise 2009, p. 6)
Part of the reason that public transport benefits higher income earners more than lower income earners is because public transport is frequently offered as the solution to the problem of traffic congestion in cities – the transport
23

disadvantage experienced by socially advantaged groups. As Michael Shapiro has noted:
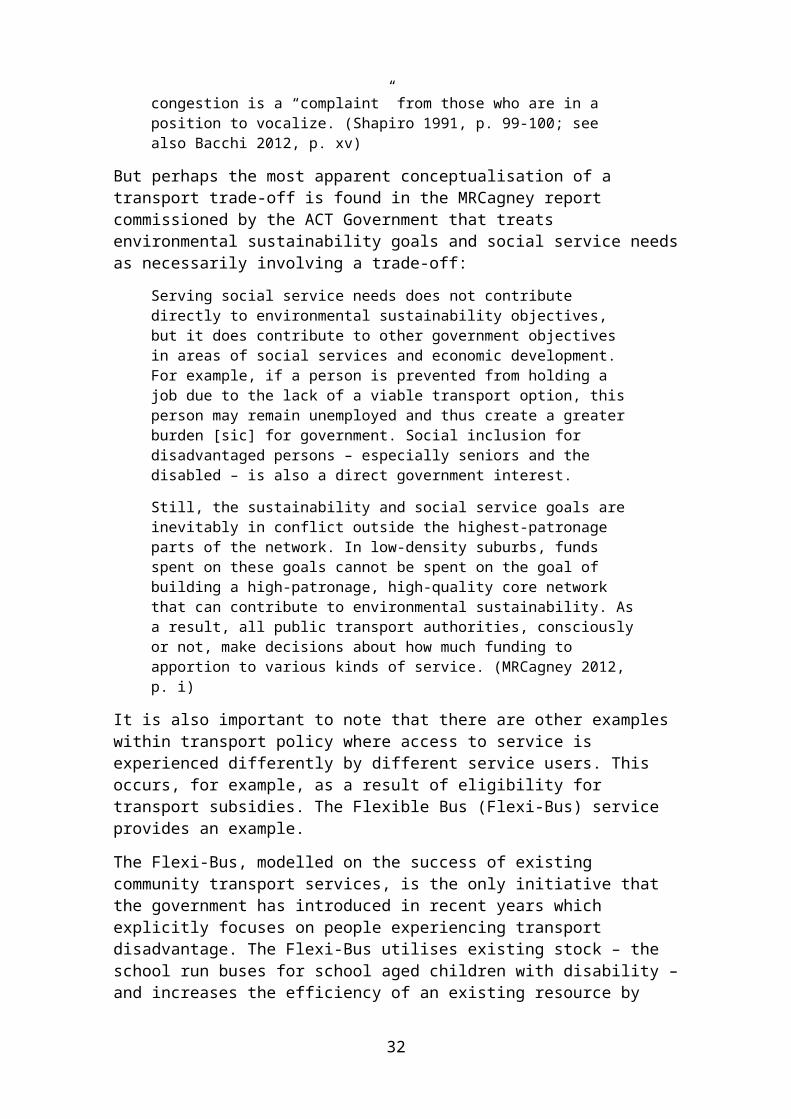
“traffic congestion”, which receives more space than any other “urban problem”, is a middle-class problem, in that it accepts the already-produced segregation, housing, and shaping of the labour force that has arisen from the structures of real estate speculation, work force creation, city planning, and so on. Traffic congestion is a “complaint” from those who are in a position to vocalize. (Shapiro 1991, p. 99-100; see also Bacchi 2012, p. xv)
But perhaps the most apparent conceptualisation of a transport trade-off is found in the MRCagney report commissioned by the ACT Government that treats environmental sustainability goals and social service needs as necessarily involving a trade-off:
Serving social service needs does not contribute directly to environmental sustainability objectives, but it does contribute to other government objectives in areas of social services and economic development. For example, if a person is prevented from holding a job due to the lack of a viable transport option, this person may remain unemployed and thus create a greater burden [sic] for government. Social inclusion for disadvantaged persons – especially seniors and the disabled – is also a direct government interest.
Still, the sustainability and social service goals are inevitably in conflict outside the highest-patronage parts of the network. In low-density suburbs, funds spent on these goals cannot be spent on the goal of building a high-patronage, high-quality core network that can contribute to environmental sustainability. As a result, all public transport authorities, consciously or not, make decisions about how much funding to apportion to various kinds of service. (MRCagney 2012, p. i)
It is also important to note that there are other examples within transport policy where access to service is experienced differently by different service users. This occurs, for example, as a result of eligibility for transport subsidies. The Flexible Bus (Flexi-Bus) service provides an example.
The Flexi-Bus, modelled on the success of existing community transport services, is the only initiative that the government has introduced in recent years which explicitly focuses on people experiencing transport disadvantage. The Flexi-Bus utilises existing stock – the school run buses for school aged children with disability – and increases the efficiency of an existing resource by putting it to use during school hours to enable older Canberrans and Canberrans living with disability to meet their travel needs during 9am and 3pm on weekdays.
The Flexi-Bus service does increase access to transport for people with mobility impairments. What is disappointing about the design of this service is that eligibility is predicated on mobility alone. It is not clear why this should be so. Transport concessions – whether provided as subsidised services, reduced ticket costs or as concessions on vehicle registration – cannot address transport disadvantage if eligibility criteria is limited to mobility. Such restrictions are unfair and exacerbate disadvantage.
24

Researchers from an Adelaide-based study on food deserts highlight this very point in their findings:
Our study found that access to food supplies is made easier for some who have been given support or an allowance because of disability or infirmity. Assistance given to people in these situations is reassuring. More worrying is the lack of assistance for those on low income and who cannot afford independent transport. For these people, getting to the food shops appears to be very difficult, whether or not they are from a food desert. Many have developed pragmatic ways to address these difficulties, such as walking or taking the bus to shops and getting a taxi home. However, these families receive no financial assistance for this travel even though they are financially needy. They are thus doubly disadvantaged by both isolation and by cost of transport for food shopping. (Coveney and O’Dwyer 2009, pp. 54-55)
Local research reinforces the very real costs to individuals and families in our community when they are experiencing financial stress yet are precluded from accessing transport concessions:
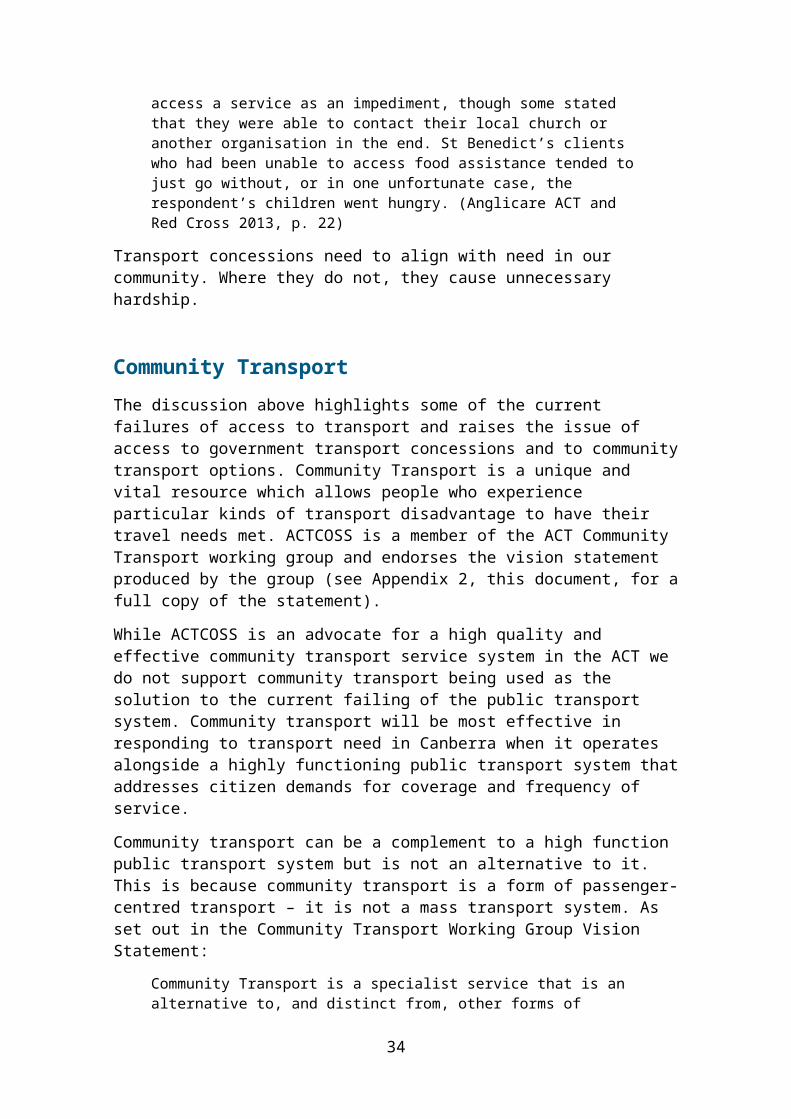
Clients from St John’s Care were most likely to have needed and been unable to access food assistance at some point in the past 3 months. 2 respondents said that they were unable to get help because they didn’t have petrol to drive there. A number of clients of other services mentioned transport or being unable to access a service as an impediment, though some stated that they were able to contact their local church or another organisation in the end. St Benedict’s clients who had been unable to access food assistance tended to just go without, or in one unfortunate case, the respondent’s children went hungry. (Anglicare ACT and Red Cross 2013, p. 22)
Transport concessions need to align with need in our community. Where they do not, they cause unnecessary hardship.
Community TransportThe discussion above highlights some of the current failures of access to transport and raises the issue of access to government transport concessions and to community transport options. Community Transport is a unique and vital resource which allows people who experience particular kinds of transport disadvantage to have their travel needs met. ACTCOSS is a member of the ACT Community Transport working group and endorses the vision statement produced by the group (see Appendix 2, this document, for a full copy of the statement).
While ACTCOSS is an advocate for a high quality and effective community transport service system in the ACT we do not support community transport being used as the solution to the current failing of the public transport system. Community transport will be most effective in responding to transport need in Canberra when it operates alongside a highly functioning public transport system that addresses citizen demands for coverage and frequency of service.
25

Community transport can be a complement to a high function public transport system but is not an alternative to it. This is because community transport is a form of passenger-centred transport – it is not a mass transport system. As set out in the Community Transport Working Group Vision Statement:
Community Transport is a specialist service that is an alternative to, and distinct from, other forms of public, mass, and private transport available in the ACT. Community transport is primarily about relationships and about putting relationships at the centre of meeting people’s transport needs. Community transport providers build relationships with service users. They work to understand service user’s health and social needs in order to facilitate a personalised, effective service. […]
Recognising the importance of transport to people’s wellbeing also means that, though it is targeted, eligibility for community transport should be broadly needs-based. Community transport should not be limited to people who have a mobility impairment, are elderly and/or who have access to an individualised funding package. Community transport should be available to all people who cannot safely or effectively access other forms of transport and this will include people who are living on low incomes and who do not have access to other transport options.
Community transport is able to provide an appropriate level of service to people who have experienced mental ill health and people who have experienced crisis. Community transport is informed by a human rights understanding that all people are entitled to appropriate and accessible transport.
Policy solutions: Engaging communities, improving mainstream services and creating new and tailored initiativesACTCOSS believes that it is important that discussions of transport policy create opportunities in which citizens can be engaged as ‘policy innovators’ and ‘problem solvers’. ACTCOSS advocates a strength-based approach that engages local communities and learns from local initiatives that have already succeeded in reducing transport disadvantage for the people and groups not currently well served by public transport.
There is already evidence that the community wants to be involved in the design and development of public transport in Canberra. The Transport for Canberra: Time to Talk Transport Outcomes Report highlights this fact (Elton Consulting 2011). The report, which summarises all of the community submissions received in response to the government’s Transport for Canberra consultation process states:
Mostly the call is for Government to be ambitious and implement change sooner than the long-term timeframe proposed in the plan; and for improvements to be delivered more urgently and with more focus on access to the vulnerable in the community. There is a perceived need to maintain or increase the current absolute numbers of disabled parking
26

spaces and for a review of parking provision for people with disability to ensure Canberra meets national standards.
The vulnerable [sic] includes people with chronic and mental illness, children, the aging, people of non English speaking background, the homeless and unemployed, some members of the Aboriginal and Torres Strait Islander community who are highly reliant on public transport services and the community bus service.
There is a call for ongoing consultation about transport and setting up a Transport Community Consultation Forum for exchanging information and ideas. (Elton Consulting 2011, pp. 6-7)
To date, the government has not adequately included the community in its planning process, outside traditional forms of consultation, and, to the best of our knowledge, no community forums such as those recommended above have been initiated. A workshop held by the ACT Transport Directorate in April 2016 was a welcome opportunity to engage not-for-profit community services in a conversation about transport need in the community. ACTCOSS appreciates and recognises the moves by the Directorate to begin a process of engagement with the community sector to further explore transport need. But for all of its merits the workshop did not include the community.
We acknowledge that two planned community forums were cancelled in August 2016 and welcome the Directorate’s plans to reschedule these at a date to be confirmed.
Taking a strengths-based approach to transport would mean not seeing transport users who travel outside of Monday to Friday 9am - 5pm commuter hours as a ‘problem’ to be ‘solved’, but as a resource to engage.
A strengths-based approach would also recognise and tap into the social and economic assets available in the ACT that could be deployed to address the ‘wicked’ problem of transport provision in the ACT. These assets include:
A single level of government responsible for all components of transport planning, provision and regulation
Expertise and an appetite in the community to offer constructive solutions
The Canberra Innovation Network and its capacity to imagine and operationalise digitally enabled transport mapping, planning, resource deployment and future design
Whole of community implementation of the NDIS, necessitating a reimagined business model for transport provision for people living with disabilities as well as heightened urgency to meet accessibility goals for public transport
Community Transport providers ready and willing to collaborate, co-ordinate, improve reach and expand capacity
The establishment of Transport Canberra, bringing together policy and administrative responsibility across different transport services and infrastructure
27
Government readiness to consider and adopt innovative platforms for transport provision including ride sharing, car sharing and electric vehicle infrastructure.
28
Reference listABS see Australian Bureau of Statistics
ACTCOSS 2015a, Submission on the Taxi Industry Innovation Review July 2015, ACTCOSS, Canberra, <http://www.actcoss.org.au/publications/Publications_2015/1515sub-taxi-industry-innovation-review.pdf>.
2015b, Policy Brief: Taxi Industry Innovation Review follow-up commentary and questions, ACTCOSS, Canberra, <http://www.actcoss.org.au/publications/Publications_2015/2015-policy-brief-taxi-industry-innovation-review-follow-up-questions-comments-nov2015.pdf>.
2016, Submission on Discussion Paper: Options to Improve the Fairness and Targeting of the ACT Concessions Program, ACTCOSS, Canberra, < http://www.actcoss.org.au/publications/Publications_2016/2016-submission-options-to-improve-fairness-targeting-of-act-concessions-program.pdf>.
ACT Government 2014, ACT Budget 2014-15, Budget Paper 3: Budget Outlook, Australian Government, Canberra.
2015a, Transport Canberra: Public Transport Improvement Plan 2015, ACT Government, Canberra.
2015b, ACT Budget 2015-16, Budget Paper 3: Budget Outlook, Australian Government, Canberra.
2016, ACT Budget 2016-17, Budget Paper 3: Budget Outlook, Australian Government, Canberra.
ACT Human Rights Commission 2014, Passing the Message Stick: Talking with Aboriginal and Torres Strait Islander people about services for children and young people in the ACT, ACT Human Rights Commission, Canberra [First Edition].
ACT Medicare Local 2014, Connecting Care: A Comprehensive Needs Assessment 2014: Major Issues and Key Points’, ACT Medicare Local, Canberra, accessed 16 June 2016, <https://www.chnact.org.au/sites/default/files/CNA%20Major%20Issues%20and%20Key%20Points.pdf>.
Anglicare ACT & Red Cross 2013, Mapping food insecurity in the ACT, accessed 5 May 2016 <http://www.anglicare.com.au/data/foodmappingbasic.pdf>.
ATODA 2011, Meeting Current and Future Demand for Drug Treatment in North Canberra: Expanding Opioid Maintenance Treatment and Needle and Syringe Programs: Paper and Proposal, available at: <http://www.atoda.org.au/wp-content/uploads/Northside_ATOD_Service_Provision_Final_1013.pdf>, accessed 24 February, 2016.
Australian Bureau of Statistics 2009, 4446.0 - Disability, Australia, 2009, Australian Bureau of Statistics, Canberra, accessed 17 June 16,
29
<http://www.abs.gov.au/ausstats/[email protected]/Lookup/4446.0main+features122009>.
2011, 65300DO001_200910 Household Expenditure Survey, Australia: Detailed Expenditure Items, 2009–10, Australian Capital Territory, Australian Bureau of Statistics, Canberra, Tables 3A, 11A, 23A, 27A.
2013, Australian Social Trends, July 2013, cat no. 4102.0, Australian Bureau of Statistics, Canberra, accessed 9 October 2015, <www.abs.gov.au/AUSSTATS/[email protected]/Lookup/4102.0Main+Features40July%202013?OpenDocument#back3>.
2015, 41300DO001_201314 Housing Occupancy and Costs, 2013–14, Australian Bureau of Statistics, Canberra, Table 18.
Bacchi, C 2009, Analysing Policy: What’s the Problem Represented to Be? Pearson Australia, Frenchs Forest NSW.
Carnovale, A 2012, Strong Women Great City: A snapshot of findings from a survey of ACT women with disabilities, WWDACT and WCHM, Canberra, accessed 4 May 2016, <http://www.wchm.org.au/wp-content/uploads/2015/02/Strong-Women-Great-City-A-snapshot-of-findings-from-a-survey-of-ACTs-women-with-disabilities.pdf>.
Centrelink 2015, A Guide to Australian Government Payments, released quarterly, 20 September – 31 December 2015 figures, Australian Government, Canberra, pp.2, 5, 13, 16, 25.
Christl, B, Harris, P & Wise M 2009, A review of the evidence of the impact of public transport on population health in Australia, Centre for Primary Health Care and Equity, University of New South Wales, New South Wales.
Coveney, J & O’Dwyer, L A 2009, ‘Effects of mobility and location on food access’, Health and Place vol. 15, pp.45-55.
Cox, L 2014, ‘All change: ACTION overhauled delayed as planners start again’ The Canberra Times, 24 January, 2014, accessed 29 February 2016, <http://www.canberratimes.com.au/act-news/all-change-action-overhauled-delayed-as-planners-start-again-20140123-31bzt.html>.
Dodson, J, N Buchanan, B Gleeson & N Sipe, 2006, ‘Investigating the Social Dimensions of Transport Disadvantage—I. Towards New Concepts and Methods’, Urban Policy and Research, vol. 24, 4, pp.432-453.
Elton Consulting 2011, Transport for Canberra: Time to Talk Transport Outcomes Report, Prepared for the ACT Government Environment and Sustainable Development Directorate, Elton Consulting, NSW.
Environment and Sustainable Development Directorate 2012, Transport for Canberra: Transport for a sustainable city 2012–2031, ACT Government, Canberra.
30

Evans, M 2013, Improving Services with Families: A perfect project in an imperfect system, ANZSOG Institute for Governance, University of Canberra, Canberra.
Fair Work Commission 2016, Awards and Agreements: National Minimum Wage Orders, accessed 28 February 2016, <www.fwc.gov.au/awards-and-agreements/minimum-wages-conditions/national-minimum-wage-orders>.
Gentleman, M (Minister for Planning) 2015, Next steps for Canberra’s first age-friendly suburbs, media release, ACT Legislative Assembly, Canberra, 24 September, accessed 3 May 2016, <http://www.cmd.act.gov.au/open_government/inform/act_government_media_releases/gentleman/2015/next-steps-for-canberras-first-age-friendly-suburbs >.
Gough, J 2015, Contributing our Voices: A Summary of Feedback from the Have Your Say! Forum with Women With Disabilities ACT, Women With Disabilities ACT, Canberra.
Hine, J 2009 ‘Transport and Social Exclusion’ in R Kitchin & N Thrift (eds), International Encyclopedia of Human Geography, Elsevier Ltd, Oxford, pp. 429-434.
Kerdo, E 2014, HCCA Submission to the Senate Select Committee on Health, HCCA, Canberra, accessed 16 June 2016, <http://www.hcca.org.au/index.php/component/rsfiles/download-file/files.html?path=HCCA%20Submissions%202014/Health%20Care%20Consumers%20Association%20of%20the%20ACT%20Inc%20Submission%20to%20the%20Senate%20Select%20Committee%20on%20Health%20September%202014.pdf>
MRCagney Pty Ltd 2012, Coverage Service Feasibility Study, Final report for the ACT Government, MRCagney, Brisbane.
Pilbrow J 2016, ACT Cost of Living Report: Transport, Full data report, ACTCOSS, Canberra, <http://www.actcoss.org.au/publications/2016-report-act-cost-of-living-transport-full-data.pdf>.
Pittman, N & Day, J E 2015, ‘Locating and quantifying public transport provision with respect to social need in Canberra, Australia’, Australian Planner, vol. 52, 4, pp.326-336.
Rattenbury, S 2013, Consultation opens in new ACTION bus network, media release 13 September, 2013, accessed 29 February 2016, <http://www.cmd.act.gov.au/open_government/inform/act_government_media_releases/rattenbury/2013/consultation-opens-on-new-action-bus-network>.
Rosier, K & McDonald, M 2011, The relationship between transport and disadvantage in Australia, CFCA Resource Sheet, Child Family Community Australia website, accessed 10 February 2016, <https://aifs.gov.au/cfca/publications/relationship-between-transport-and-disadvantage-austr>.
31
Shapiro, M 1991, Reading the post-modern polity: political theory as textual practice, University of Minnesota Press, Minneapolis.
Taxi Fare Calculator 2016, accessed 25 February 2016, <www.taxifare.com.au/rates/>.
Youth Coalition of the ACT 2013, Policy Platform: Transport, Youth Coalition of the ACT website, accessed 20 July 2016, <https://www.youthcoalition.net/dmdocuments/Transport_Policy_Platform_13.pdf>.
32

Appendix 1
Cost of gaining a driver’s license in the ACT7
Road Ready course(includes 4 chances at the Road Rules knowledge test)
$177.50
Learner License (includes Learner Pack) $53.80
Average number of lessons required if applying for probationary license through the Log Book method
$735.00(10 lessons x $73.50)
Driving Assessment Booking Fee $98.30
Probationary License $171.60
Minimum Total Cost – Driving test method $501.20
Minimum Total Cost – Log book method $1137.90
7 Information on ACT Government charges current as at 20 June 2016. Information on driver lesson costs and average number of lessons needed taken from the NRMA website. Class costs are an average of the cost scale for ‘subsequent driving lessons’ provided on the website: NRMA Safe Driving, nd, ‘Driving Lesson Pricing’, accessed 20 June 2016, <http://www.nrmasaferdriving.com.au/pricing.htm>.
33
Appendix 2Our Shared Visioni
Community Transport is recognised as a specialist door-to-door service that enhances wellbeing and is available to all who need it in the ACT and
surrounding regions.
Community Transport is a specialist service that is an alternative to, and distinct from, other forms of public, mass, and private transport available in the ACT. Community transport is primarily about relationships and about putting relationships at the centre of meeting people’s transport needs. Community transport providers build relationships with service users. They work to understand service user’s health and social needs in order to facilitate a personalised, effective service.
Community Transport recognises that transport is a social determinant of health and treats social needs – for connection to community, family and friends – as vital to health and wellbeing. Therefore, Community Transport is not limited to transporting people to and from medical appointments. Rather, community transport is a means by which people who are otherwise unable to access community facilities and social activities are supported to connect with their community. This involves offering transport outside of nine to five hours and a recognition that people living in the ACT may have need to travel into the broader New South Wales region. At its core, community transport takes a holistic understanding of wellbeing.
Recognising the importance of transport to people’s wellbeing also means that, though it is targeted, eligibility for community transport should be broadly needs-based. Community transport should not be limited to people who have a mobility impairment, are elderly and/or who have access to an individualised funding package. Community transport should be available to all people who cannot safely or effectively access other forms of transport and this will include people who are living on low incomes and who do not have access to other transport options.
Community transport is able to provide an appropriate level of service to people who have experienced mental ill health and people who have experienced crisis. Community transport is informed by a human rights understanding that all people are entitled to appropriate and accessible transport.
34

Personalised Service – some examples
Enabling continuity of service – having the same driver available for a service user, to allow relationships to form and grow
Changing drivers for a service user if requested
Knowing and respecting the service user’s preference for (for example) travelling alone or with others; music/radio in the car; level and extent of conversation with driver
Having an approved protocol plan in place if a service user does not come to the door at the time of a scheduled pick up to check on the wellbeing of the individual.
Excellence in service delivery
Personalised service occurs at every stage of the transport system – including booking. In practice this means providing meaningful information to people when a requested service cannot be provided. People contacting community transport providers should be able to expect to speak with an individual who can clearly explain service capacity and not have their call answered by an automated service. Calls should not involve lengthy hold times.
Excellence in service delivery means that people are able to book their trips in advance and that they have reasonable wait times for service.
Excellence in service delivery also means that providers of community transport are access points into the wider community service system, able to make recommendations and share knowledge about a broad suite of relevant community services and programs.
Excellence in personalised service means that community transport providers regularly seek comprehensive feedback on services from service users to understand what needs exist and how they can be better met.
Challenges, constraints and opportunities
Community transport faces unique challenges through the introduction of an individualised funding model in aged care and disability services which not only has the potential to limit eligibility of service users, but also to limit the services that those eligible for funding can access.
Any responses to this changing context for provision of community transport must be driven by a desire to maintain and extend the standards of excellence for this specialised service. This was a key theme of the Community Transport Workshop on 28 April, where participants – including the Minister – noted that moves to closer integration across transport systems should be adopted if and when change would improve access, innovation, quality, efficiency and positive outcomes for the people who use the service.
35

Indeed, the social outcomes of community transport will also generate a longer-term economic benefit. This is because sustaining community connections maintains mental and physical wellbeing, builds informal networks of support and contributes to deferring or avoiding reliance on costly health services.
Community transport is a unique form of transport – it is not public transport ‘on the cheap’, nor is it simply a subsidised form of ride share. Community transport serves people in our community who cannot effectively or safely access other forms of transport. To the extent that this is so, community transport addresses a need that will otherwise go unmet for members of our local community.
While the present context is marked by challenges it also presents an opportunity to make sure that transport is conceptualised as vital to social and infrastructure policy.
36
i This document outlines our shared vision for Community Transport in the ACT. It was developed following a focus group facilitated by COTA and the ACT Council of Social Service with not-for-profit Community Transport providers and representatives from People with Disabilities ACT and the Flexible Bus service.