sub-task 3 – noise evaluation...sub-task 3 – noise evaluation task 1-111 collaborative research...
TRANSCRIPT
Sub-Task 3 – Noise Evaluation
Task 1-111 Collaborative Research Project
Highways England, Mineral Product Association andEurobitume UK
Project Number: 60527938
November 2017
New Asphalt Surfacing - Noise EvaluationProject reference: SPaTS Task 1-111
Prepared for: Highways England AECOM
Quality information
Prepared by Checked by Approved by
Matthew MuirheadSenior Acoustic Consultant
Phil AbbottTechnical Director (retired)
Daru WidyatmokoTechnical Director
Revision History
Revision Revision date Details Authorized Name Position
1 16th November 2017 Comments from MS Y Matthew Muirhead Senior Acoustic Consultant
Phil Abbott
New Asphalt Surfacing - Noise EvaluationProject reference: SPaTS Task 1-111
Prepared for: Highways England AECOM
Prepared for:Highways England, Mineral Product Association (MPA), Eurobitume UK
Prepared by:Matthew MuirheadSenior Acoustic ConsultantT: +44(0)1256 310280M: +44(0)7584 337481E: [email protected]
AECOM Infrastructure & Environment UK LimitedMidpoint, Alençon LinkBasingstokeHampshire RG21 7PPUnited Kingdom
T: +44(0)1256 310200aecom.com
© 2017 AECOM Infrastructure & Environment UK Limited. All Rights Reserved.
This document has been prepared by AECOM Infrastructure & Environment UK Limited (“AECOM”)for the sole use of our client (the “Client”) in accordance with generally accepted consultancyprinciples, the budget for fees and the terms of reference agreed between AECOM and the Client.Any information provided by third parties and referred to herein has not been checked or verified byAECOM, unless otherwise expressly stated in the document. No third party may rely upon thisdocument without the prior and express written agreement of AECOM.
New Asphalt Surfacing - Noise EvaluationProject reference: SPaTS Task 1-111
Prepared for: Highways England AECOM
Table of ContentsExecutive Summary ........................................................................................................................... 51. Introduction.............................................................................................................................. 62. Tyre Road Noise Generation .................................................................................................... 7
2.1 The Tyre/Road Interaction .............................................................................................. 72.2 Road Surface Texture .................................................................................................... 82.3 Other Road Surface Properties ...................................................................................... 9
3. Road Surface Noise Measurement ......................................................................................... 113.1 Measurement Methods ................................................................................................. 113.2 Statistical Pass-By (SPB) Method ................................................................................ 123.2.1 Overview of Methodology ............................................................................................. 123.2.2 Advantages and Disadvantages ................................................................................... 133.2.3 Repeatability and Reproducibility ................................................................................. 143.3 Close ProXimity (CPX) method .................................................................................... 153.3.1 Overview of Methodology ............................................................................................. 153.3.2 Advantages and Disadvantages ................................................................................... 153.3.3 Repeatability and Reproducibility ................................................................................. 16
4. Pavement Types .................................................................................................................... 174.1 Overview ..................................................................................................................... 174.2 Hot Rolled Asphalt ....................................................................................................... 174.3 Thin Surfaces .............................................................................................................. 174.4 Concrete ...................................................................................................................... 184.5 Porous Asphalt............................................................................................................. 18
5. Pavement Classification ......................................................................................................... 195.1 Current Procedures...................................................................................................... 195.2 The SPB and CPX Relationship ................................................................................... 195.3 Proposed Procedures .................................................................................................. 21
6. Conclusions and Recommendations ...................................................................................... 227. References ............................................................................................................................ 23
FiguresFigure 2.1: Sound Paths over Reflective and Porous Surfaces ........................................................... 8Figure 2.2: Positive and Negative Texture .......................................................................................... 9Figure 2.3: Texture Wavelengths and Influence on the Surface Characteristics ................................ 10Figure 5.1: Normalised CPX and SPB Data, for Category 1 Vehicles, Collected from the ROSANNEProject ............................................................................................................................................. 20
TablesTable 2.1: Texture Wavelength Classifications .................................................................................... 8Table 5.1: Road surface noise levels from MCHW ............................................................................ 19
New Asphalt Surfacing - NoiseProject reference: SPaTS Task 1-111
Prepared for: Highways England, MPA, Eurobitume UK AECOM5
Executive SummaryThe impact of road traffic noise can have a significant impact on the quality of life for residents closeto major road networks. One of the most effective measures for reducing the noise from road traffic,particularly on high-speed roads, is to ensure the use of a low noise road surface. Research onpavement construction and the measurement of its acoustic properties has shown that significantnoise benefits can be achieved through the use of certain road surface types. However certain lownoise road surfaces do not exhibit the desired durability associated with more traditional pavements,leading to costly and disruptive maintenance regimes.
As such Highways England, the Mineral Products Association and Eurobitume UK have cometogether to fund collaborative work into developing a durable low noise pavement. This work willensure that asphalt surfacings continue to deliver value for money on the UK Strategic Road Networkand maximise the benefit from innovation.
As part of this programme of work, this report provides an overview of the mechanisms involved intyre/road noise generation, how tyre/road noise is measured, the acoustic properties of different roadsurfaces and how road surfaces may be classified in terms of their impact on traffic noise.
In addition, this report makes recommendations for the future acoustic monitoring and classification ofroad surfaces, including the new Hot Rolled Asphalt and Premium Asphalt Surfacing System materialsdeveloped as part of this programme of work.
New Asphalt Surfacing - NoiseProject reference: SPaTS Task 1-111
Prepared for: Highways England, MPA, Eurobitume UK AECOM6
1. IntroductionSeveral studies have examined the health and monetary impact of changes in road traffic noise, eitheras a consequence of revisions to the vehicle noise test procedures (Watts, et al., 2005), proposedchanges to the type approval noise limits for tyres (Muirhead, et al., 2008) or changes to vehicle noiseregulations (Muirhead, 2012). Such impacts, particularly in noise sensitive areas, can be significantand highlight the benefits of reductions in road traffic noise. Research on pavement construction andthe measurement of its acoustic properties has shown that significant noise benefits can be achievedthrough the use of certain materials. However, it can be the case that certain quieter surfaces do notexhibit the desired durability associated with more traditional pavement types (Morgan(editor), 2006).
As such, a key component of collaborative work, funded by Highways England (HE), the MineralProducts Association (MPA) and Eurobitume UK, on ensuring that asphalt surfacings continue todeliver value for money on the UK Strategic Road Network (SRN) and maximise the benefit frominnovation, is to find a durable low noise pavement. The first part of this programme of work, see(Ojum, 2016), reviewed surfacing materials worldwide with the view to understanding and developingrequirements for materials which offer significantly enhanced durability, reduced noise characteristicsand improved skid resistance. This knowledge was used to initiate the development of asphaltmaterials that could meet these requirements. A Hot Rolled Asphalt (HRA) and a Premium AsphaltSurfacing System (PASS) mixture were further developed in the laboratory to establish a proof ofconcept for the asphalt materials.
This follows up a programme of work looks to perform live trials of these materials on the SRN. One ofthe consequences of this is the need to understand the acoustic performance of these materialsunder regular traffic conditions. This report summarises existing knowledge and experience withrespect to tyre/road surface noise generation, the acoustic performance of different pavement typesand the methods by which the acoustic performance of pavements can be assessed. This will provideuseful context when attempting to understand the acoustic performance of the modified HRA andPASS mixtures.
New Asphalt Surfacing - NoiseProject reference: SPaTS Task 1-111
Prepared for: Highways England, MPA, Eurobitume UK AECOM7
2. Tyre Road Noise GenerationThis chapter discusses road surface properties in general and their impact on the acousticperformance of the pavement. A detailed examination of these properties and mechanisms ispresented in the SILVIA Guidance Manual (Morgan(editor), 2006) and the tyre/road noise referencebook (Sandberg & Ejsmont, 2002). SILVIA was a large European wide programme carried out around2005 with the aim of evaluating low noise road surfaces and determining how best they could beintegrated into existing networks and what associated benefits could be achieved.
2.1 The Tyre/Road Interaction
The mechanisms of tyre/road noise generation are often divided into three classes covering impactsand shocks, aerodynamic processes and adhesion effects respectively.
Impacts and shocks
These describe the interaction forces between the tyre tread and the road surface. The tread blockitself is said to be snapping out as it leaves the road surface and returns to its uncompressed stateand this tends to generate noise below 1 kHz.
Aerodynamic processes
Air trapped between tyre tread blocks as it passes over the road is compressed and decompressedand this is referred to as air pumping and this tends to generate noise above 1 kHz. Theoretically, thisprocess is a significant source of tyre/road noise for smooth, non-porous surfaces which have feweravenues for the dissipation of the compressed air. Additionally, cavities in the tyre tread pattern maycause further resonance of the noise. The amplitude of the shorter texture wavelengths in the roadtexture profile has an important role in determining the level of aerodynamic noise, see Section 2.2.
Adhesion effects
The frictional forces between the tyre and road surface cause vibrations in the tyre which aredissipated by the tyre slipping on the road surface. This noise generation mechanism is partlygoverned by the small-scale roughness characteristics of the road surface.
These noise generating mechanisms are amplified by the local geometry of the tyre and road surface,at the rear of the contact patch (the area where the tyre touches the surface), and this is known as thehorn effect. It can result in substantial amplification of the noise above 1 kHz.
The relative importance of these various mechanisms varies between tyre types and surface designs.
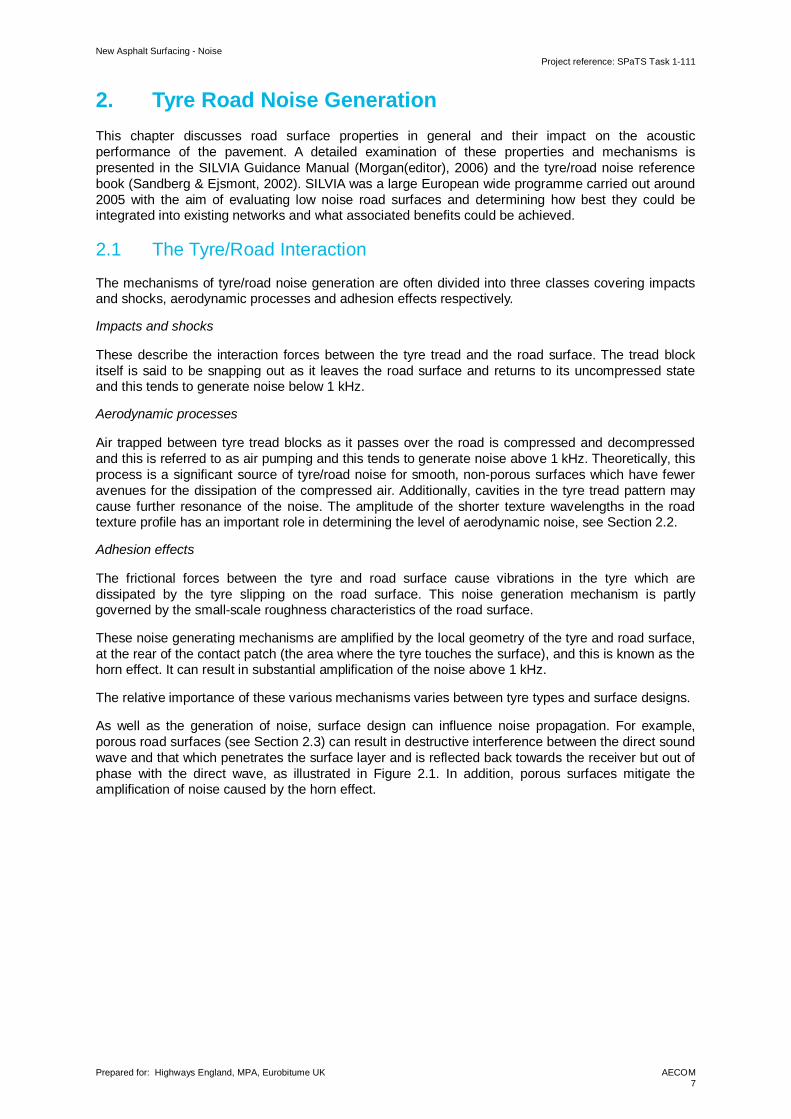
As well as the generation of noise, surface design can influence noise propagation. For example,porous road surfaces (see Section 2.3) can result in destructive interference between the direct soundwave and that which penetrates the surface layer and is reflected back towards the receiver but out ofphase with the direct wave, as illustrated in Figure 2.1. In addition, porous surfaces mitigate theamplification of noise caused by the horn effect.
New Asphalt Surfacing - NoiseProject reference: SPaTS Task 1-111
Prepared for: Highways England, MPA, Eurobitume UK AECOM8
Figure 2.1: Sound Paths over Reflective and Porous Surfaces
2.2 Road Surface Texture
A road surface profile can be visualised by taking a virtual cross section of the pavement andconsidering how the top layer of this cross section appears. It will consist of a continuous series ofpeaks and troughs which may be randomised or reasonably well defined depending on the pavementtype. This profile shape can be interpreted in terms of the summation of a number of sinusoidalvariations of different amplitudes and wavelengths. Each sinusoidal variation is called a waveform andthe associated amplitudes and wavelengths are referred to as texture amplitudes and texturewavelengths.
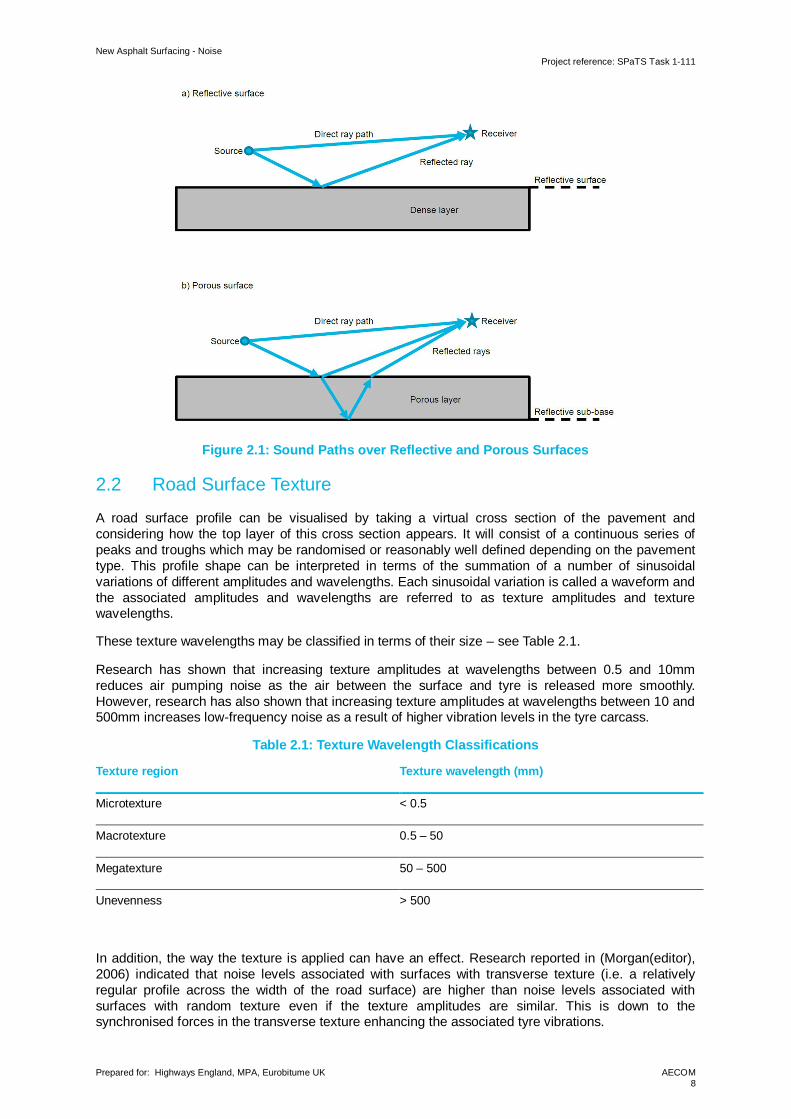
These texture wavelengths may be classified in terms of their size – see Table 2.1.
Research has shown that increasing texture amplitudes at wavelengths between 0.5 and 10mmreduces air pumping noise as the air between the surface and tyre is released more smoothly.However, research has also shown that increasing texture amplitudes at wavelengths between 10 and500mm increases low-frequency noise as a result of higher vibration levels in the tyre carcass.
Table 2.1: Texture Wavelength Classifications
Texture region Texture wavelength (mm)
Microtexture < 0.5
Macrotexture 0.5 – 50
Megatexture 50 – 500
Unevenness > 500
In addition, the way the texture is applied can have an effect. Research reported in (Morgan(editor),2006) indicated that noise levels associated with surfaces with transverse texture (i.e. a relativelyregular profile across the width of the road surface) are higher than noise levels associated withsurfaces with random texture even if the texture amplitudes are similar. This is down to thesynchronised forces in the transverse texture enhancing the associated tyre vibrations.
New Asphalt Surfacing - NoiseProject reference: SPaTS Task 1-111
Prepared for: Highways England, MPA, Eurobitume UK AECOM9
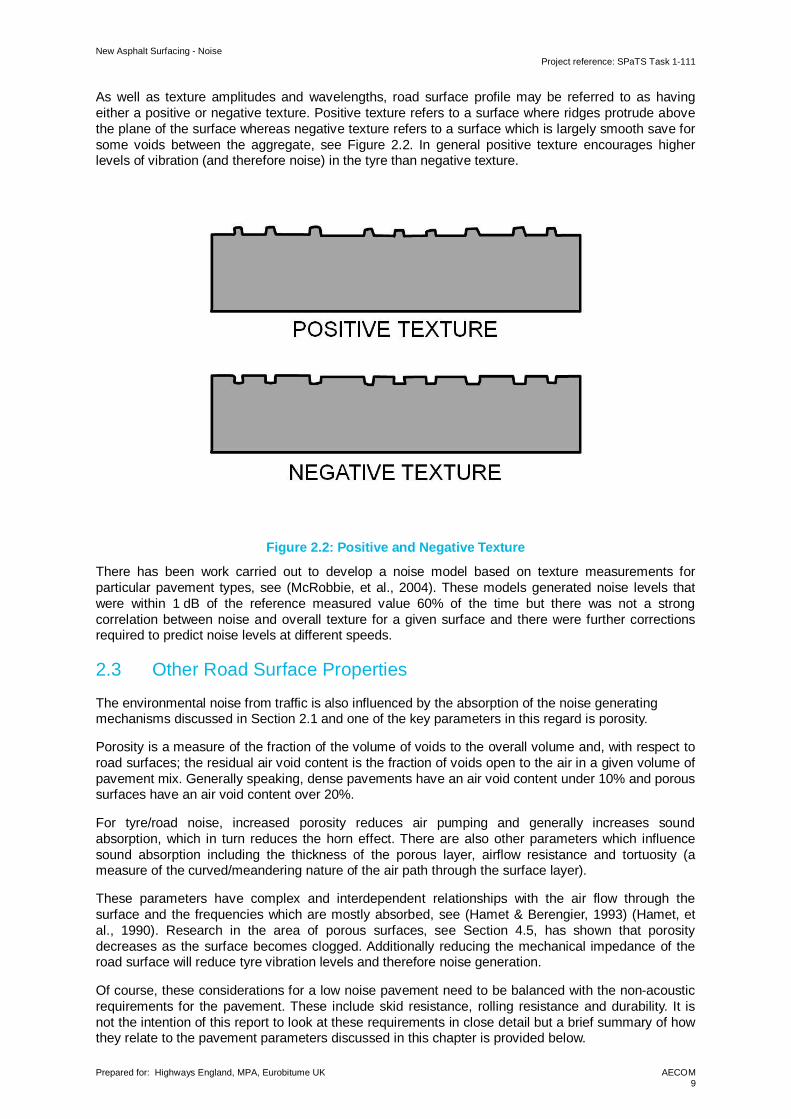
As well as texture amplitudes and wavelengths, road surface profile may be referred to as havingeither a positive or negative texture. Positive texture refers to a surface where ridges protrude abovethe plane of the surface whereas negative texture refers to a surface which is largely smooth save forsome voids between the aggregate, see Figure 2.2. In general positive texture encourages higherlevels of vibration (and therefore noise) in the tyre than negative texture.
Figure 2.2: Positive and Negative Texture
There has been work carried out to develop a noise model based on texture measurements forparticular pavement types, see (McRobbie, et al., 2004). These models generated noise levels thatwere within 1 dB of the reference measured value 60% of the time but there was not a strongcorrelation between noise and overall texture for a given surface and there were further correctionsrequired to predict noise levels at different speeds.
2.3 Other Road Surface Properties
The environmental noise from traffic is also influenced by the absorption of the noise generatingmechanisms discussed in Section 2.1 and one of the key parameters in this regard is porosity.
Porosity is a measure of the fraction of the volume of voids to the overall volume and, with respect toroad surfaces; the residual air void content is the fraction of voids open to the air in a given volume ofpavement mix. Generally speaking, dense pavements have an air void content under 10% and poroussurfaces have an air void content over 20%.
For tyre/road noise, increased porosity reduces air pumping and generally increases soundabsorption, which in turn reduces the horn effect. There are also other parameters which influencesound absorption including the thickness of the porous layer, airflow resistance and tortuosity (ameasure of the curved/meandering nature of the air path through the surface layer).
These parameters have complex and interdependent relationships with the air flow through thesurface and the frequencies which are mostly absorbed, see (Hamet & Berengier, 1993) (Hamet, etal., 1990). Research in the area of porous surfaces, see Section 4.5, has shown that porositydecreases as the surface becomes clogged. Additionally reducing the mechanical impedance of theroad surface will reduce tyre vibration levels and therefore noise generation.
Of course, these considerations for a low noise pavement need to be balanced with the non-acousticrequirements for the pavement. These include skid resistance, rolling resistance and durability. It isnot the intention of this report to look at these requirements in close detail but a brief summary of howthey relate to the pavement parameters discussed in this chapter is provided below.
New Asphalt Surfacing - NoiseProject reference: SPaTS Task 1-111
Prepared for: Highways England, MPA, Eurobitume UK AECOM10
Skid resistance requires a degree of surface texture amplitude over a wide range of texturewavelengths. Increasing texture amplitudes in the microtexture and macrotexture range is less likelyto have a detrimental effect on the noise generation than increased texture amplitude in themegatexture range. Achieving the desired texture amplitudes for skid resistance at the texturewavelengths that do not adversely impact the noise generation is the key to having a low noisesurface that meets the necessary safety requirements.
Rolling resistance and noise are more closely related and reducing texture amplitudes in themegatexture range tends to be beneficial for both properties. For a comprehensive review of theliterature on rolling resistance see (Bendtsen, 2004).
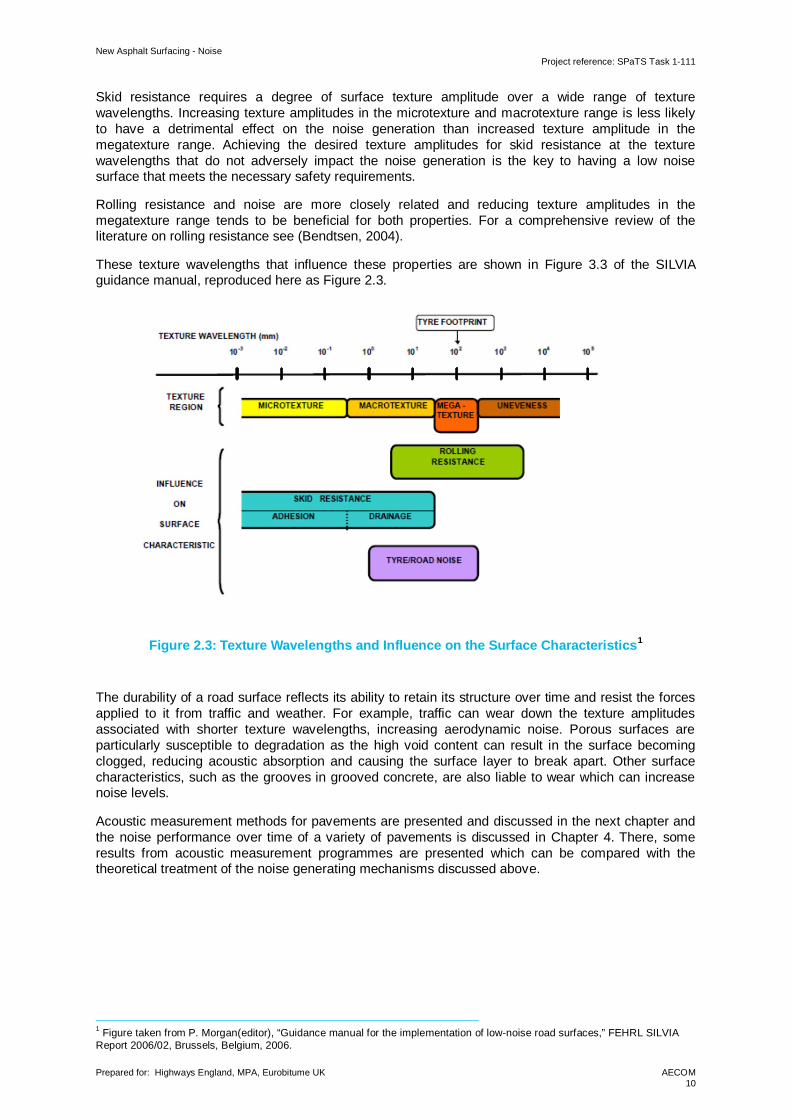
These texture wavelengths that influence these properties are shown in Figure 3.3 of the SILVIAguidance manual, reproduced here as Figure 2.3.
Figure 2.3: Texture Wavelengths and Influence on the Surface Characteristics1
The durability of a road surface reflects its ability to retain its structure over time and resist the forcesapplied to it from traffic and weather. For example, traffic can wear down the texture amplitudesassociated with shorter texture wavelengths, increasing aerodynamic noise. Porous surfaces areparticularly susceptible to degradation as the high void content can result in the surface becomingclogged, reducing acoustic absorption and causing the surface layer to break apart. Other surfacecharacteristics, such as the grooves in grooved concrete, are also liable to wear which can increasenoise levels.
Acoustic measurement methods for pavements are presented and discussed in the next chapter andthe noise performance over time of a variety of pavements is discussed in Chapter 4. There, someresults from acoustic measurement programmes are presented which can be compared with thetheoretical treatment of the noise generating mechanisms discussed above.
1 Figure taken from P. Morgan(editor), “Guidance manual for the implementation of low-noise road surfaces,” FEHRL SILVIAReport 2006/02, Brussels, Belgium, 2006.
New Asphalt Surfacing - NoiseProject reference: SPaTS Task 1-111
Prepared for: Highways England, MPA, Eurobitume UK AECOM11
3. Road Surface Noise Measurement
3.1 Measurement Methods
Whilst some acoustic properties of a pavement can be measured in the laboratory, this is noguarantee of their acoustic performance on the road. For example, the first part of this programme ofwork (Ojum, 2016) tested core samples of various materials according to ISO 13472-2:2010 (BSI,2010) in order to determine the sound absorption characteristics. This was also looked at as part ofthe SILVIA programme (Morgan(editor), 2006).
In order to get a full picture of how a road surface performs in practice however in-situ measurementprogrammes involving vehicles are required and these form the focus of this chapter.
When looking to assess the acoustic performance of a road surface it is useful to consider the primaryreason for the assessment as well as the location and extent of the surface as laid. For example, itmay be useful to consider the following factors:
· Where is the surface to be laid and over what length of road is the surface to be assessed?
· What is the typical speed and composition of traffic on the proposed test section(s)?
· Is the intention of the measurement to classify the road surface purely at the test location or isthe intention to classify the road surface type and infer its performance elsewhere on thenetwork?
· Is the intention to rank the surface’s acoustic performance against other surface types?
· Are there performance metrics for the surface and/or traffic noise at the test or other sites?
· What is an acceptable level of uncertainty for the measurement?
· Are the results required for use in calculating environmental noise levels at residentialproperties?
There are different methods of measuring the acoustic performance of road surfaces and suchconsiderations as highlighted above may influence which of the methods is best suited for a particularmeasurement programme.
The following paragraphs provide a brief overview of the measurement methods followed by moredetailed discussions of the two prominent methods, the Statistical Pass-By (SPB) and CloseProXimity (CPX) methods in Sections 3.2 and 3.3 respectively, see also (Morgan(editor), 2006) and(Haider & Descomet, 2006).
The simplest way to measure road traffic noise is to record average noise levels at the side of a roadand, where the average traffic speed is not low (>50 km/h say) and tyre/road noise dominates overengine noise, this can be a reasonable proxy for the acoustic performance of the road surface.Additionally, for a fixed set of conditions, these measurements are very repeatable. The problem withthis approach is that there are too many variables which are not accounted for such as vehicle speed,traffic composition, measurement averaging time and the environment which can all have a significanteffect on the results. Therefore, whilst this method can be useful for directly comparing the relativeacoustic performance of different test sections laid next to each other and subject to the exactly thesame traffic stream, it is not appropriate for any other application.
Controlled Pass-By (CPB) measurements limit the number of variables by measuring the cruise-bynoise level of a test vehicle at specified speeds. Whilst this accounts for vehicle speed it is notrepresentative of the noise emissions from all types of vehicles, such as Heavy Goods Vehicles(HGVs), which will respond differently due to differences in engine performance and tyre treadcharacteristics. Additionally, it only assesses the acoustic performance of the road surface positionedalongside the microphone, it can be time consuming to perform and can be difficult to find roads withthe limited amount of traffic needed to ensure that the noise from the test vehicle as it passes themicrophone is not contaminated by noise from other vehicles in the traffic stream.
New Asphalt Surfacing - NoiseProject reference: SPaTS Task 1-111
Prepared for: Highways England, MPA, Eurobitume UK AECOM12
In situations where a CPB measurement may be required it is nearly always preferable to perform aseries of SPB measurements instead. This method involves measuring the speed and maximumpass-by level of a number of cars and HGVs and performing a regression analysis to determine areference noise level at a given speed. This procedure is discussed in detail in Section 3.2.
The final measurement method for determining the acoustic performance of a road surface, the CPXmethod, records the tyre/road noise in the near field through the use of microphones placed close tothe tyre of a test vehicle or trailer and enclosed in a semi-anechoic chamber. These directmeasurements are arguably the best way to understand the levels of noise generated by themechanisms discussed in Chapter 2 but are more difficult to relate to traffic noise levels experiencedby residents close to the road. This measurement procedure is discussed in detail in Section 3.3.
3.2 Statistical Pass-By (SPB) Method
3.2.1 Overview of Methodology
The SPB method is described in ISO 11819-1 (BSI, 2001) and involves measuring the speed andmaximum A-weighted2 sound pressure level (LAmax) of a statistically representative number of vehiclesfrom the following categories:
· Vehicle Category 1: Passenger cars
· Vehicle Category 2a: Dual-axle heavy vehicles (>3.5t) with more than 4 wheels, includingcommercial trucks, buses and coaches
· Vehicle Category 2b: Multi-axle heavy vehicles (>3.5t) with more than 2 axles includingcommercial trucks, buses and coaches.
The requirement is to capture at least 100 category 1 vehicles and at least 80 category 2 vehicles withat least 30 vehicles from category 2a and category 2b respectively.
In taking the measurements the microphone is to be placed 7.5m back from the centre of the runninglane and 1.2m above the road surface. There are also a number of conditions on the localenvironment such as there should not be any reflecting surfaces within 10m of the microphone3, theroad surface should be dry and the road surface should be reasonably straight and level.
Depending upon the mean speed of the captured vehicles in each category, the road is classified aseither a medium or high-speed road and corresponding reference speeds for each vehicle categoryare defined as follows:
· Medium Speed Road: Category 1 80km/h, Category 2 70km/h
· High Speed Road: Category 1 110km/h, Category 2 85km/h.
Reference noise levels for each vehicle category, for a given reference speed, are derived from aregression analysis of the maximum pass-by noise levels and the logarithm of the vehicle speeds.The exact form of the analysis varies slightly depending upon whether or not the procedures outlinedin the Highways Authority Product Approval Scheme (HAPAS) Appendix A8 (British Board ofAgrement, 2008) are followed. For example, the HAPAS procedure applies a temperature correctionto the noise levels from category 1 vehicles and uses a different reference speed, 90km/h, forcategory 2 vehicles on high-speed roads. The temperature correction reflects research which hasindicated that higher noise levels are measured at lower temperatures. It is described in HAPAS as atentative correction based upon ongoing analysis but has not changed since it was first introduced.
2 The frequency response of human hearing to sounds in the frequency range 20 to 20k Hz is not constant. The ear is moresensitive to sounds at frequencies centred on about 2.5k Hz compared with sounds at higher or lower frequencies. Thefrequency response of instruments designed to analyse noise are filtered or weighted accordingly to match that of the humanhearing system and is referred to as A-weighted sound pressure levels dB(A).3 If this cannot be achieved the SPB can be performed with a backing board for the microphone which is then placed at 5m,rather than 7.5m, from the centre of the measured lane, see (Abbott, et al., 2004)
New Asphalt Surfacing - NoiseProject reference: SPaTS Task 1-111
Prepared for: Highways England, MPA, Eurobitume UK AECOM13
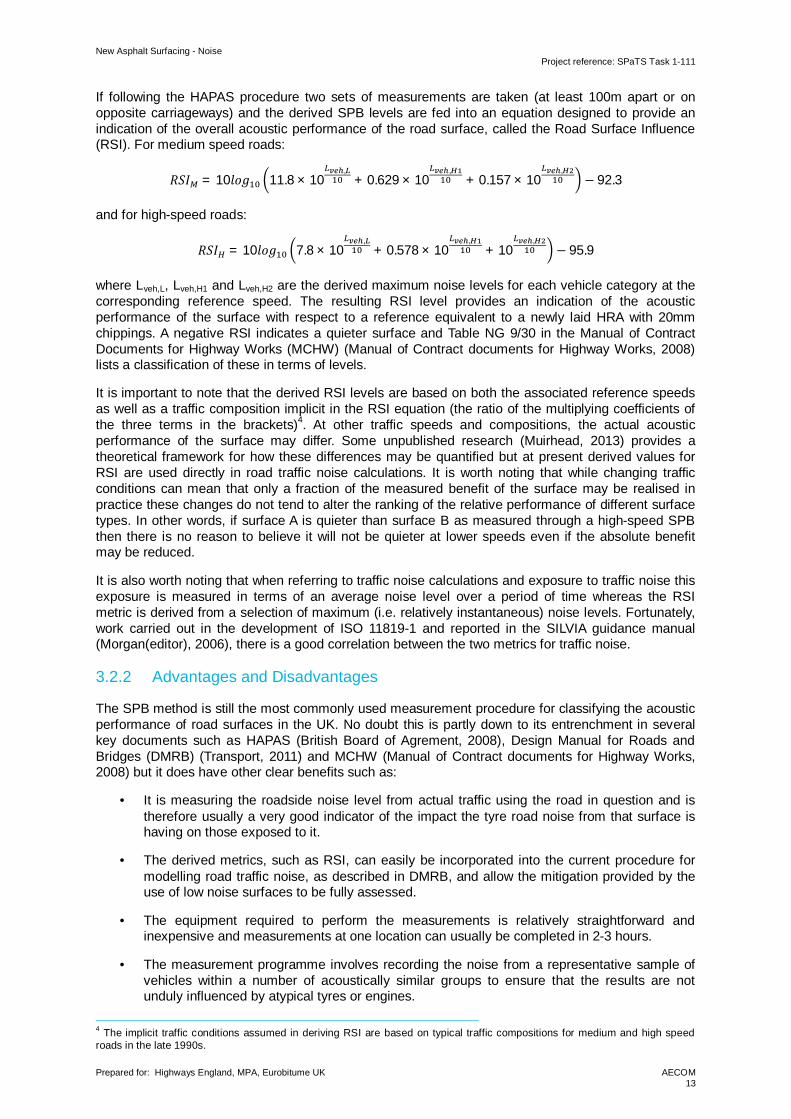
If following the HAPAS procedure two sets of measurements are taken (at least 100m apart or onopposite carriageways) and the derived SPB levels are fed into an equation designed to provide anindication of the overall acoustic performance of the road surface, called the Road Surface Influence(RSI). For medium speed roads:
= 10 11.8 × 10,
+ 0.629 × 10,
+ 0.157 × 10,
− 92.3
and for high-speed roads:
= 10 7.8 × 10,
+ 0.578 × 10,
+ 10,
− 95.9
where Lveh,L, Lveh,H1 and Lveh,H2 are the derived maximum noise levels for each vehicle category at thecorresponding reference speed. The resulting RSI level provides an indication of the acousticperformance of the surface with respect to a reference equivalent to a newly laid HRA with 20mmchippings. A negative RSI indicates a quieter surface and Table NG 9/30 in the Manual of ContractDocuments for Highway Works (MCHW) (Manual of Contract documents for Highway Works, 2008)lists a classification of these in terms of levels.
It is important to note that the derived RSI levels are based on both the associated reference speedsas well as a traffic composition implicit in the RSI equation (the ratio of the multiplying coefficients ofthe three terms in the brackets)4. At other traffic speeds and compositions, the actual acousticperformance of the surface may differ. Some unpublished research (Muirhead, 2013) provides atheoretical framework for how these differences may be quantified but at present derived values forRSI are used directly in road traffic noise calculations. It is worth noting that while changing trafficconditions can mean that only a fraction of the measured benefit of the surface may be realised inpractice these changes do not tend to alter the ranking of the relative performance of different surfacetypes. In other words, if surface A is quieter than surface B as measured through a high-speed SPBthen there is no reason to believe it will not be quieter at lower speeds even if the absolute benefitmay be reduced.
It is also worth noting that when referring to traffic noise calculations and exposure to traffic noise thisexposure is measured in terms of an average noise level over a period of time whereas the RSImetric is derived from a selection of maximum (i.e. relatively instantaneous) noise levels. Fortunately,work carried out in the development of ISO 11819-1 and reported in the SILVIA guidance manual(Morgan(editor), 2006), there is a good correlation between the two metrics for traffic noise.
3.2.2 Advantages and Disadvantages
The SPB method is still the most commonly used measurement procedure for classifying the acousticperformance of road surfaces in the UK. No doubt this is partly down to its entrenchment in severalkey documents such as HAPAS (British Board of Agrement, 2008), Design Manual for Roads andBridges (DMRB) (Transport, 2011) and MCHW (Manual of Contract documents for Highway Works,2008) but it does have other clear benefits such as:
· It is measuring the roadside noise level from actual traffic using the road in question and istherefore usually a very good indicator of the impact the tyre road noise from that surface ishaving on those exposed to it.
· The derived metrics, such as RSI, can easily be incorporated into the current procedure formodelling road traffic noise, as described in DMRB, and allow the mitigation provided by theuse of low noise surfaces to be fully assessed.
· The equipment required to perform the measurements is relatively straightforward andinexpensive and measurements at one location can usually be completed in 2-3 hours.
· The measurement programme involves recording the noise from a representative sample ofvehicles within a number of acoustically similar groups to ensure that the results are notunduly influenced by atypical tyres or engines.
4 The implicit traffic conditions assumed in deriving RSI are based on typical traffic compositions for medium and high speedroads in the late 1990s.
New Asphalt Surfacing - NoiseProject reference: SPaTS Task 1-111
Prepared for: Highways England, MPA, Eurobitume UK AECOM14
Nevertheless, there are also some disadvantages to the SPB method which should be borne in mindin order that the results are not misused or misinterpreted in any way. In Section 3.2.3 therepeatability and reproducibility of the method are discussed and can be considered together with thefollowing limitations:
· The SPB method only assesses the road surface at the measurement location. As such, thereis no assessment of the conformity of production. If there are any inconsistencies in the layingof the surface these are not picked up by the SPB measurements and therefore the resultscan only ever be indicative of the acoustic performance of the surface.
· There can be relatively large variations in the noise of HGVs which is usually only looselycorrelated with speed over the sorts of speed ranges captured during a set of measurements.As such there can be some uncertainty with the reported SPB values for category 2 vehicles.
· As mentioned above RSI values are only really representative of the influence of the roadsurface at the reported reference speeds and traffic compositions implicit in the RSI equationsand therefore results need to be treated with caution if they are used to infer the performanceof the road under different traffic conditions.
· Because the measurement method relies on far field noise measurements environmentalfactors such as wind speed, temperature and the proximity of other vehicles cannot bediscounted. Although the standards governing the method do apply constraints to reduce theinfluence of these factors, nevertheless, they may still impact on the test repeatability.
· The conditions required for the successful completion of an SPB measurement cansometimes be difficult to achieve:
o The road needs to be straight and level.
o There needs to be sufficient traffic to allow the capture of enough vehicles within eachvehicle category to ensure a statistically representative sample.
o There must be sufficient space to the side of the road to allow for the measurementmicrophone to be placed in the correct position and to accommodate the requiredsafety protocols.
o The measurement vehicle must be positioned safely and appropriate weatherconditions must prevail – a dry surface, a wind speed less than 5m/s and an airtemperature between 5°C and 30°C.
3.2.3 Repeatability and Reproducibility
Confidence in the robustness of the reported acoustic performance of the road surface is important infully understanding how best to interpret the results of a set of measurements and therefore knowingthe repeatability and reproducibility of the method is useful information in this regard. In this contextrepeatability refers to the measurements being conducted again by the same team with the sameequipment and reproducibility refers to the measurements being conducted by a different team withan alternative set of equipment.
Statistical studies on the repeatability and reproducibility of the SPB method are relatively few and farbetween however, there has been some work done in this area a summary of which is presentedhere. A study carried out in 2001 is reported on in (Morgan(editor), 2006) as finding a standarddeviation of 0.3 dB for light vehicles and 0.5 dB for heavy vehicles, leading to a repeatability of 0.8 dBand 1.3 dB respectively using 80% coverage factors. The corresponding values for reproducibilitywere found to be 1.1 dB and 1.8 dB. This means that there was considered to be an 80% confidencethat the measured results were accurate to within +/- the quoted repeatability value, see (Bell, 2001).
A small study was carried out as part of the SILVIA programme involving two teams taking two sets ofSPB measurements each and this found peak-to-peak repeatability differences of 0.2 and 0.4 dB forlight and heavy vehicles and corresponding peak-to-peak reproducibility values of 0.4 and 0.6 dB. Itwas concluded that the main cause of uncertainty was inherent in the measurement procedure itselfrather than as a result of different operators.
New Asphalt Surfacing - NoiseProject reference: SPaTS Task 1-111
Prepared for: Highways England, MPA, Eurobitume UK AECOM15
A statistical analysis of repeatability and reproducibility tests carried out in the US is reported in (Dick,et al., 2015). These tests looked at the American Association of State Highway and TransportationOfficials (AASHTO) TP 98: Statistical Isolated Pass-By (SIP) Method, which is essentially the SPBmethod and involved 5 operators across 4 sites. Overall repeatability and reproducibility standarddeviations were slightly higher at 0.5-0.7 dB.
The experience of the author, having conducted numerous SPB measurements across the UK, is thatmeasurements at the same location are nearly always within 1 dB and usually within 0.5 dB.
Additionally, some work has been carried out, both as part of SILVIA and at TRL, looking at thedistribution of noise levels amongst HGVs. The general conclusions are that the spread of results canpotentially be reduced by further restricting the defined classes but this does not tend to improve theaccuracy of the overall result and therefore does not warrant an update to the standard.
3.3 Close ProXimity (CPX) method
3.3.1 Overview of Methodology
The CPX method is described in ISO/FDIS 11819-2:2016 (BSI, 2016) and involves measuring the tyre/ road noise at two microphone positions close to the contact patch of the tyre. The test tyre rollsfreely over the road surface (i.e. does not have a drive axle) and the measurements are taken 20cmfrom the tyre wall, 20cm in front and behind the contact patch, and 10cm above the road surface.Results are averaged over 20m road sections and across the two microphone positions.
There are standard reference tyres for cars and trucks and these are defined in ISO 11819-3 (BSI,2017) as a Uniroyal Tigerpaw 225/60 R16 tyre and Avon Supervan AV4 195-R14C tyre respectively.
The test tyres are usually enclosed within a semi-anechoic chamber to ensure that other noisesources do not influence the levels recorded at the microphones by more than 1 dB. CPXmeasurements are carried out at references speeds of 50, 80 or 110km/h.
3.3.2 Advantages and Disadvantages
The CPX method is used extensively in some European countries such as Germany and theNetherlands and is becoming increasingly prevalent as the latest versions of the ISO standards11819-2 and 11819-3 are due to be formally published. This approach has some clear benefits whenassessing tyre/road noise such as:
· The method provides a direct measure of the influence of the road surface on the generationof tyre noise. The close proximity of the microphone to the contact patch of the tyre within asemi-anechoic enclosure reduces the influence of other extraneous noise sources affectingthe results.
· The method can be used to assess any length (>100m) of road surface relatively quickly andeconomically, making it ideal for performing Conformity of Production (CoP) checks
· Aside from free-flowing traffic conditions and a dry road surface, there are few practicalconstraints on performing CPX measurements.
There are however a few limitations of the method, some of which may act as obstacles to itswidespread adoption in the UK. Section 3.3.3 discusses the repeatability and reproducibility of themethod which has the following constraints:
· The results are not easily transferable into a form which can be readily used in traffic noisecalculation and/or environmental noise assessment. Engine noise, for example, is notmeasured and there may be some directivity to the noise generation and absorptioncharacteristics of the surface that are not fully captured. It is possible to make use ofrelationships between CPX and SPB measurements values, derived from statistical studies ofmeasurement data collected by both methods on the same road surface see Section 5.2, but
New Asphalt Surfacing - NoiseProject reference: SPaTS Task 1-111
Prepared for: Highways England, MPA, Eurobitume UK AECOM16
this adds an extra layer of uncertainty to the accuracy of results used in traffic noisecalculation procedures.
· The test is carried out at a given reference speed and therefore either further tests need to becarried out at other speeds or the impact of the surface on tyre/road noise at other speedsneeds to be inferred.
· The test is carried out with a standard reference tyre for either light or heavy vehicles andwhilst every effort has been made to ensure this is representative of the vehicle class differenttyre widths and tread will result in some difference to the noise levels. Additionally changes inthe properties of the reference tyre, as a result of storage and/or ageing, can affect the resultsalthough these are mitigated somewhat by requirements for the tyre properties, such ashardness, to meet defined criteria as specified in the standards.
· The test requires a specialised, instrumented vehicle or trailer and TRL’s Triton is the onlysuch piece of equipment currently in use in the UK. Also as an HGV, it cannot perform theCPX measurements at 110 km/h and, on some roads, cannot perform measurements at80 km/h either.
3.3.3 Repeatability and Reproducibility
The repeatability and reproducibility of the CPX method have been examined in studies carried out in1997-1998 and 2005-2006, reported in (Morgan(editor), 2006) and 2011, reported in (Derksen & Roo,2012).
Repeatability measurements from the first two studies found typical discrepancies betweenmeasurements on the same surface of around 0.2-0.3 dB, with maximum differences observed ofaround 1 dB. This was backed up by the round robin test in 2011 which found a standard deviation forrepeatability measurements of 0.4 dB.
Reproducibility results from the original set of tests were highly scattered because of the relativefreedom of microphone positions allowed at the time which has led to a more stringent specification ofthe measurement systems and microphone positions in the standard. Between the four differentsystems using the same reference tyre in the SILVIA round robin tests, the standard deviations in theCPX index ranged between 0.3 and 1.3 dB across the different surfaces in the study with typicalvalues around 0.6-0.7 dB. The largest difference between results was 2.9 dB. Similar results wereobtained from the 2011 round robin tests where a standard deviation of 0.8 dB was calculated, fromtests with 9 trailers across 5 different surfaces, and peak-to-peak variances of +/- 1 dB.
These results show that the whilst the repeatability of the CPX method is slightly better than for theSPB method, likely due to the relatively controlled environment close to the tyre, the reproducibility ofboth methods is of a similar magnitude, likely due to changes in the tyre properties betweenmeasurement systems.
New Asphalt Surfacing - NoiseProject reference: SPaTS Task 1-111
Prepared for: Highways England, MPA, Eurobitume UK AECOM17
4. Pavement Types
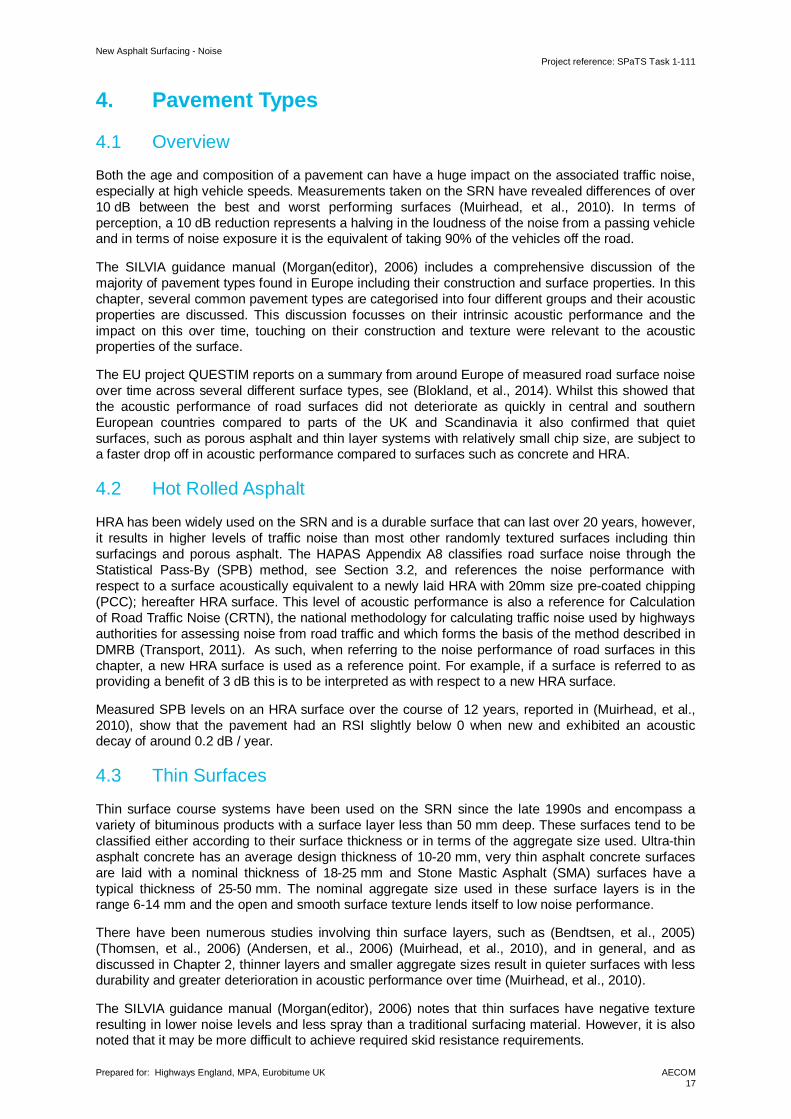
4.1 Overview
Both the age and composition of a pavement can have a huge impact on the associated traffic noise,especially at high vehicle speeds. Measurements taken on the SRN have revealed differences of over10 dB between the best and worst performing surfaces (Muirhead, et al., 2010). In terms ofperception, a 10 dB reduction represents a halving in the loudness of the noise from a passing vehicleand in terms of noise exposure it is the equivalent of taking 90% of the vehicles off the road.
The SILVIA guidance manual (Morgan(editor), 2006) includes a comprehensive discussion of themajority of pavement types found in Europe including their construction and surface properties. In thischapter, several common pavement types are categorised into four different groups and their acousticproperties are discussed. This discussion focusses on their intrinsic acoustic performance and theimpact on this over time, touching on their construction and texture were relevant to the acousticproperties of the surface.
The EU project QUESTIM reports on a summary from around Europe of measured road surface noiseover time across several different surface types, see (Blokland, et al., 2014). Whilst this showed thatthe acoustic performance of road surfaces did not deteriorate as quickly in central and southernEuropean countries compared to parts of the UK and Scandinavia it also confirmed that quietsurfaces, such as porous asphalt and thin layer systems with relatively small chip size, are subject toa faster drop off in acoustic performance compared to surfaces such as concrete and HRA.
4.2 Hot Rolled Asphalt
HRA has been widely used on the SRN and is a durable surface that can last over 20 years, however,it results in higher levels of traffic noise than most other randomly textured surfaces including thinsurfacings and porous asphalt. The HAPAS Appendix A8 classifies road surface noise through theStatistical Pass-By (SPB) method, see Section 3.2, and references the noise performance withrespect to a surface acoustically equivalent to a newly laid HRA with 20mm size pre-coated chipping(PCC); hereafter HRA surface. This level of acoustic performance is also a reference for Calculationof Road Traffic Noise (CRTN), the national methodology for calculating traffic noise used by highwaysauthorities for assessing noise from road traffic and which forms the basis of the method described inDMRB (Transport, 2011). As such, when referring to the noise performance of road surfaces in thischapter, a new HRA surface is used as a reference point. For example, if a surface is referred to asproviding a benefit of 3 dB this is to be interpreted as with respect to a new HRA surface.
Measured SPB levels on an HRA surface over the course of 12 years, reported in (Muirhead, et al.,2010), show that the pavement had an RSI slightly below 0 when new and exhibited an acousticdecay of around 0.2 dB / year.
4.3 Thin Surfaces
Thin surface course systems have been used on the SRN since the late 1990s and encompass avariety of bituminous products with a surface layer less than 50 mm deep. These surfaces tend to beclassified either according to their surface thickness or in terms of the aggregate size used. Ultra-thinasphalt concrete has an average design thickness of 10-20 mm, very thin asphalt concrete surfacesare laid with a nominal thickness of 18-25 mm and Stone Mastic Asphalt (SMA) surfaces have atypical thickness of 25-50 mm. The nominal aggregate size used in these surface layers is in therange 6-14 mm and the open and smooth surface texture lends itself to low noise performance.
There have been numerous studies involving thin surface layers, such as (Bendtsen, et al., 2005)(Thomsen, et al., 2006) (Andersen, et al., 2006) (Muirhead, et al., 2010), and in general, and asdiscussed in Chapter 2, thinner layers and smaller aggregate sizes result in quieter surfaces with lessdurability and greater deterioration in acoustic performance over time (Muirhead, et al., 2010).
The SILVIA guidance manual (Morgan(editor), 2006) notes that thin surfaces have negative textureresulting in lower noise levels and less spray than a traditional surfacing material. However, it is alsonoted that it may be more difficult to achieve required skid resistance requirements.
New Asphalt Surfacing - NoiseProject reference: SPaTS Task 1-111
Prepared for: Highways England, MPA, Eurobitume UK AECOM18
An overview of the acoustic performance of thin surface layers in the UK can be gleaned from(Muirhead, et al., 2010) where measured RSI levels were between -3 (14 mm aggregate size) and -8.5 dB (6 mm aggregate size) for new surfaces and acoustic performance degraded by around 0.5 dB/ year. Despite this higher decay rate in acoustic performance thin surfaces layers were, in general,still found to be quieter than a new HRA surface after 10 years. Acoustic measurements over time onthin layers were also collated as part of the EU QUESTIM programme and reported in (Blokland, etal., 2014); these results, from across Europe, showed an improved level of acoustic degradation ofaround 0.2 dB /year. This discrepancy between degradation rates is likely to be due to the differencesin the degree of trafficking affecting the wearing process on the roads sampled between the twostudies as well as differences in climatic conditions affecting the ageing process.
4.4 Concrete
Exposed Aggregate Concrete (EAC) and brushed concrete are no longer laid on the SRN but sectionsof the network still have these surfaces in use. Measurements of EAC, see (Hewitt, et al., 1997) and(Muirhead, et al., 2010), have shown it to be around 2 dB quieter than HRA surface with a similar rateof deterioration in acoustic performance.
Brushed concrete is associated with high levels of vehicle noise, around 1-2 dB louder than HRAsurface (Hewitt, et al., 1997), however recent measurements of brushed concrete with longitudinalgrooves have shown that the grooving can provide around 4-5 dB of benefit to vehicle noise. Whathas not yet been determined is how this benefit changes over time as the grooves become frayedfrom the exposure to traffic.
As discussed in Section 2.2, the lower noise levels of EAC and HRA surface when compared tobrushed concrete are likely partially because of the random textures in EAC and HRA compared tothe transverse texture of brushed concrete. As reported in (Hewitt, et al., 1997), the increased noiselevels are largely above 1.25 kHz and are also associated with increases in texture amplitude in themegatexture wavelength region.
4.5 Porous Asphalt
Porous asphalt surfaces can be constructed with either a single layer or two layers usually around40 mm thick; sound absorption is achieved by a gap-graded aggregate distribution resulting in a highvoid content. They are common low noise surfaces in Denmark and the Netherlands and theiracoustic properties have been investigated in several studies, see for example (Kragh, 2008) (Kragh,2005) (Blokland, et al., 2014) (Raaberg, et al., 2001). They are not commonly laid in the UK howeveras they do not exhibit good durability because of the rapid ageing of the binder and the clogging of thevoids. The surface also requires more frequent salting in winter conditions and surface repairs aremore problematic (Morgan(editor), 2006).
Reported measurements indicate that high initial noise benefits, around 5 dB quieter than some SMAthin surfaces, are achievable but that the clogging of the voids in the surface leads to most of thisbenefit disappearing over the first 5-6 years of the surface’s life. Also, noise levels are reported toincrease by around 3.5 dB in wet weather and the surface takes longer than other surfaces to dry out,see (Phillips & Abbott, 2001).
New Asphalt Surfacing - NoiseProject reference: SPaTS Task 1-111
Prepared for: Highways England, MPA, Eurobitume UK AECOM19
5. Pavement Classification
5.1 Current Procedures
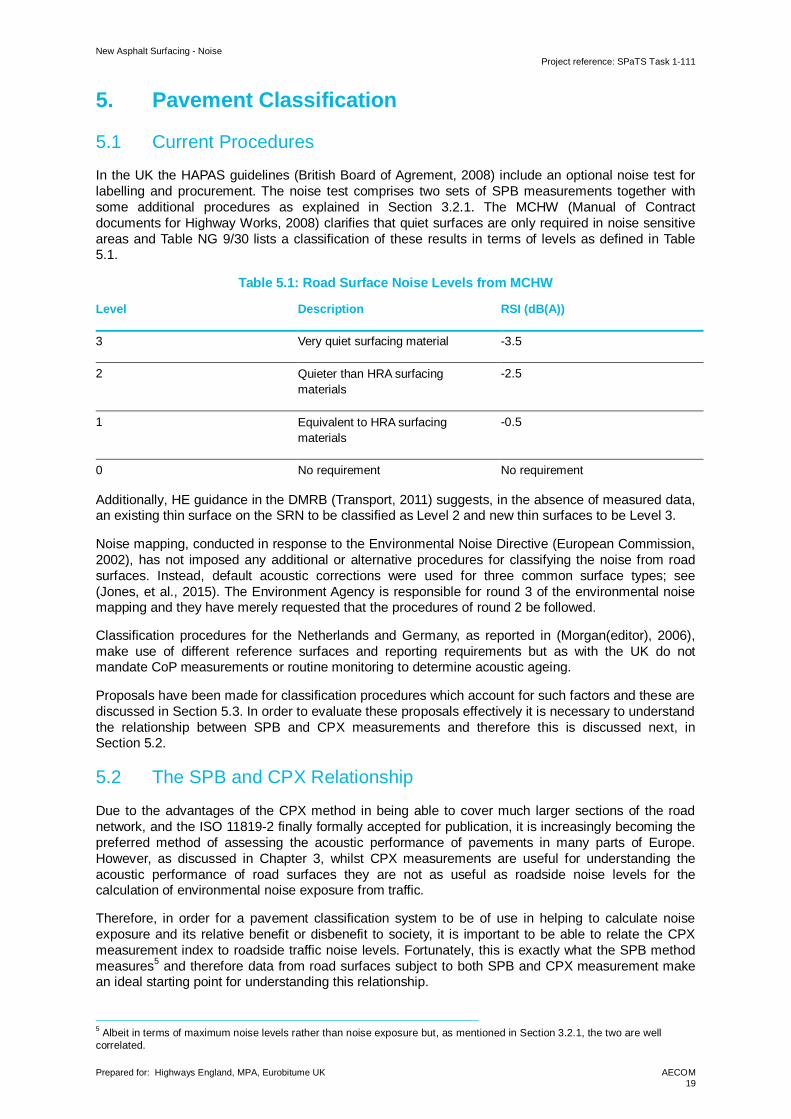
In the UK the HAPAS guidelines (British Board of Agrement, 2008) include an optional noise test forlabelling and procurement. The noise test comprises two sets of SPB measurements together withsome additional procedures as explained in Section 3.2.1. The MCHW (Manual of Contractdocuments for Highway Works, 2008) clarifies that quiet surfaces are only required in noise sensitiveareas and Table NG 9/30 lists a classification of these results in terms of levels as defined in Table5.1.
Table 5.1: Road Surface Noise Levels from MCHW
Level Description RSI (dB(A))
3 Very quiet surfacing material -3.5
2 Quieter than HRA surfacingmaterials
-2.5
1 Equivalent to HRA surfacingmaterials
-0.5
0 No requirement No requirement
Additionally, HE guidance in the DMRB (Transport, 2011) suggests, in the absence of measured data,an existing thin surface on the SRN to be classified as Level 2 and new thin surfaces to be Level 3.
Noise mapping, conducted in response to the Environmental Noise Directive (European Commission,2002), has not imposed any additional or alternative procedures for classifying the noise from roadsurfaces. Instead, default acoustic corrections were used for three common surface types; see(Jones, et al., 2015). The Environment Agency is responsible for round 3 of the environmental noisemapping and they have merely requested that the procedures of round 2 be followed.
Classification procedures for the Netherlands and Germany, as reported in (Morgan(editor), 2006),make use of different reference surfaces and reporting requirements but as with the UK do notmandate CoP measurements or routine monitoring to determine acoustic ageing.
Proposals have been made for classification procedures which account for such factors and these arediscussed in Section 5.3. In order to evaluate these proposals effectively it is necessary to understandthe relationship between SPB and CPX measurements and therefore this is discussed next, inSection 5.2.
5.2 The SPB and CPX Relationship
Due to the advantages of the CPX method in being able to cover much larger sections of the roadnetwork, and the ISO 11819-2 finally formally accepted for publication, it is increasingly becoming thepreferred method of assessing the acoustic performance of pavements in many parts of Europe.However, as discussed in Chapter 3, whilst CPX measurements are useful for understanding theacoustic performance of road surfaces they are not as useful as roadside noise levels for thecalculation of environmental noise exposure from traffic.
Therefore, in order for a pavement classification system to be of use in helping to calculate noiseexposure and its relative benefit or disbenefit to society, it is important to be able to relate the CPXmeasurement index to roadside traffic noise levels. Fortunately, this is exactly what the SPB methodmeasures5 and therefore data from road surfaces subject to both SPB and CPX measurement makean ideal starting point for understanding this relationship.
5 Albeit in terms of maximum noise levels rather than noise exposure but, as mentioned in Section 3.2.1, the two are wellcorrelated.
New Asphalt Surfacing - NoiseProject reference: SPaTS Task 1-111
Prepared for: Highways England, MPA, Eurobitume UK AECOM20
A study on this relationship, from six different sources and covering several different CPX systems,was performed as part of the SILVIA project (Morgan(editor), 2006). The mean difference betweencorresponding SPB and CPX measurements was found to be 21.2 dB with a spread of 0.8 dB,however, the slope of the regression did differ from a one-to-one relationship between themeasurements and varied from 0.8 to 1.2 depending upon which sets of data were examined. At thetime (2006) it was felt that the CPX method could not, therefore, be used in isolation as it lacked aclear unambiguous relationship with roadside noise levels. Hence it was suggested to use bothmethods in parallel for road surface classification, see Section 5.3.
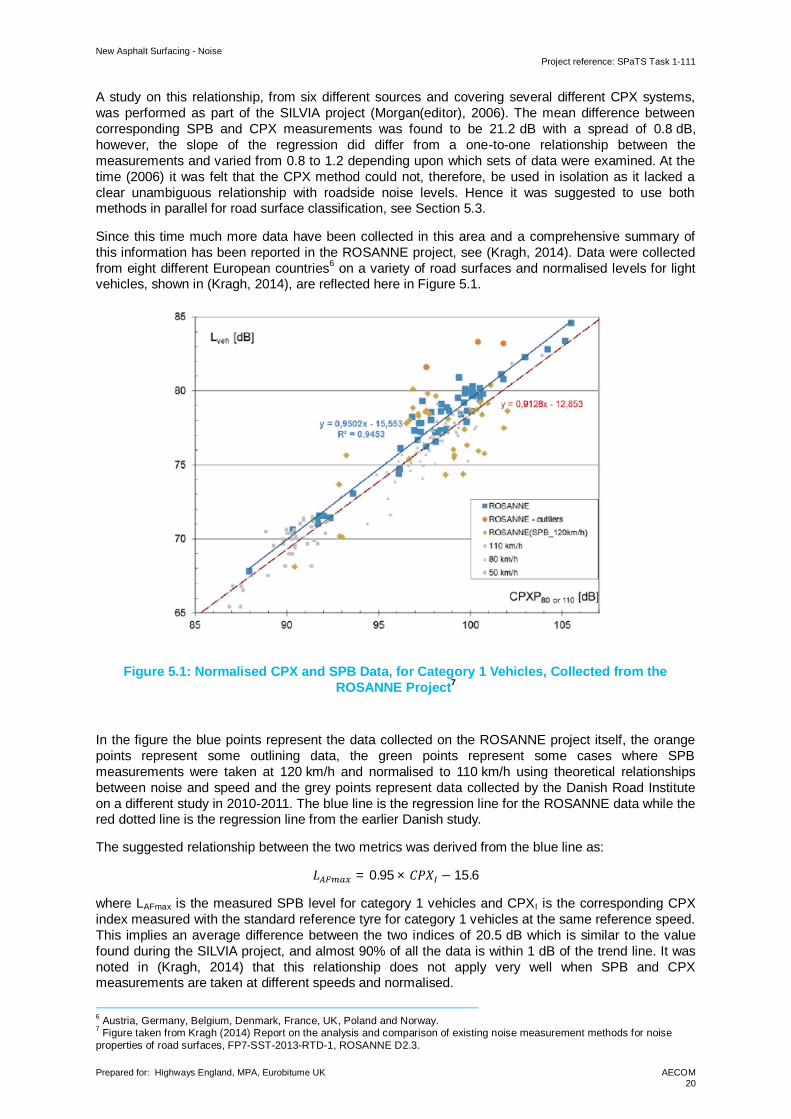
Since this time much more data have been collected in this area and a comprehensive summary ofthis information has been reported in the ROSANNE project, see (Kragh, 2014). Data were collectedfrom eight different European countries6 on a variety of road surfaces and normalised levels for lightvehicles, shown in (Kragh, 2014), are reflected here in Figure 5.1.
Figure 5.1: Normalised CPX and SPB Data, for Category 1 Vehicles, Collected from theROSANNE Project7
In the figure the blue points represent the data collected on the ROSANNE project itself, the orangepoints represent some outlining data, the green points represent some cases where SPBmeasurements were taken at 120 km/h and normalised to 110 km/h using theoretical relationshipsbetween noise and speed and the grey points represent data collected by the Danish Road Instituteon a different study in 2010-2011. The blue line is the regression line for the ROSANNE data while thered dotted line is the regression line from the earlier Danish study.
The suggested relationship between the two metrics was derived from the blue line as:
= 0.95 × − 15.6
where LAFmax is the measured SPB level for category 1 vehicles and CPXI is the corresponding CPXindex measured with the standard reference tyre for category 1 vehicles at the same reference speed.This implies an average difference between the two indices of 20.5 dB which is similar to the valuefound during the SILVIA project, and almost 90% of all the data is within 1 dB of the trend line. It wasnoted in (Kragh, 2014) that this relationship does not apply very well when SPB and CPXmeasurements are taken at different speeds and normalised.
6 Austria, Germany, Belgium, Denmark, France, UK, Poland and Norway.7 Figure taken from Kragh (2014) Report on the analysis and comparison of existing noise measurement methods for noiseproperties of road surfaces, FP7-SST-2013-RTD-1, ROSANNE D2.3.
New Asphalt Surfacing - NoiseProject reference: SPaTS Task 1-111
Prepared for: Highways England, MPA, Eurobitume UK AECOM21
Data from heavy vehicles were provided by Germany and Norway for the ROSANNE project and atentative relationship between measured SPB levels for category 2a vehicles at 80 km/h and CPXmeasurements at the same reference speed using the standard truck tyre was given as:
= 0.65 × + 24
Although there was more spread in the data than for light vehicles. This is to be expected since SPBmeasurements show that there is more spread in the data for category 2 vehicles since the tyre/roadnoise component for these vehicles is not as dominant over the engine noise as it is for cars and thevehicle category covers a wide range of vehicle weights, tyre sizes and treads and (for category 2bvehicles) number of axles.
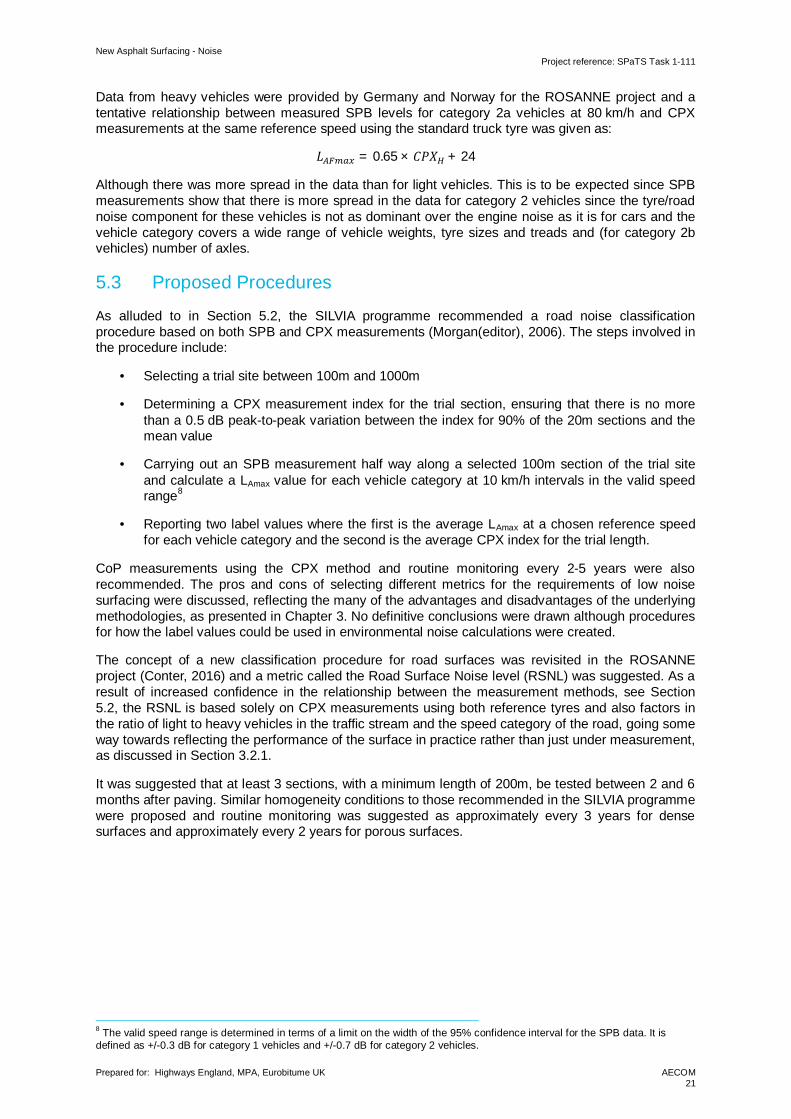
5.3 Proposed Procedures
As alluded to in Section 5.2, the SILVIA programme recommended a road noise classificationprocedure based on both SPB and CPX measurements (Morgan(editor), 2006). The steps involved inthe procedure include:
· Selecting a trial site between 100m and 1000m
· Determining a CPX measurement index for the trial section, ensuring that there is no morethan a 0.5 dB peak-to-peak variation between the index for 90% of the 20m sections and themean value
· Carrying out an SPB measurement half way along a selected 100m section of the trial siteand calculate a LAmax value for each vehicle category at 10 km/h intervals in the valid speedrange8
· Reporting two label values where the first is the average LAmax at a chosen reference speedfor each vehicle category and the second is the average CPX index for the trial length.
CoP measurements using the CPX method and routine monitoring every 2-5 years were alsorecommended. The pros and cons of selecting different metrics for the requirements of low noisesurfacing were discussed, reflecting the many of the advantages and disadvantages of the underlyingmethodologies, as presented in Chapter 3. No definitive conclusions were drawn although proceduresfor how the label values could be used in environmental noise calculations were created.
The concept of a new classification procedure for road surfaces was revisited in the ROSANNEproject (Conter, 2016) and a metric called the Road Surface Noise level (RSNL) was suggested. As aresult of increased confidence in the relationship between the measurement methods, see Section5.2, the RSNL is based solely on CPX measurements using both reference tyres and also factors inthe ratio of light to heavy vehicles in the traffic stream and the speed category of the road, going someway towards reflecting the performance of the surface in practice rather than just under measurement,as discussed in Section 3.2.1.
It was suggested that at least 3 sections, with a minimum length of 200m, be tested between 2 and 6months after paving. Similar homogeneity conditions to those recommended in the SILVIA programmewere proposed and routine monitoring was suggested as approximately every 3 years for densesurfaces and approximately every 2 years for porous surfaces.
8 The valid speed range is determined in terms of a limit on the width of the 95% confidence interval for the SPB data. It isdefined as +/-0.3 dB for category 1 vehicles and +/-0.7 dB for category 2 vehicles.
New Asphalt Surfacing - NoiseProject reference: SPaTS Task 1-111
Prepared for: Highways England, MPA, Eurobitume UK AECOM22
6. Conclusions and RecommendationsThis report has provided an overview of the mechanisms involved in tyre/road noise generation, howthe noise is measured, the acoustic properties of different surface types and how surfaces may beclassified in terms of their impact on traffic noise.
The wider programme of work has developed new HRA and PASS materials to be tested with respectto low noise performance and increased durability. In addition to the testing carried out in 2017 as partof this programme, it is essential that the acoustic performance of these surfaces is also measured infuture years in order to determine its long-term noise performance. Only then will it be seen if thelessons learned from understanding the mechanisms of pavement noise and durability have beensuccessfully translated into practice.
In addition, there is some background information in this report which should enable the discussion ofthe acoustic classification procedure for road surfaces and, in particular, if there is scope for CoP andlong-term monitoring measures which are not currently required. Such procedures and monitoringmeasures have been proposed in the past, from the SILVIA and ROSANNE EU programmes of workfor example, but not incorporated into requirements for surfaces laid in the UK.
Rather than promote another classification procedure it is recommended that the ROSANNEmethodology be given consideration for use in the UK and in the meantime existing knowledge on theperformance of surfaces within the UK over time (Muirhead, et al., 2010) and under different trafficconditions (Muirhead, 2013) be exploited in traffic noise modelling and guidance.
New Asphalt Surfacing - NoiseProject reference: SPaTS Task 1-111
Prepared for: Highways England, MPA, Eurobitume UK AECOM23
7. ReferencesAbbott, P. G., Morgan, P. A., Balsom, M. & Taylor, K., 2004. Extension of CRTN road surfacecorrection to lower speeds, Wokingham, UK: PR SE/707/03 TRL Limited.Andersen, B., Kragh, J. & Bendtsen, H., 2006. Acoustic performance - low noise road pavements,Copenhagen, Denmark: Danish Research Institute Technical Note 44.Balsom, M. H., Kolamthodi, S., Phillips, S. M. & Abbott, P. G., 2004. Measurement of the acousticperformance of road surfaces, Wokingham, UK: PPR021 TRL Limited.Bell, S., 2001. A Beginner's Guide to Uncertainty Measurement, Teddington, UK: National PhysicalLaboratory.Bendtsen, H., 2004. Rolling resistance, fuel consumption and emissions: A literature review, Brussels,Belgium: SILVIA-DTF-ATKINS-007-02-WP3.Bendtsen, H., Raaberg, J. & Thomsen, S. N., 2005. International Experiences with Thin LayerPavements, Copenhagen, Denmark: Danish Road Institute Technical Note 29.Blokland, G. v. & Stahlfest, R., 2016. Uncertainty in the CPX method (ISO 11819-2/3) and itsimplications for pavement evaluation, Hamburg, Germany: Internoise.Blokland, G. v., Tollenaar, C. & Loon, R. v., 2014. Modelling of acoustic ageing of road surfaces,Brussels, Belgium: CEDR QUESTIM D2.2.British Board of Agrement, 2008. Guidelines document for the assessment and certification of thinsurfacing systems for highways, Watford, UK: British Board of Agrement.BSI, 2001. Acoustics - Measurement of the influence of road surfaces on traffic noise - Part 1:Statistical Pass-By method, London: British Standards Institute BS ISO 11819-1.BSI, 2010. Acoustics -- Measurement of sound absorption properties of road surfaces in situ -- Part 2:Spot method for reflective surfaces, London: British Standards Institute BS ISO 13472-2.BSI, 2016. Acoustics -- Measurement of the influence of road surfaces on traffic noise -- Part 2: Theclose-proximity method, London, UK: British Standards Institute BS ISO 11819-2.BSI, 2017. Acoustics -- Measurement of the influence of road surfaces on traffic noise -- Part 3:Reference tyres, London, UK: British Standards Institute BS ISO 11819-3.Centre, M., 2014. Outline of a draft standard for a procedure for the characterization of noiseproperties of road surfaces, Brussels, Belgium: FP7-SST-2013-RTD-1 ROSANNE D2.1.Centre, M., 2016. Measurement methods for the noise emission properties of road surfaces,Sterrebeek, Belgium: ROSANNE Final Event 11 October 2016 BRRC.Derksen, G. B. & Roo, F. d., 2012. CPX trailer comparison round robin test data analysis, Ede, TheNetherlands: CROW Report D12-02.Dick, E., Casey, T., Raad, M. & Nachtsheim, C., 2015. Precision and Bias Statements for AASHTOStandard Methods of Test TP98 and TP99, Washington, USA: Transportation Research Board.European Commission, 2002. Directive 2002/49/EC of the European Parliament and of the Council of25 June 2002 relating to the assessment and management of environmental noise, Brussels,Belgium: OJ L 189, 18.7.2002, p. 12–25.Haider, M. & Descomet, G., 2006. Noise classification methods for urban road surfaces: Classificationmethodology, Brussels, Belgium: SILENCE F.D13.Hamet, J.-F. & Berengier, M., 1993. Acoustic characteristics of porous pavements: a newphenomenological model. Leuven, s.n.Hamet, J.-F., Berengier, M. & Jacques, M., 1990. Acoustic performance of pervious surfaces.Gothenburg, Sweden, s.n.Hewitt, A. P., Abbott, P. G. & Nelson, P. M., 1997. Alternative texture for concrete roads: results of M18and A50 trials, Wokingham, UK: TRL Report 291 TRL Limited.Jones, N., Burdett, M., Joubert, S. & Williams, M., 2015. Round 2 strategic noise mapping - dataproduction process, London, UK: Extrium P054.Kragh, J., 2005. Traffic noise at two-layer porous asphalt - Oster Sogade, Year No.6, Copenhagen,Denmark: Danish Road Institute Technical Note 30.Kragh, J., 2008. Road Surfacings - Noise reduction time history, Copenhagen, Denmark: DanishResearch Institute Report 161.Kragh, J., 2014. Report on the analysis and comparison of existing noise measurement methods fornoise properties of road surfaces, Brussels, Belgium: FP7-SST-2013-RTD-1 ROSANNE D2.3.Manual of Contract documents for Highway Works, 2008. Volume 2: Notes for guidance on thespecification for highway works, s.l.: Series NG900 Road pavements - bituminous materials.McRobbie, S. G., Viner, H. & Wright, M. A., 2004. The use of surface texture measurements to predictpavement surface type and noise characteristics, Wokingham, UK: PR/CSN/32/03 TRL Limited.
New Asphalt Surfacing - NoiseProject reference: SPaTS Task 1-111
Prepared for: Highways England, MPA, Eurobitume UK AECOM24
Morgan(editor), P., 2006. Guidance manual for the implementation of low-noise road surfaces,Brussels, Belgium: FEHRL SILVIA Report 2006/02.Morgan, P. A., Phillips, S. M. & Watts, G. R., 2007. The localisation, quantification and propagation ofnoise from a rolling tyre, Wokingham, UK: PPR104 TRL Limited.Muirhead, M., 2012. Assessment of the environmental impact of changes to vehicle noise regulations,Wokingham, UK: TRL PPR629 TRL Limited.Muirhead, M., 2013. CRTN revision - technical note, Wokingham, UK: TRL Limited.Muirhead, M., Abbott, P. G. & Burdett, M., 2008. An examination of the monetised benefit of proposedchanges to the type approved noise limits for tyres, Wokingham, UK: TRL PPR394 TRL Limited.Muirhead, M., Morris, L. & Stait, R. E., 2010. The performance of quieter surfaces over time,Wokingham, UK: PPR485 TRL Limited.Ojum, C., 2016. Collaborative Research into the Next Generation of Asphalt Surfacings, Nottingham,UK: 409(4/45/12) ARPS.Phillips, S. M. & Abbott, P. G., 2001. Factors affecting statistical pass-by measurements, The Hague,The Netherlands: Proceedings of Inter-Noise, 2031-2036.Phillips, S. M., Kollamthodi, S., Nelson, P. M. & Abbott, P. G., 2003. Study of medium and high speedtyre/road noise, Wokingham, UK: PR SE/849/03 TRL Limited.Raaberg, J., Schmidt, B. & Bendtsen, H., 2001. Technical performance and long term noise reductionof porous asphalt pavements, Copenhagen, Denmark: Danish Research Institute Report 112.Sandberg, U., 2014. Temperature influence on measurements of noise properties of road surfacesand possible normalization to a reference temperature, Brussels, Belgium: FP7-SST-2013-RTD-1ROSANNE D2.2.Sandberg, U. & Ejsmont, J. A., 2002. Tyre/road noise reference book. Sweden: Informex.Stahlfest, R., 2016. Analysis and comparison of methods, CPX and SPB, for measuring noiseproperties of road surfaces, Hamburg, Germany: Internoise.Thomsen, S. N., Bendtsen, H. & Kragh, J., 2006. Test of thin layers on highway, Copenhagen,Denmark: Danish Research Institute Technical Note 35.Transport, D. f., 2011. Design Manual for Roads and Bridges: Volume 11 Section 3 Part 7: HD213/11Revision1: Noise and vibration, London: The Stationery Office.Watts, G., Nelson, P., Treleven, C. & Balsom, M., 2005. An examination of vehicle noise testprocedures, Wokingham, UK: TRL PPR044 TRL Limited.Watts, G. R. & Abbott, P. G., 2005. Tyre and road surface parameters affecting tyre/road noise,Wokingham, UK: Extension of PRSE849 TRL Limited.

New Asphalt Surfacing - NoiseProject reference: SPaTS Task 1-111
Prepared for: Highways England, MPA, Eurobitume UK AECOM25
aecom.com