subgrade improvement using emulsified asphalt … · kata kunci: cbr, aspal emulsi, rancangan...
TRANSCRIPT
SUBGRADE IMPROVEMENT USING EMULSIFIED
ASPHALT FOR PAVEMENT DESIGN
T H E S I S
Submitted to the Post Graduate of Civil Engineering Program in Partial
Fulfillment of the Requirements for the Degree of Master of Engineering
in Infrastructure
By:
ABD RAUOF YOUNIS MOUSSA KREEM
S941 302 030
MASTER OF CIVIL ENGINEERING
GRADUATE PROGRAM
SEBELAS MARET UNIVERSITY
2014

ii

iii

iv
v
ABSTRACT
Problematic soil is a problem in infrastructure that relates soil with road, building
and some others project. Problematic soil in a road is the reason the researcher
will make research entitled Subgrade Improvement Using Emulsified Asphalt for
Pavement Design. The aims of this study to find the physical properties of soil
from Gondangrejo Karanganyar and to find the reaction and effect to soil mix
emulsified asphalt.
Tests were done at the Civil Engineering Laboratory of Sebelas Maret University.
The physical properties of problematic soil of Jalan Mayor Ahmadi Gondangrejo
Karanganyar and the effect of soil asphalt mixture on rehabilitation were
investigated through the use of emulsified asphalt of 0%, 2%, 4%, 6% and 8%.
The physical properties of problematic soil of Jalan Mayor Ahmadi Gondangrejo
Karanganyar are clay and mud. Sieve analysis result is gravel (0.68%), sand
(26.38%), silt and clay (72.93%). The specific gravity is 2.75. Liquid limit
42.48.plastic limit 25.64. Plasticity index 16.83 %. (OMC) = 16.20 % and ɤd
maximum = 1.860 gr/cm3 = 18.60 KN/cm3. CBR test after 3 days. 0% = 4.07, 2%
= 12.17, 4% = 19.29, 6% = 25. 71 and 8% gets 29.36. CBR test after 7 days. 0% =
4.07, 2% = 17.82, 4% = 21.05, 6% = 26.37 and 8% gets 32.64. UCS test after 3
days. 0% = 6.279, 2% = 9.618, 4% = 12.047, 6% =16.293 and 8% gets 17.628.
UCS testafter 7 days.0% = 6.279, 2% = 8.859, 4% = 12.449, 6% = 16.128 and 8%
gets 18.278. The effect of soil asphalt mixture on rehabilitation can improve
subgrade for pavement design. The results are not significant between 3 days and
7 days. The different result gives the point that the important thing is in
percentage of emulsified asphalt.
Keywords: CBR, Emulsified Asphalt, Pavement Design, Subgrade
Improvement, UCS.

vi
INTISARI
Tanah bermasalah adalah masalah infrastruktur yang terkait dengan tanah
terhadap jalan, bangunan, dan beberapa proyek lainnya. Tanah bermasalah pada
jalan adalah alasan penelitian ini dilakukan. Penelitian ini diberi judul
“Peningkatan Tanah Dasar Menggunakan Aspal Emulsi untuk Rancangan
Perkerasan”. Tujuan penelitian ini adalah untuk mengetahui sifat-sifat fisik tanah
di Gondangrejo Karanganyar dan reaksi dan efek campuran tanah terhadap aspal
emulsi.
Pengujian bahan dilakukan Laboratorium Teknik Sipil Universitas Sebelas
Maret. Untuk mengetahui sifat-sifat fisik tanah bermasalah pada Jalan Mayor
Ahmadi Gondangrejo Karanganyar dan efek campuran aspal tanah pada
rehabilitasi, digunakan aspal emulsi 0%, 2%, 4%, 6% dan 8%.
Sifat-sifat fisik tanah bermasalah pada Jalan Mayor Ahmadi Gondangrejo
Karanganyar mencakup tanah liat dan lumpur. Hasil analisis saringan
menunjukkan bahwa tanah pada jalan tersebut tersusun dari kerikil (0,68%), pasir
(26,38%), dan lumpur dan tanah liat (72,93%). Berat jenisnya = 2.75; batas
cairnya = 42.48 dan batas plastinya = 25,64. Indeks plastisitas = 16,83%. (OMC)
= 16.20% dan ɤd maksimum = 1.860 gr / cm3 = 18,60 KN/ cm
3. Nilai tes CBR
setelah 3 hari adalah 0% = 4,07; 2% = 12.17; 4% = 19,29; 6% = 25, 71; dan 8% =
29.36. Nilai tes CBR setelah 7 hari adalah 0% = 4,07; 2% = 17,82; 4% = 21,05;
6% = 26,37; dan 8% = 32,64. Nilai tes UCS setelah 3 hari adalah 0% = 6,279; 2%
= 9,618; 4% = 12,047; 6% = 16,293; dan 8% = 17,628. Nilai tes UCS setelah 7
hari adsalah 0% = 6,279; 2% = 8,859; 4% = 12,449; 6% = 16,128; dan 8% =
18,278. Pengaruh campuran aspal tanah pada rehabilitasi dapat meningkatkan
tanah dasar untuk rancangan perkerasan. Berdasarkan hasil analsis, dapat
disimpulkan bawah terdapat perbedaan nilai hasil, yaitu hasilnya tidak signifikan
antara 3 hari dengan 7 hari. Hasil yang berbeda tersebut menitikberatkan bahwa
yang penting dalam pencampuran adalah persentase aspal emulsi.
Kata Kunci: CBR, aspal emulsi, rancangan perkerasan, peningkatan tanah dasar,
dan UCS.
vii
TABLE OF CONTENTS
COVER ...................................................................................................... i
FOREWORD ............................................................................................. ii
SHEET OF APPROVAL .......................................................................... iii
ABSTRACT ............................................................................................... iv
TABLE OF CONTENTS .......................................................................... v
LIST OF FIGURES .................................................................................. vi
LIST OF TABLES .................................................................................... vii
LIST OF APPENDIXES ......................................................................... viii
CHAPTER I:INTRODUCTION ............................................................. 1
1.1 Background .................................................................................. 1
1.2 Research Problem ......................................................................... 3
1.3 Limitation ..................................................................................... 3
1.4 Research Objective ....................................................................... 4
1.5 Benefit of Study ............................................................................ 4
CHAPTER II: LITERATURE REVIEW& BASIC THEORY ....... 5
2.1 Literature Review.......................................................................... 5
2.1.1 Stabilization of Soil ............................................................ 6
2.1.2 Emulsified Asphalt ............................................................. 9
2.2 Basic Theory ................................................................................ 12
2.2.1 Stabilization of Soil ............................................................. 12
2.2.2 Emulsified Asphalt ............................................................... 18
2.3 Hypothesis .................................................................................... 20
viii
CHAPTER III: RESEARCH METHODOLOGY .............................. 21
3.1. Location ................................................................................... 21
3.2. Parameter and Variable ............................................................ 21
3.3. Data Type ................................................................................. 22
3.4. Data Collection ......................................................................... 22
3.5. Validation and Clarification .................................................... 23
3.6. Analysis ................................................................................... 23
3.6.1. Physical Properties................................................... 23
3.6.2. Effect of Mixing Emulsified Asphalt ...................... 23
3.7. Flow Chart of Research ........................................................ 24
CHAPTER IV: RESULT AND DISCUSSION ................................... 25
4.1. Introduction .............................................................................. 25
4.2. Material Test .......................................................................... 25
4.2.1. Soil and Emulsified Asphalt ................................... 25
4.3. Result and Discussion ............................................................. 27
4.3.1. Determination of Soil Index Properties ................. 27
4.3.2. Proctor test ............................................................... 29
4.3.3. Mixture Design ........................................................ 30
4.3.4. California Bearing Ratio Test ................................. 31
4.3.5. Unconfined Compressive Strength Test ............... 35
4.3.6. Comparison of Shear Strength with Other Researches 38
ix
CHAPTERV: CONCLUSION AND SUGGESTION ...................... 40
5.1. Conclusion ............................................................................. 40
5.2. Suggestion .............................................................................. 41
REFERENCE ............................................................................................ 42

x
LIST OF FIGURES
Figure 1.1 Map of Karanganyar .................................................................. 1
Figure Figure.1.2. location of Road in Gondangrejo Karanganyar ............. 2
Figure2.1.Effect of UCS on (RHA) ............................................................ 7
Figure 2.2.Effect of CBR on lime .............................................................. 7
Figure 2.3. Effect of (C) on lime ................................................................ 7
Figure 2.4. Effect of (φ) on lime ................................................................ 7
Figure 2.5.Effect of cement and lime on UCS ............................................ 8
Figure 2.6.Correlation between Cohesion and Emulsified Asphalt ............ 9
Figure 2.7.AASHTOO Clasification System .............................................. 15
Figure 3.1 Map of Karanganyar .................................................................. 21
Figure 4.1. Picture of soil at Gondangrejo .................................................. 26
Figure 4.2.Emulsified asphalts from PT Hutama Prima ............................. 26
Figure. 4.3 Test Result of Grain Size Analysis ........................................... 27
Figure 4.4. Charts of Liquid Limit .............................................................. 28
Figure 4.5.Relation graph of OMC and MDD ............................................ 30
Figure 4.6.The effect of emulsified asphalt on CBR after 3 days ............... 31
Figure 4.7.The effect of emulsified asphalt on CBR after 7 days ............... 32
Figure 4.8.The effect of emulsified asphalt on CBR after 3& 7 days ......... 34
Figure 4.9.The effect of emulsified asphalt on UCS after 3 days ............... 35
Figure 4.10.The effect of emulsified asphalt on UCS after 7 days ............. 36
Figure 4.11.The effect of emulsified asphalt on UCS after 3 & 7 days ...... 37
Figure 4.12.Comparison of shear strength results with other research ....... 39

xi
LIST OF TABLES
Table.2.1. Comparison of this research with previous researches .............. 10
Table 2.2 Test Result of Emulsified Asphalt Characteristic ....................... 19
Table.2.3. Advantages and disadvantages of emulsified asphalt ................ 20
Table 3.1 Research parameter ..................................................................... 21
Table 3.2 Research variable ........................................................................ 22
Tabel 4.1.Range of specific gravity for different soil types ........................ 28
Table 4.2.Physical and Mechanic Characteristics of Original Soil ............. 29
Table 4.3.CBR test after 3 days and 7 days ................................................ 33
Table 4.4 UCS test after 3 days and 7 days................................................. 37
Table 4.5.The comparison of shear strength results with other research .... 38
xii
LIST OF APPENDIXES
APPENDIX A = Determination of Soil Index Properties
APPENDIX B = CBR test and UCS test
APPENDIX C = Pictures of field and Laboratory Tests

1
CHAPTER I
INTRODUCTION
1.1. Background
Pavement structure is a combination of sub-base, base course, and
surface course placed on a sub-grade to support the traffic load and to
distribute it to the roadbed. Soil improvement is important to overcome the
problem in Gondangrejo. The location is on Jalan Mayor Ahmadi in
Gondangrejo Sub-district, Karanganyar Regency, which is around 20 km
from Surakarta City as shown in Figure 1.1.
Figure 1.1 Map of Karanganyar
Location of research in Gondangrejo, Karanganyar
2
Some of the problems of soil are expansive soil, dispersive soil and
collapsible soil. Rezaei (2011) states that expansive soil is some soils
which undergo a low volume change. When the water content changes,
independent loading occurs, and these are attributable to swelling or
shrinkage. He adds that dispersive soil is dispersion occurring in soils
when the repulsive forces between clay particles exceed the attractive
forces, thus bringing about deflocculating, so that in the presence of
relatively pure water the particles repel each other to form colloidal
suspensions. Collapsible soils are moisture-sensitive in which increase in
moisture content is the primary triggering mechanism for the volume
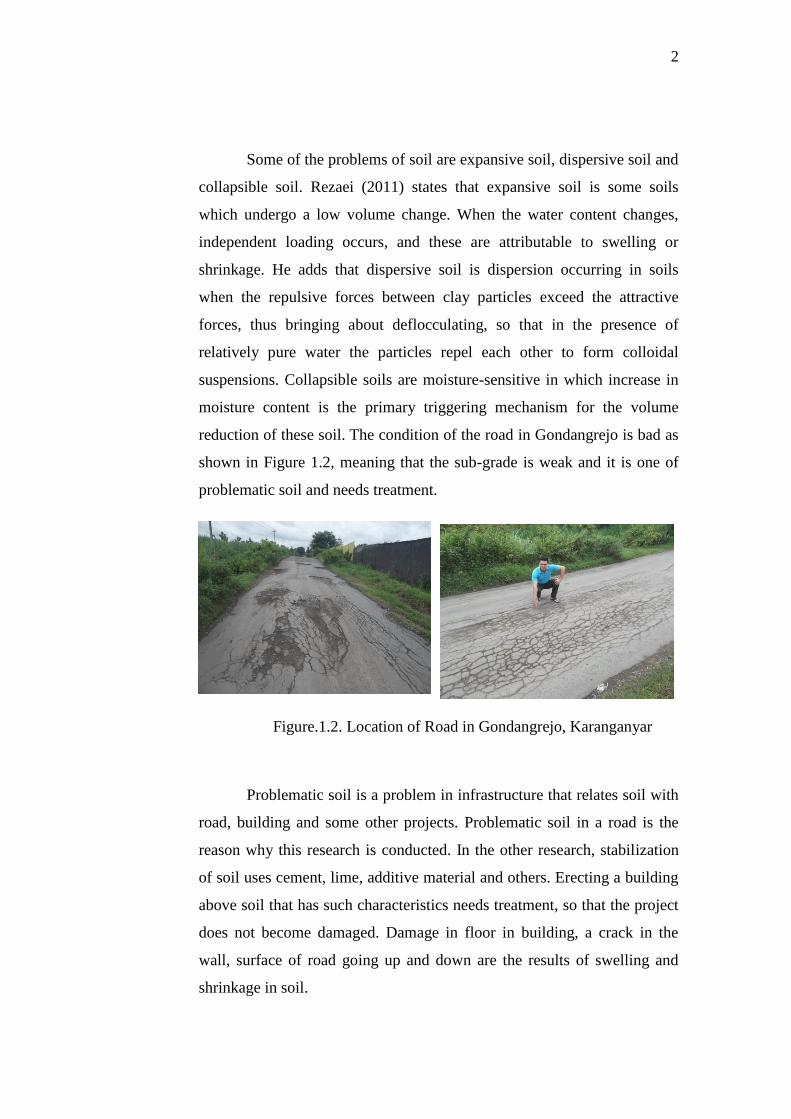
reduction of these soil. The condition of the road in Gondangrejo is bad as
shown in Figure 1.2, meaning that the sub-grade is weak and it is one of
problematic soil and needs treatment.
Figure.1.2. Location of Road in Gondangrejo, Karanganyar
Problematic soil is a problem in infrastructure that relates soil with
road, building and some other projects. Problematic soil in a road is the
reason why this research is conducted. In the other research, stabilization
of soil uses cement, lime, additive material and others. Erecting a building
above soil that has such characteristics needs treatment, so that the project
does not become damaged. Damage in floor in building, a crack in the
wall, surface of road going up and down are the results of swelling and
shrinkage in soil.
3
The physical properties of problematic soil of Gondangrejo
become the focus in laboratory examination in this research. This study
examines the characteristics of soil and repairs the problems. The research
use emulsified asphalt to make a treatment for problems in the soil. From
another research, emulsified asphalt is used in soil stabilization because
the nature of asphalt stabilization is so mechanistic. The researcher
examines the effect of soil asphalt mixture on rehabilitation. The result can
be as guidance for construction project of road, and it can be useful for
civil engineering. For government, it can be as a guidance to make a plan
for making a good road.
Based on the above explanations, this research uses emulsified
asphalt to add stabilization. Based on those considerations, the researcher
entitles the research as Sub-grade Improvement Using Emulsified Asphalt
for Pavement Design.
1.2. Research Problem
The problems of research are formulated as follows:
a. What are the physical properties of problematic soil of Solo-
Gondangrejo Karanganyar road especially in Jalan Mayor Ahmadi ?
b. What is the effect of soil asphalt mixture on rehabilitation?
1.3. Limitation
The scope of this study is emulsified asphalts to treat the
problematic soil for the road. The study does not use cost aspects. It is not
done in the field but in a laboratory.
a. Soil sample is taken from Gondangrejo in Karanganyar.
b. Emulsified asphalt uses the one manufactured by PT. Hutama Prima.

4
1.4. Research Objective
The objective of this study is to treat problematic soil by using
emulsified asphalts so as to investigate:
a. physical properties of soil from Gondangrejo Karanganyar; and
b. reaction and effect of soil mix on emulsified asphalt.
1.5. The Benefit of Study
1.5.1. Theoretical Benefit
Theoretically, the result of this research is expected to give contribution to
knowledge and research program in civil pavement design.
1.5.2. Practical Benefit
Practically, this study gives contribution to road projects especially in sub-
grade improvement for pavement design.

5
CHAPTER II
LITERATURE REVIEW
2.1. Literature Review
Soils are generally stabilized not only to increase their strength and
durability, but also to prevent erosion and dust formation in soils (Sen and
Kasyhap, 2012). The main aim is to create the soil material or system that will
hold underuse conditions and for the designed life of the engineering project. The
properties of soil vary a great deal at different places or in certain cases even at
one place. The success of soil improvement depends on soil testing. Various
methods are used for improving the soil, and the method should be verified in the
lab with the soil material before applying it in the field. Principles of soil
improvement are first, evaluating the soil properties, and then second, deciding
the property of soil which needs to be altered to get the designed value and to
choose the effective and economical method for stabilization. Soil is all materials
including clay, silt, sand, gravel, and boulder, namely big stones. Soil found in the
nature generally consists of several kinds of sizes/characteristics, for instance,
gravels mixed up with sand, sandy loam, etc.
The purpose of sub-grade modification is to create a working platform for
construction equipment. No credit is accounted for in this modification in the
pavement design process.

6
2.1.1. Stabilization of Soil
The study by Al-Khashab and Al-Hayalee’ (2008) deals with the
possibility of the stabilization of expansive clayey soil pre-treated by lime, with an
emulsified asphalt addition. Soil from the "2nd Kafaat" District in Mosul was
chosen. It is classified as medium to high expansiveness. Their research focus in
the pre-treated soil was performed with lime addition (0.5, 1.0, and 1.5%) by
weight. After short period, emulsified asphalt was added with different
percentages namely (2, 4, 6 and 8) by weight, for optimum percentages of an
emulsified asphalt to give the most useful stabilization aspects. The test result of
lime addition alone shows that there was a considerable reduction in soil
plasticity, 1.5% of lime addition converted the clayey soil towards non-plastic
types. The emulsified asphalt addition to the mixture caused slight increase in the
plasticity but, their values in the whole remained below the value of the natural
soil.
Stefan and Hossain's (2003) research focus in recycling of the materials
obtained from the milling of asphalt pavements, known as RAP (Reclaimed
Asphalt Pavement), involves mixing RAP with asphalt cement/emulsion and
aggregates in definite proportions to produce a new asphalt concrete mix or cold-
in place recycled mixture. In many cases, the RAP is unusable because it is not
uniform (i.e. it may originate from different sources) or the underlying pavement
does not provide adequate structural support. One solution to this inadequate
support problem is construction of a base with full depth reclamation (FDR)
materials stabilized with foamed asphalt. The results show that the estimated
structural layer coefficient of the foamed asphalt stabilized FDR (Full Depth
Reclamation) base materials was 0.18.
7
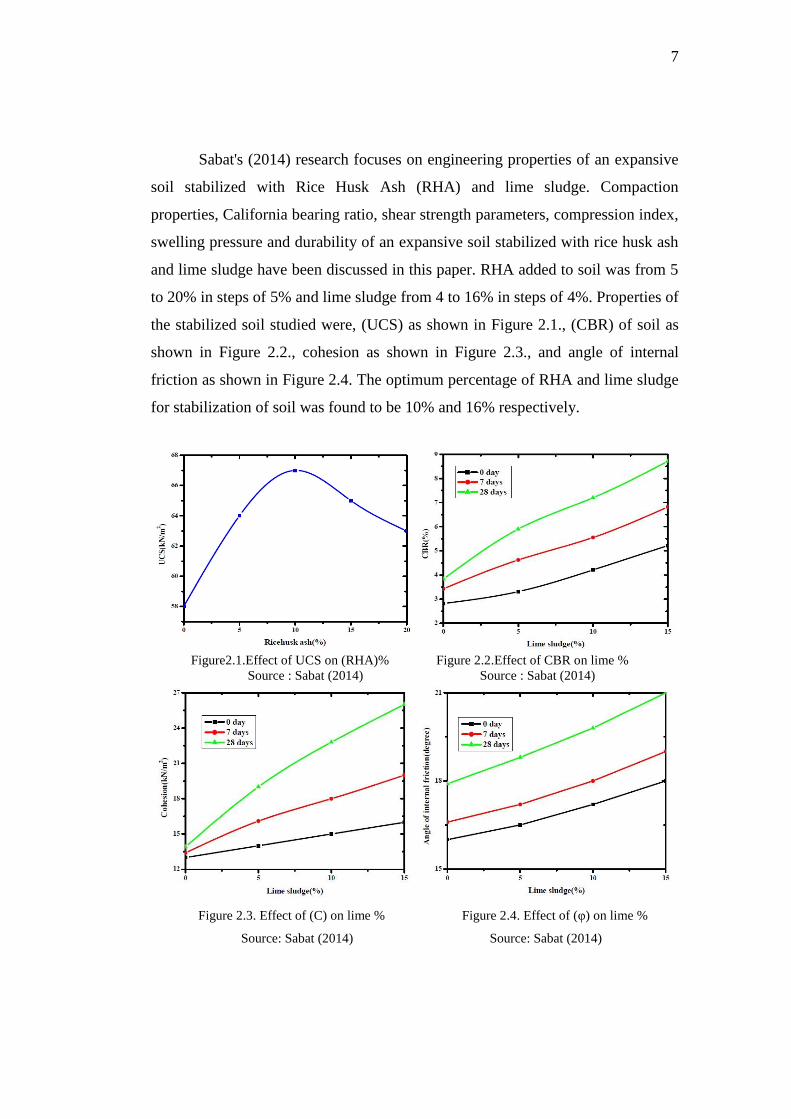
Sabat's (2014) research focuses on engineering properties of an expansive
soil stabilized with Rice Husk Ash (RHA) and lime sludge. Compaction
properties, California bearing ratio, shear strength parameters, compression index,
swelling pressure and durability of an expansive soil stabilized with rice husk ash
and lime sludge have been discussed in this paper. RHA added to soil was from 5
to 20% in steps of 5% and lime sludge from 4 to 16% in steps of 4%. Properties of
the stabilized soil studied were, (UCS) as shown in Figure 2.1., (CBR) of soil as
shown in Figure 2.2., cohesion as shown in Figure 2.3., and angle of internal
friction as shown in Figure 2.4. The optimum percentage of RHA and lime sludge
for stabilization of soil was found to be 10% and 16% respectively.
Figure2.1.Effect of UCS on (RHA)% Figure 2.2.Effect of CBR on lime %
Source : Sabat (2014) Source : Sabat (2014)
Figure 2.3. Effect of (C) on lime % Figure 2.4. Effect of (φ) on lime %
Source: Sabat (2014) Source: Sabat (2014)
8
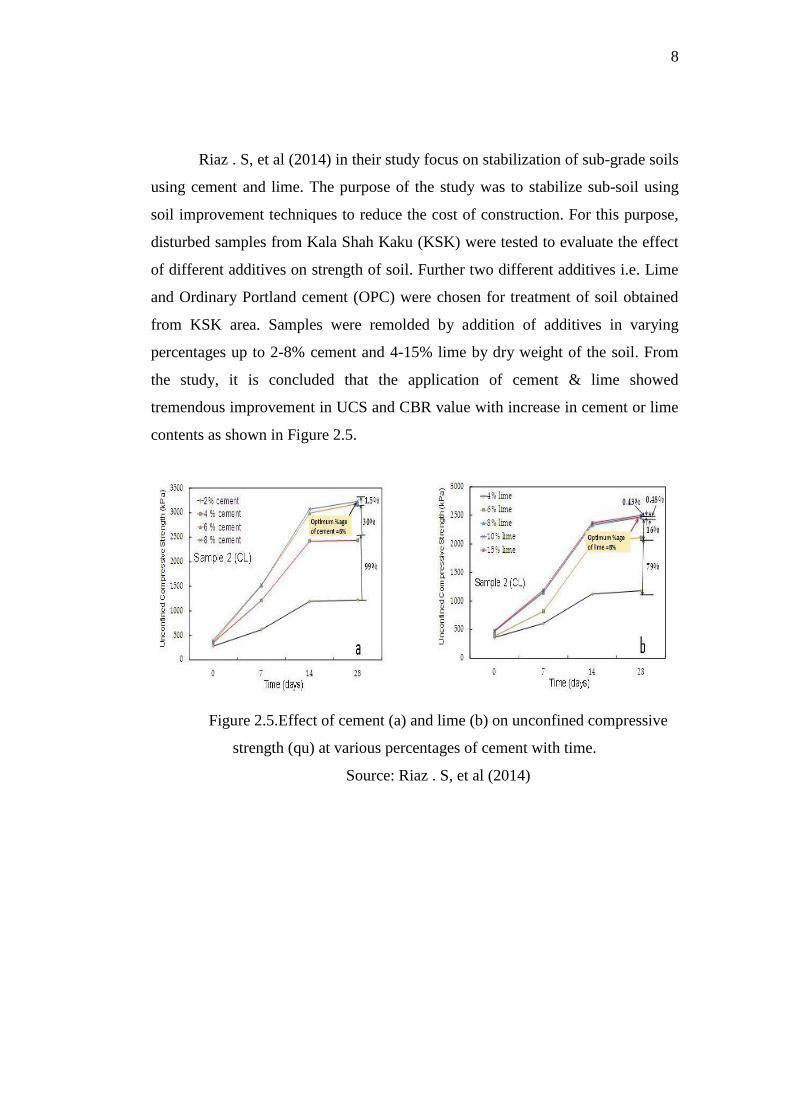
Riaz . S, et al (2014) in their study focus on stabilization of sub-grade soils
using cement and lime. The purpose of the study was to stabilize sub-soil using
soil improvement techniques to reduce the cost of construction. For this purpose,
disturbed samples from Kala Shah Kaku (KSK) were tested to evaluate the effect
of different additives on strength of soil. Further two different additives i.e. Lime
and Ordinary Portland cement (OPC) were chosen for treatment of soil obtained
from KSK area. Samples were remolded by addition of additives in varying
percentages up to 2-8% cement and 4-15% lime by dry weight of the soil. From
the study, it is concluded that the application of cement & lime showed
tremendous improvement in UCS and CBR value with increase in cement or lime
contents as shown in Figure 2.5.
Figure 2.5.Effect of cement (a) and lime (b) on unconfined compressive
strength (qu) at various percentages of cement with time.
Source: Riaz . S, et al (2014)

9
2.1.2 Emulsified Asphalt
Bunga's (2011) study deals with stabilization of sandy clay loam with
emulsified asphalt. His study was to solve easily eroded sandy clay loam problem.
The study was conducted by using emulsified asphalt as stabilization material.
The soil samples were obtained from Manuju village, Gowa regency, South
Sulawesi province (E.1190 41.035,, S.050 17.509,,+ 269 m). Emulsified asphalt
type CSS-1S was obtained from PT. Widya Sapta Colas. The emulsified asphalt
concentrations were 1.5%, 3.0%, and 4.5%. The results of the study indicate that
stabilization material for emulsified asphalt could improve physical, chemical, and
mechanic characteristics of sandy clay loam. Chemical bindings occurred among
the soil minerals and emulsified asphalt. Plasticity and shear strength of soil
increased in line with the increase of emulsified asphalt concentration as shown in
Figure 2.6.
Figure 2.6. Correlation between Cohesion and Emulsified Asphalt
Source: Bunga's (2011)
10
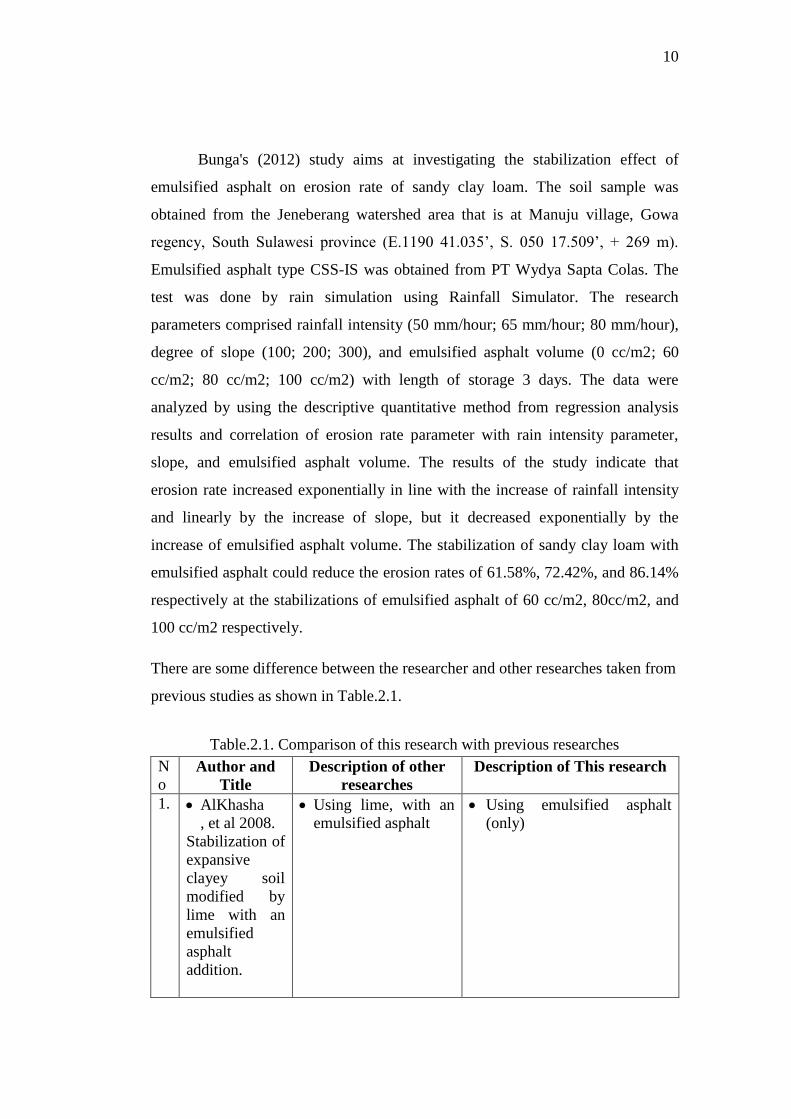
Bunga's (2012) study aims at investigating the stabilization effect of
emulsified asphalt on erosion rate of sandy clay loam. The soil sample was
obtained from the Jeneberang watershed area that is at Manuju village, Gowa
regency, South Sulawesi province (E.1190 41.035’, S. 050 17.509’, + 269 m).
Emulsified asphalt type CSS-IS was obtained from PT Wydya Sapta Colas. The
test was done by rain simulation using Rainfall Simulator. The research
parameters comprised rainfall intensity (50 mm/hour; 65 mm/hour; 80 mm/hour),
degree of slope (100; 200; 300), and emulsified asphalt volume (0 cc/m2; 60
cc/m2; 80 cc/m2; 100 cc/m2) with length of storage 3 days. The data were
analyzed by using the descriptive quantitative method from regression analysis
results and correlation of erosion rate parameter with rain intensity parameter,
slope, and emulsified asphalt volume. The results of the study indicate that
erosion rate increased exponentially in line with the increase of rainfall intensity
and linearly by the increase of slope, but it decreased exponentially by the
increase of emulsified asphalt volume. The stabilization of sandy clay loam with
emulsified asphalt could reduce the erosion rates of 61.58%, 72.42%, and 86.14%
respectively at the stabilizations of emulsified asphalt of 60 cc/m2, 80cc/m2, and
100 cc/m2 respectively.
There are some difference between the researcher and other researches taken from
previous studies as shown in Table.2.1.
Table.2.1. Comparison of this research with previous researches
N
o Author and
Title
Description of other
researches
Description of This research
1. AlKhasha
, et al 2008.
Stabilization of
expansive
clayey soil
modified by
lime with an
emulsified
asphalt
addition.
Using lime, with an
emulsified asphalt
Using emulsified asphalt
(only)

11
2. Bunga,
Elifas. 2011.
Stabilization
of Sandy
Clay Loam
With
Emulsified
Asphalt.
Stabilization of sandy
clay loam with
emulsified asphalt
Using emulsified
asphalt type CSS-1S
Soil (sand clay loam)
Emulsified asphalt
concentrations (1.5%,
3.0% and 4.5%).
Tests were done by
direction shear tests
Sub-grade improvement
using emulsified asphalt for
pavement design
Using emulsified asphalt
type CSS-1H
Soil (clay mud)
Emulsified asphalt
concentrations (0%, 2%,
4%, 6% and 8%).
Tests were done by CBR
and UCS tests
3. Bunga,
Elifas. 2012.
Stabilization
Effect of
Emulsified
Asphalt On
Erosion Rate
of Sandy
Clay Loam
Stabilization effect of
emulsified asphalt on
erosion rate
Using emulsified
asphalt type CSS-IS
Soil (sand clay loam)
Emulsified asphalt
volume were (0
cc/m2; 60 cc/m2; 80
cc/m2; 100 cc/m2)
The test was done by
using Rainfall
Simulator.
Length of storage of
the samples was 3
days.
Sub-grade improvement
using emulsified asphalt for
pavement design
Using emulsified asphalt
type CSS-1H
Soil (clay mud)
Emulsified asphalt
concentrations were 0%,
2%, 4%, 6% and 8%
The tests were done by
UCS test and CBR test
The lengths of storage of the
samples were 3 days and 7
days.
From this research, the researcher focuses and observes sub-grade improvement
using emulsified asphalt for pavement design. Therefore, the researcher uses
emulsified asphalt for treatment the sub-grade and find the reaction and effect of
sub-grade for pavement design.
12
2.2. Basic Theory
2.2.1 Stabilization of Soil
The purpose of sub-grade stabilization is to enhance the strength of the
sub-grade. This increased strength is then taken into account in the pavement
design process. Stabilization requires more thorough design methodology during
construction than modification. The methods of sub-grade modification or
stabilization include physical processes such as soil densification, blends with
granular material, use of reinforcements, undercutting and replacement, and
chemical processes such as mixing with cement, fly ash, lime, lime by products,
and blends of any one of these materials. Soil properties such as strength,
compressibility, hydraulic conductivity, workability, swelling potential, and
volume change tendencies may be altered by various soil modification or
stabilization methods. Sub-grade modification shall be considered for all the
reconstruction and new alignment projects. When used, modification or
stabilization shall be required for the full roadbed width including shoulders or
curbs. Some steps for soil analyzing in soil stabilization research are as follows:
1. Determination of soil index properties (Atterberg Limits)
a. Particle size distribution by sieve analysis
The results from sieve analysis of the soil when plotted on a semi-log
graph with particle diameter or the sieve size as the abscissa with
logarithmic axis and the percentage passing as the ordinate give a clear
idea about the particle size distribution. From the help of this curve, D10
and D60 are determined. This D10 is the diameter of the soil below which
10% of the soil particles lie. The ratio of D10 and D60 gives the
uniformity coefficient (Cu) which in turn is a measure of the particle size
range.
13
b. Specific gravity of the soil
The specific gravity of soil is the ratio between the weight of the soil
solids and weight of equal volume of water. It is measured by the help of a
volumetric flask in a very simple experimental setup where the volume of
the soil is found out and its weight is divided by the weight of equal
volume of water.
Gs (2.1)
Where
W1=Empty weight of pycnometer
W2=Weight of pycnometer + oven dry soil
W3=Weight of pycnometer + oven dry soil + water
W4=Weight of pycnometer + water full
c. Liquid limit
The Casagrande tool cuts a groove of size 2mm wide at the bottom and 11
mm wide at the top and 8 mm high. The number of blows used for the two
soil samples to come in contact is noted down. Graph is plotted taking
number of blows on a logarithmic scale on the abscissa and water content
on the ordinate. Liquid limit corresponds to 25 blows from the graph.
d. Plastic limit
This is determined by rolling out soil till its diameter reaches
approximately 3 mm and measuring water content for the soil which
crumbles on reaching this diameter.
14
e. Plasticity index
The plasticity index (PI) is a measure of the plasticity of a soil. The
plasticity index is the size of the range of water contents where the soil
exhibits plastic properties. The PI is the difference between the liquid limit
and the plastic limit. Plasticity index (PI) was also calculated with the help
of liquid limit and plastic limit;
PI = LL – PL (2.2)
Where:
PI= Plasticity Index
LL= Liquid limit
PL= Plastic limit
Soils with a high PI tend to be clay, those with a lower PI tend to be silt,
and those with a PI of 0 (non-plastic) tend to have little or no silt or clay.
PI and their meanings are the following: (0-3) is non-plastic, (3-15) is
slightly plastic, (15-30) is medium plastic,
and (…>30) is highly plastic.
The plasticity index is defined as "the numerical difference between the
liquid limit and the plastic limit; the range of moisture content within
which the soil remains plastic". The "plastic limit" is, in turn, defined as
the moisture content at which a soil changes from semisolid to plastic, and
the "liquid limit" as the moisture content at which the soil passes from a
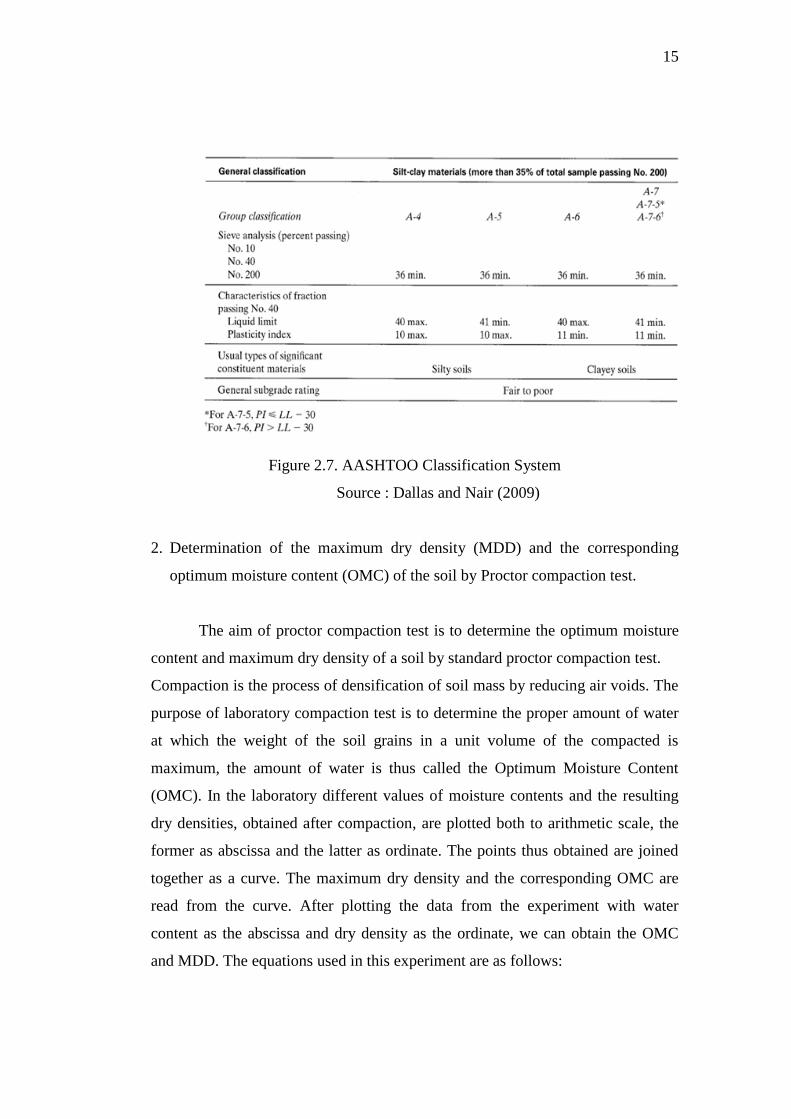
plastic to a liquid state. The AASHTO system uses both grain-size
distribution and Atterberg limits data to assign a group classification and
a group index to the soil as shown in the Figure 2.2.
15
Figure 2.7. AASHTOO Classification System
Source : Dallas and Nair (2009)
2. Determination of the maximum dry density (MDD) and the corresponding
optimum moisture content (OMC) of the soil by Proctor compaction test.
The aim of proctor compaction test is to determine the optimum moisture
content and maximum dry density of a soil by standard proctor compaction test.
Compaction is the process of densification of soil mass by reducing air voids. The
purpose of laboratory compaction test is to determine the proper amount of water
at which the weight of the soil grains in a unit volume of the compacted is
maximum, the amount of water is thus called the Optimum Moisture Content
(OMC). In the laboratory different values of moisture contents and the resulting
dry densities, obtained after compaction, are plotted both to arithmetic scale, the
former as abscissa and the latter as ordinate. The points thus obtained are joined
together as a curve. The maximum dry density and the corresponding OMC are
read from the curve. After plotting the data from the experiment with water
content as the abscissa and dry density as the ordinate, we can obtain the OMC
and MDD. The equations used in this experiment are as follows:

16
(2.3)
(2.4)
(2.5)
3. Determination of the shear strength by:
a. California Bearing Ratio (CBR).
The California bearing ratio (CBR) is a penetration test for evaluation of
the mechanical strength of road sub grades and base courses. It is
developed by the California Department of Transportation. The test is
performed by measuring the pressure required to penetrate a soil sample
with a plunger of standard area. The measured pressure is then divided by
the pressure required to achieve an equal penetration on a standard crushed
rock material.
The CBR rating is developed for measuring the load-bearing capacity of
soils used for building roads. The CBR can also be used for measuring the
load-bearing capacity of unimproved airstrips or for soils under paved
airstrips. The harder surface, the higher CBR rating is. A CBR of 3 equates
to tilled farmland, a CBR of 4.75 equates to turf or moist clay, while moist
sand may have a CBR of 10. High quality crushed rock has a CBR over
80. The standard material for this test is crushed California limestone
which has a value of 100.
(2.6)
17
Where =
p = measured pressure for site soils [N/mm²]
ps = pressure to achieve equal penetration on standard soil
[N/mm²]
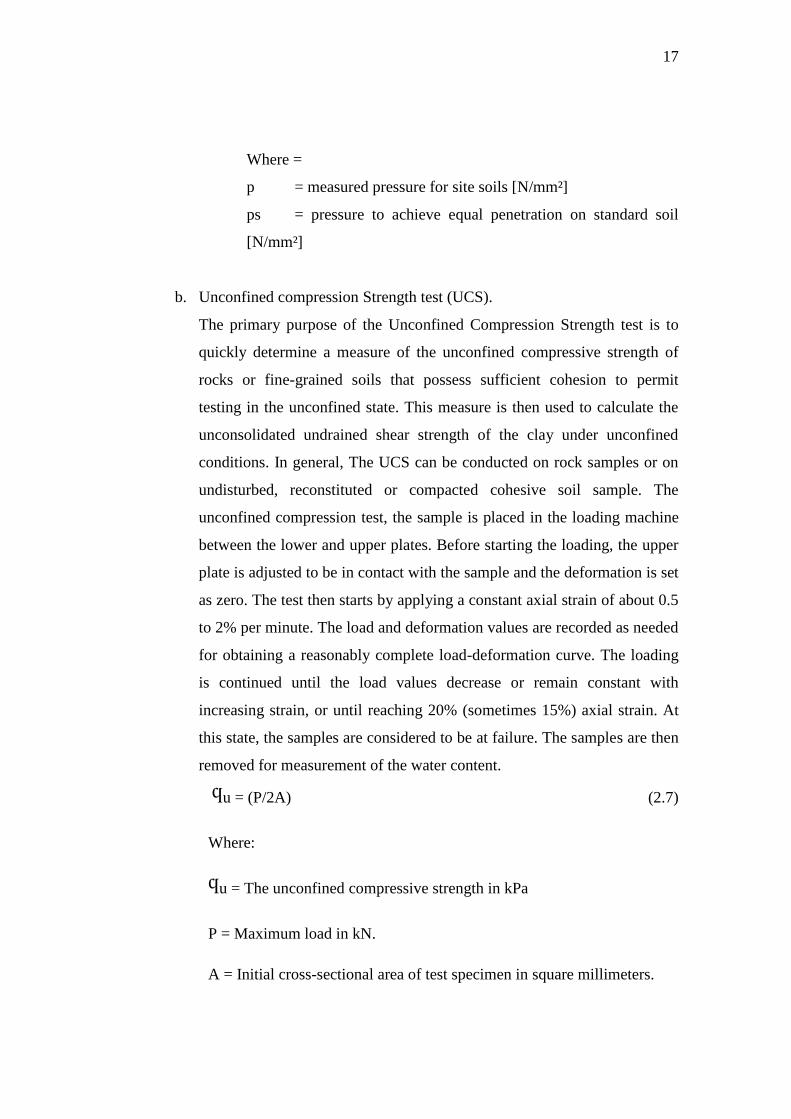
b. Unconfined compression Strength test (UCS).
The primary purpose of the Unconfined Compression Strength test is to
quickly determine a measure of the unconfined compressive strength of
rocks or fine-grained soils that possess sufficient cohesion to permit
testing in the unconfined state. This measure is then used to calculate the
unconsolidated undrained shear strength of the clay under unconfined
conditions. In general, The UCS can be conducted on rock samples or on
undisturbed, reconstituted or compacted cohesive soil sample. The
unconfined compression test, the sample is placed in the loading machine
between the lower and upper plates. Before starting the loading, the upper
plate is adjusted to be in contact with the sample and the deformation is set
as zero. The test then starts by applying a constant axial strain of about 0.5
to 2% per minute. The load and deformation values are recorded as needed
for obtaining a reasonably complete load-deformation curve. The loading
is continued until the load values decrease or remain constant with
increasing strain, or until reaching 20% (sometimes 15%) axial strain. At
this state, the samples are considered to be at failure. The samples are then
removed for measurement of the water content.
ϥu = (P/2A) (2.7)
Where:
ϥu = The unconfined compressive strength in kPa
P = Maximum load in kN.
A = Initial cross-sectional area of test specimen in square millimeters.

18
2.2.2 Emulsified Asphalts
Dallas and Nair (2009) state that emulsified asphalts are used in soil
stabilization because the nature of asphalt stabilization is so mechanistically
different from chemical stabilization. The mechanism of stabilization for non-
traditional stabilizers varies greatly among the stabilizers. Asphalt may or may not
be grouped as a traditional stabilizer depending on perspective. Asphalt is not a
“chemical” stabilizer in the sense that it does not react chemically with the soil to
produce a product that alters surface chemistry of the soil particles or that binds
particles together.
Emulsified asphalt is an intimate mixture of water, asphalt and
emulsifying agent. It has an advantage over hot asphalt in that it can be used with
cold or hot aggregates under their dry, damp or wet conditions. Its use with wet
aggregates is an advantage for this material over other types of liquid asphalt (i.e.
Cutback). In addition, emulsified asphalt does not need any heat for its application
(Hopson and Pohl in Al-Kashab and Al-Hayalee, 2008).
Based on the electrical charge that it contains, asphalt emulsion can be
distinguished as:
1. Cationic, also called acid emulsion asphalt, an asphalt emulsion positively
charged electric current.
2. Anionic, also called alkaline asphalt emulsion, bitumen emulsion is
charged negative.
3. Nonionic, an asphalt emulsion that does not ionize, meaning that it does
not conduct electricity.
An asphalt emulsion which does not ionize means that it does not conduct
electricity. In addition to grouping according to what is mentioned above asphalt
can also be divided according to the asphalt emulsion viscosity. The geological
distribution of emulsified asphalt is related to the levels of bituminous or its
contents due to water content and water content affect the viscosity.
- (RS) Rapid Setting asphalt emulsifier contains a small quantity so that the
bonding occurs quickly.
19
- (MS) Medium setting
- (SS) Slow Setting, type of asphalt emulsion slowest to evaporate.
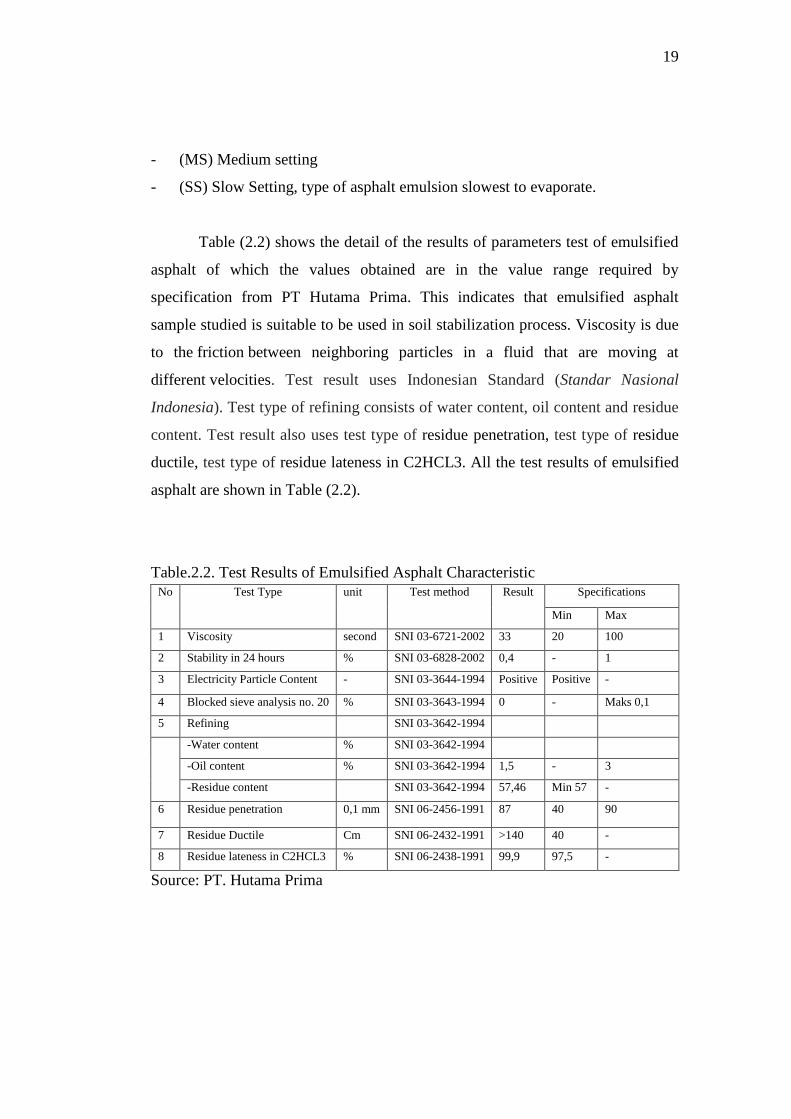
Table (2.2) shows the detail of the results of parameters test of emulsified
asphalt of which the values obtained are in the value range required by
specification from PT Hutama Prima. This indicates that emulsified asphalt
sample studied is suitable to be used in soil stabilization process. Viscosity is due
to the friction between neighboring particles in a fluid that are moving at
different velocities. Test result uses Indonesian Standard (Standar Nasional
Indonesia). Test type of refining consists of water content, oil content and residue
content. Test result also uses test type of residue penetration, test type of residue
ductile, test type of residue lateness in C2HCL3. All the test results of emulsified
asphalt are shown in Table (2.2).
Table.2.2. Test Results of Emulsified Asphalt Characteristic
No Test Type unit Test method Result Specifications
Min Max
1 Viscosity second SNI 03-6721-2002 33 20 100
2 Stability in 24 hours % SNI 03-6828-2002 0,4 - 1
3 Electricity Particle Content - SNI 03-3644-1994 Positive Positive -
4 Blocked sieve analysis no. 20 % SNI 03-3643-1994 0 - Maks 0,1
5 Refining SNI 03-3642-1994
-Water content % SNI 03-3642-1994
-Oil content % SNI 03-3642-1994 1,5 - 3
-Residue content SNI 03-3642-1994 57,46 Min 57 -
6 Residue penetration 0,1 mm SNI 06-2456-1991 87 40 90
7 Residue Ductile Cm SNI 06-2432-1991 >140 40 -
8 Residue lateness in C2HCL3 % SNI 06-2438-1991 99,9 97,5 -
Source: PT. Hutama Prima
20
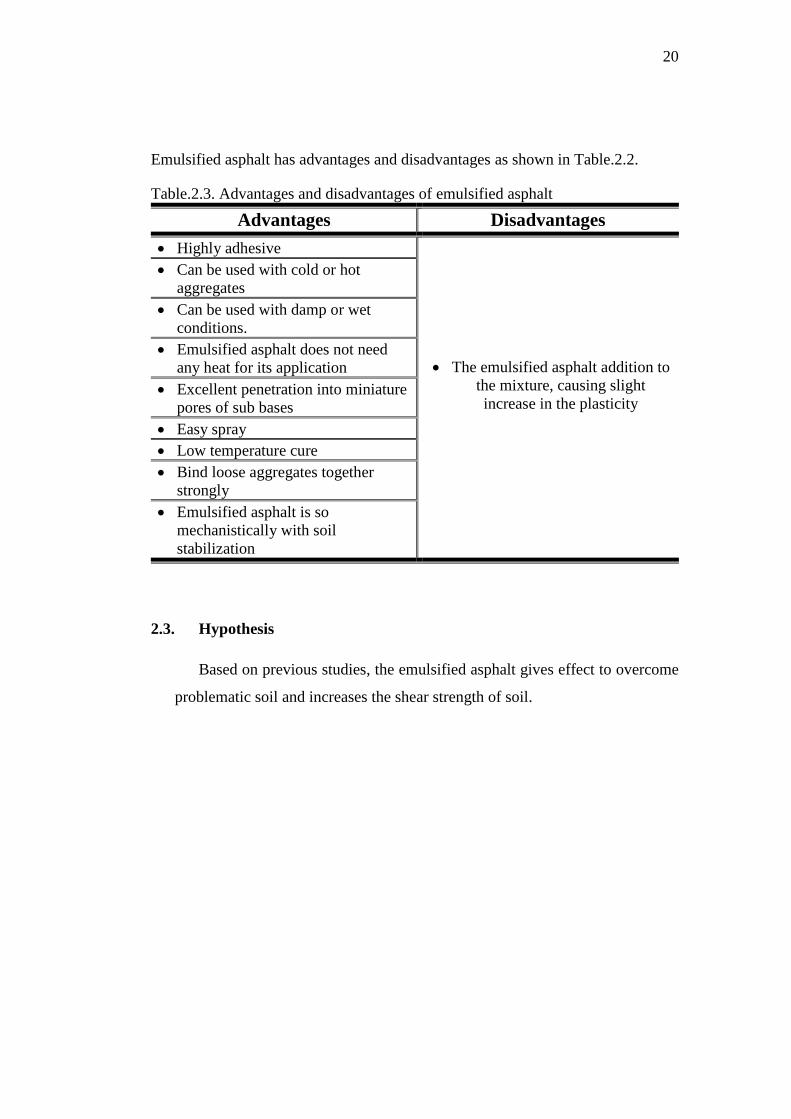
Emulsified asphalt has advantages and disadvantages as shown in Table.2.2.
Table.2.3. Advantages and disadvantages of emulsified asphalt
Advantages Disadvantages
Highly adhesive
The emulsified asphalt addition to
the mixture, causing slight
increase in the plasticity
Can be used with cold or hot
aggregates
Can be used with damp or wet
conditions.
Emulsified asphalt does not need
any heat for its application
Excellent penetration into miniature
pores of sub bases
Easy spray
Low temperature cure
Bind loose aggregates together
strongly
Emulsified asphalt is so
mechanistically with soil
stabilization
2.3. Hypothesis
Based on previous studies, the emulsified asphalt gives effect to overcome
problematic soil and increases the shear strength of soil.
21
CHAPTER III
RESEARCH METHODOLOGY
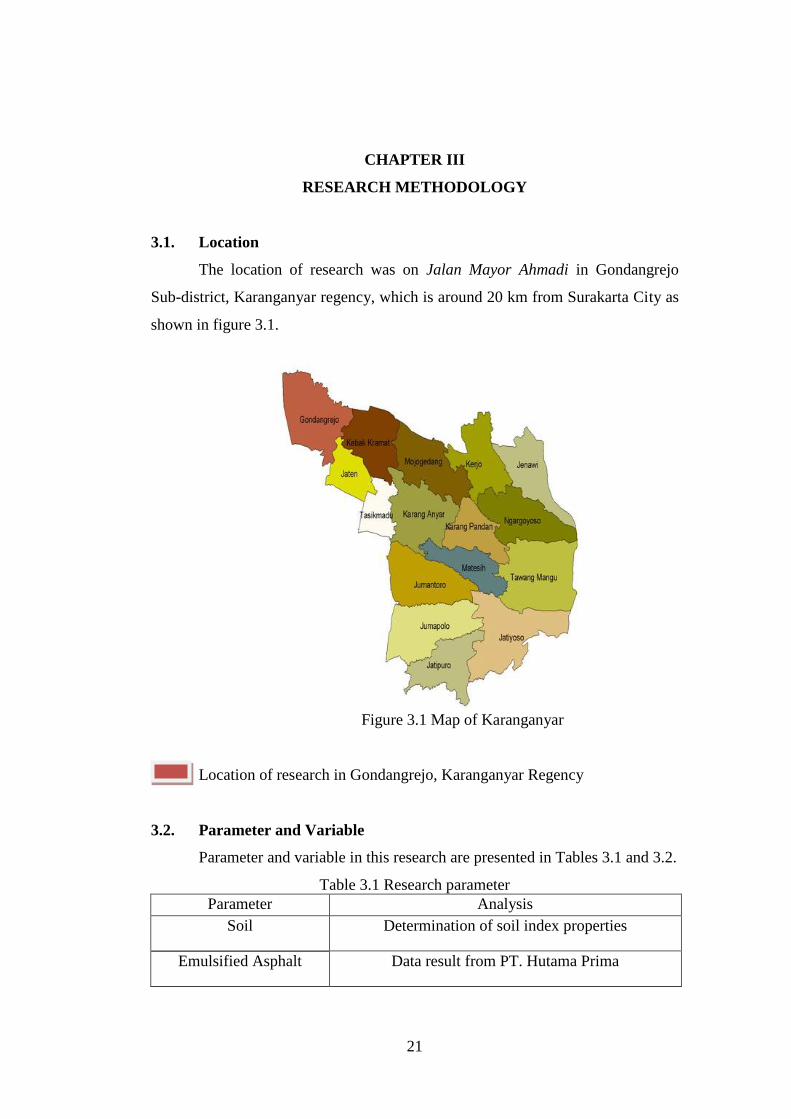
3.1. Location
The location of research was on Jalan Mayor Ahmadi in Gondangrejo
Sub-district, Karanganyar regency, which is around 20 km from Surakarta City as
shown in figure 3.1.
Figure 3.1 Map of Karanganyar
Location of research in Gondangrejo, Karanganyar Regency
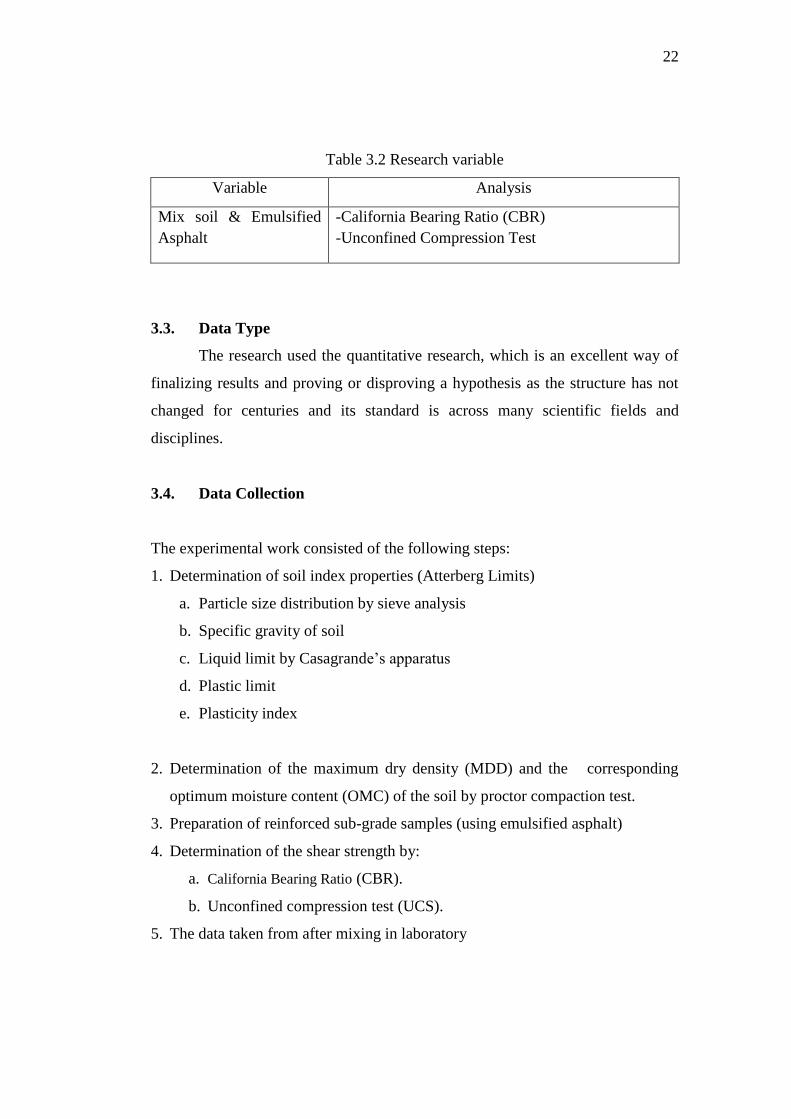
3.2. Parameter and Variable
Parameter and variable in this research are presented in Tables 3.1 and 3.2.
Table 3.1 Research parameter
Parameter Analysis
Soil Determination of soil index properties
Emulsified Asphalt Data result from PT. Hutama Prima
22
Table 3.2 Research variable
Variable Analysis
Mix soil & Emulsified
Asphalt
-California Bearing Ratio (CBR)
-Unconfined Compression Test
3.3. Data Type
The research used the quantitative research, which is an excellent way of
finalizing results and proving or disproving a hypothesis as the structure has not
changed for centuries and its standard is across many scientific fields and
disciplines.
3.4. Data Collection
The experimental work consisted of the following steps:
1. Determination of soil index properties (Atterberg Limits)
a. Particle size distribution by sieve analysis
b. Specific gravity of soil
c. Liquid limit by Casagrande’s apparatus
d. Plastic limit
e. Plasticity index
2. Determination of the maximum dry density (MDD) and the corresponding
optimum moisture content (OMC) of the soil by proctor compaction test.
3. Preparation of reinforced sub-grade samples (using emulsified asphalt)
4. Determination of the shear strength by:
a. California Bearing Ratio (CBR).
b. Unconfined compression test (UCS).
5. The data taken from after mixing in laboratory
23
3.5. Validation and Clarification
The soil was examined in the laboratory to get real of valid data. In
previous study, Bunga's (2011) used the maximum contents of emulsified asphalt
until 4.5%. Due to the limited the time, in this research the researcher mixed the
soil and the emulsified asphalt with the contents of emulsified asphalt of 0%, 2%,
4%, 6% and 8%.
The materials for research were:
1. Soil: taken from Gondangrejo, Karanganyar Regency.
2. Reinforcement: Emulsified Asphalt.
3.6. Analysis
The experimental work consisted of some analyses with the following steps:
3.6.1 Physical Properties
1. Determination of soil index properties (Atterberg Limits)
a. Particle size distribution by sieve analysis.
b. Specific gravity of soil.
c. Liquid limit by Casagrande’s apparatus.
d. Plastic limit.
e. Plasticity index.
2. Determination of the maximum dry density (MDD) and the corresponding
optimum moisture content (OMC) of the soil by Standard Proctor Compaction
test.
3.6.2 The Effect of Mixing Emulsified Asphalt
1. Preparation of reinforced sub-grade samples (using emulsified asphalt).
2. Determination of the shear strength by:
a. California Bearing Ratio (CBR).
b. Unconfined compression Strength (UCS).

24
3.7 Flow Chart of Research
Figure 3.2 Flow-Chart of Research Process
Preparation of test
Preparation of soil
taken from Gondangrejo
Determination of soil index properties (Atterberg Limits)
Particle size distribution by sieve analysis
Specific Gravity of Soil
Liquid limit
Plastic limit
Plasticity index
Preparation of emulsified asphalt
Preparation of
equipments
Determination of the maximum dry density (MDD) and optimum moisture content (OMC)
Preparation of reinforced soil sample percentage of the mixture between emulsified
asphalt and soil (0%, 2%, 4% , 6% and 8%) – waited in 3 days and 7 days.
Determination of the shear strength
UCS CBR
Dada analysis Dada analysis
Analysis
Conclusion

25
CHAPTER IV
RESULT AND DISCUSSION
4.1 Introduction
The physical properties of problematic soil of Gondangrejo were
investigated in laboratory. The study examined the characteristic of soil and
solves the problems. Emulsified asphalt was as a treatment agent for problems in
the soil.. It was carried out at Soil Mechanic Laboratory, Civil Engineering
Department, Sebelas Maret University. In this study, the proposed hypothesis was
that emulsified asphalt can improve the subgrade for pavement design. In
addition, the research also investigated the effect of soil asphalt mixture on
rehabilitation. This section describes the data obtained through some steps.
4.2 Materials Test
4.2.1. Soil and Emulsified Asphalt
a. Soil
Soils are usually classified into various types. The study investigated the
physical properties of soil in Gondangrejo Karanganyar, the reaction and
effect of soil mix on emulsified asphalt, and the best composition of soil
mixed with emulsified asphalt to overcome clay soil. The soil was taken
from the roadside Jalan Mayor Ahmadi Gondangrejo around 7.5 Km in
Karanganyar. The soil was taken from the depth around 10 cm – 30 cm
from the surface as shown in Figure 4.1.

26
Figure 4.1. Picture of soil in Gondangrejo
b. Emulsified Asphalt
Emulsified asphalts are used in soil stabilization because the nature of
asphalt stabilization is so mechanistically different from chemical
stabilization. The detailed results of seven-parameter test of emulsified
asphalt of which the values obtained are in the value range required by
specification from PT Hutama Prima. The kind of emulsified asphalt is
CSS-1H.
Figure 4.2.Emulsified asphalts manufactured by PT Hutama Prima
27
4.3 Result and discussion
4.3.1 Determination of soil index properties
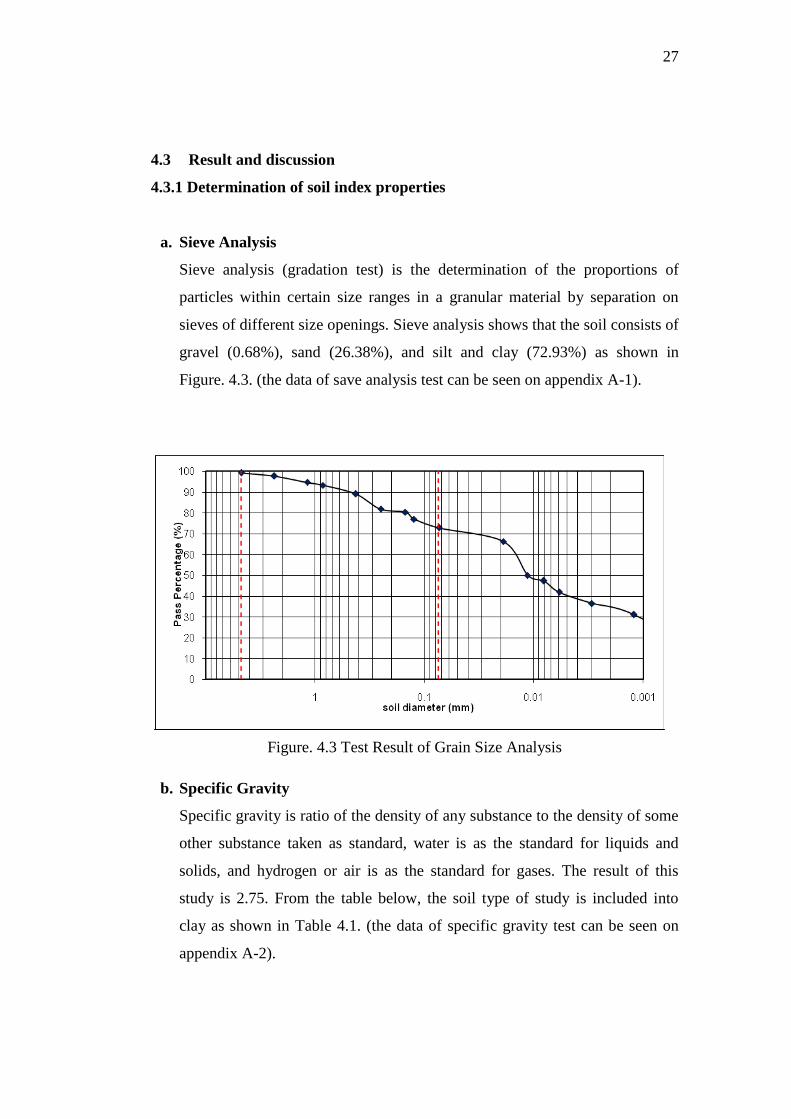
a. Sieve Analysis
Sieve analysis (gradation test) is the determination of the proportions of
particles within certain size ranges in a granular material by separation on
sieves of different size openings. Sieve analysis shows that the soil consists of
gravel (0.68%), sand (26.38%), and silt and clay (72.93%) as shown in
Figure. 4.3. (the data of save analysis test can be seen on appendix A-1).
Figure. 4.3 Test Result of Grain Size Analysis
b. Specific Gravity
Specific gravity is ratio of the density of any substance to the density of some
other substance taken as standard, water is as the standard for liquids and
solids, and hydrogen or air is as the standard for gases. The result of this
study is 2.75. From the table below, the soil type of study is included into
clay as shown in Table 4.1. (the data of specific gravity test can be seen on
appendix A-2).

28
Table 4.1.Range of specific gravity for different soil types (from Sen and
Kasyhap, 2012).
SAND 2.63 – 2.67
SILT SAND 2.67 – 2.70
SILTS 2.65 – 2.70
CLAY AND SILTY CLAY 2.67 – 2.80
CLAY 2.70 – 2.80
ORGANIC SOIL 1 + < 2.0
c. Liquid Limit
Test result of liquid limit is 42.48 % (the data of liquid limit test can be seen
on appendix A-3).
Figure 4.4. Charts of Liquid Limit
d. Plastic Limit Test
Test result of plastic limit is 25.64%.
e. Plasticity index
liquid limit – plastic limit = Plasticity index. 42.48 – 25.64 = 16.83 %. (the
data of plastic limit test can be seen on appendix A-5).
29
Table 4.2 Results of Physical and Mechanic Characteristics of Original Soil
No Name of test Result
1 Sieve Analysis Gravel (0.68%), Sand (26.38%), Silt and Clay
(72.93%).
2 Specificgravity 2.75
3 Liquid Limit 42.48 %
4 Plastic Limit 25.64 %
5 Plasticity index 16.83 %
The objective of the Atterberg limit test is to obtain basic index
information about the soil used to estimate strength and settlement characteristics.
It is the primary form of classification for cohesive soils. Fine-grained soil is
tested to determine the liquid and plastic limits, at which moisture contents define
boundaries between material consistency states. These standardized tests produce
comparable numbers used for soil identification, classification and correlation to
strength. The result is liquid limit (42.48%), Plastic limit (25.64%) and Plasticity
index (16.83%). Based on AASHTO classification system this soil belongs to
group A-7-6 (clay mud). The AASHTO system uses both grain-size distribution
and Atterberg limit data to assign a group classification and a group index to the
soil. The group classification ranges from A-1 (best soils) to A-8 (worst soils).
Group index values near 0 indicate good soils, while the values of 20 or more
indicate very poor soils. However, a soil that may be "good" for use as a highway
subgrade might be "very poor" for other purposes, and vice versa.
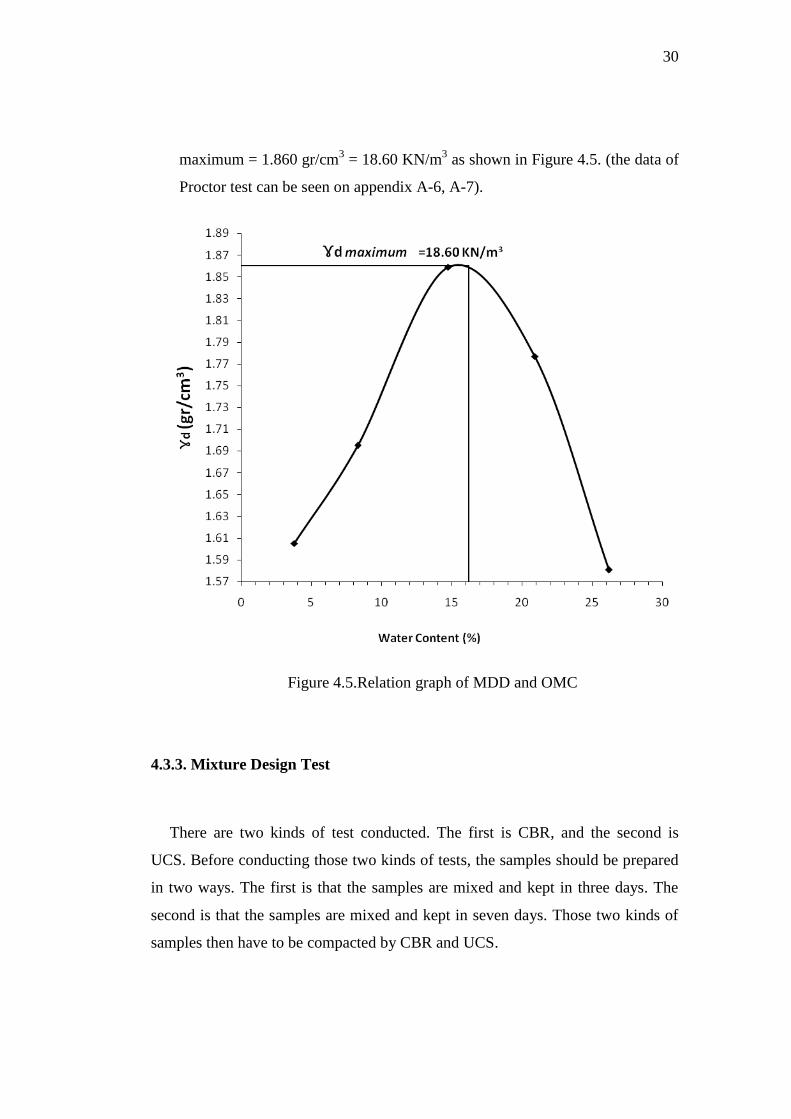
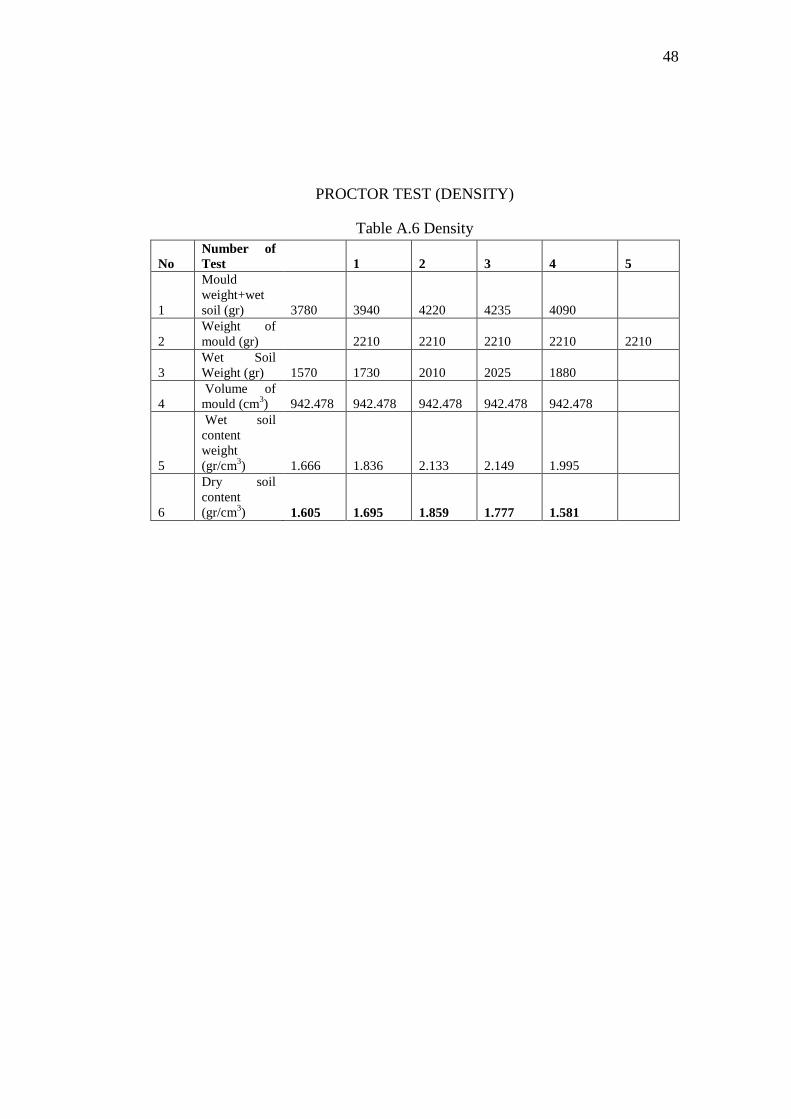
4.3.2 Proctor test
The Proctor test is a test that is used in geotechnical engineering to investigate
the maximum density and optimum moisture content that can be practically
achieved for a soil or similar substance. To find MDD and OMC, the
researcher uses proctor test. The test finds w optimum = 16.20 % and ɤd
30
maximum = 1.860 gr/cm3 = 18.60 KN/m
3 as shown in Figure 4.5. (the data of
Proctor test can be seen on appendix A-6, A-7).
Figure 4.5.Relation graph of MDD and OMC
4.3.3. Mixture Design Test
There are two kinds of test conducted. The first is CBR, and the second is
UCS. Before conducting those two kinds of tests, the samples should be prepared
in two ways. The first is that the samples are mixed and kept in three days. The
second is that the samples are mixed and kept in seven days. Those two kinds of
samples then have to be compacted by CBR and UCS.
31
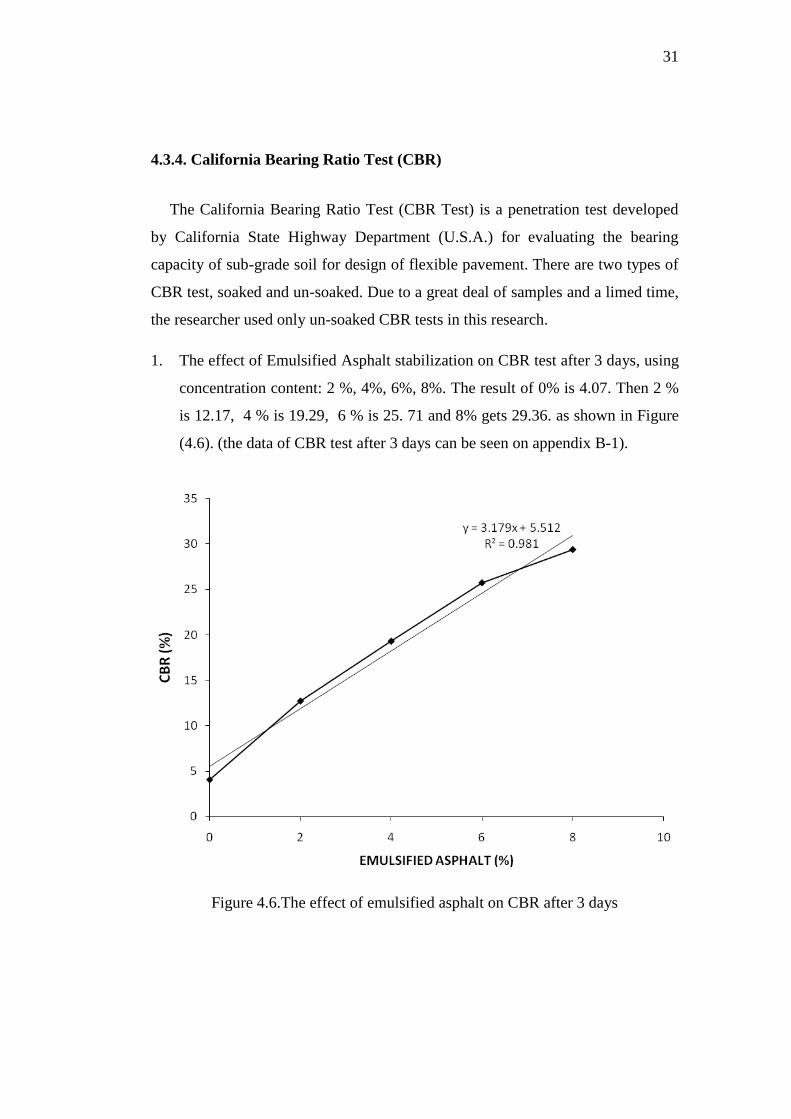
4.3.4. California Bearing Ratio Test (CBR)
The California Bearing Ratio Test (CBR Test) is a penetration test developed
by California State Highway Department (U.S.A.) for evaluating the bearing
capacity of sub-grade soil for design of flexible pavement. There are two types of
CBR test, soaked and un-soaked. Due to a great deal of samples and a limed time,
the researcher used only un-soaked CBR tests in this research.
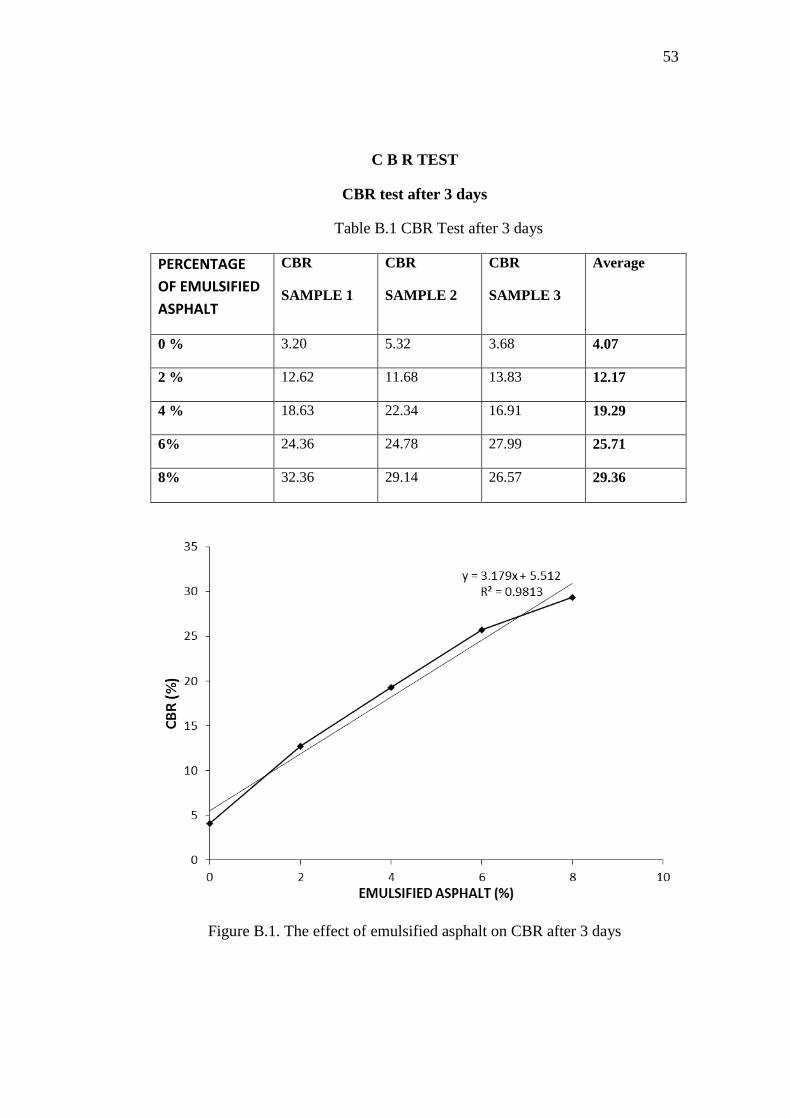
1. The effect of Emulsified Asphalt stabilization on CBR test after 3 days, using
concentration content: 2 %, 4%, 6%, 8%. The result of 0% is 4.07. Then 2 %
is 12.17, 4 % is 19.29, 6 % is 25. 71 and 8% gets 29.36. as shown in Figure
(4.6). (the data of CBR test after 3 days can be seen on appendix B-1).
Figure 4.6.The effect of emulsified asphalt on CBR after 3 days

32
2. The effect of Emulsified Asphalt stabilization on CBR test after 7 days, using
concentration: 2 %, 4%, 6%, 8%. The result of 0% gets 4.07, 2 % gets 17.82,
4 % gets 21.05, 6 % gets 26.37, and 8% gets 32.64. as shown in the Figure
4.7. (the data of CBR test after 7 days can be seen on appendix B-2).
Figure 4.7.The effect of emulsified asphalt on CBR after 7 days
CBR test was held in Soil Mechanic Laboratory, Civil Engineering, Sebelas Maret
University.
In three days the value of CBR with concentration of emulsified asphalt 2%
increases to 12.17 toward the value of CBR without stabilization. Likewise in the
stabilization with concentrations of 4%, 6% and 8% the CBR value increases to
19.29, 25.71, and 29.36 respectively toward the value of CBR without
stabilization. The best composition in three days is the concentration of 8% with
the result of 29.36.
33
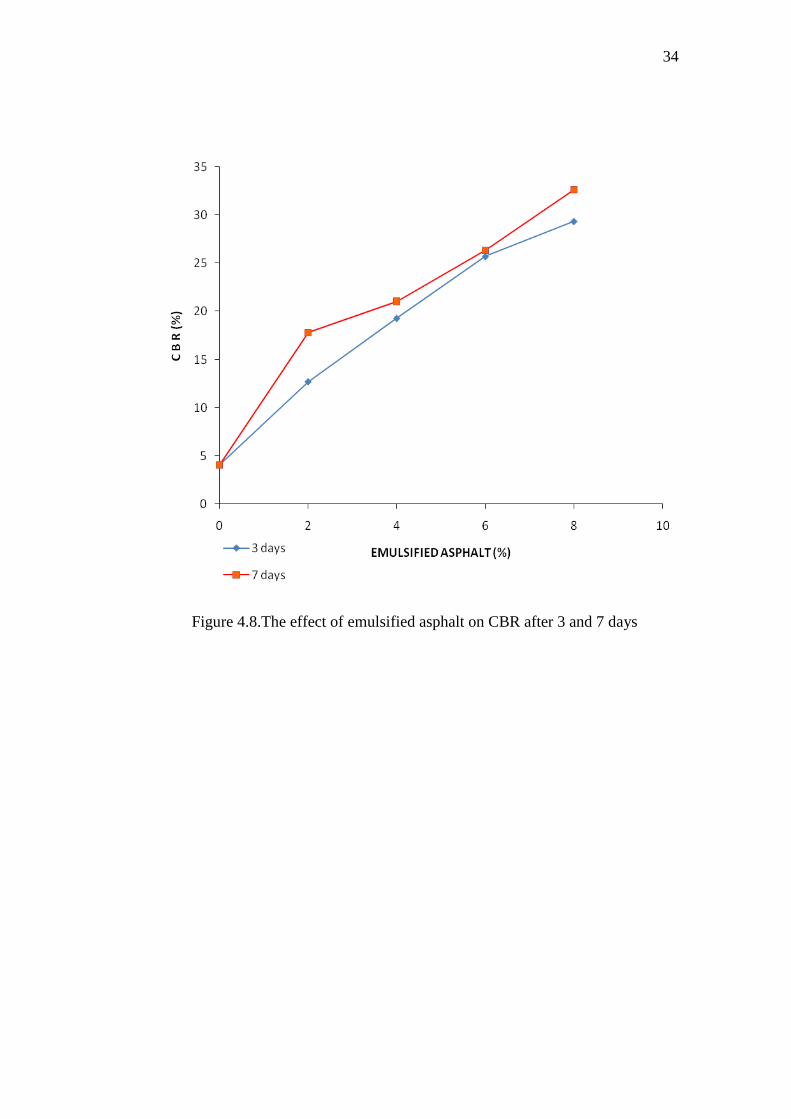
In seven days the value of CBR stabilized with concentration of emulsified
asphalt 2% increases to 17.82 toward the value of CBR without stabilization.
Likewise in the stabilization with concentrations of 4%, 6% and 8% the CBR
value increases to 21.05, 26.37 and 32.64 respectively toward the value of CBR
without stabilization. The best composition in seven days is the concentration of
8% with the result of 32.64.
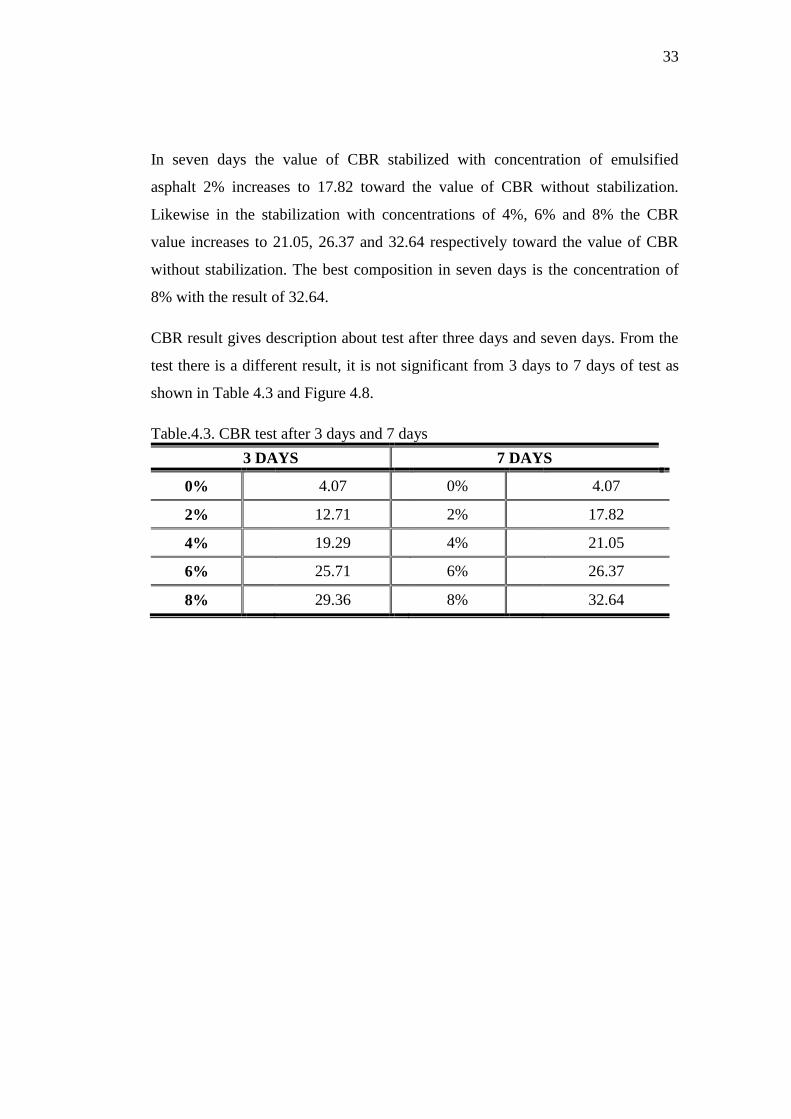
CBR result gives description about test after three days and seven days. From the
test there is a different result, it is not significant from 3 days to 7 days of test as
shown in Table 4.3 and Figure 4.8.
Table.4.3. CBR test after 3 days and 7 days
3 DAYS 7 DAYS
0% 4.07 0% 4.07
2% 12.71 2% 17.82
4% 19.29 4% 21.05
6% 25.71 6% 26.37
8% 29.36 8% 32.64
34
Figure 4.8.The effect of emulsified asphalt on CBR after 3 and 7 days

35
4.3.5. Unconfined Compressive Strength (UCS)
The Unconfined Compression strength test is a laboratory test method that is
used to assess the mechanical properties of rocks and fine-grained soils.
1. The effect of Emulsified Asphalt stabilization on UCS test after 3 days, using
the concentration of 2 %, 4%, 6%, 8%. The result of 0% gets 6.279, 2% gets
9.618, 4% gets 12.047, 6% gets16.293, and 8% gets 17.628 as shown in
Figure 4.8. (the data of UCS test after 3 days can be seen on appendix B-4).
Figure 4.9.The effect of emulsified asphalt on UCS after 3 days

36
2. The effect of Emulsified Asphalt stabilization on UCS test after 7 days, using
the concentrations of 2 %, 4%, 6%, 8%. The result of 0% gets 6.279, 2% gets
8.859, 4% gets12.449, 6% gets16.128, and 8% gets 18.278 as shown in
Figure (4.9). (the data of UCS test after 7 days can be seen on appendix B-5).
Figure 4.10.The effect of emulsified asphalt on UCS after 7 days
UCS test was held in Soil Mechanic Laboratory, Civil Engineering Department,
Sebelas Maret University. Unconfined compression test gives shear strength of
soil. Shear strength is important in all types of geotechnical designs and analyses.
In three days the value of UCS with the concentration of emulsified asphalt of 2%
increases to 9.618. In other concentrations of 4%, 6% and 8% the value of UCS
37
increases to 12.047, 16.293 and 17.628. The best composition in three days is the
concentration of 8% with the result of 17.628.
In seven days the value of UCS with the concentration of emulsified asphalt of
2% increases to 8.859. In the other concentrations of 4%, 6% and 8% the value of
UCS increases to 12.449, 16.128 and 18.278. The best composition in three days
is the concentration of 8% with the result 18.278.
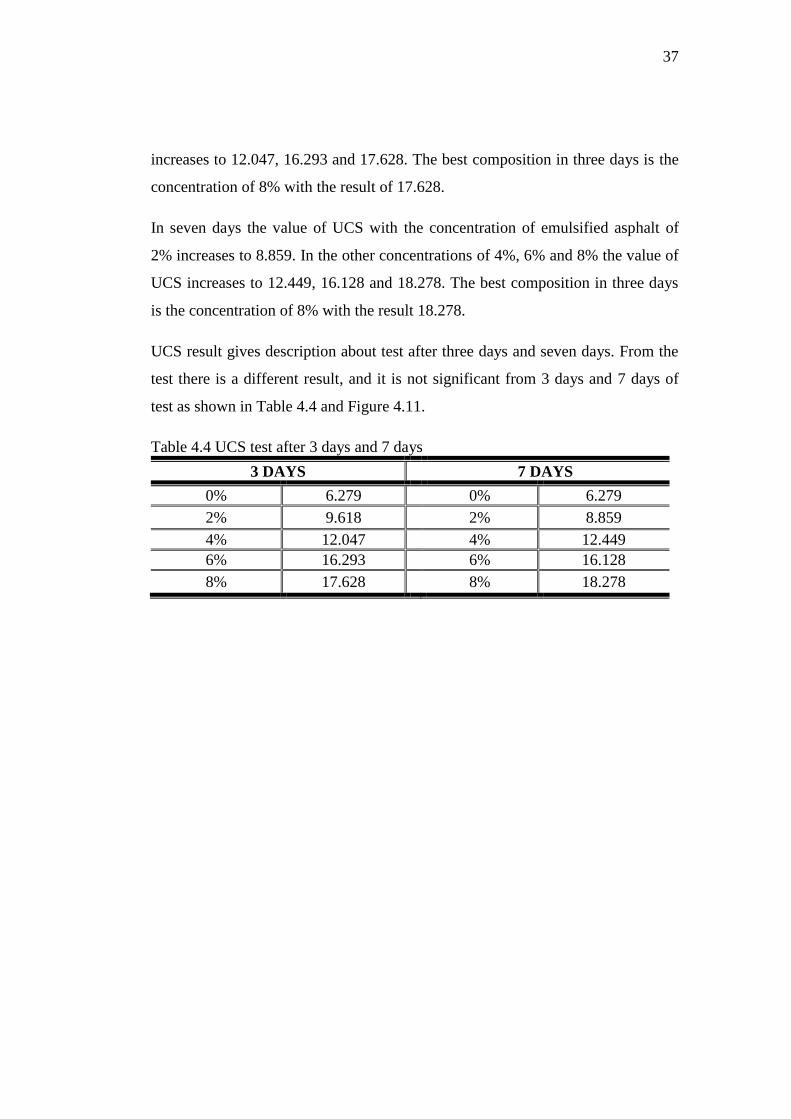
UCS result gives description about test after three days and seven days. From the
test there is a different result, and it is not significant from 3 days and 7 days of
test as shown in Table 4.4 and Figure 4.11.
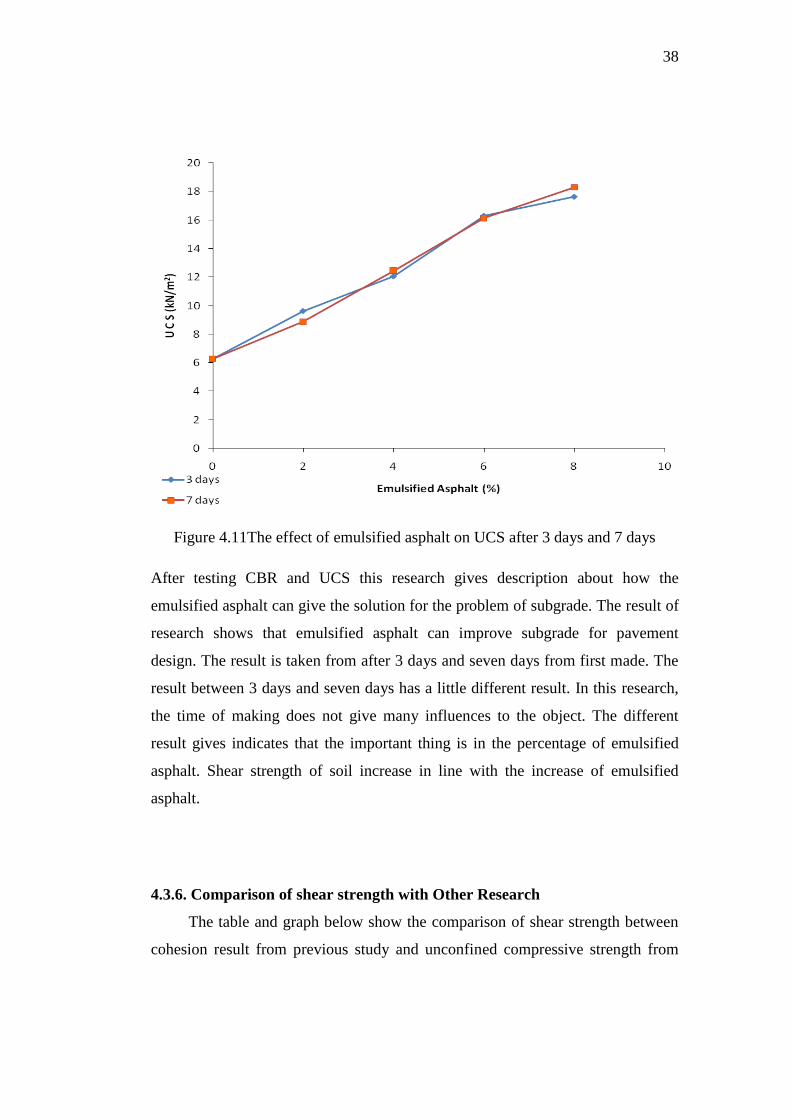
Table 4.4 UCS test after 3 days and 7 days
3 DAYS 7 DAYS
0% 6.279 0% 6.279
2% 9.618 2% 8.859
4% 12.047 4% 12.449
6% 16.293 6% 16.128
8% 17.628 8% 18.278
38
Figure 4.11The effect of emulsified asphalt on UCS after 3 days and 7 days
After testing CBR and UCS this research gives description about how the
emulsified asphalt can give the solution for the problem of subgrade. The result of
research shows that emulsified asphalt can improve subgrade for pavement
design. The result is taken from after 3 days and seven days from first made. The
result between 3 days and seven days has a little different result. In this research,
the time of making does not give many influences to the object. The different
result gives indicates that the important thing is in the percentage of emulsified
asphalt. Shear strength of soil increase in line with the increase of emulsified
asphalt.
4.3.6. Comparison of shear strength with Other Research
The table and graph below show the comparison of shear strength between
cohesion result from previous study and unconfined compressive strength from

39
this research. The comparison shows that the shear strength of soil increases in
line with the increase of emulsified asphalt as shown in Table 4.5 and Figure 4.12.
Table 4.5. The comparison of shear strength results with other research
Emulsified asphalt %
(Bunga's 2011)
Cohesion
(N/cm2)
Emulsified asphalt %
(This research)
UCS
(KN/m2)
0 % 4.286 0% 6.279
1.5% 6.531 2% 9.618
3.0% 8.934 4% 12.047
4.5% 12.121 6% 16.293
8% 17.628
Figure 4.12. Comparison of shear strength results with other research
40
CHAPTER V
CONCLUSION AND SUGGESTION
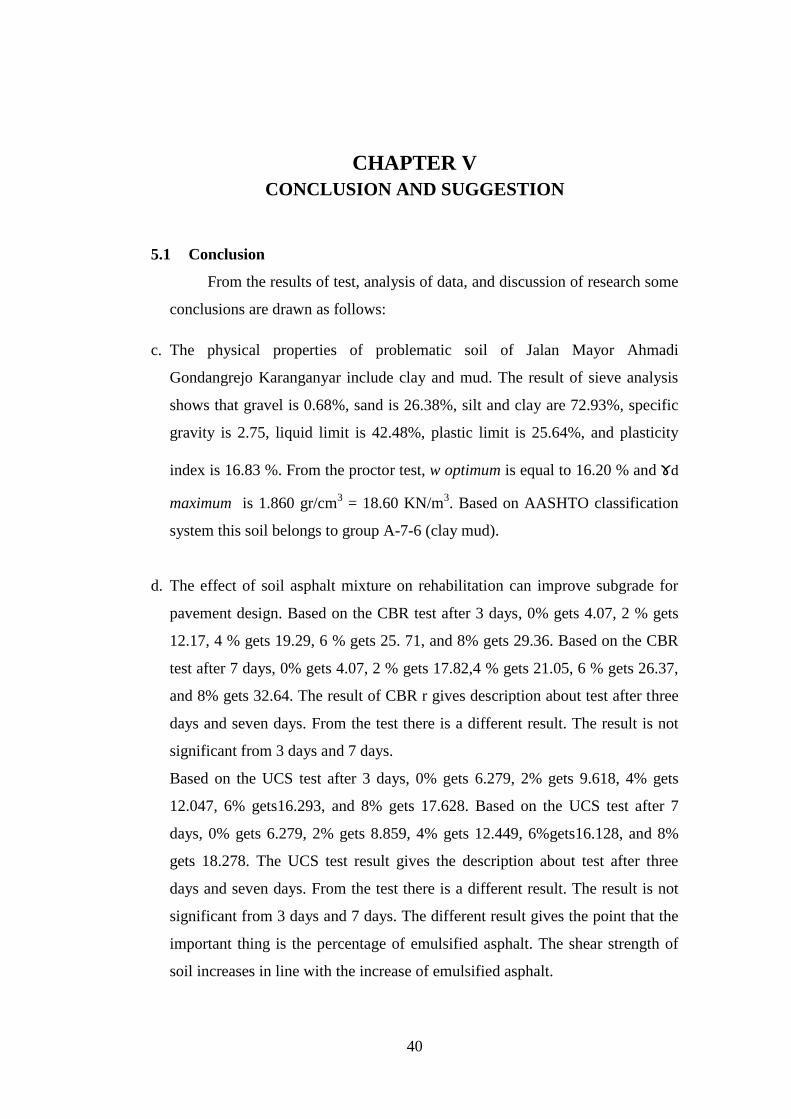
5.1 Conclusion
From the results of test, analysis of data, and discussion of research some
conclusions are drawn as follows:
c. The physical properties of problematic soil of Jalan Mayor Ahmadi
Gondangrejo Karanganyar include clay and mud. The result of sieve analysis
shows that gravel is 0.68%, sand is 26.38%, silt and clay are 72.93%, specific
gravity is 2.75, liquid limit is 42.48%, plastic limit is 25.64%, and plasticity
index is 16.83 %. From the proctor test, w optimum is equal to 16.20 % and ɤd
maximum is 1.860 gr/cm3 = 18.60 KN/m
3. Based on AASHTO classification
system this soil belongs to group A-7-6 (clay mud).
d. The effect of soil asphalt mixture on rehabilitation can improve subgrade for
pavement design. Based on the CBR test after 3 days, 0% gets 4.07, 2 % gets
12.17, 4 % gets 19.29, 6 % gets 25. 71, and 8% gets 29.36. Based on the CBR
test after 7 days, 0% gets 4.07, 2 % gets 17.82,4 % gets 21.05, 6 % gets 26.37,
and 8% gets 32.64. The result of CBR r gives description about test after three
days and seven days. From the test there is a different result. The result is not
significant from 3 days and 7 days.
Based on the UCS test after 3 days, 0% gets 6.279, 2% gets 9.618, 4% gets
12.047, 6% gets16.293, and 8% gets 17.628. Based on the UCS test after 7
days, 0% gets 6.279, 2% gets 8.859, 4% gets 12.449, 6%gets16.128, and 8%
gets 18.278. The UCS test result gives the description about test after three
days and seven days. From the test there is a different result. The result is not
significant from 3 days and 7 days. The different result gives the point that the
important thing is the percentage of emulsified asphalt. The shear strength of
soil increases in line with the increase of emulsified asphalt.

41
5.2 Suggestion
To follow up this study, some corrections are required so that further
research can be better. Therefore, some suggestions are proposed:
1. Other asphalt types that result in better properties for future use should be
used.
2. The percentage of emulsified asphalt use should be more than 8%, as to know
the optimum percentage.
42
REFERENCE
Al-Khashab, Mohammad Nather and Mohammed Thafer Al-Hayalee. 2008.
Stabilization of Expansive Clayey Soil Modified by Lime with an
Emulsified Asphalt Addition. Eng & Technology. Vol 26.No.10.2008.
Bunga, Elifas. 2011. Stabilization of Sandy Clay Loam With Emulsified Asphalt.
International Journal of Civil & Environmental Engineering IJCEE-IJENS
Vol:11 No: 05
Bunga, Elifas. 2012. Stabilization Effect of Emulsified Asphalt On Erosion Rate of
Sandy Clay Loam. International Journal of Civil & Environmental
Engineering IJCEE-IJENS Vol:12 No:02
Dallas N. Little and SyamNair.2009. Recommended Practice for Stabilization of
Subgrade Soils and Base Materials. Texas: Texas Transportation Institute
Texas A&M University College Station. National Cooperative Highway
Research Program.Contractor’s Final Task Report for NCHRP Project 20-
07.Texas Transportation Institute Texas A&M University College Station
:Texas
Rezaei, Mohsen. 2011. Geotechnical Properties of Problematic Soils Emphasis on
Collapsible Cases. International Journal of Geosciences. 105-110, March
2012. Published Online February 2012 (http://www.SciRP.org/journal/ijg)
Page 105.
Riaz , S, N. Aadil* and U. Waseem. 2014. stabilization of subgrade soils using
cement and lime: a case study of kala shah kaku, lahore, pakistan, Pakistan
Journal of Science (Vol. 66 No. 1 March, 2014)
Sabat (2014). Engineering Properties of An Expansive Soil Stabilized With Rice
Husk Ash (RHA) And Lime Sludge. International Journal of Engineering
and Technology ( Vol 5 No 6 Dec 2013-Jan 2014)
Schaefer, V and L Stevens. 2008. Design Guide for Improved Quality of Roadway
Subgrades and Subbases. Center for Transportation Research and
Education Iowa State University.
Sen, Arpan and Rishabh Kashyap. 2012. Soil Stabilzation Using Waste Fiber
Materials.Rourkela: Department of Civil Engineering National
Institute of Technology Rourkela.
Stefan A. Romanoschi and Mustaque Hossain. 2003. Foamed Asphalt Stabilized
Reclaimed Asphalt Pavement: A Promising Technology for Mid-Western
Roads. Manhattan: Department of Civil Engineering Kansas State
University.
43
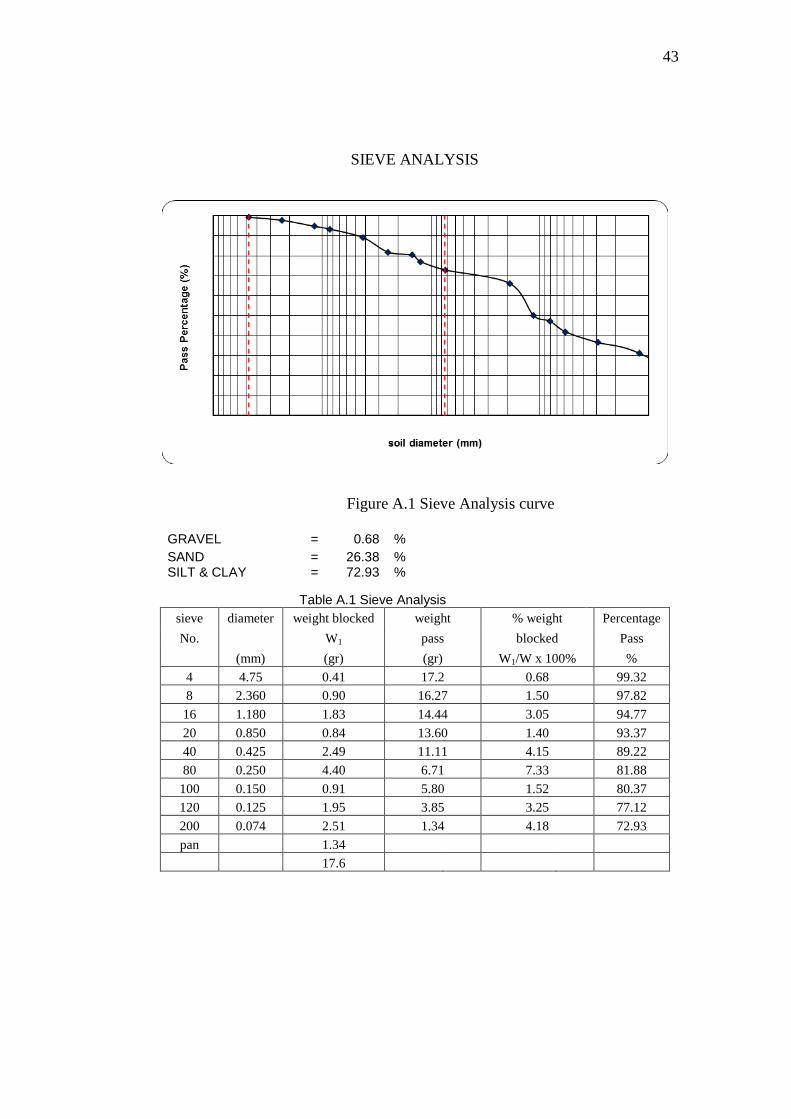
SIEVE ANALYSIS
Figure A.1 Sieve Analysis curve
GRAVEL
= 0.68 %
SAND
= 26.38 %
SILT & CLAY = 72.93 %
Table A.1 Sieve Analysis
sieve diameter weight blocked weight % weight Percentage
No. W1 pass blocked Pass
(mm) (gr) (gr) W1/W x 100% %
4 4.75 0.41 17.2 0.68 99.32
8 2.360 0.90 16.27 1.50 97.82
16 1.180 1.83 14.44 3.05 94.77
20 0.850 0.84 13.60 1.40 93.37
40 0.425 2.49 11.11 4.15 89.22
80 0.250 4.40 6.71 7.33 81.88
100 0.150 0.91 5.80 1.52 80.37
120 0.125 1.95 3.85 3.25 77.12
200 0.074 2.51 1.34 4.18 72.93
pan 1.34
17.6

44
SPECIFIC GRAVITY
Table A.2 Specific Gravity
Detail Unit Pycnometer number
1 2 3
Date Examination
Picnometer weight
(a) Gram 26.18 26.57 27.68
piknometer weight+
saturated aquades (b) Gram 75.88 76.55 77.60
piknometer weight +
dry sample ( c ) Gram 36.25 36.60 37.72
piknometer weight +
sampel + aquades (d) Gram 82.29 82.93 84.02
t1 = temperature (b) ….° 29 29 29
t2 = temperature (d) ….° 30 30 30
T1 = correction
factor at temperature
t1
1.004000
1.004000
1.004000
T2 = correction
factor at temperature
t2
1.004000
1.004000
1.004000
Gs = (c-a)/((b-a)T1 -
(d-c)T2) 2.74 2.74 2.76
Gs Average 2.75
45
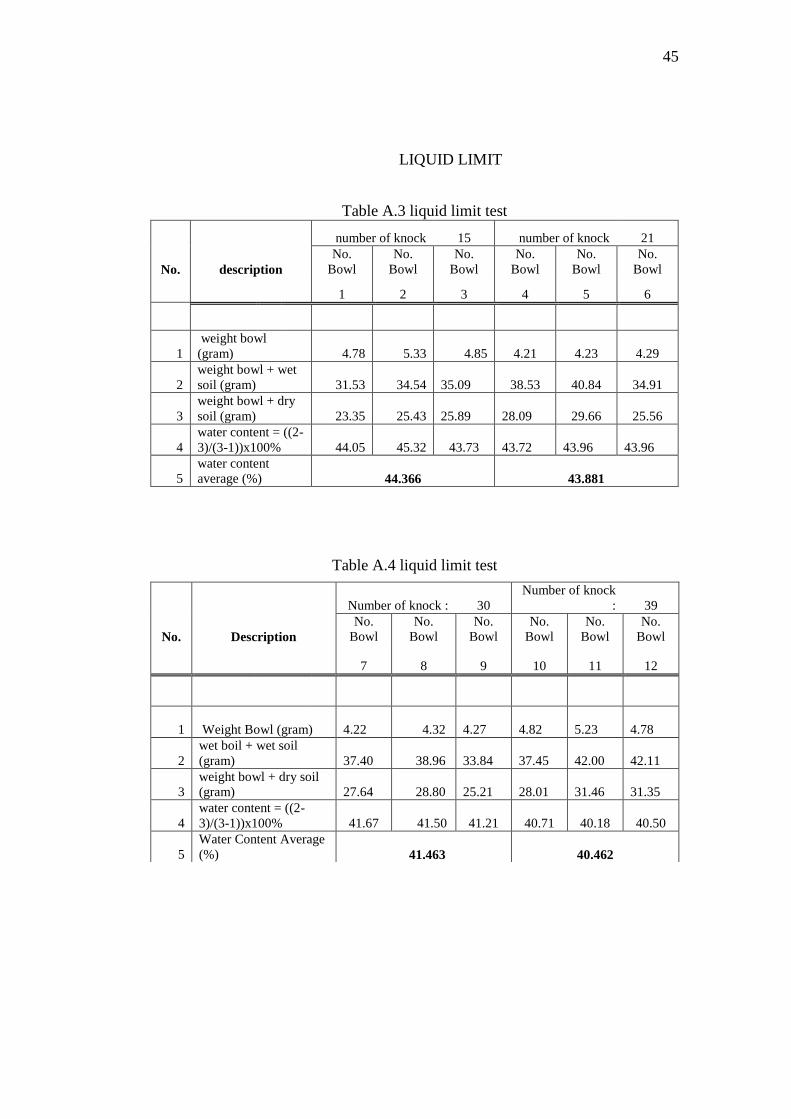
LIQUID LIMIT
Table A.3 liquid limit test
number of knock 15 number of knock 21
No. description
No.
Bowl
No.
Bowl
No.
Bowl
No.
Bowl
No.
Bowl
No.
Bowl
1 2 3 4 5 6
1
weight bowl
(gram) 4.78 5.33 4.85
4.21
4.23
4.29
2
weight bowl + wet
soil (gram) 31.53 34.54
35.09
38.53
40.84
34.91
3
weight bowl + dry
soil (gram) 23.35 25.43
25.89
28.09
29.66
25.56
4
water content = ((2-
3)/(3-1))x100% 44.05 45.32
43.73
43.72
43.96
43.96
5
water content
average (%) 44.366 43.881
Table A.4 liquid limit test
Number of knock : 30
Number of knock
: 39
No. Description
No.
Bowl
No.
Bowl
No.
Bowl
No.
Bowl
No.
Bowl
No.
Bowl
7 8 9 10 11 12
1 Weight Bowl (gram)
4.22 4.32
4.27
4.82
5.23
4.78
2
wet boil + wet soil
(gram)
37.40 38.96
33.84
37.45
42.00
42.11
3
weight bowl + dry soil
(gram)
27.64 28.80
25.21
28.01
31.46
31.35
4
water content = ((2-
3)/(3-1))x100%
41.67 41.50
41.21
40.71
40.18
40.50
5
Water Content Average
(%) 41.463
40.462

46
Figure A.1 Liquid Limit
Liquid Limit = 42.48%

47
PLASTIC LIMIT
Table A.5 Plastic Limit
No
Description
Soil sample
No. Bowl No. Bowl No. Bowl
13 14 15
1 weight bowl (gram) 4.22 4.29 4.21
2 weight bowl + wet soil (gram) 5.11 5.09 5.21
3 weight bowl + dry soil (gram) 4.93 4.93 5.00
4 water content
= ((2-3)/(3-1))x100%
25.35 25.00 26.58
5 water content average (%) 25.645
48
PROCTOR TEST (DENSITY)
Table A.6 Density
No
Number of
Test 1 2 3 4 5
1
Mould
weight+wet
soil (gr) 3780 3940 4220 4235 4090
2
Weight of
mould (gr) 2210 2210 2210 2210 2210
3
Wet Soil
Weight (gr) 1570 1730 2010 2025 1880
4
Volume of
mould (cm3) 942.478 942.478 942.478 942.478 942.478
5
Wet soil
content
weight
(gr/cm3) 1.666 1.836 2.133 2.149 1.995
6
Dry soil
content
(gr/cm3) 1.605 1.695 1.859 1.777 1.581
49
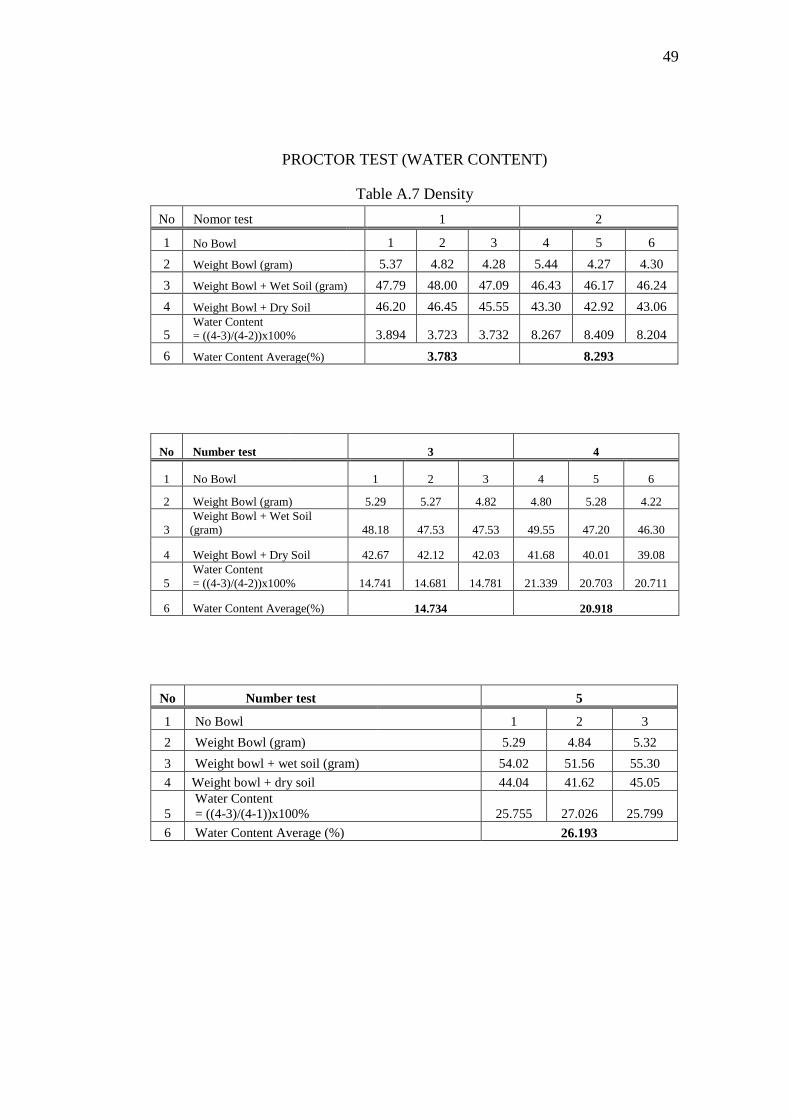
PROCTOR TEST (WATER CONTENT)
Table A.7 Density
No Nomor test 1 2
1 No Bowl 1 2 3 4 5 6
2 Weight Bowl (gram) 5.37 4.82 4.28 5.44 4.27 4.30
3 Weight Bowl + Wet Soil (gram) 47.79 48.00 47.09 46.43 46.17 46.24
4 Weight Bowl + Dry Soil 46.20 46.45 45.55 43.30 42.92 43.06
5 Water Content
= ((4-3)/(4-2))x100% 3.894 3.723 3.732 8.267 8.409 8.204
6 Water Content Average(%) 3.783 8.293
No Number test 3 4
1 No Bowl 1 2 3 4 5 6
2 Weight Bowl (gram) 5.29 5.27 4.82 4.80 5.28 4.22
3
Weight Bowl + Wet Soil
(gram) 48.18 47.53 47.53 49.55 47.20 46.30
4 Weight Bowl + Dry Soil 42.67 42.12 42.03 41.68 40.01 39.08
5
Water Content
= ((4-3)/(4-2))x100% 14.741 14.681 14.781 21.339 20.703 20.711
6 Water Content Average(%) 14.734 20.918
No Number test 5
1 No Bowl 1 2 3
2 Weight Bowl (gram) 5.29 4.84 5.32
3 Weight bowl + wet soil (gram) 54.02 51.56 55.30
4 Weight bowl + dry soil 44.04 41.62 45.05
5
Water Content
= ((4-3)/(4-1))x100% 25.755 27.026 25.799
6 Water Content Average (%) 26.193

50
Figure A.2 Relation graph of MDD and OMC

51
EMULSIFIED ASPHALT
Table A.8 Test Result of Emulsified Asphalt Characteristic
No Test Type Unit Test method Result Specifications
Min Max
1 Viscosity Second SNI 03-6721-
2002 33 20 100
2 Stability in 24 hours % SNI 03-6828-
2002 0,4 - 1
3 Electricity Particle
Content -
SNI 03-3644-
1994 Positive Positive -
4 Blocked sieve analysis
no. 20 %
SNI 03-3643-
1994 0 - Maks 0,1
5
Refining SNI 03-3642-
1994
-Water content % SNI 03-3642-
1994
-Oil content % SNI 03-3642-
1994 1,5 - 3
-Residue content SNI 03-3642-
1994 57,46 Min 57 -
6 Residue penetration 0,1
mm
SNI 06-2456-
1991 87 40 90
7 Residue Ductile Cm SNI 06-2432-
1991 >140 40 -
8 Residue lateness in
C2HCL3 %
SNI 06-2438-
1991 99,9 97,5 -

52
APPENDIX B
CALIFORNIA BEARING RATIO TEST
AND
UNCONFINED COMPRESSION TEST
53
C B R TEST
CBR test after 3 days
Table B.1 CBR Test after 3 days
PERCENTAGE
OF EMULSIFIED
ASPHALT
CBR
SAMPLE 1
CBR
SAMPLE 2
CBR
SAMPLE 3
Average
0 % 3.20 5.32 3.68 4.07
2 % 12.62 11.68 13.83 12.17
4 % 18.63 22.34 16.91 19.29
6% 24.36 24.78 27.99 25.71
8% 32.36 29.14 26.57 29.36
Figure B.1. The effect of emulsified asphalt on CBR after 3 days

54
CBR test after 7 days
Table B.2 CBR Test after 7 days
PERCENTAGE OF
EMULSIFIED
ASPHALT
CBR
SAMPLE 1
CBR
SAMPLE 2
CBR
SAMPLE 3
Average
0 % 3.20 5.32 3.68 4.07
2 % 17.63 16.29 19.53 17.82
4 % 19.95 23.24 19.97 21.05
6% 24.27 26.62 28.22 26.37
8% 33.38 36.28 28.26 32.64
Figure B.2. The effect of emulsified asphalt on CBR after 7 days
55
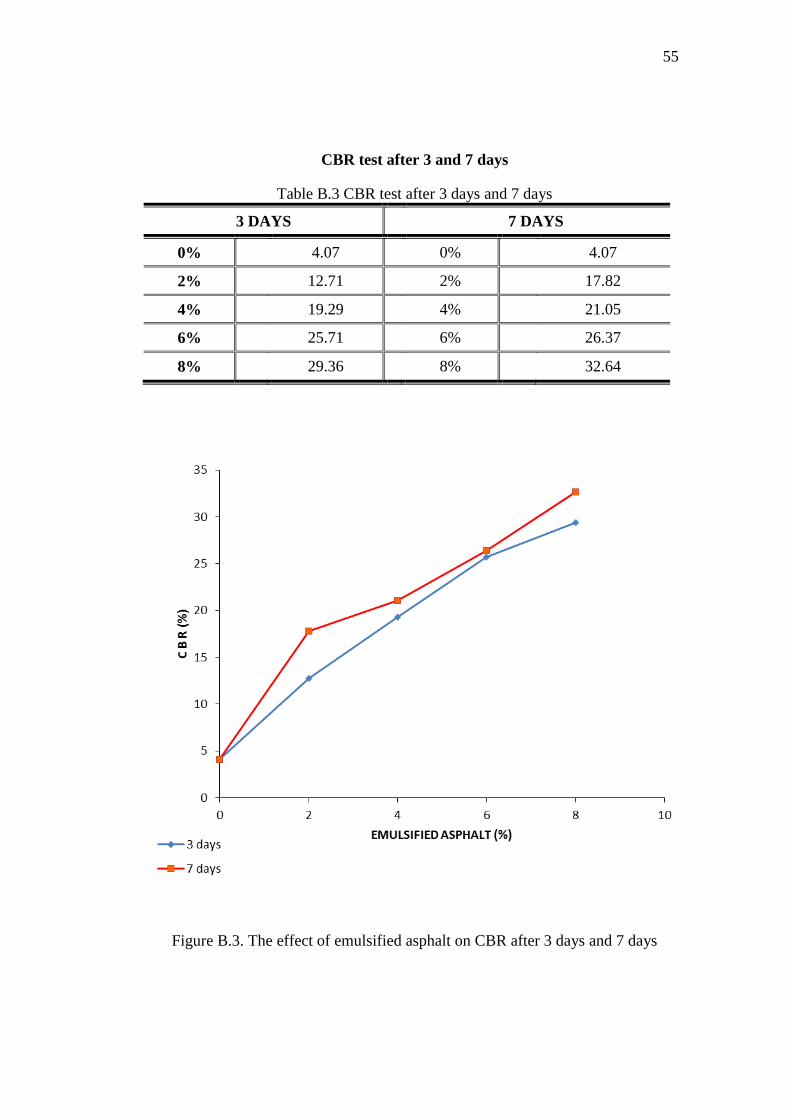
CBR test after 3 and 7 days
Table B.3 CBR test after 3 days and 7 days
3 DAYS 7 DAYS
0% 4.07 0% 4.07
2% 12.71 2% 17.82
4% 19.29 4% 21.05
6% 25.71 6% 26.37
8% 29.36 8% 32.64
Figure B.3. The effect of emulsified asphalt on CBR after 3 days and 7 days
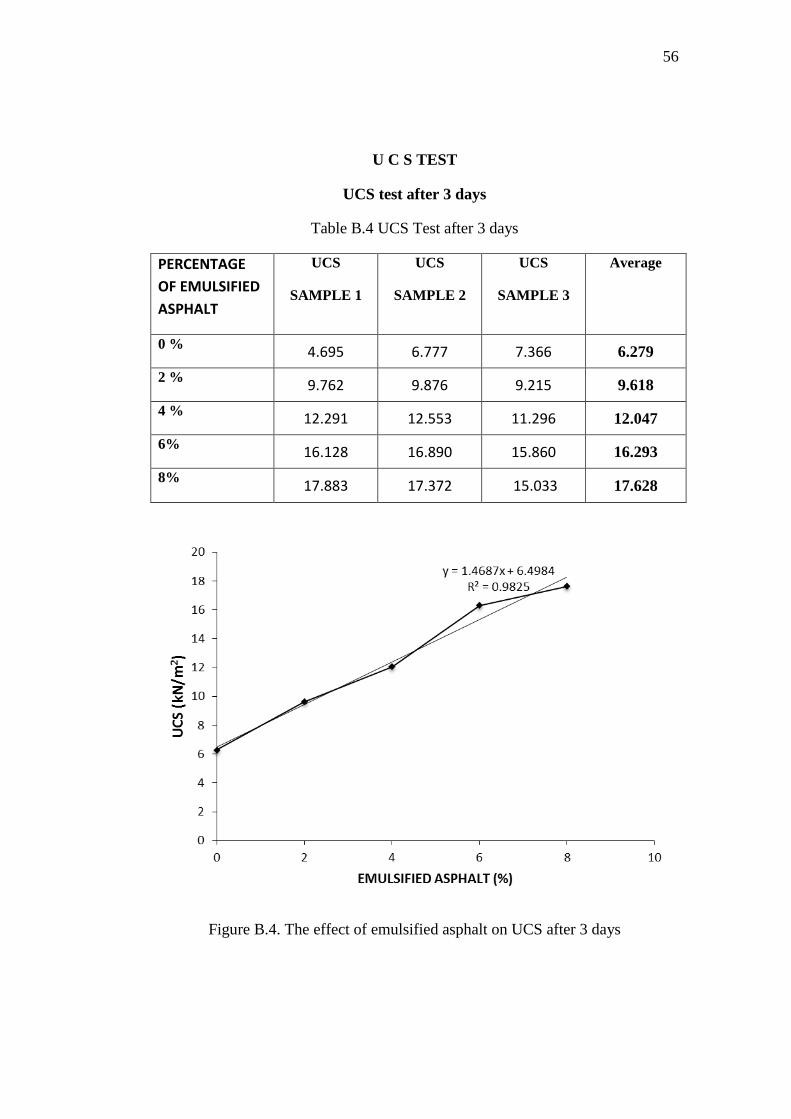
56
U C S TEST
UCS test after 3 days
Table B.4 UCS Test after 3 days
PERCENTAGE
OF EMULSIFIED
ASPHALT
UCS
SAMPLE 1
UCS
SAMPLE 2
UCS
SAMPLE 3
Average
0 % 4.695 6.777 7.366 6.279
2 % 9.762 9.876 9.215 9.618
4 % 12.291 12.553 11.296 12.047
6% 16.128 16.890 15.860 16.293
8% 17.883 17.372 15.033 17.628
Figure B.4. The effect of emulsified asphalt on UCS after 3 days
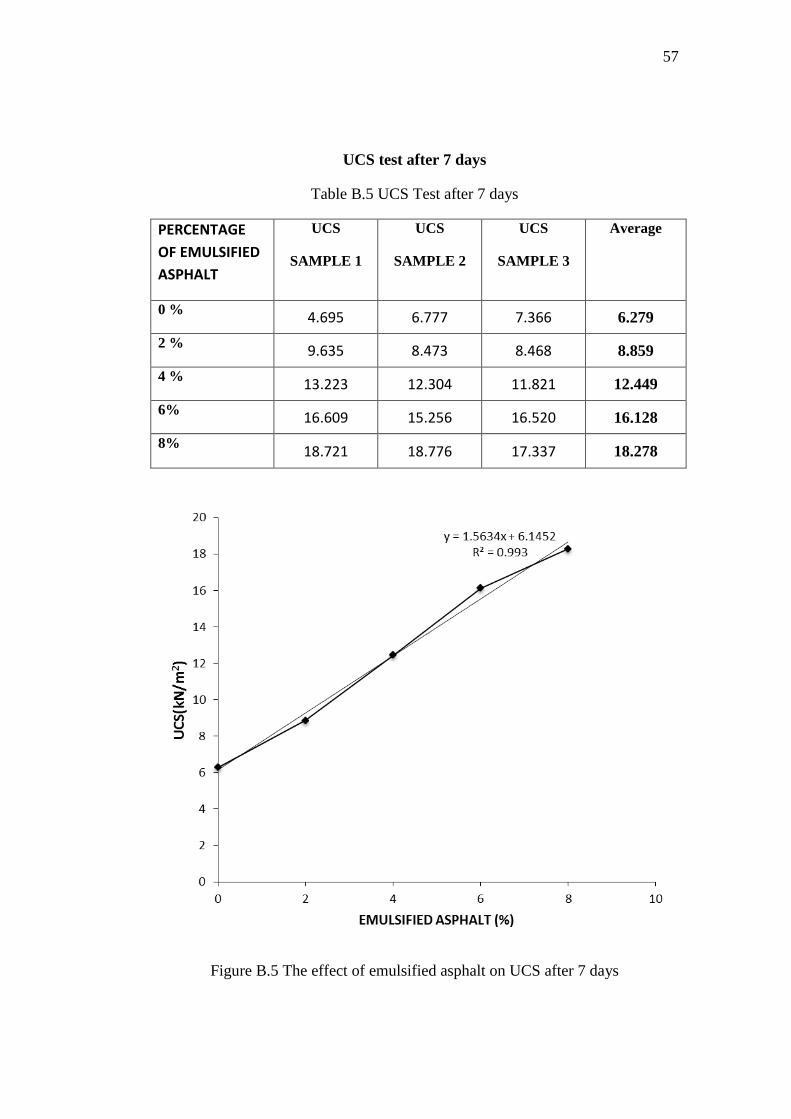
57
UCS test after 7 days
Table B.5 UCS Test after 7 days
PERCENTAGE
OF EMULSIFIED
ASPHALT
UCS
SAMPLE 1
UCS
SAMPLE 2
UCS
SAMPLE 3
Average
0 % 4.695 6.777 7.366 6.279
2 % 9.635 8.473 8.468 8.859
4 % 13.223 12.304 11.821 12.449
6% 16.609 15.256 16.520 16.128
8% 18.721 18.776 17.337 18.278
Figure B.5 The effect of emulsified asphalt on UCS after 7 days
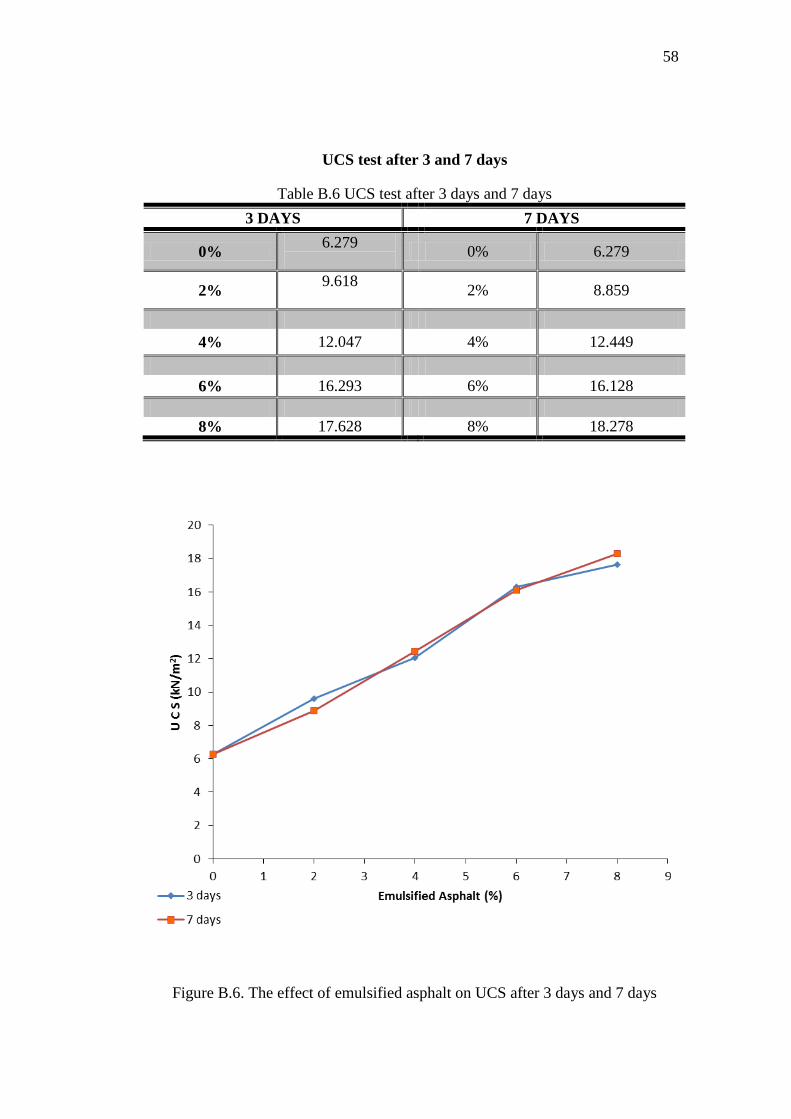
58
UCS test after 3 and 7 days
Table B.6 UCS test after 3 days and 7 days
3 DAYS 7 DAYS
0% 6.279
0% 6.279
2% 9.618
2% 8.859
4% 12.047 4% 12.449
6% 16.293 6% 16.128
8% 17.628 8% 18.278
Figure B.6. The effect of emulsified asphalt on UCS after 3 days and 7 days
59
APPENDIX C
Pictures of Field
and
Laboratory Tests
60
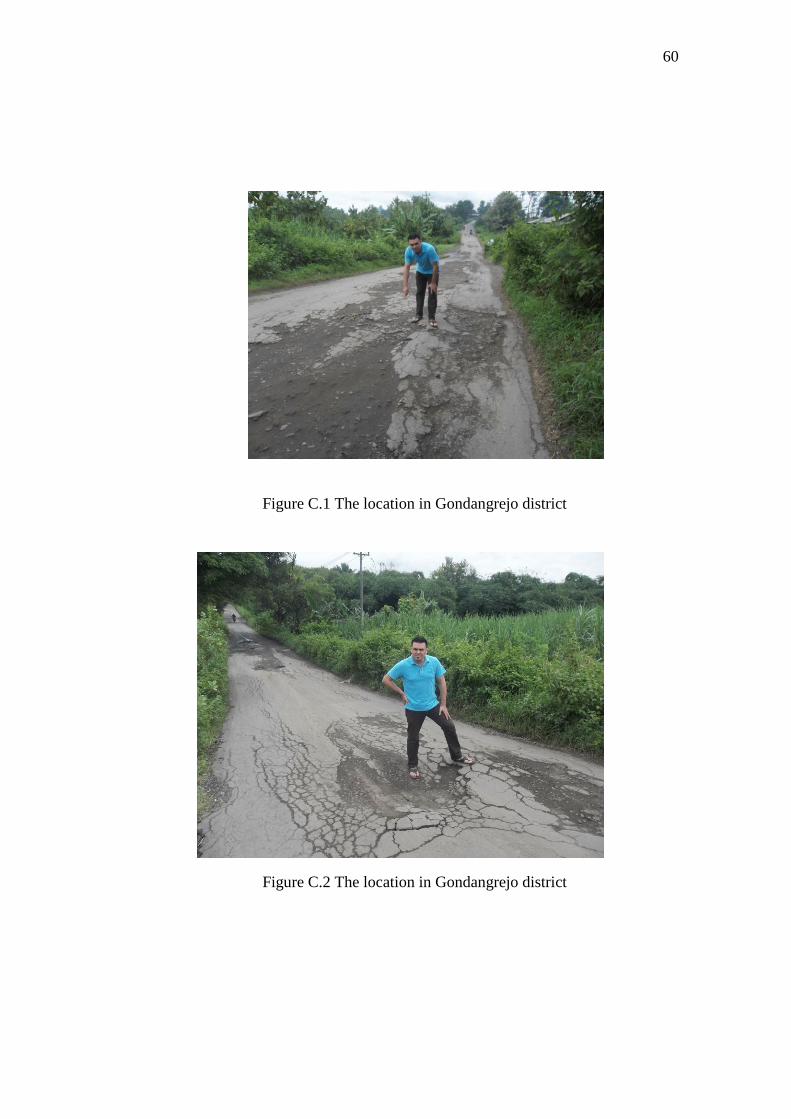
Figure C.1 The location in Gondangrejo district
Figure C.2 The location in Gondangrejo district
61
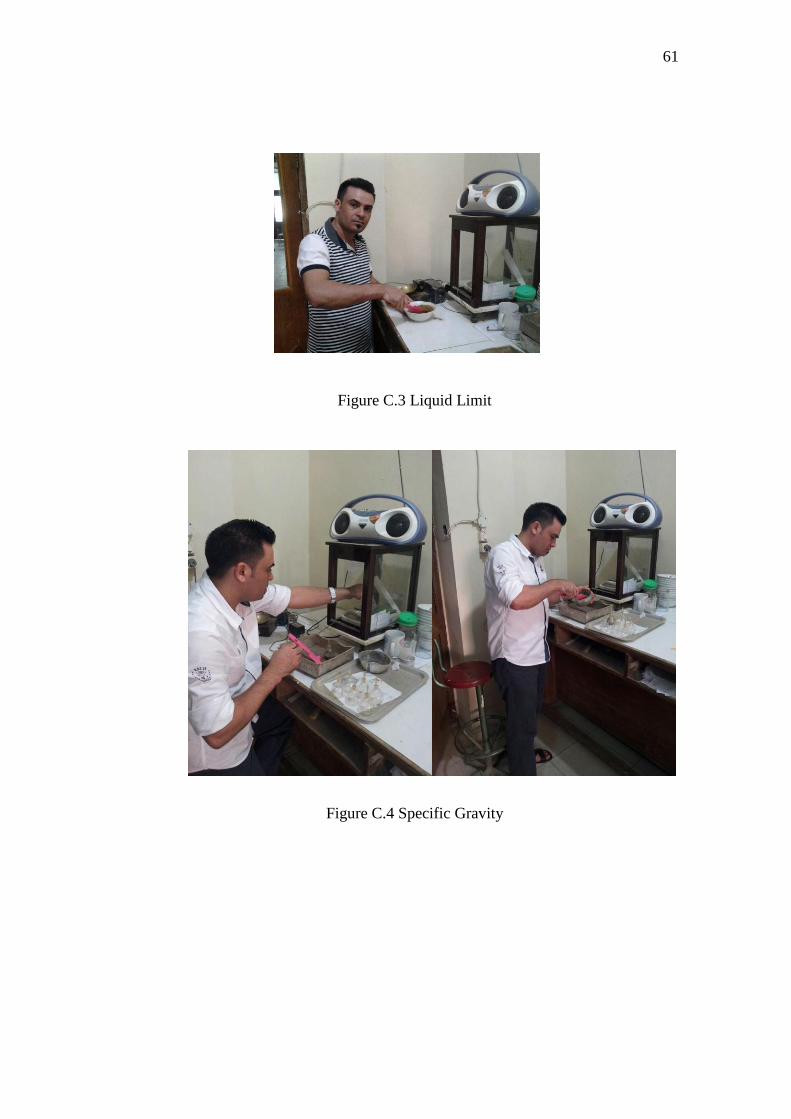
Figure C.3 Liquid Limit
Figure C.4 Specific Gravity

62
Figure C.5 Sieve Analysis
Figure C.6 Preparation of samples

63
The Equipments
Figure C.7 Proctor equipment
Figure C.8 Proctor Analysis
64
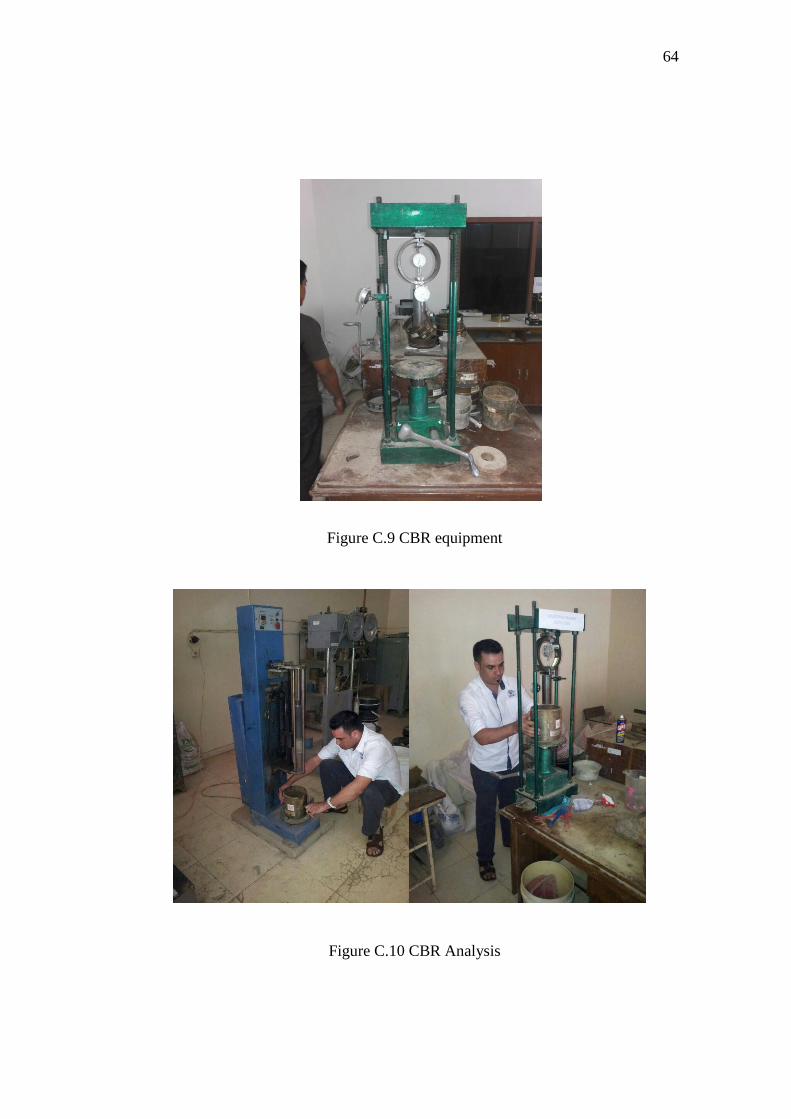
Figure C.9 CBR equipment
Figure C.10 CBR Analysis

65
Figure C.11 UCS equipment
Figure C.12 UCS Analysis