submission in respect of a sectoral employment … · construction industry federation submission...
TRANSCRIPT
Construction Industry Federation
Submission in Respect of a Sectoral
Employment Order in the Construction
Sector
April 2017
1
Contents
Page
1. Introduction 2
2. Executive Summary 3
3. Background 5
4. Submission on Remuneration, Pensions and Sick Pay and Dispute
Resolution Procedures 7
5. Industry Performance and Activity 17
6. Industry Structure and Pay Rates and Comparisons 22
7. Economic Impact of Pay Rate Changes 27
8. International Comparisons 31

2
1. Introduction
This submission is made by the Construction Industry Federation representing contractors
and employers operating in the construction sector; specifically in building and
construction work employing craftspeople, general operatives and apprentices.
This submission is intended to outline our views and concerns regarding the level at which
the proposed SEO rates will be set.
In this submission we provide our views and inputs across a range of considerations and
we will be pleased to elucidate on these or discuss them with you if you so wish.
3
2. Executive Summary
2.1 Compliance with the Industrial Relations (Amendment) Act 2015
With reference to the Act, we say that:
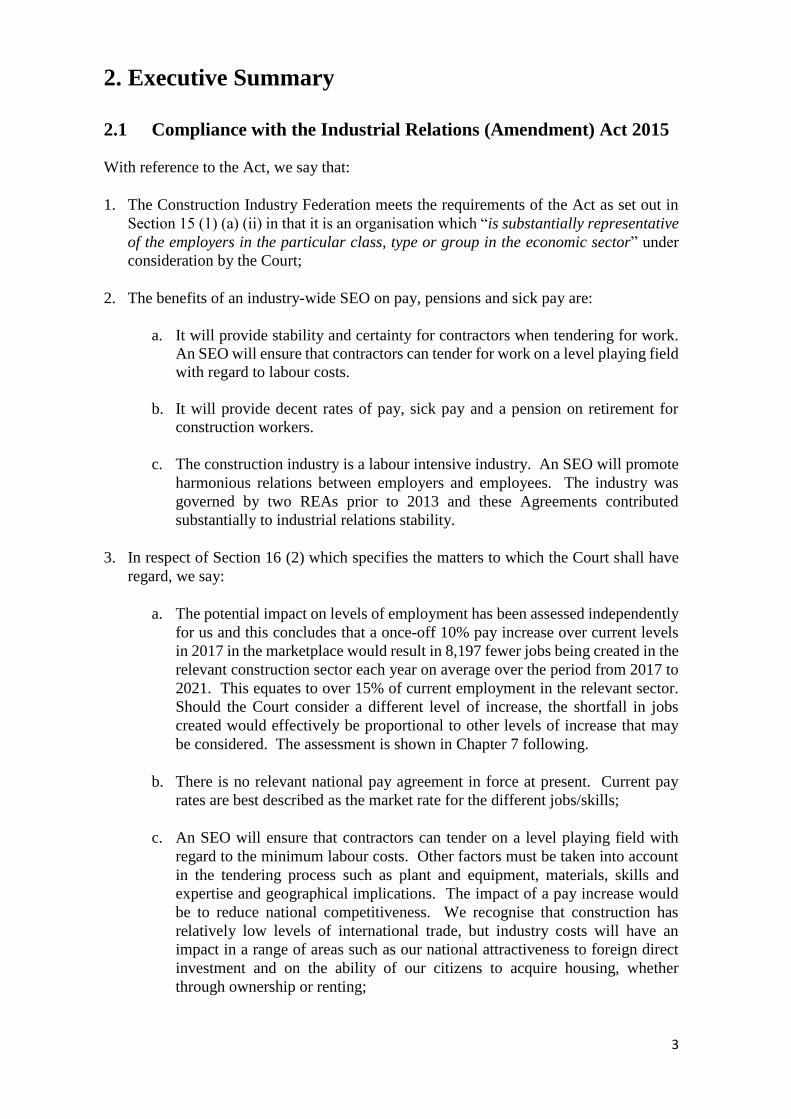
1. The Construction Industry Federation meets the requirements of the Act as set out in
Section 15 (1) (a) (ii) in that it is an organisation which “is substantially representative
of the employers in the particular class, type or group in the economic sector” under
consideration by the Court;
2. The benefits of an industry-wide SEO on pay, pensions and sick pay are:
a. It will provide stability and certainty for contractors when tendering for work.
An SEO will ensure that contractors can tender for work on a level playing field
with regard to labour costs.
b. It will provide decent rates of pay, sick pay and a pension on retirement for
construction workers.
c. The construction industry is a labour intensive industry. An SEO will promote
harmonious relations between employers and employees. The industry was
governed by two REAs prior to 2013 and these Agreements contributed
substantially to industrial relations stability.
3. In respect of Section 16 (2) which specifies the matters to which the Court shall have
regard, we say:
a. The potential impact on levels of employment has been assessed independently
for us and this concludes that a once-off 10% pay increase over current levels
in 2017 in the marketplace would result in 8,197 fewer jobs being created in the
relevant construction sector each year on average over the period from 2017 to
2021. This equates to over 15% of current employment in the relevant sector.
Should the Court consider a different level of increase, the shortfall in jobs
created would effectively be proportional to other levels of increase that may
be considered. The assessment is shown in Chapter 7 following.
b. There is no relevant national pay agreement in force at present. Current pay
rates are best described as the market rate for the different jobs/skills;
c. An SEO will ensure that contractors can tender on a level playing field with
regard to the minimum labour costs. Other factors must be taken into account
in the tendering process such as plant and equipment, materials, skills and
expertise and geographical implications. The impact of a pay increase would
be to reduce national competitiveness. We recognise that construction has
relatively low levels of international trade, but industry costs will have an
impact in a range of areas such as our national attractiveness to foreign direct
investment and on the ability of our citizens to acquire housing, whether
through ownership or renting;
4
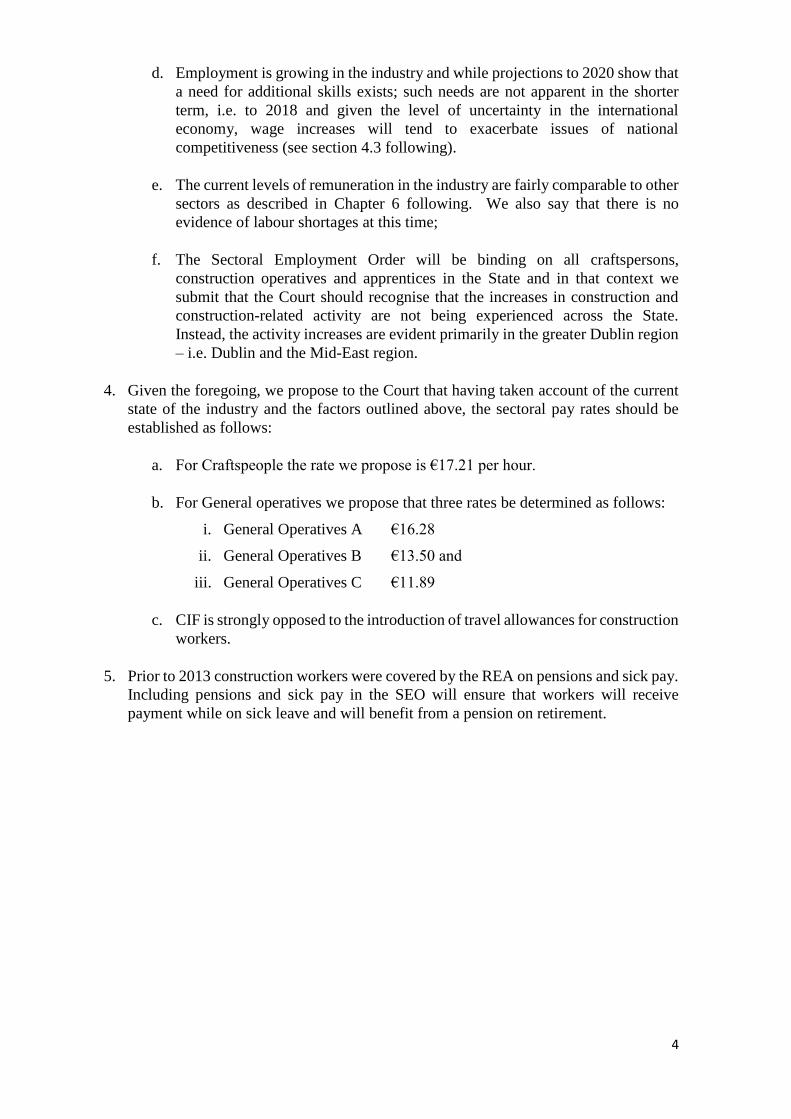
d. Employment is growing in the industry and while projections to 2020 show that
a need for additional skills exists; such needs are not apparent in the shorter
term, i.e. to 2018 and given the level of uncertainty in the international
economy, wage increases will tend to exacerbate issues of national
competitiveness (see section 4.3 following).
e. The current levels of remuneration in the industry are fairly comparable to other
sectors as described in Chapter 6 following. We also say that there is no
evidence of labour shortages at this time;
f. The Sectoral Employment Order will be binding on all craftspersons,
construction operatives and apprentices in the State and in that context we
submit that the Court should recognise that the increases in construction and
construction-related activity are not being experienced across the State.
Instead, the activity increases are evident primarily in the greater Dublin region
– i.e. Dublin and the Mid-East region.
4. Given the foregoing, we propose to the Court that having taken account of the current
state of the industry and the factors outlined above, the sectoral pay rates should be
established as follows:
a. For Craftspeople the rate we propose is €17.21 per hour.
b. For General operatives we propose that three rates be determined as follows:
i. General Operatives A €16.28
ii. General Operatives B €13.50 and
iii. General Operatives C €11.89
c. CIF is strongly opposed to the introduction of travel allowances for construction
workers.
5. Prior to 2013 construction workers were covered by the REA on pensions and sick pay.
Including pensions and sick pay in the SEO will ensure that workers will receive
payment while on sick leave and will benefit from a pension on retirement.
5
3. Background
CIF is seeking the introduction of a Sectoral Employment Order (SEO) on remuneration,
pensions and sick pay for all craftspeople, construction operatives and apprentices working
in the construction industry. Prior to the striking down of Part 3 of the Industrial Relations
Act 1946, these workers were covered by the Registered Employment Agreements on
wages and conditions of employment and pensions and sick pay in the construction
industry. The construction industry is labour intensive and unique in terms of its transient
nature. It is an industry characterised by intense competition and it is prone to volatility.
An SEO will undoubtedly promote harmonious relations between construction workers and
their employers in the construction sector.
The previously registered employment agreements governing pay and conditions, pensions
and sick pay for construction workers played a significant role in maintaining certainty and
stability in the construction industry since the 1960s. During their lifespan, the parties to
these agreements never sought their cancellation and were not involved in the McGowan v
the Labour Court case which culminated in the Supreme Court striking down Part 3 of the
Industrial Relations Act 1946. This case left a vacuum in the industry which led to
difficulties in tendering and industrial relations instability. It is, therefore, essential that an
SEO is introduced on remuneration, pensions and sick pay which will greatly assist in
providing stability and certainty in a stable industrial relations environment.
The construction industry is highly competitive and labour intensive. Competition for
work is based on a number of factors; the two most prominent being labour and materials.
Labour costs can account for over 40% of any tender. Therefore, stability with regard to
labour costs and an environment where contractors can tender on a level playing field is of
paramount importance to the industry. The industry is recovering from the most severe
recession in the history of the State. It is essential that the framework exists which will
ensure that Irish contractors employing Irish workers can tender on a level playing field.
Equally, it is essential that workers in the industry are paid a fair and reasonable wage
which in turn will ensure that we attract bright young workers into the sector. An SEO
will ensure that contractors can tender for work on a level playing field and craftspeople,
construction operatives and apprentices will receive fair and decent wages, sick pay and a
pension on retirement.
With the economic recovery we have seen many sectors at the forefront of industrial
turbulence. The construction industry is a vital sector of the Irish economy and it is
responsible for providing the housing, commercial, industrial and civil infrastructure
required to sustain economic growth in Ireland. As it is one of the most labour-intensive
forms of economic activity the industry is prone to volatility. Workers in the industry are
transient by nature. A construction worker’s place of work can change regularly and is
dependent on the size and duration of a given project. A construction worker can expect
to be employed for the duration of the project only and, therefore, construction workers
can move from employer-to-employer on a regular basis. As a result of this situation,
coupled with the high numbers of construction workers employed, the industry is prone to
volatility and disputes are inevitable. Such disputes result in significant costs, delays in
completing projects and reputational damage for the industry. A disputes resolution
procedure capable of resolving disputes which inevitably arise is essential in ensuring the
industry is capable of delivering projects on time and without disruption due to industrial
action.
6
Over the decades the construction industry, in conjunction with Solas, has trained some of
the best craftspeople in the world. We are proud of our achievements in the international
skills competitions and the reputation our craftspeople maintain both at home and abroad.
The majority of these workers were trained during the lifespan of the previously registered
employment agreements. Unfortunately we have lost a lot of our skilled workers due to
emigration during the recession and these workers will not return home unless they feel
confident that they can secure quality and long-term employment. We are also concerned
with the low level of apprentices currently registered with Solas, particularly those in the
wet trades. Investment in training in terms of apprenticeships and ongoing technological
advances in construction methods is essential in ensuring we have a sustainable industry
into the future. The industry is emerging from recession and an SEO will provide certainty
and stability. This will encourage employers to invest in training as was the practice prior
to the striking down of REAs in 2013.
The absence of an SEO will lead to increased competition at home and abroad, low pay,
poor quality and unsecure work, less direct employment, substantially reduced investment
in training, difficulties in tendering, an unstable industrial relations environment and
further gaps in wage rates that do not match economic reality.
The CIF is seeking an SEO in the construction industry to ensure a level playing field with
regard to labour costs and it will also provide for fair and realistic rates of pay in line with
economic sustainability. A key factor in the sustainability of Ireland’s economy is our
ability to attract foreign direct investment. An SEO will promote harmonious relations
between employers and employees in the construction industry and will provide stability
and certainty which will ensure contracts are delivered on time without undue delay. This
will enhance Ireland’s attractiveness to foreign direct investment.
7
4. Submission on Remuneration, Pensions and Sick
Pay and Dispute Resolution Procedures
4.1 Remuneration
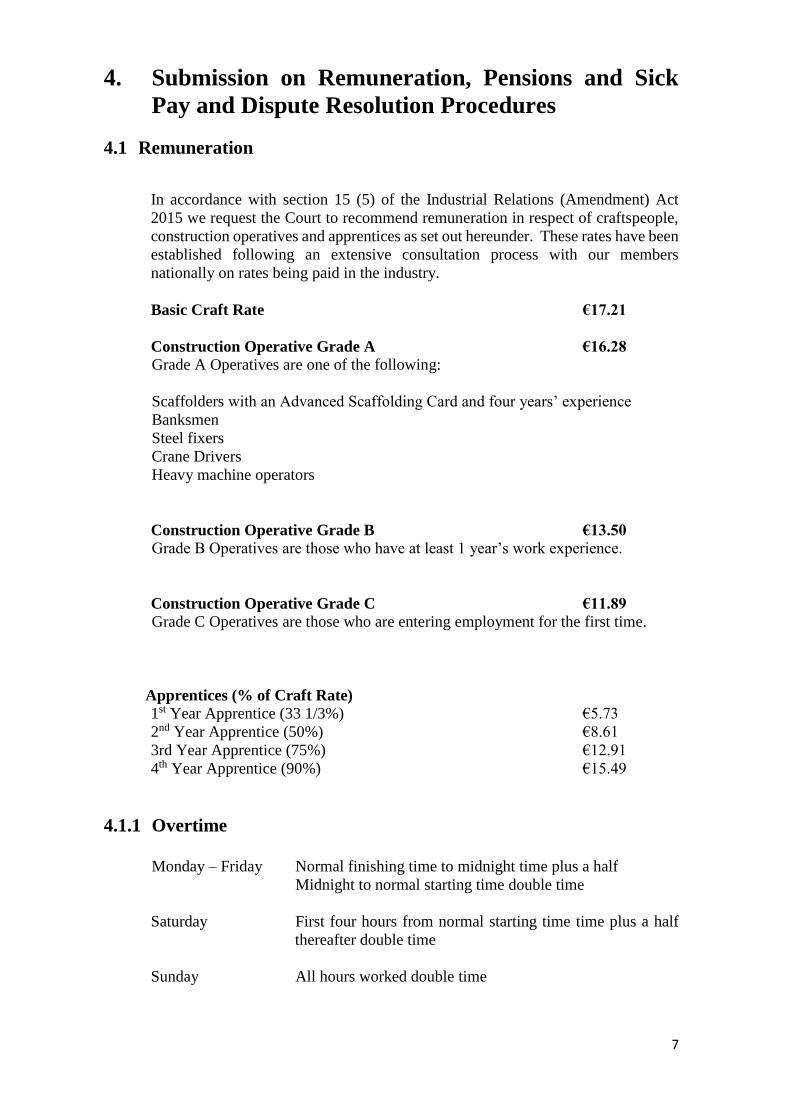
In accordance with section 15 (5) of the Industrial Relations (Amendment) Act
2015 we request the Court to recommend remuneration in respect of craftspeople,
construction operatives and apprentices as set out hereunder. These rates have been
established following an extensive consultation process with our members
nationally on rates being paid in the industry.
Basic Craft Rate €17.21
Construction Operative Grade A €16.28
Grade A Operatives are one of the following:
Scaffolders with an Advanced Scaffolding Card and four years’ experience
Banksmen
Steel fixers
Crane Drivers
Heavy machine operators
Construction Operative Grade B €13.50
Grade B Operatives are those who have at least 1 year’s work experience.
Construction Operative Grade C €11.89
Grade C Operatives are those who are entering employment for the first time.
Apprentices (% of Craft Rate)
1st Year Apprentice (33 1/3%) €5.73
2nd Year Apprentice (50%) €8.61
3rd Year Apprentice (75%) €12.91
4th Year Apprentice (90%) €15.49
4.1.1 Overtime Monday – Friday Normal finishing time to midnight time plus a half
Midnight to normal starting time double time
Saturday First four hours from normal starting time time plus a half
thereafter double time
Sunday All hours worked double time
8
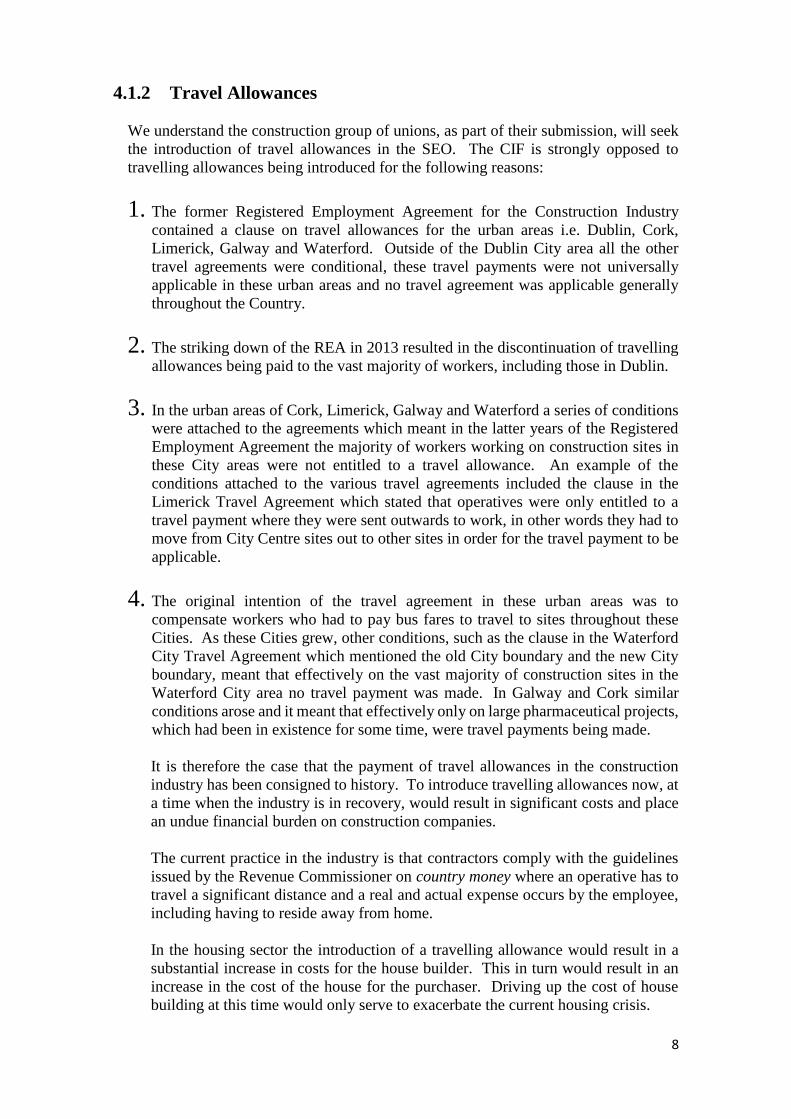
4.1.2 Travel Allowances
We understand the construction group of unions, as part of their submission, will seek
the introduction of travel allowances in the SEO. The CIF is strongly opposed to
travelling allowances being introduced for the following reasons:
1. The former Registered Employment Agreement for the Construction Industry
contained a clause on travel allowances for the urban areas i.e. Dublin, Cork,
Limerick, Galway and Waterford. Outside of the Dublin City area all the other
travel agreements were conditional, these travel payments were not universally
applicable in these urban areas and no travel agreement was applicable generally
throughout the Country.
2. The striking down of the REA in 2013 resulted in the discontinuation of travelling
allowances being paid to the vast majority of workers, including those in Dublin.
3. In the urban areas of Cork, Limerick, Galway and Waterford a series of conditions
were attached to the agreements which meant in the latter years of the Registered
Employment Agreement the majority of workers working on construction sites in
these City areas were not entitled to a travel allowance. An example of the
conditions attached to the various travel agreements included the clause in the
Limerick Travel Agreement which stated that operatives were only entitled to a
travel payment where they were sent outwards to work, in other words they had to
move from City Centre sites out to other sites in order for the travel payment to be
applicable.
4. The original intention of the travel agreement in these urban areas was to
compensate workers who had to pay bus fares to travel to sites throughout these
Cities. As these Cities grew, other conditions, such as the clause in the Waterford
City Travel Agreement which mentioned the old City boundary and the new City
boundary, meant that effectively on the vast majority of construction sites in the
Waterford City area no travel payment was made. In Galway and Cork similar
conditions arose and it meant that effectively only on large pharmaceutical projects,
which had been in existence for some time, were travel payments being made.
It is therefore the case that the payment of travel allowances in the construction
industry has been consigned to history. To introduce travelling allowances now, at
a time when the industry is in recovery, would result in significant costs and place
an undue financial burden on construction companies.
The current practice in the industry is that contractors comply with the guidelines
issued by the Revenue Commissioner on country money where an operative has to
travel a significant distance and a real and actual expense occurs by the employee,
including having to reside away from home.
In the housing sector the introduction of a travelling allowance would result in a
substantial increase in costs for the house builder. This in turn would result in an
increase in the cost of the house for the purchaser. Driving up the cost of house
building at this time would only serve to exacerbate the current housing crisis.
9
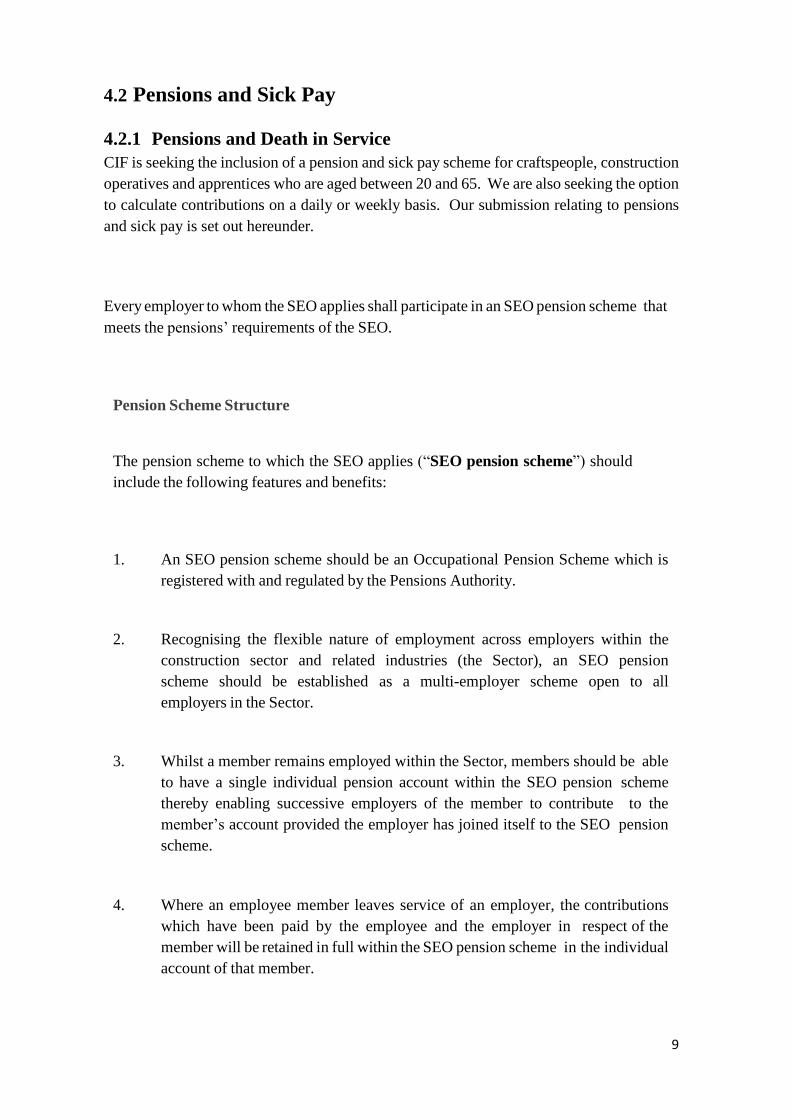
4.2 Pensions and Sick Pay
4.2.1 Pensions and Death in Service
CIF is seeking the inclusion of a pension and sick pay scheme for craftspeople, construction
operatives and apprentices who are aged between 20 and 65. We are also seeking the option
to calculate contributions on a daily or weekly basis. Our submission relating to pensions
and sick pay is set out hereunder.
Every employer to whom the SEO applies shall participate in an SEO pension scheme that
meets the pensions’ requirements of the SEO.
Pension Scheme Structure
The pension scheme to which the SEO applies (“SEO pension scheme”) should
include the following features and benefits:
1. An SEO pension scheme should be an Occupational Pension Scheme which is
registered with and regulated by the Pensions Authority.
2. Recognising the flexible nature of employment across employers within the
construction sector and related industries (the Sector), an SEO pension
scheme should be established as a multi-employer scheme open to all
employers in the Sector.
3. Whilst a member remains employed within the Sector, members should be able
to have a single individual pension account within the SEO pension scheme
thereby enabling successive employers of the member to contribute to the
member’s account provided the employer has joined itself to the SEO pension
scheme.
4. Where an employee member leaves service of an employer, the contributions
which have been paid by the employee and the employer in respect of the
member will be retained in full within the SEO pension scheme in the individual
account of that member.

10
5. The rules of an SEO pension scheme should not permit a member to take a
refund of their own contributions prior to reaching retirement age.
6. Bodies that are representative of both employers and unions involved in the
Sector must appoint the members of the SEO pension scheme trustee. The
constitution of the Trustee Board should also include representatives of both
employers and employees in the Sector.
7. In addition to providing pension benefits, an SEO pension scheme must also
provide an additional Death in Service benefit with members covered for this
benefit upon joining the scheme.
8. An existing pension scheme at the time the SEO comes into force may qualify
as an SEO pension scheme provided it complies with the terms of the SEO or is
adapted to so comply.
9. An SEO pension scheme must disclose and publicise information about the
pension scheme’s charges and who bears them. There must be full
transparency of charges and this information should be disclosed in the
scheme’s Trustee Annual Report as well as provided to each member when
joining. The total annual charges borne by members should be disclosed and
must include all administration costs, Trustee costs, distribution costs, fund
management costs, actuarial, accounting, legal and auditing fees and all other
charges incurred by the SEO pension scheme.
10. Scheme Design
The terms and conditions applying under an SEO pension scheme and
benefits to be provided must be at least as great as that described below.
10.1. Eligibility
An SEO pension scheme must at least provide for an employee of a
participating employer in the Sector to be eligible for membership of the
scheme provided they have attained age 20 but not yet attained age 65.
10.2. Relevant Pension Contributions
Employers and their employees working in the construction sector and related
industries (the Sector) must contribute to an SEO pension scheme.
Contributions should be remitted by employers to an SEO pension scheme in
accordance with all relevant pension and other legislative requirements.
11
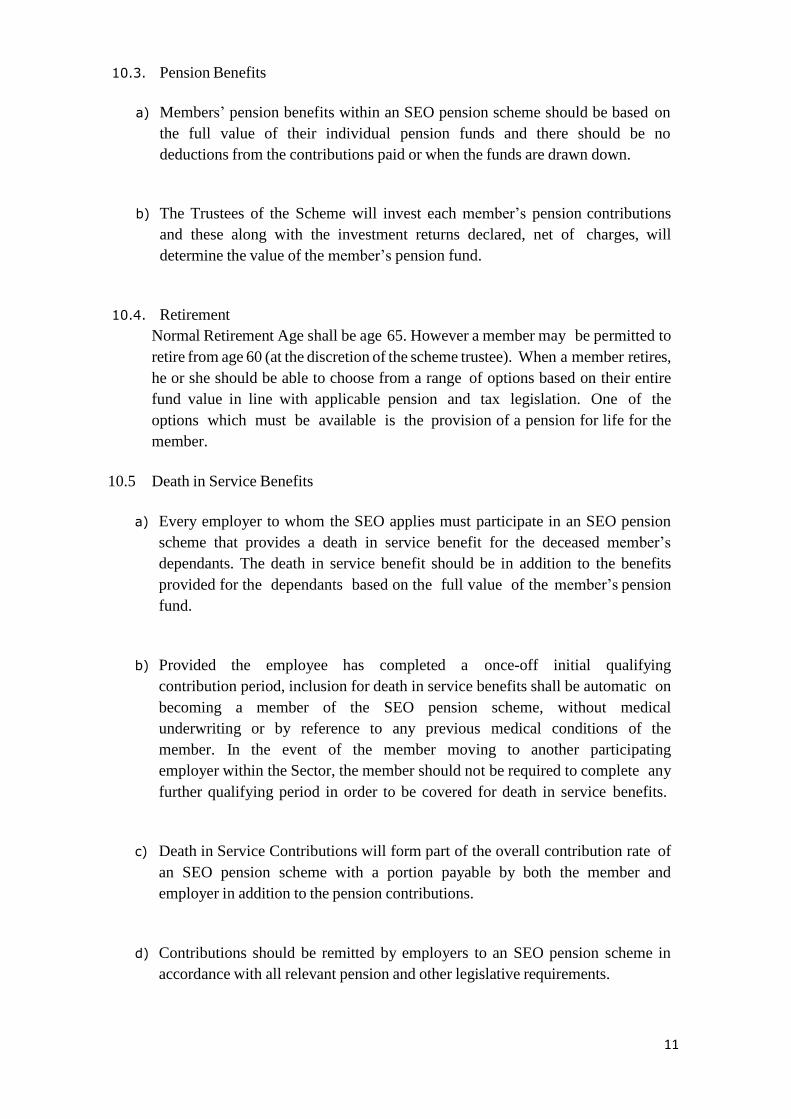
10.3. Pension Benefits
a) Members’ pension benefits within an SEO pension scheme should be based on
the full value of their individual pension funds and there should be no
deductions from the contributions paid or when the funds are drawn down.
b) The Trustees of the Scheme will invest each member’s pension contributions
and these along with the investment returns declared, net of charges, will
determine the value of the member’s pension fund.
10.4. Retirement
Normal Retirement Age shall be age 65. However a member may be permitted to
retire from age 60 (at the discretion of the scheme trustee). When a member retires,
he or she should be able to choose from a range of options based on their entire
fund value in line with applicable pension and tax legislation. One of the
options which must be available is the provision of a pension for life for the
member.
10.5 Death in Service Benefits
a) Every employer to whom the SEO applies must participate in an SEO pension
scheme that provides a death in service benefit for the deceased member’s
dependants. The death in service benefit should be in addition to the benefits
provided for the dependants based on the full value of the member’s pension
fund.
b) Provided the employee has completed a once-off initial qualifying
contribution period, inclusion for death in service benefits shall be automatic on
becoming a member of the SEO pension scheme, without medical
underwriting or by reference to any previous medical conditions of the
member. In the event of the member moving to another participating
employer within the Sector, the member should not be required to complete any
further qualifying period in order to be covered for death in service benefits.
c) Death in Service Contributions will form part of the overall contribution rate of
an SEO pension scheme with a portion payable by both the member and
employer in addition to the pension contributions.
d) Contributions should be remitted by employers to an SEO pension scheme in
accordance with all relevant pension and other legislative requirements.

12
e) If a member had met the requirements for the full lump sum death in service benefit,
but then leaves service and dies within four weeks of doing so without being
re-employed in the Sector, the SEO pension scheme should provide a modified
lump sum benefit in addition to the value of their pension account.
f) Death in Service benefits should be payable regardless of cause or timing of
death, so long as the member meets the qualification conditions for inclusion for
Death in Service benefits as set out above.
13
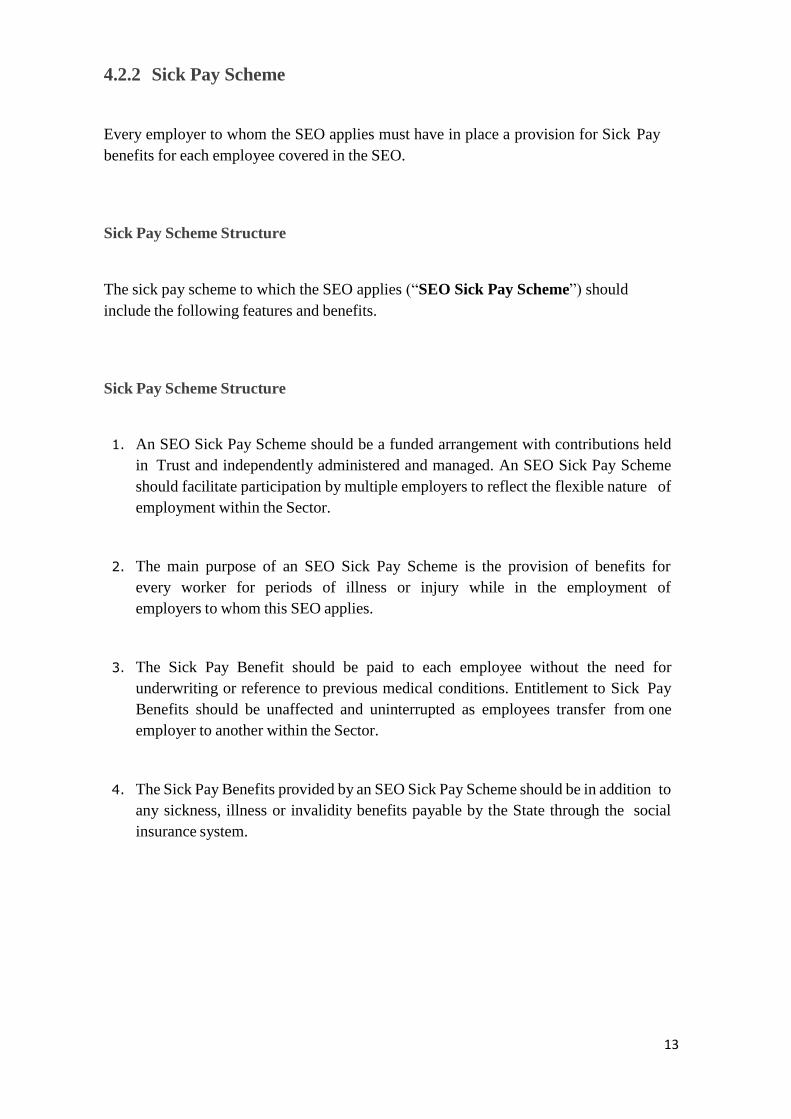
4.2.2 Sick Pay Scheme
Every employer to whom the SEO applies must have in place a provision for Sick Pay
benefits for each employee covered in the SEO.
Sick Pay Scheme Structure
The sick pay scheme to which the SEO applies (“SEO Sick Pay Scheme”) should
include the following features and benefits.
Sick Pay Scheme Structure
1. An SEO Sick Pay Scheme should be a funded arrangement with contributions held
in Trust and independently administered and managed. An SEO Sick Pay Scheme
should facilitate participation by multiple employers to reflect the flexible nature of
employment within the Sector.
2. The main purpose of an SEO Sick Pay Scheme is the provision of benefits for
every worker for periods of illness or injury while in the employment of
employers to whom this SEO applies.
3. The Sick Pay Benefit should be paid to each employee without the need for
underwriting or reference to previous medical conditions. Entitlement to Sick Pay
Benefits should be unaffected and uninterrupted as employees transfer from one
employer to another within the Sector.
4. The Sick Pay Benefits provided by an SEO Sick Pay Scheme should be in addition to
any sickness, illness or invalidity benefits payable by the State through the social
insurance system.

14
Sick Pay Conditions & Benefits
5. Eligibility
Inclusion for Sick Pay Benefits will be automatic on becoming a member of an
SEO Sick Pay Scheme. No charges should be incurred by either employers or
members for Sick Pay benefit provision, other than the relevant contributions
required to provide the benefits.
6. Sick Pay Contributions
a) An SEO Sick Pay Scheme should be a contributory sick pay scheme with
contributions payable by both employers and employees.
b) A member shall not lose accrued Sick Pay Benefit rights or entitlements as a
result of changing employment within the Sector as accrued service will transfer
to the next employer to whom the SEO applies.
c) Employers who fail or neglect to make the authorised deduction shall be liable
for the total contribution required to ensure that the worker’s Sick Pay Benefits are
maintained in full for the period of service with them.
7. Relevant Benefits
a) An SEO Sick Pay Scheme shall provide for the payment of a standard Sick Pay
Benefit for a specified duration and the benefit and duration should be disclosed
to participating employers and members.
b) An SEO Sick Pay Scheme may include a waiting period during which a
member would not be entitled to any benefit from the scheme whilst initially
absent due to illness or injury. This waiting period should not exceed the first
five working days of disability.
c) An SEO Sick Pay Scheme should facilitate continuity of Sick Pay Benefit from
the Scheme from the first working day of disability where a claimant has
returned to work for a period of two working days or less. This is provided that
the sick pay entitlement from the scheme has not been exhausted by reference
to the duration limitations referenced earlier.
d) An SEO Sick Pay Scheme should facilitate provision of a Supplementary Sick
15
Pay Benefit if the claimant has no entitlement to Social Welfare benefit due to
inadequate number of Social Welfare contributions.
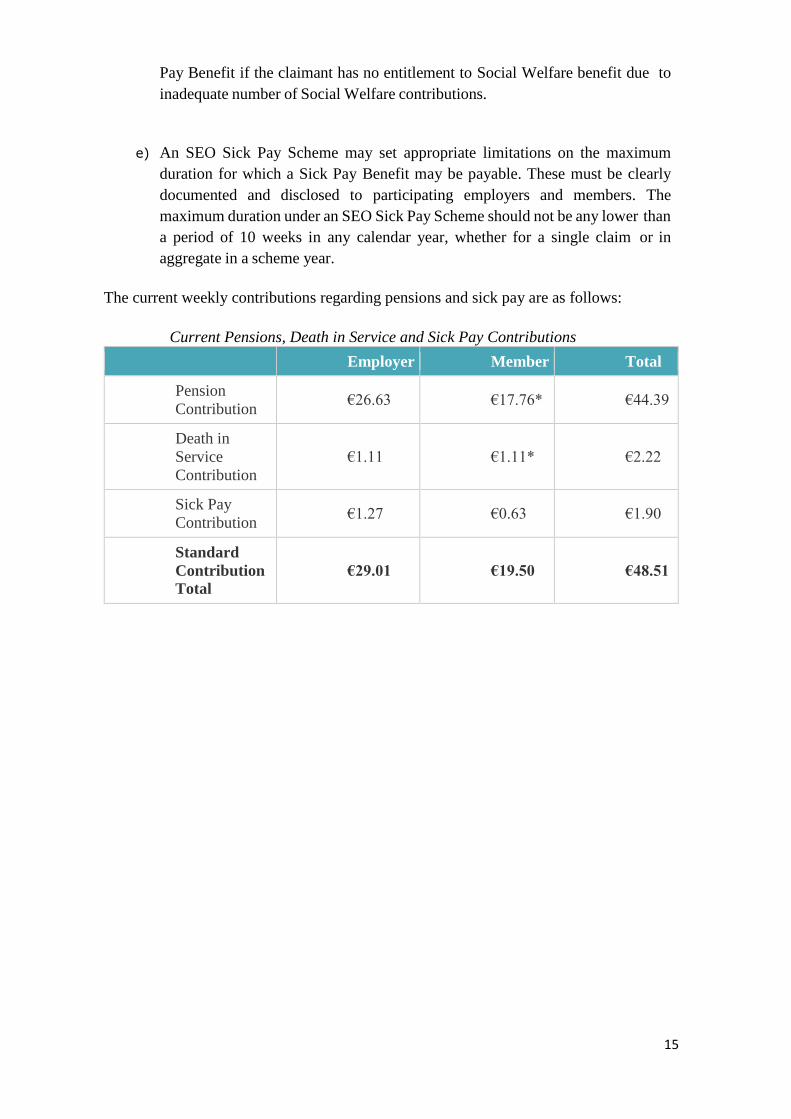
e) An SEO Sick Pay Scheme may set appropriate limitations on the maximum
duration for which a Sick Pay Benefit may be payable. These must be clearly
documented and disclosed to participating employers and members. The
maximum duration under an SEO Sick Pay Scheme should not be any lower than
a period of 10 weeks in any calendar year, whether for a single claim or in
aggregate in a scheme year.
The current weekly contributions regarding pensions and sick pay are as follows:
Current Pensions, Death in Service and Sick Pay Contributions
Employer Member Total
Pension
Contribution €26.63 €17.76* €44.39
Death in
Service
Contribution
€1.11 €1.11* €2.22
Sick Pay
Contribution €1.27 €0.63 €1.90
Standard
Contribution
Total €29.01 €19.50 €48.51
16
4.3 Dispute Resolution Procedures
CIF is seeking the inclusion of a procedure to resolve disputes concerning the terms of
the SEO as follows:
If a dispute occurs between workers to whom the SEO relates and their employers. No
strike or lock-out, or other form of industrial action shall take place until the following
procedures have been complied with. All sides are obliged to fully comply with the
terms of the Disputes Procedure.
a) The grievance or dispute shall in the first instance be discussed between the parties
concerned. If the dispute is not resolved it may be referred to the trade union
concerned and the relevant organisation representing employers where appropriate.
Notice in writing of the dispute shall be given by the individual concerned or his
trade union to the relevant organisation representing employers.
b) If the dispute is not resolved the issue shall be referred to the Workplace Relations
Commission and the Labour Court as appropriate.
c) Where the issue remains unresolved it shall be referred to the National Joint
Industrial Council (NJIC).
17
5. Industry Performance and Activity
5.1 Industry Performance Nationally
The widely held impression within Ireland at present is that the construction industry is
undergoing a period of sustained growth; however, the current growth rates actually
represent a recovery and do not match previous high levels of activity.
Key industry performance indicators are as follows:
The Central Statistics Office (CSO) National Accounts data for 2016 contain an
analysis of Gross Domestic Fixed Capital Formation (GDFCF) and shows the CSO
estimates for construction output. Excluding transfer costs (i.e. legal and other costs
associated with buying and/or selling property), construction output for 2016 was
€15.603 billion. This is made up as follows:
o Dwellings € 3.567 bn,
o Improvements € 1.933 bn, and
o Other Building and Construction €10.103 bn.
This level of output is 44% of the construction output of €35.5 billion in 20061 which
shows that despite the high growth discussed below, output is far lower than levels
previously experienced.
The breakdown of output in 2016 was also substantially different to what has long been
regarded as the normal proportions of construction output. For example, in 2016, new
housing accounted for 23% of output, whereas in 2000, new dwellings accounted for
43.3% of industry output and historically, under normal circumstances, dwellings
accounted for 40% to 50% of total output.
Both the CSO and industry commentators are in agreement that growth in 2016 was
substantially higher than in previous years. In 2014 and 2015, year-on-year growth as
measured by the CSO was 8.8% to 9.3% respectively; though in 2016, this accelerated
to 16.0%.
According to the CSO the level of output in new dwelling construction in 2016 was
30% higher than in 2015. The category “Other Building and Construction” includes
commercial and institutional building works and civil engineering works. The
quarterly Output in Building and Construction indices, a separate statistical release also
produced by the CSO, shows that growth in 2016 over 2015 was 16% in Non-
residential Building works and 8% in Civil Engineering projects.
There are two factors that contribute to growth in industry output; namely output or
volume growth and price growth. The CSO data in the quarterly Output in Building
and Construction indices provide output data on both a volume basis and a value basis.
1 Review of the Construction Industry 2006 and Outlook 2007-2009; DKM Economic Consultants Ltd. for the Department of the Environment, Heritage and Local Government; published September 2007
18
Analysis of the statistics shows that since 2010, the total value of industry output has
grown by 27.3% whereas the total volume has grown by 25.2%. The difference
between these two measures is the amount of growth that is attributable to price
increases. The CSO data show that in the six year period from 2010 to 2016, the
industry output increase has been substantially volume based.
Our analysis of the CSO Output in Building and Construction indices concludes that
price rises in construction output in 2016 were 4.5% compared to 2015.
This is reasonably consistent with tender price data from the Society of Chartered
Surveyors Ireland (SCSI) which showed tender price increases of:
- 5% in 2014;
- 5.5% in 2015, and
- 6.3% in 2016.
Tenders, particularly for large-scale infrastructure projects, can cover construction
activity over more than one year and the year-on-year rises may not be apparent
immediately in the CSO returns.
In summary, the CSO data show that while construction output is growing rapidly, it is
still far below previous levels and the growth in recent years has been very substantially
volume, not price, based.
We recognise that previous high levels of output are not sustainable in the long-term.
With regard to the potential scale of the industry and hence its potential for growth; we
note that:
The current level of construction output in Ireland represents some 7.1% of GNP2;
which is well below the generally recognised European sustainable level of 10% to
12% of GNP. Using this benchmark, if the industry were operating at “normal” levels
of activity, then the annual output of the Irish construction industry should be between
€20 and €24 billion. It may be contended that Ireland’s infrastructural and housing
needs are such that the higher of these two figures is the more realistic indicator;
If this level of notional output, i.e. €24 billion, were to be achieved and if the traditional
relativities between the different components of output were the same as in previous
years; then the current levels of non-residential and infrastructural activity would
remain broadly as they are at present, and new housing construction would increase to
something of the order of three times its current level.
The CSO data for the period from 2011 to 2016 show that total growth in construction
output has been of the order of 73% over that period, but higher rates of growth were
2 Some commentators measure construction activity as a percentage of GDP (Gross Domestic Product). In Ireland’s case, this alternative measure would be a lower percentage. For 2016 Ireland’s construction output represents 5.9% of GDP. The “normal” level of construction activity would equate to some 9.5% of GDP.
19
evident in housing output in 2015 and 2016 compared to other sectors. However, it must
be recognised that this rate of housing growth has come from a very low level of activity.
5.2 Industry Performance Regionally
During our consultations within the industry, many expressed severe concerns regarding
the applicability of the published CSO data to the country as a whole. The views expressed
are that the current growth in construction industry output is focused very much on the
greater Dublin region and that outside the fringes of the M50 orbital route, there is little
evidence of a pickup in business volumes. Indeed, outside Dublin, residential construction
activity is very limited and very highly dependent on one-off houses; commercial
construction is widely described as inactive and infrastructural activity is very limited.
In economic terms, Ireland today demonstrates many of the criteria that define a “twin
track” economy; i.e. one in which a particular region or area is growing or developing at a
significantly faster rate than other regions.
In recent years, the Dublin and Mid-east regions combined have experienced significant
growth compared to the other regions in the State. Much of this is attributable to Foreign
Direct Investment (FDI) in services and in high-technology manufacturing. These are
relatively high output types of industry relative to employment levels, and therefore, while
the total population and numbers at work in the Dublin and Mid-east regions have not
changed to any great extent, the economic output of the region has risen.
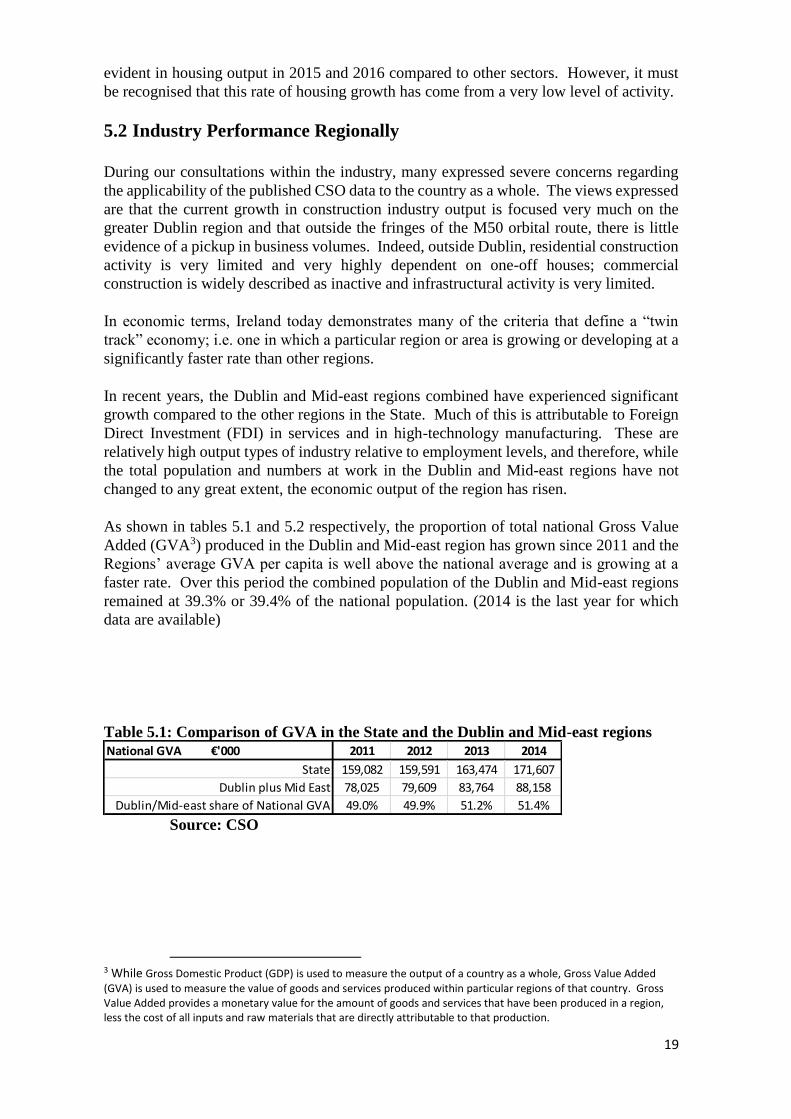
As shown in tables 5.1 and 5.2 respectively, the proportion of total national Gross Value
Added (GVA3) produced in the Dublin and Mid-east region has grown since 2011 and the
Regions’ average GVA per capita is well above the national average and is growing at a
faster rate. Over this period the combined population of the Dublin and Mid-east regions
remained at 39.3% or 39.4% of the national population. (2014 is the last year for which
data are available)
Table 5.1: Comparison of GVA in the State and the Dublin and Mid-east regions
Source: CSO
3 While Gross Domestic Product (GDP) is used to measure the output of a country as a whole, Gross Value Added (GVA) is used to measure the value of goods and services produced within particular regions of that country. Gross Value Added provides a monetary value for the amount of goods and services that have been produced in a region, less the cost of all inputs and raw materials that are directly attributable to that production.
National GVA €'000 2011 2012 2013 2014
State 159,082 159,591 163,474 171,607
Dublin plus Mid East 78,025 79,609 83,764 88,158
Dublin/Mid-east share of National GVA 49.0% 49.9% 51.2% 51.4%

20
Table 5.2: GVA per person in the State and in the Dublin and Mid-east region
Source: CSO
The CSO provides some disaggregated data for regional GVA, though it combines
construction with manufacturing. Figure 5.1 following shows that in 2011 and 2012, GVA
in these sectors performed in a similar manner to the State as a whole; but in 2013, the last
year for which disaggregated data are available, Dublin and the Mid-east showed growth
in these economic sectors whereas the State as a whole saw a marginal decline.
Figure 5.1: GVA in Manufacturing and Construction in the State
and in Dublin and Mid-east regions combined
Source: CSO
In economic terms, Dublin and the Mid-east have clearly outperformed the rest of the State
in the period from 2011 to 2014 and the indicators are that this level of outperformance is
likely to continue in the short to medium term, particularly in the construction sector.
Regional Employment and Incomes
In the 2011 Census, the CSO found that 25% of persons working in Dublin are normally
resident outside Dublin City and suburbs. There is much movement into and out of the
counties that comprise the Dublin and the Mid-east; but the census clearly shows that there
is a substantial daily migration of people into Dublin.
Our consultations show that such daily migration is a major factor in the construction sector
at present; with many craftspeople and operatives commuting from within Leinster to
Dublin and its environs. This is attributed to the lack of job opportunity in areas outside
Dublin.
The CSO estimates of Household Income by County and Region for 2014 showed that total
income per person in Dublin was €30,061, or just over 18% higher than the national average
of €25,435. This was after taking account of social welfare transfers. Just 27% of these
GVA per person 2011 2012 2013 2014
State average €34,773 €34,804 €35,464 €37,186
Dublin plus Mid East €43,374 €44,153 €46,213 €48,582
Dublin/Mid-east as % of State 124.7% 126.9% 130.3% 130.6%

21
transfers made in the State are provided to families in Dublin. It is clear that disposable
incomes are much higher in Dublin than in the rest of the State.
5.3 Prospective Construction Activity
Activity projections for the medium term are based partly on Government policy and
budgets for residential and infrastructure provision.
Estimating future levels of new dwelling construction is a complex issue as demand is
dependent on a wide range of factors, including affordability and the consumers’ ability to
finance mortgages. On the supply side, issues such as access to finance and land
availability exist. We assume that housing construction will increase by some 15% per
annum to 2021 to close to 31,500 dwelling units. We appreciate this may be conservative
given the national requirement.
There will be a substantial increase in office construction, but this is anticipated to focus
on Dublin where in excess of 700,000 sq. m. of space is planned for the next three/four
years. In tourism, an estimated 4,200 hotel rooms have been granted planning permission
in Dublin.
Foreign Direct Investment (FDI) appears to be quite strong with major investments in data
centres scheduled; though most of these are in the greater Dublin region, where the
infrastructure is more suitable. In addition, more than €7 billion in funding is expected to
be provided by the Ireland Strategic Investment Fund (ISIF) over the next three to five
years. These projects have been in progress for some time and it has been noticed that
multi-national enquiries have tapered off in the very recent past. This is attributed to
uncertainty arising from the change in the presidency in the United States and its future
policy towards overseas investment.
Finally, the Exchequer Capital Programme amounts to €4.46 billion per annum on average
to 2012.
In summary, the future prospects for the industry appear strong, but prospective growth
can be diminished if demand for dwellings, office space or industrial buildings is reduced
by an uncompetitive construction sector.
Key Future Risks
Key risks to future growth include:
The impact of Brexit, especially if investment from UK investors and finance houses
is reduced. This could lead to projects not starting on account of a lack of finance;
Delays in delivering the policy targets and investment provisions in the Government’s
Capital Plan and the Action Plan for Housing and Homelessness;
Potential reductions in future multi-national FDI; and
Cost increases as the industry expands over the coming years, and labour, materials and
land costs come under pressure or become more difficult to source.
22
6. Industry Structure and Pay Rates and Comparisons
6.1 Industry Representation
Employment in the construction industry was of the order of 135,000 persons over 2016.
The CSO does not disaggregate this figure into different categories, but if one excludes
professionals such as architects and quantity surveyors and other non-site staff who are not
part of the classes of employee under consideration for this proposed SEO; then we
estimate that employment of relevant craft, GOs and apprentices is between 50,000 and
56,000 persons. These persons account for close to 40% of construction employment.
The CIF represents employers employing some 20,600 staff or close to 40% of the sector’s
employment.
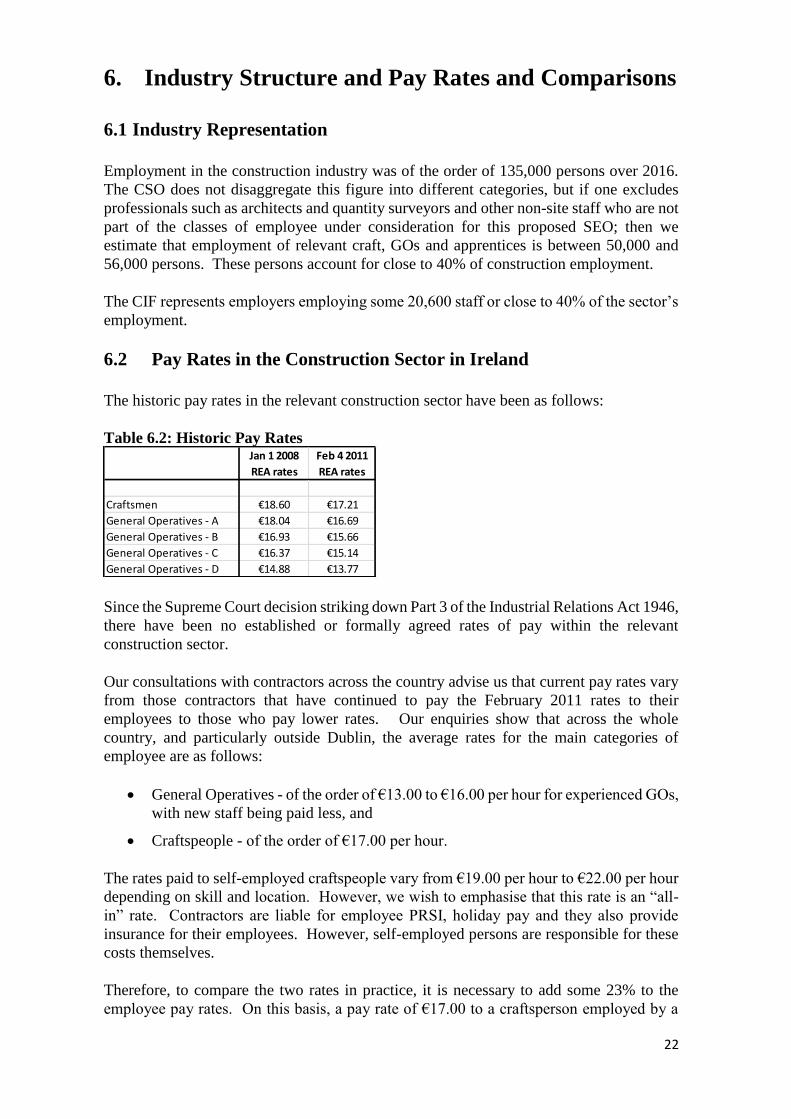
6.2 Pay Rates in the Construction Sector in Ireland
The historic pay rates in the relevant construction sector have been as follows:
Table 6.2: Historic Pay Rates
Since the Supreme Court decision striking down Part 3 of the Industrial Relations Act 1946,
there have been no established or formally agreed rates of pay within the relevant
construction sector.
Our consultations with contractors across the country advise us that current pay rates vary
from those contractors that have continued to pay the February 2011 rates to their
employees to those who pay lower rates. Our enquiries show that across the whole
country, and particularly outside Dublin, the average rates for the main categories of
employee are as follows:
General Operatives - of the order of €13.00 to €16.00 per hour for experienced GOs,
with new staff being paid less, and
Craftspeople - of the order of €17.00 per hour.
The rates paid to self-employed craftspeople vary from €19.00 per hour to €22.00 per hour
depending on skill and location. However, we wish to emphasise that this rate is an “all-
in” rate. Contractors are liable for employee PRSI, holiday pay and they also provide
insurance for their employees. However, self-employed persons are responsible for these
costs themselves.
Therefore, to compare the two rates in practice, it is necessary to add some 23% to the
employee pay rates. On this basis, a pay rate of €17.00 to a craftsperson employed by a
Jan 1 2008
REA rates
Feb 4 2011
REA rates
Craftsmen €18.60 €17.21
General Operatives - A €18.04 €16.69
General Operatives - B €16.93 €15.66
General Operatives - C €16.37 €15.14
General Operatives - D €14.88 €13.77
23
contractor has a labour cost equivalent to €20.91. From this we deduce that irrespective of
whether the persons working on a construction site are direct employees or are self-
employed, there is little if any difference in terms of the overall labour cost to the contractor
at present.
In this context we also note that those consulted say that there is no difficulty in obtaining
employees, whether directly employed or as sub-contractors. We refer to the public
statement of the CEO of Cairn Homes, who said that reports of skills shortages in the
industry were “a little bit of a myth”, adding that “We are certainly not seeing any pressure,
if anything, it’s the opposite.4”
The CSO Live Register data for February 2017 show that out of a total of 275,093 persons
on the register, 50,213 people are classified as Craft or Craft related. While not all are
construction craftspeople, we believe that a large proportion is.
6.3 Future Labour Needs in the Construction Sector
While the experience of those working in the industry is that construction workers are
reasonably available at present, we recognise that as the industry continues its recovery,
additional staff will be required to meet demand. It has been estimated that by 2020,
assuming that the industry achieves something like its expected level in a normally
operating economy, an additional 87,200 jobs over 2015 employment levels will be
generated; bringing the numbers employed in the sector to some 212,700.5 By Quarter 4
of 2016, employment in the industry had reached 138,2006; implying future job creation of
the order of 75,000 persons.
Currently, there are 275,093 persons on the Live Register and of these; the following broad
categorisations contain persons with construction experience:
Craftspeople 50,213
Plant/Machine Operators 43,922
Other 32,852
Total 126,987
We are fully cognisant that not all of these persons have construction industry experience;
the CSO data are not disaggregated sufficiently to allow a detailed analysis to be made.
The ESRI7 has projected that growth in construction employment will be 20,000 jobs from
Q4 of 2016 to the end of 2018; and that the national unemployment rate will be 5.6% at the
end of 2018.
The ESRI goes on to state that the “growing relevance of the construction sector may give
rise to productivity related issues in the economy. It will be recalled that one of the main
reasons for the substantial deterioration in the competitiveness performance of the Irish
4 Irish Times, March 10 2017
5 Demand for Skills in Construction to 2020; DKM Economic Consultants for the CIF; 2016
6 CSO data from the Quarterly National Household Survey for Q4 2016
7 Quarterly Economic Commentary Spring 2017
24
economy in the 2000s was the disproportionate role played by the construction sector. The
increased level of construction activity could also cause the unemployment rate to reduce
faster than envisaged. If unemployment were to fall below 5.5 per cent this would almost
certainly confirm that the domestic economy is overheating. This would then argue for a
contractionary budgetary policy aimed at taking some of these pressures out of the
economy.”
However, other economic projections are less optimistic than the ESRI in respect of
unemployment. The Department of Finance projects an unemployment rate of 7.3% for
the end of 20188; a substantially higher figure than the ESRI in relative terms. The key
difference is that the Department does not regard the prospects for growth in construction
activity to be as high as the ESRI does; and other industry commentators agree with this
more conservative view.
Notwithstanding this degree of uncertainty, we submit to the Court that substantial
increases in construction labour costs at this time would exacerbate productivity and
competitiveness pressures at a time when there is substantial uncertainty about the future
of the international economy and the effects on the Irish economy. We note, for example,
that there are fears within the UK construction industry that as many as 175,000 EU
workers currently working in the industry may leave the UK as a result of Brexit. This
comes from a combination of concerns about residency rights and also what has in effect
been a 15% reduction in pay rates for those coming from the Eurozone due to the fall in
the value of sterling.
6.4 Comparative Pay Rates in Irish Public Bodies
Pay rates in the public sector are based on a scale of rates that can include up to 15 points
or increments. Not all increments are awarded on an annual basis; some are awarded in
shorter time scales.
The published pay rates for a number of Irish public bodies for 2016 are shown in table 4.3
hereunder:
8 Budget 2017: Economic and Fiscal Outlook; Dept of Finance; 2016
25
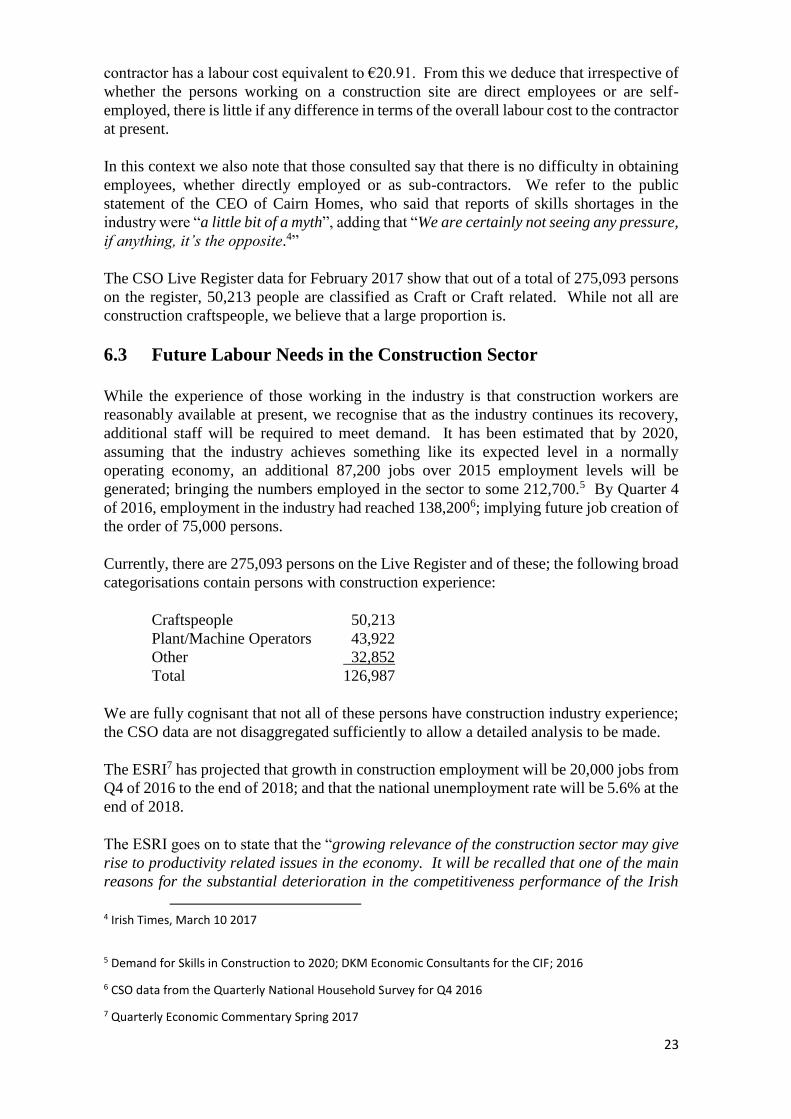
Table 6.3: Public Sector Pay Rates 2016
Source: Individual Organisation Publications
It is our understanding that these rates will be augmented by an increase of €1,000 per
annum in April 2017. This is equivalent to €0.50 per hour on the rates shown above.
The annual income for Craftspeople, based on these rates, is of the order of
€36,000/€37,000 per annum. The average for GOs is about €30,000.
At these levels of income, the relevant staff are not yet in receipt of full pay restoration in
the public sector as provided for under the 2015 LRA Restoration. Staff on €30,000 have
received restoration of 79% of reductions, but Craftspeople at the €36,000/€37,000 pay
level have received of the order of 50% restoration.
In our view, a claim for full restoration at this time would be in excess of current public
body rates.
6.5 Comparative Pay Rates in Industry
Data on earnings for Quarter 4 of 2016 recently released by the CSO show that construction
earnings are on a par with industry earnings for small companies; i.e. up to 50 employees;
but for larger enterprises, weekly earnings in construction were substantially higher that
industrial earnings.
The hours worked in construction were marginally higher than in industry and these do not
explain the differences shown in table 4.4 following. For enterprises of 50 to 250
employees, construction pay was 121% of industrial pay and for enterprises over 250
people; construction pay was 110% of industrial pay.
Start Mid-point Top
Local Authorities
Craftworkers mates €12.51 €14.35 €14.71
GOs (outside Dublin) €12.70 €14.39 €14.71
Labourers (outside Dublin) €14.11 €14.43 €14.71
HSE
Craftsmen €15.46 €17.54 €18.17
Craftsmen's mates €12.55 €14.40 €14.76
Builders Labourers €12.33 €14.19 €15.20
General Labourers €12.33 €14.19 €15.20
Builders Labourers Non-Dublin
Non-paypath€12.50 €14.18 €14.50
General Labourers Non-Dublin
Non-paypath€12.50 €14.18 €14.50
University
Craftsmen €17.12 €17.71 €18.11
General Operatives €13.71 €14.04 €14.36

26
Table 6.4: Comparison with Industry
Source: CSO
The differences in hours worked do not account for all of the differences in pay.
Enterprise size Constr Industry
2016Q4 2016Q4
Under 50 Average Weekly Earnings (Euro) 658.62 648.15
Average Weekly Paid Hours (Hours) 35.50 36.10
Average Hourly Total Labour Costs (Euro) 20.67 21.00
50 - 250 Average Weekly Earnings (Euro) 915.32 757.20
Average Weekly Paid Hours (Hours) 40.40 38.50
Average Hourly Total Labour Costs (Euro) 25.83 23.69
Greater than 250 Average Weekly Earnings (Euro) 1,119.00 1,012.73
Average Weekly Paid Hours (Hours) 40.80 39.10
Average Hourly Total Labour Costs (Euro) 31.68 32.84
27
7. Economic Impact of Pay Rate Changes
7.1 Impact on Employment in the Public Capital Programme
The CIF engaged an independent assessor9 to estimate the employment impact of potential
future pay increases of the sector in question. In order to do so, the assessor made a number
of assumptions about the future for construction industry output and other factors as
follows:
1. The assessment is restricted to the sector under consideration, i.e. craftspeople, GOs
and apprentices in the broad civil engineering sector and building sectors;
2. In the first instance consideration is given to the Government Capital Programme as
shown in Budget 2016 and which covered the Public Capital programme for the period
from 2016 to 2021.
3. It is assumed that the future expenditure figures shown in the Programme will not vary.
This infers that if costs are higher than anticipated, Exchequer expenditure will not
change but the deliverables from the Programme will be reduced.
4. Table 7.1 following shows the estimated impact of a once-off construction pay increase
of 10% in 2017 on employment on public sector projects over the period 2017 to 2021.
5. The first line in table 7.1 overleaf shows the overall capital expenditure as in the
published Programme. This amount is €3.97 billion for 2017.
6. The Programme foresees two types of employment being generated by the Programme;
namely construction jobs and jobs in the supply sector, such as providers of machinery
and equipment. Line 2 in table 7.1 shows the total number of jobs arising from the
Programme. For 2017 this is 47,640 jobs.
7. The Programme states that the average number of construction jobs generated will be
45,000. We assume that the expenditure will be consistent between construction and
non-construction investment and from this we deduced the annual number of
construction jobs as shown in line 3 of table 7.1. For 2017, we deduce the number of
construction jobs to be 38,502 in total.
8. These 38,502 construction jobs include professional and other roles that are not part of
the proposed SEO. Therefore to focus on the relevant sector, we deducted these from
the total construction employment, noting that public sector construction includes a
high proportion of civil engineering and infrastructural projects as well as building
works such as housing and other buildings such as hospitals. Therefore we concluded
that employment of the relevant types of workers on public sector works would amount
to 50% of construction employment. Thus we show in line 4 of table 7.1 that civil
9 Irida Consulting Limited
28
engineering and building works employment on public sector projects will be 19,251
in 2017.
9. Next we took industry data to calculate the annual labour cost per employee. This is
based on an hourly pay rate of €16.00 on average plus 23% for other costs such as
PRSI, holiday pay, sick pay, insurance, etc. This provides an income of €37,660 for
2017 as shown in table 7.1 below.
10. Using this Average Annual Labour Cost and the number of relevant construction jobs
estimated in the Programme, we calculated how much of the Programme’s total
expenditure is due to construction labour costs for the relevant sector. This amounts to
€725 million in 2017 and rises to €986 million by 2021. This implies a labour cost
proportion of 37% of projects.
11. We then assumed that a one-off pay increase of 10% is made in 2017. It is assumed
that this level of increase will have a proportional impact on other labour costs such as
pension contributions, sick pay, etc.
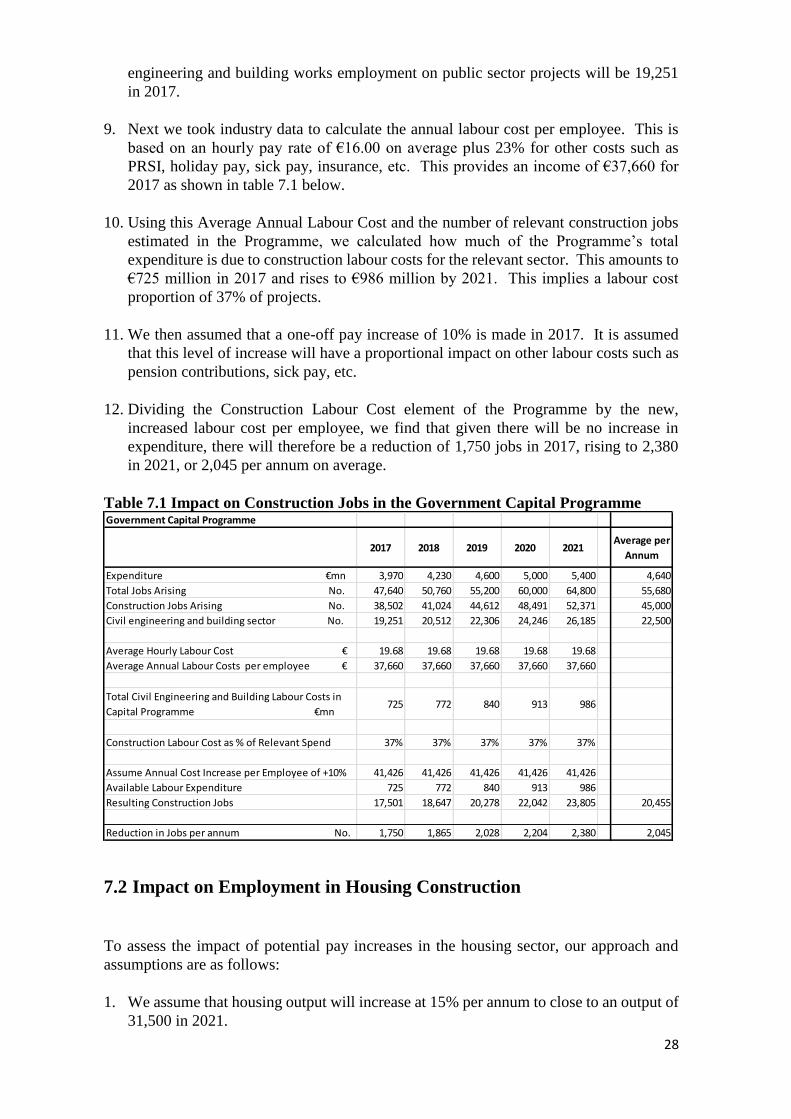
12. Dividing the Construction Labour Cost element of the Programme by the new,
increased labour cost per employee, we find that given there will be no increase in
expenditure, there will therefore be a reduction of 1,750 jobs in 2017, rising to 2,380
in 2021, or 2,045 per annum on average.
Table 7.1 Impact on Construction Jobs in the Government Capital Programme
7.2 Impact on Employment in Housing Construction
To assess the impact of potential pay increases in the housing sector, our approach and
assumptions are as follows:
1. We assume that housing output will increase at 15% per annum to close to an output of
31,500 in 2021.
Government Capital Programme
2017 2018 2019 2020 2021Average per
Annum
Expenditure €mn 3,970 4,230 4,600 5,000 5,400 4,640
Total Jobs Arising No. 47,640 50,760 55,200 60,000 64,800 55,680
Construction Jobs Arising No. 38,502 41,024 44,612 48,491 52,371 45,000
Civil engineering and building sector No. 19,251 20,512 22,306 24,246 26,185 22,500
Average Hourly Labour Cost € 19.68 19.68 19.68 19.68 19.68
Average Annual Labour Costs per employee € 37,660 37,660 37,660 37,660 37,660
Total Civil Engineering and Building Labour Costs in
Capital Programme €mn725 772 840 913 986
Construction Labour Cost as % of Relevant Spend 37% 37% 37% 37% 37%
Assume Annual Cost Increase per Employee of +10% €41,426 41,426 41,426 41,426 41,426
Available Labour Expenditure €mn725 772 840 913 986
Resulting Construction Jobs 17,501 18,647 20,278 22,042 23,805 20,455
Reduction in Jobs per annum No. 1,750 1,865 2,028 2,204 2,380 2,045
29
2. We assume that as in the case of the Public Capital Programme, if construction costs
are higher than anticipated, expenditure on the part of the purchasers will not change
and so the number of dwellings delivered will be reduced. We will discuss alternative
assumptions later in this section.
3. Our consultations advise us that the average labour content in new dwelling
construction is of the order of 42% of total build cost. This allows for pay and non-pay
labour costs such as pensions and also for cases where labour-only sub-contractors are
employed.
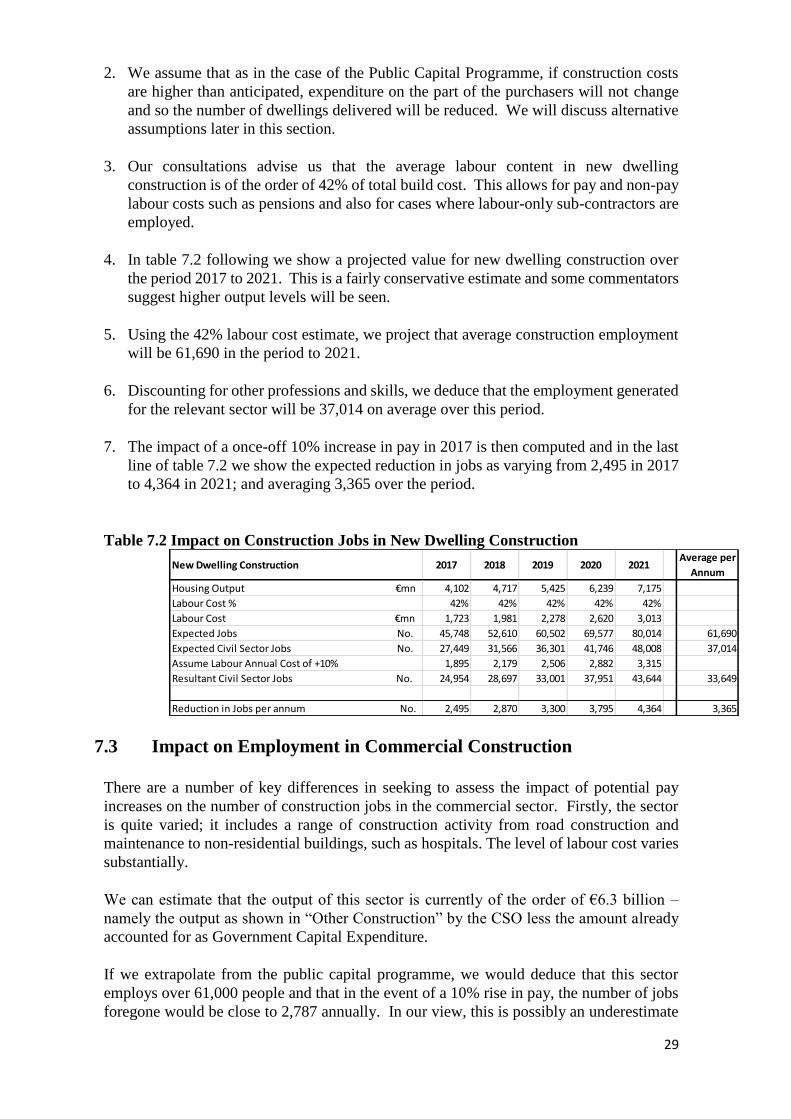
4. In table 7.2 following we show a projected value for new dwelling construction over
the period 2017 to 2021. This is a fairly conservative estimate and some commentators
suggest higher output levels will be seen.
5. Using the 42% labour cost estimate, we project that average construction employment
will be 61,690 in the period to 2021.
6. Discounting for other professions and skills, we deduce that the employment generated
for the relevant sector will be 37,014 on average over this period.
7. The impact of a once-off 10% increase in pay in 2017 is then computed and in the last
line of table 7.2 we show the expected reduction in jobs as varying from 2,495 in 2017
to 4,364 in 2021; and averaging 3,365 over the period.
Table 7.2 Impact on Construction Jobs in New Dwelling Construction
7.3 Impact on Employment in Commercial Construction
There are a number of key differences in seeking to assess the impact of potential pay
increases on the number of construction jobs in the commercial sector. Firstly, the sector
is quite varied; it includes a range of construction activity from road construction and
maintenance to non-residential buildings, such as hospitals. The level of labour cost varies
substantially.
We can estimate that the output of this sector is currently of the order of €6.3 billion –
namely the output as shown in “Other Construction” by the CSO less the amount already
accounted for as Government Capital Expenditure.
If we extrapolate from the public capital programme, we would deduce that this sector
employs over 61,000 people and that in the event of a 10% rise in pay, the number of jobs
foregone would be close to 2,787 annually. In our view, this is possibly an underestimate
New Dwelling Construction 2017 2018 2019 2020 2021Average per
Annum
Housing Output €mn 4,102 4,717 5,425 6,239 7,175
Labour Cost % 42% 42% 42% 42% 42%
Labour Cost €mn 1,723 1,981 2,278 2,620 3,013
Expected Jobs No. 45,748 52,610 60,502 69,577 80,014 61,690
Expected Civil Sector Jobs No. 27,449 31,566 36,301 41,746 48,008 37,014
Assume Labour Annual Cost of +10% 1,895 2,179 2,506 2,882 3,315
Resultant Civil Sector Jobs No. 24,954 28,697 33,001 37,951 43,644 33,649
Reduction in Jobs per annum No. 2,495 2,870 3,300 3,795 4,364 3,365
30
as private sector commercial construction has virtually no road building – that is covered
in the Government expenditure – and road building is less labour intensive.
7.4 Conclusion - Impact on Employment in Construction
In our analysis, the total employment in the three main sectors of construction activity as
shown in our analysis above amounts to just over 137,000 persons. This is very close to
the CSO statistic of employment of 138,200 in Q4 of 2016.
Our conclusion is that a once-off 10% increase in pay in 2017 will lead to a reduction in
future employment potential in the relevant civil engineering/building sector for
craftspeople; GOs and apprentices of some 8,197 jobs per annum on average for each year
in the period 2017 to 2021.
This estimate assumes that total industry output will grow from €15.6 billion in 2016 to
€19.4 billion in 2021. This projected level of output would be lower than what one would
expect in a normally operating economy.
Comments we wish to add to this analysis are as follows:
1. We are not saying that there will be job losses in the construction industry. Our analysis
concludes that in the event of a once-off 10% increase in pay, the number of additional
jobs created will be 8,197 less than a scenario in which there are no pay increases. This
equates to over 15% of current employment in the relevant sector.
2. The relationship between the prospective reduction in jobs and pay increases is to all
intents and purposes, a linear one. In other words, if the pay increase were 5% over
current levels, then the loss of future jobs would be 4,099.
3. Pay increases may also promote a greater focus on alternative construction methods,
particularly in housing. This would have a long-term impact on employment potential.
While we are not seeking to avoid future developments aimed at improving
construction methods, we believe that the consumer would benefit most by being
offered competitive alternatives to how their houses are built.
The impact of price increases is not easy to predict as the impact will be determined by the
consumer’s behaviour. It may be argued that price increases will be absorbed to some or
to a large extent by consumers and purchasers of buildings. However, generally consumers
either avoid the item that has risen in price or adjust to the price increases by redistributing
their expenditure. In that context, while some may argue that construction price increases
will not have a severe impact on future job creation, given the demand for construction
services, in that case, the increased construction costs will most likely be met by consumers
limiting their expenditure in other areas and the jobs impact may instead be seen in those
areas and not construction. If, for example, the sector affected were the hospitality sector,
then the jobs potential may be well in excess of that assessed, because wage levels tend to
be lower in that sector than in the construction sector.

31
8. International Comparisons
8.1 International Comparisons
Comparison of construction costs in a range of different countries has limited benefits as
some construction materials (e.g. ready mix concrete) are not tradeable; some cannot be
transported cost-effectively, except in limited geographic areas (precast concrete panels)
and foreign staff have to be paid the agreed national rates in the country where they are
working.
However, comparative construction costs can be important factors in, for example, FDI
(Foreign Direct Investment) deciding where they will locate. Other factors such as
availability of staff or tax rules are important, but set-up costs are important also.
In this regard a comparison with our near neighbours, Northern Ireland and Great Britain,
is advisable.
Indicative Building Costs for both Dublin and Belfast that have been published by the
consultancy practice AECOM, which operates in both cities, show that at the “top” end of
the market costs for certain types of building works can be reasonably similar in both cities.
In some areas there are substantial differences. The AECOM costs provide the following
key comparisons:
In residential construction, new apartment and house costs in Belfast tend to cost much
less than in Dublin (running from 16% to 20% at the lower level) but as specification
and costs rise, the difference falls to the order of 10%.
In Healthcare and Education (hospitals, nursing homes, schools) costs at the upper end
of the scale are not significantly different, but at the lower cost end, the difference is of
the order of 20%, with Belfast being the less expensive.
In Commercial offices, the shell and core costs in Belfast are of the order of 20%
cheaper than in Dublin and fit-out costs range from 10% to 30% cheaper in Belfast,
with the difference falling as the specification becomes higher.
In industrial buildings, taking the high-specification factory, the differences for
construction and fit-out combined, range from over 20% at the lower end and the
difference falling to 15% at the upper price end.
32
8.2 International Pay Rates
In terms of international competitiveness, we note that the euro equivalents for the
published BATJIC (Building and Allied Trades Joint Industrial Council) wage rates in
Britain for the year to June 25th, 2017 are:
Advanced Craft €13.56
Intermediate Craft €11.67
General Operative €10.35
These are substantially lower than the current rates in Ireland and we contend that further
increases will only tend to diminish our international competitiveness.
8.3 Competitiveness
In its report entitled “Ireland’s Competitiveness Challenge 2016” published in December
2016, the National Competitiveness Council said
“…a well-functioning housing and construction sector is critical to the overall health of
society and the economy. The current escalation in residential property costs represents
perhaps the greatest threat to Ireland’s competitiveness.”
The report continues
“Innovative approaches to construction offer a potentially significant tool to reduce costs
and boost productivity.
It is essential however, that as recovery takes hold, there is a relentless focus on cost
competitiveness for all aspects of the input costs to housing provision, including land,
building material and construction costs, labour, finance and taxes and charges.”
To champion innovation and provide exemplars for efficient delivery, the Council has
promoted the inclusion in the Action Plan for Jobs of a commitment that a competition will
be held to champion best practice, efficient and cost effective design to enable the delivery
of high quality homes in sustainable communities at an affordable level.
This initiative aims to come up with an innovative design and delivery approach to housing
that will be capable of delivering new homes for less than €200,000 (net of site cost). Given
that current estimates for the construction of new standard 3-bedroomed semi-detached
houses are some €225,000 (excluding VAT) it appears evident that new approaches will be
based on increased levels of off-site construction; which would have a negative impact on
site employment levels.
The Councils also notes that in 2014, output per hour worked in Ireland was highest in the
ICT sector (€133), manufacturing (€81); but lowest in construction (€12) and agriculture

33
(€9). Over the period 2009-2014, the main contributions to Irish productivity growth have
been in ICT and manufacturing with negative contributions from construction and financial
services.
As already stated above, increases in pay would only serve to diminish the productivity of
the sector.