submission to icasa: “icasa framework for introducing ... · executive summary ... summary of...
TRANSCRIPT
Page 1 of 23
Submission to ICASA: “ICASA Framework for introducing Local Loop Unbundling”
Government Gazette No. 34382, Notice 409, 22 June 2011 Submission Date: 14 September 2011
Page 2 of 23
Table of contents
Executive summary ......................................................................................................................... 3 1. Introduction ...................................................................................................................................... 4 2. Why unbundle the local loop? ......................................................................................................... 4 3.
3.1 Introduction ...................................................................................................................................... 4 3.2 Increase in innovation around the provision of broadband services ............................................... 5 3.3 Facilitate new entry by providing new entrants with the ability to learn about customers, build brands, and gain credibility with investors and lenders, so as to build competitive infrastructure .......... 5 3.4 Reduced pricing for downstream broadband services .................................................................... 6 3.5 Increased broadband penetration among consumers, and increased access to media rich content ..................................................................................................................................................... 7 3.6 Increased broadband penetration and employment among SMEs ................................................. 9 3.7 Direct job creation through investment in networks ...................................................................... 12 3.8 Are there alternatives to copper, now and in the future? .............................................................. 13 3.9 Will LLU harm Telkom? ................................................................................................................. 14 3.10 Economic research on the welfare effects of local loop unbundling ............................................. 16
Is the Authority’s approach to unbundling the local loop through the implementation of the 4.facilities leasing regulations reasonable, feasible and acceptable? ..................................................... 18
What form of local loop unbundling do stakeholders realistically favour in the South African 5.market? ................................................................................................................................................. 20
What other cost items should be included in each form of local loop unbundling? ...................... 21 6. Should a standardised ordering and specifications system be developed? ................................. 22 7. In the event that an access line deficit is identified, would you be willing to contribute to an 8.
access line deficit recovery scheme? ................................................................................................... 23 Conclusion ..................................................................................................................................... 23 9.
List of Tables and Figures Figure 1: Internet Video growth in the context of total IP traffic growth in South Africa, 2010 – 2015 (Petabytes/month) ................................................................................................................................... 9 Figure 2: Internet Video by type of access technology, 2010 – 2015 (Petabytes/month) ...................... 9 Figure 3: SME usage of broadband connections .................................................................................. 11 Figure 4: Fully unbundled local loop line monthly rental charge, incl. connection fee, USD (PPP) ..... 15 Figure 5: Fully unbundled local loop monthly rental charge, incl. connection fee, EUR (exchange rate only; no PPP) ........................................................................................................................................ 15 Figure 6: Welfare gains from Local Loop unbundling intervention........................................................ 16 Figure 7: Correlation between increase in unbundled local loops and broadband penetration ............ 17 Table 1: DSL high-end speeds and usage limits in 19 emerging markets ............................................. 5 Table 2: Summary of proportion of internet bandwidth costs accounted for by IPConnect .................... 7 Table 3: People connected at SMEs through DSL ............................................................................... 12 Table 4: Jobs created through LLU (see appendix B for detail) ........................................................... 12

Page 3 of 23
EXECUTIVE SUMMARY 1.
1. Neotel supports the Authority’s proposed approach to implementing Local Loop
Unbundling (LLU) in terms of the Facilities Leasing Regulations.
2. The key benefits of Local Loop Unbundling include:
2.1 An increase in innovation around broadband services provided using copper local loops.
2.2 Encourages new facilities based entry, by providing new entrants with the ability to learn about customers, build their brands, and gain credibility with investors and lenders, so as to build competitive infrastructure.
2.3 Reduced prices for broadband services by introducing competition for the provision of services to consumers and Small and Medium Enterprises (“SMEs”). Telkom’s IPConnect service costs up to 77% of the cost of internet access bandwidth, which is far in excess of the cost, and Telkom’s charges for DSL lines are significantly above cost. These prices will be brought down by new entrants.
2.4 Increased broadband penetration among consumers and greater access to media rich services, including Internet Video. 87% of consumer internet traffic will be internet video in 2015.
2.5 Increased broadband penetration among SMEs, which facilitates job creation, and provides SME employees with broadband internet access. 25% of South African SMEs do not have access to the internet. Of the SMEs that do have access to the internet, 73% rely on ADSL. More than half of Telkom’s DSL subscribers are SMEs. LLU will support SME development by expanding access to and reducing the cost of high capacity broadband internet.
2.6 Increases in investment and employment. Local loop unbundling will mean that operators like Neotel will need to roll out infrastructure to Telkom exchanges to provide backhaul services, which requires substantial investments and which will create significant numbers of jobs. More than 2,500 jobs will likely be created through Neotel alone building out infrastructure.
3. Neotel submits that LLU should be implemented in respect of Telkom’s copper last mile facilities, rather than in respect of wireless or fibre facilities. There are several wireless providers, and the rollout of fibre networks has only recently begun. It is also unclear what is meant by wireless LLU, unless this is supposed to cover wholesale mobile broadband access (APN services), which is already available from mobile providers. In the case of mobile wireless networks, there is no obvious facility that can be unbundled. It is likely that expanding the focus of the LLU process beyond the copper last mile will substantially delay the unbundling of Telkom’s copper local loop.
4. In respect of the Authority’s other key questions, Neotel’s responses are as follows:
4.1 All four of the LLU options should be implemented. The LLU options should be seen as complementary offers, rather than substitutes. Bitstream access should be made available on a regional basis as well as nationally.
4.2 The cost items identified by the Authority are broadly correct.
4.3 It is crucial that an Ordering Specifications System, that includes non-discrimination principles between Telkom’s supply of services to itself and to third parties, is implemented.
4.4 It is not correct to conflate universal access policies with the LLU process, and therefore there should not be an Access Line Deficit fund or charge. Copper is an
Page 4 of 23
expensive means of achieving universal access outcomes, and other technologies are better positioned to achieve this outcome.
INTRODUCTION 2.
5. Neotel thanks the Independent Communications Authority of South Africa (“the
Authority”) for the opportunity to comment on Government Gazette No. 34382, Notice 409, “ICASA Framework for introducing Local Loop Unbundling”, published on 22 June 2011.
6. Neotel also wishes to commend the Authority for the consultative and responsive manner of engagement on this critical issue. We believe that the finalisation of this process is long overdue and congratulate the Authority on its efforts in this regard.
7. Neotel supports the Authority’s proposed interventions in respect of Local Loop Unbundling and welcomes the intervention in the interests of competition and consumer welfare.
8. Neotel’s approach in this submission is to respond to each of the questions raised in the Authority’s discussion paper, after a discussion on the reasons to unbundle the local loop.
9. Confidential information supporting Neotel’s submission is provided in appendices A and B.
WHY UNBUNDLE THE LOCAL LOOP? 3.
3.1 Introduction
10. In the context of the substantial wireless broadband rollouts in South Africa, it is reasonable for the Authority and other stakeholders to ask the question: Why unbundle the copper local loop?
11. The key benefits of Local Loop Unbundling include:
11.1 An increase in innovation around broadband services provided using copper local loops.
11.2 Encourages new facilities based entry, by providing new entrants with the ability to learn about customers, build their brands, and gain credibility with investors and lenders, so as to build competitive infrastructure.
11.3 Reduced prices for broadband services by introducing competition for the provision of services to consumers and SMEs.
11.4 Increased broadband penetration among consumers and greater access to media rich services, including Internet Video.
11.5 Increased broadband penetration among SMEs, which facilitates job creation, and provides SME employees with broadband internet access.
11.6 Increases in investment and employment. Local loop unbundling will mean that operators like Neotel will need to roll out infrastructure to Telkom exchanges to provide backhaul services, which requires substantial investments and which will create significant numbers of jobs.
12. Each of these benefits is described in more detail next, followed by a discussion on whether there are alternatives to copper, now and in the future. This in turn is followed by

Page 5 of 23
a discussion on whether LLU will harm Telkom, and a discussion on economic analyses of the welfare effects of LLU.
3.2 Increase in innovation around the provision of broadband services
13. One of the main benefits of LLU is innovation in the provision of services over the copper last mile. New entrants as a matter of competitive necessity introduce new technologies and other innovations to markets traditionally served by incumbents, which have hitherto enjoyed the ‘quiet life’, sheltered from competition.
14. There are a range of broadband speeds, for example, that can be provided using xDSL services. Telkom’s maximum line speed for mainstream services, of 4mbps, compares poorly to line speeds offered in many other emerging markets (see Table 1 below).
Table 1: DSL high-end speeds and usage limits in 19 emerging markets
Country – Player Usage limit (2010) (GB)
Speed (Mbps)
UAE – Etisalat 20(n/a) 30
Egypt – Telecom Egypt 20(n/a) 24
Ukraine – Ukrtelecom U/L(n/a) 24 Poland – TP U/L(20) 20
Saudi Arabia – STC 20(20) 20
Bahrain – Batelco 100(80) 16
Pakistan – PTCL 20(20) 10
Brazil – Brasil Telecom U/L(n/a) 8 India – BSNL 60(50) 8
Jordan – Jordan Telecom 40(40) 8
Kenya – Telkom Kenya 20(20) 8
Russia – Comstar U/L(20) 8
Mexico – Telmex U/L(20) 5
Colombia – Telefonica U/L(20) 4 Malaysia – Telekom Malaysia 20(20) 4
South Africa – Telkom SA 5(5) 4
Philippines–PLDT 20(20) 3
Venezuela – CANTV U/L(20) 2
Average 27(27) 11.4
Extracted from: Ovum, August 2011, “Broadband pricing in Emerging markets in 2011”, reference code: OT00033-010, Table 2: DSL high-end service comparison
Note: U/L = Unlimited
15. While Telkom does offer 10Mbps line speeds at a limited number of exchanges, and is understood to be testing 20-40Mbps line speeds, if competition were introduced through LLU, technological improvements could be rolled out much more widely, and much more quickly.
3.3 Facilitate new entry by providing new entrants with the ability to learn about customers, build brands, and gain credibility with investors and lenders, so as to build competitive infrastructure
16. LLU provides new entrants with the ability to lease infrastructure that is hard to replicate, and gradually invest in infrastructure that can be used to compete with that of the incumbent.
17. Entry by a new facilities based entrant into the electronic communications sector requires substantial capital investments, and a long period of time. It is often not immediately apparent what customers want from a new entrant and what the costs of serving those

Page 6 of 23
customers are. Before capital is provided to roll out extensive new infrastructure, providers of capital, including shareholders and lenders, require an informed investment case. Local loop unbundling provides new entrants with the ability to learn about what customers want and how they can economically be served. This information facilitates further investment in infrastructure.
18. New entrants also face significant barriers in respect of customer trust, and the brands of incumbent operators. LLU provides new entrants with an opportunity to build their brands and gain trust among customers.
19. This theory is known as the “ladder of investment” in Europe or the “stepping stone” in the U.S.1 There is evidence that is consistent with the ladder of investment theory:2
19.1 Incumbents in Nordic countries (Sweden, Norway and Denmark) invested in infrastructure in neighbouring countries by taking advantage of LLU.
19.2 Significant fibre infrastructure investments are being undertaken by new entrants after LLU was made available, including Softbank in Japan, and Iliad, Neuf and Cegetel in France.
3.4 Reduced pricing for downstream broadband services
20. In order to buy an ADSL service from Telkom, customers pay for monthly line rental, the DSL line, and internet bandwidth. If the internet bandwidth is provided by a provider other than Telkom, Telkom provides wholesale access to the DSL line to the non-Telkom internet service provider. This is called IPConnect. The DSL line itself could be provided by Telkom directly, or provided by the new entrant, which leases the DSL line from Telkom. It is not clear what costs the DSL line charge and IPConnect cover. It is reasonable to expect that these costs cover investments by Telkom into DSL-specific infrastructure, including the cost of Digital Subscriber Line Access Multiplexers (DSLAMs) and backhaul from Telkom exchanges to points of aggregation at which the internet can be accessed. The costs of IPConnect and DSL line charges account for a substantial proportion of the costs of ADSL broadband services, which new entrants such as Neotel, could provide at significantly lower costs.
21. IPConnect accounts for between 14% and 77% of the cost of an uncapped service, and between 20% and 61% of a capped, per GB based service (See Appendix A, Part I, and Table 2 below). While the facilities seeker will incur costs to build out to Telkom's exchanges, we believe that these costs will be significantly lower than Telkom's charges for IPConnect.
1 For an overview see The Berkman Centre for Internet and Society at Harvard University, February
2010, “Next Generation Connectivity: A review of broadband internet transitions and policy from around the world”, available at: http://cyber.law.harvard.edu/pubrelease/broadband/, last accessed on 2 September 2011 (“The Berkman Centre Report”), p. 93. 2 See The Berkman Centre Report, cited above, p. 93.

Page 7 of 23
Table 2: Summary of proportion of internet bandwidth costs accounted for by IPConnect
Uncapped (Per Mbps) Capped (Per GB)
Line speed up to (kbps)
Unshaped, low contention ratio (1:10)
Shaped, high contention ratio (1:20)
GB Unshaped Shaped
384 18% 14% 1 20% 20%
1024 32% 19% 10 31% 26%
4096 77% 39% 50 61%
Note: Unshaped (low contention, uncapped) and capped (shaped) pricing from Mweb. Shaped (high contention, uncapped) and unshaped (capped) pricing from Afrihost. See Appendix A for details. Sources: Mweb website, http://www.mweb.co.za/ and Afrihost website, http://www.afrihost.co.za/ , last accessed on 31 August 2011.
22. In addition to IPConnect, Telkom charges high prices for wholesale DSL lines (see
Appendix A, part II below). It is not clear what costs IPConnect, and what costs the DSL line charge, are intended to cover. Nonetheless, we believe that the costs of installing DSL infrastructure, including the costs of providing backhaul services from Telkom’s exchanges to points of aggregation on the Neotel network, will be significantly lower than this.
23. The combination of lower internet bandwidth charges (for both capped and uncapped services) as well as lower DSL line charges will result in significantly lower DSL based broadband prices.
3.5 Increased broadband penetration among consumers, and increased access to media rich content
24. There are currently more than 4 million active copper lines in South Africa that could be used for xDSL services, only 751,625 of which are currently used for ADSL services3. In fact, there are significantly more than 4 million copper lines that could be used for xDSL broadband internet access, since Telkom has experienced significant declines in active subscriber lines over the last decade. In the year to 31 March 2000, Telkom reported that there were 5.5m active copper lines, 56% of which served residential customers4. There are therefore at least approximately 3.1m copper local loops available to households, and a further 2.4m available to businesses. Copper local loops could therefore still serve large numbers of South Africans.
25. Furthermore, consumers are increasingly accessing rich media content, including video services, over the internet. Video content can only really be delivered using fixed lines due to the bandwidth and quality required. According to research by Cisco Systems, Internet Video, which excludes video communication using services such as Skype and Google Talk, will account for the bulk of all Internet Protocol (“IP”) traffic in 2015 in South Africa (see “Video” on Figure 1 below). Internet video will account for 87% of all
3 See Telkom Group Annual report, 2011, p. 28.
4 See Telkom Group Annual report, 2001, p. 8.

Page 8 of 23
consumer internet traffic in 2015, which is a significant increase from 45% in 2010.5 60 billion minutes of Internet Video will cross the internet in South Africa each month in 2015, up from 3 billion minutes in 2010.6 Furthermore, Cisco predicts that Internet-Video-to-TV traffic will increase 41-fold between 2010 and 2015. The bulk of Internet Video will be delivered over fixed line Internet (designated as “Internet” in Figure 2 below), since these services require substantial bandwidth capacity, and good connection quality, to be delivered.
26. This suggests that increasing access to fixed broadband lines through local loop unbundling will have important benefits in respect of providing greater access to rich media content.
5 Source: Cisco Visual Networking Index Forecast Highlights, available at:
http://www.cisco.com/web/solutions/sp/vni/vni_forecast_highlights/index.html#~Country, last accessed on 13 September 2011. 6 Source: Cisco Visual Networking Index, available at:
http://www.cisco.com/web/solutions/sp/vni/vni_forecast_highlights/index.html#~Country, last accessed on 24 August 2011.

Page 9 of 23
Figure 1: Internet Video growth in the
context of total IP traffic growth in South Africa, 2010 – 2015 (Petabytes/month)
Figure 2: Internet Video by type of access technology, 2010 – 2015 (Petabytes/month)
Source: Cisco Visual Networking Index, available at: http://www.ciscovni.com/vni_forecast/advanced.html, last accessed on 24 August 2011
3.6 Increased broadband penetration and employment among SMEs
27. Local loop unbundling will support job creation through lower broadband prices for and expanded broadband penetration among, Small and Medium Enterprises (SMEs). SMEs in particular benefit from local loop unbundling because they are not able to use wireless broadband as an alternative, due to the substantial bandwidth volume requirements, and the limited capacity of wireless to deliver this bandwidth, due to limitations on spectrum availability.

Page 10 of 23
28. SMEs account for a significant proportion of South Africa’s GDP and employment7. And SMEs rely substantially on information and communication technologies to conduct their business. Access to broadband specifically provides:
28.1 Better ability to communicate with customers, including through email, maintaining a website and Voice over the internet services, such as Google Talk, and social media;
28.2 Access to information on markets, including prices for raw material inputs, final goods and services, potential customers; and
28.3 Access to low-cost computing infrastructure, including cloud storage and hosting (such as Google Apps), and cloud computing (such as Tata Communications InstaCompute).
29. A survey on the use of Information and Communication Technologies (ICTs) among 3,691 SMEs in 13 African countries (Botswana, Cameroon, Ethiopia, Ghana, Kenya, Mozambique, Namibia, Nigeria, Rwanda, South Africa, Tanzania, Uganda, and Zimbabwe) showed, among other things, that:8
29.1 ICTs are significant input factors for both formal and informal SMEs and contribute positively to revenue generation; and
29.2 ICT use increases labor productivity.
30. SMEs in South Africa rely heavily on ADSL services, and largely do not utilize mobile broadband as their primary form of broadband connectivity. World Wide Worx (“WWW”), which conducts regular surveys of SMEs in South Africa, explains that in 2009 there were, according to the Registrar of Companies, approximately 650,000 SMEs. WWW estimates that only 487,000 SMEs have access to the internet (i.e. 25% of SMEs do not have access to the internet at all). WWW estimates that, of these 487,000 SMEs, 73% of SMEs rely on ADSL broadband as their primary source of internet connectivity (see Figure 3 below).9 Only 8% of SMEs rely on wireless broadband as their primary form of internet connectivity.
31. SMEs account for a significant proportion of total internet connections: Telkom reported 647,462 subscribers in 2009 / 2010.10 The WWW data means that 55% of Telkom’s DSL subscribers are SMEs.11
7 Kongolo (2010), for example, estimates that SMEs account for between 51 and 57% of GDP, and
provide almost 60% of employment. See Kongolo, M., 2010, “Job creation versus job shedding and the role of SMEs in economic development”, African Journal of Business Management vol. 4(11), pp. 2288-2295, 4 September 2011, available at: http://www.academicjournals.org/ajbm/pdf/pdf2010/4Sept/Kongolo.pdf, last accessed on 2 September 2011. 8 See Esselaar, S, & Stork, C., 2008, “ICT Usage and Its impact on Profitability of SMEs in 13 African
countries”, Information Technologies and International Development, available at: http://itidjournal.org/itid/article/viewFile/246/116, last accessed on 2 September 2011. 9 See World Wide Worx, 2010, “Internet Access in 2010: A comprehensive study of the Internet
Access market in South Africa”. 10
See Telkom Annual Report, 2010, p. 80. 11
Note that Telkom’s 2011 Annual Report says that Telkom had 751,625 ADSL subscribers in the year to 31 March 2011. However, this is one year after the World Wide Worx survey was conducted, and so Telkom’s 2010 annual report contains the correct comparative data.

Page 11 of 23
Figure 3: SME usage of broadband connections
Source: World Wide Worx, 2010, “Internet Access in 2010: A comprehensive study of the Internet Access market in South Africa”, p. 79
32. World Wide Worx bases this research on an SME Survey of 2500 SMEs. Based on the research conducted since 2003 on SMEs, WWW’s view is that:
“The very fact that South Africa is an emerging economy means that every effort must be made to bring down costs of basic necessities of life and business. There is no question that broadband has become a basic necessity of business. The annual SME Surveys from 2003 to 2009, conducted by World Wide Worx on behalf of SME Insight, showed that ADSL was a major differentiator in competitiveness of small business.”
33. Currently, 25% of SMEs do not have internet access at all. Lower prices, greater competition, and increased innovation will result in increased broadband penetration among SMEs. This will have not only a positive effect on employment, productivity and revenue generation but provides broadband connections to the internet to employees themselves: Access to 355,000 DSL lines by SMEs in 2009 provided broadband internet access to 795,000 people (see Table 3 below).
ADSL, 73%
No connection, 10%
Wireless
broadband,
8%
Dial-up, 4%
No answer, 3% Leased line, 1% Satellite, 1%

Page 12 of 23
Table 3: People connected at SMEs through DSL
People connected to broadband internet access using DSL lines provided to SMEs
11% (39 000) connected only a single user 39,000
38% (134 900) connect an average of 1 additional person 135,000
15% (53 250) connect an average of 5 additional people 266,050
6% (21 300) connect an average of 10 additional people 213,000
2% (7100) connect an average of 20 additional people 142,000
Total people connected to DSL lines provided to SMEs 795,000
Source: World Wide Worx, 2010, “Internet Access in 2010: A comprehensive study of the Internet Access market in South Africa”, p. 83
34. Local loop unbundling will therefore have a substantial, positive impact on SMEs in South Africa, and the large number of South Africans employed by SMEs.
3.7 Direct job creation through investment in networks
35. In respect of direct job creation, a large number of unskilled workers will be employed as a consequence of the construction of networks to Telkom exchanges and subsequently as new entrants build their last mile infrastructure closer to customers. We estimate that between 40,090 and 642,019 job days will be created, depending on whether we build out to 20% or 40% of Telkom’s exchanges closest to Neotel’s existing infrastructure (see Appendix B below for details). If the entire build is completed in a year, this would result in as many as 2,693 full time jobs being created (see Table 4 below). This is before supervisory and managerial staff are employed, and a significant number of such people would need to be employed in respect of a project of this magnitude.
Table 4: Jobs created through LLU (see appendix B for detail)
Total job days
Number of full time jobs if build takes one year
Investment (Rm)
Build to 20% of Telkom's closest exchanges 40,090 168 70.1
Build to 40% of Telkom's closest exchanges 642,019 2,693 1,123.5
Source: Neotel analysis

Page 13 of 23
36. If more than one operator builds out to Telkom’s exchanges, then more than double the number of jobs would be created. Furthermore, if South Africa reaches the levels of unbundled local loops in the UK, then 60% exchange coverage might be reached, which would create significantly more jobs.12
37. As Neotel’s services provided using LLU expand, our staff complement will need to increase significantly to support additional customers and maintain infrastructure. Further jobs will be created in this way.
38. Furthermore, LLU will substantially increase investment in the sector. Depending on the proportion of exchanges build out to, and the number of operators deploying networks, these investments will likely result in billions of rands of investment into electronic communications network infrastructure (see Table 4 above and Appendix B below).
39. Investment in infrastructure of this nature would be greatly facilitated by the implementation of Guidelines for rapid deployment of electronic communications facilities, in terms of section 21 of the ECA. Neotel strongly encourages the Authority to support endeavours to develop and implement these guidelines.
40. Finally, Neotel wishes to draw the Authority’s attention to the fact that Neotel has a large engineering staff complement. Some of our staff members were employed by Telkom and have direct experience in the installation and provisioning of services relating to Telkom’s copper infrastructure. Neotel therefore has the technical capacity to make full use of Telkom’s copper local loops.
3.8 Are there alternatives to copper, now and in the future?
41. As discussed above, the main alternative to Telkom’s copper infrastructure is wireless broadband. However, Small and Medium sized Enterprises, due to their high bandwidth requirements, are not able to use wireless broadband. Furthermore, most IP traffic in 2015 will be for internet video, which requires large amounts of bandwidth and high quality connectivity, which cannot be delivered by wireless. The reason for this is that wireless capacity is physically constrained by the limited amount of radio frequency spectrum available. Therefore, wireless is unlikely to be an alternative for copper based ADSL services for some time to come, for consumers wanting access to Internet Video, and for SMEs.
42. Among others, the communications regulator in the United Kingdom, Ofcom, decided that wireless broadband is not a substitute for fixed broadband services, in its review of the wholesale local access market.13 Indeed, the incumbent operator in the UK, BT, agreed that mobile based local access should be excluded from the wholesale local access product definition, which includes loop-, cable- and fibre- based local access at a fixed location, over the four years following that market review (held in 2010).14
43. Fibre based broadband services are currently being invested in but are not an alternative currently for most potential customers. Neotel, for example, has developed a product
12 See Ofcom, 7 October 2010, “Review of the wholesale local access market, statement on market
definition, market power determinations and remedies”, paragraph 2.23. 13
See Ofcom, 7 October 2010, “Review of the wholesale local access market, statement on market definition, market power determinations and remedies”, see from paragraph 3.19. 14
See Ofcom report cited above, paragraph 3.41.

Page 14 of 23
called NeoBroadband Fibre, in addition to our NeoInternet services, which are largely provided over Fibre, and we have rolled out approximately 6,000 kilometres of fibre infrastructure to support all of our services. Neotel also plans to incrementally roll out fibre infrastructure with or without Telkom’s copper last mile. Nonetheless, Neotel’s capital budget in this financial year (the 12 months to 31 March 2012) is limited (see Appendix B, Part II), and it would take many years to reach the coverage reached by Telkom’s copper last mile infrastructure. As discussed above, Telkom has over 5.5 million copper lines.
44. Furthermore, BT in the UK intends to maintain its copper network for at least the next four years while it rolls out fibre connections.15 This suggests that copper will be a viable technology for a long time to come.
45. Alternatives to wireless and fibre technologies, such as broadband over powerlines or co-axial cable, are not currently offered in South Africa on a significant scale, and are therefore not alternatives to Telkom’s copper last mile infrastructure.
3.9 Will LLU harm Telkom?
46. Telkom has said in numerous fora that its local loops are not profitable, and that an access line deficit exists (This is discussed more in detail below under the Authority’s question on contributions to Access Line Deficits). We believe that closer examination of Telkom’s cost data will reveal that this is not the case.
47. To the extent that Telkom is, for example, measuring their cost of capital using the replacement cost of their entire copper network, then this will grossly overestimate Telkom’s costs. Very few companies on the JSE Securities Exchange would earn returns that exceed their cost of capital by this measure, and by that measure, most of those companies would have to shut down.
48. There are a range of mechanisms that Telkom could use to mitigate any revenue reducing effects of Local Loop Unbundling, as long as these are not implemented anti-competitively. Possible strategies for Telkom include (according to Ovum, which analysed potential incumbent strategic responses to LLU)16:
48.1 Launch new retail services, such as bundles of voice, data and content. These strategies have been successfully implemented in Portugal and Belgium.
48.2 Differentiate their customer service offering against new LLU entrants that have in the past delivered relatively poor customer service. Other service offerings, such as loyalty programmes, could be introduced.
48.3 Build attractive wholesale service offerings that deliver greater value than LLU does for potential new entrants.
48.4 Partner with new entrants to build higher bandwidth, differentiated services, such as Fibre last mile infrastructure. This was the approach of the Dutch incumbent, KPN, to Reggefibre, a new fibre based entrant. The Italian incumbent, Telecom
15 See Ofcom report cited above, paragraph 2.34 (for example).
16 See Ovum, 2009, “Incumbent strategies in response to Local Loop Unbundling”, prepared by David
James.

Page 15 of 23
Italia, has also adopted this approach with a new entrant, Swisscom subsidiary Fastweb.
48.5 Partner with new entrants to provide wholesale managed network services to entrants that do not wish to build and manage their own networks. BT, the incumbent fixed line operator in the UK, adopted this approach. Contracts provided in this way are now worth £1.8bn over their lifetimes (approximately R20bn) to BT.
49. Telkom has also recently launched a mobile service in response to declining fixed line revenues which will likely further mitigate revenue erosion experienced as a result of LLU.
50. Telkom therefore has a range of options open to it, and LLU therefore need not be harmful to its business.
51. Furthermore, Telkom’s anticipated wholesale LLU charge based on current pricing would be significantly higher than international benchmarks, and should therefore more than cover Telkom’s actual costs. Telkom is currently willing to provide a copper local loop to other operators for approximately R231 per month (see Appendix A, Part III).
52. If this were the price that Telkom were to offer a copper local loop on a wholesale basis for, it would be among the highest in the world. Whether this price is measured in terms of purchasing power parity (i.e. adjusting for relative price levels for all goods and services across countries) or in absolute exchange rate terms, it would be significantly higher than local loop prices in other countries (see Figure 4 and Figure 5 below).
Figure 4: Fully unbundled local loop line monthly rental charge, incl. connection fee,
USD (PPP)
Figure 5: Fully unbundled local loop monthly rental charge, incl. connection fee,
EUR (exchange rate only; no PPP)
Source for all data other than South Africa: Ovum, “Wholesale Broadband Access Benchmarks: Q2 2011”, Prepared by Matthew Howett, Charice Wang, Krishna Mohan, last published in June 2011. South Africa price is as described in text above, using Ovum exchange rates of R5.39/USD (PPP) and R9.81/Euro.
42.929.0
23.322.521.8
19.819.118.117.717.717.517.417.116.716.116.015.915.815.515.014.714.513.913.913.112.712.512.1
10.69.4
0 20 40 60
South AfricaMalaysia
FinlandMalta
CyprusCzech Republic
BahrainIreland
SingaporeNew ZealandLuxembourg
PortugalNorway
UKSlovenia
GermanyFrance
SwedenRomania
SwitzerlandGreece
ItalySpain
EstoniaBelgium
TurkeySlovakiaDenmark
AustriaNetherlands
23.619.9
17.816.9
16.115.615.515.314.914.814.414.1
13.212.812.812.412.211.811.811.611.6
10.810.710.610.3
8.98.78.5
7.77.67.5
0 10 20 30
South AfricaFinlandNorway
SwitzerlandCyprus
LuxembourgMalaysiaAustralia
IrelandNew Zealand
MaltaSwedenFrance
Czech RepublicGermany
UKPortugal
DenmarkItaly
BahrainSingapore
BelgiumSlovenia
GreeceSpain
RomaniaEstoniaAustria
SlovakiaTurkey
Netherlands
Page 16 of 23
53. It is therefore likely that, even if Telkom were to charge less than R231 per month, Telkom’s price would be high by international standards, and therefore more than likely to cover Telkom’s costs.
54. It is therefore highly unlikely that LLU will harm Telkom.
3.10 Economic research on the welfare effects of local loop unbundling
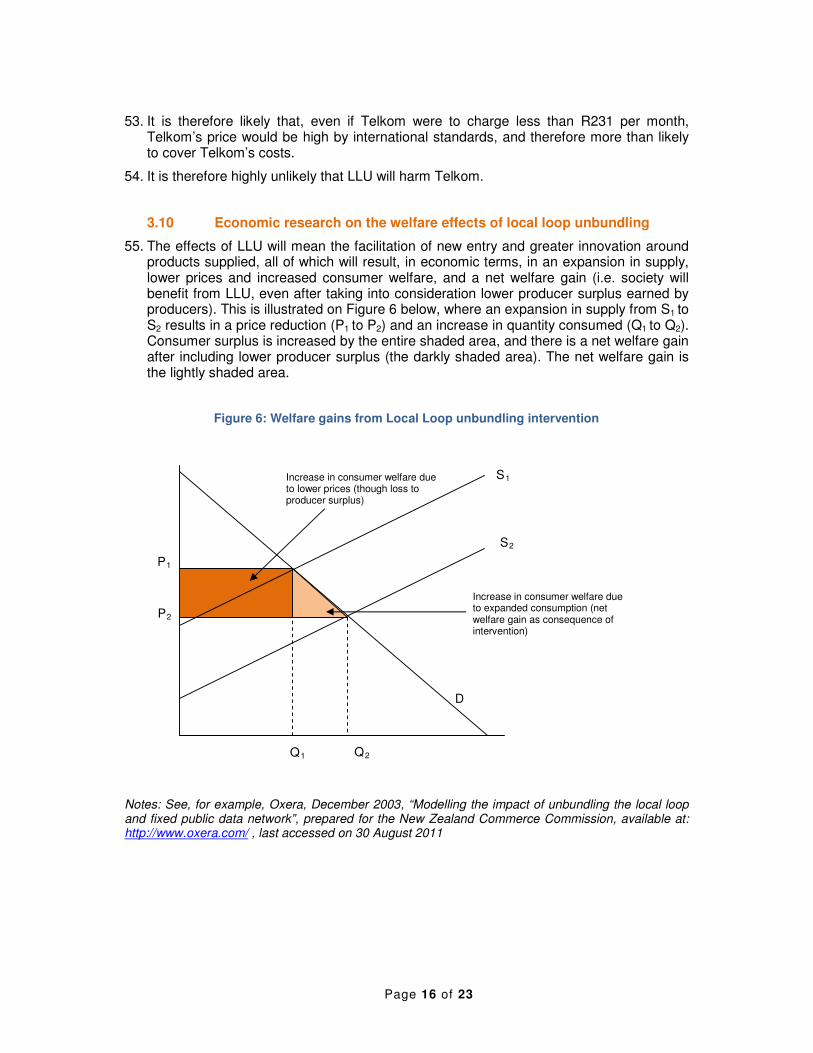
55. The effects of LLU will mean the facilitation of new entry and greater innovation around products supplied, all of which will result, in economic terms, in an expansion in supply, lower prices and increased consumer welfare, and a net welfare gain (i.e. society will benefit from LLU, even after taking into consideration lower producer surplus earned by producers). This is illustrated on Figure 6 below, where an expansion in supply from S1 to S2 results in a price reduction (P1 to P2) and an increase in quantity consumed (Q1 to Q2). Consumer surplus is increased by the entire shaded area, and there is a net welfare gain after including lower producer surplus (the darkly shaded area). The net welfare gain is the lightly shaded area.
Figure 6: Welfare gains from Local Loop unbundling intervention
Notes: See, for example, Oxera, December 2003, “Modelling the impact of unbundling the local loop and fixed public data network”, prepared for the New Zealand Commerce Commission, available at: http://www.oxera.com/ , last accessed on 30 August 2011
Increase in consumer welfare due to lower prices (though loss to producer surplus)
S2
S1
D
P2
P1
Q2 Q1
Increase in consumer welfare due to expanded consumption (net welfare gain as consequence of intervention)

Page 17 of 23
56. There is empirical evidence that suggests that LLU can expand access to broadband. Ovum, for example, is of the view that:17
“[Figure 7] illustrates how in most EU countries growth of broadband penetration between 2004 and 2008 has been fuelled by growth in the total number of unbundled lines (full and shared access). The only exceptions are the Netherlands, where the very high cable network density has limited the demand for local loop unbundling, and Ireland, where the popularity of unbundling has stayed constant as broadband penetration has grown”.
Figure 7: Correlation between increase in unbundled local loops and broadband penetration
Source: Ovum, 2009, “Incumbent strategies in response to Local Loop Unbundling”, prepared by David James, see Figure 1
57. There are substantial difficulties with cross-country analyses such as this one, discussed below in more detail. Nonetheless, Ovum’s research provides an indication of the potential positive effects of LLU.
17 Source: Ovum, 2009, “Incumbent strategies in response to Local Loop Unbundling”, prepared by David James.
Page 18 of 23
58. Telkom, in a presentation at a South African Communications Forum (SACF) workshop, held on the 14th of July, 2011, raised questions about whether indeed LLU had the intended effect on increased broadband penetration. Among others, Telkom quoted a 2005 paper by Hausman & Sidak on whether mandatory unbundling achieved its purpose.18 The problem with econometric studies of this nature is twofold (see, for example, Berkman Centre Broadband Final Report, an independent report prepared for the Federal Communications Commission in the USA, “the Berkman Report”19):
58.1 They often do not deal with the fact that technology is adopted over time. Adoption is usually slow at first, then it speeds up, and then it slows down again as the market matures. This is hard to account for in statistical analysis.
58.2 They are often unable to deal with institutional idiosyncrasies across jurisdictions. These studies find it difficult to control for the regulators’ differential ability to deal with incumbent responses to LLU.
59. The Berkman Report found that:
“Our most surprising and significant finding is that “open access” policies—unbundling, bitstream access, collocation requirements, wholesaling, and/or functional separation—are almost universally understood as having played a core role in the first generation transition to broadband in most of the high performing countries; that they now play a core role in planning for the next generation transition; and that the positive impact of such policies is strongly supported by the evidence of the first generation broadband transition.”
60. This suggests that Local Loop Unbundling will have significant, positive effects on broadband penetration, and that the Authority should vigourously pursue open access policies such as LLU.
IS THE AUTHORITY’S APPROACH TO UNBUNDLING THE LOCAL LOOP THROUGH THE 4.IMPLEMENTATION OF THE FACILITIES LEASING REGULATIONS REASONABLE, FEASIBLE AND ACCEPTABLE?
61. Telkom’s copper local loop facilities constitute “electronic communications facilities”
(“facilities”) as defined in section 1 of the Electronic Communications Act, no. 36 of 2005 (“the ECA”). As such, any request for a lease of Telkom’s copper local loop falls to be regulated under Chapter 8 of the ECA (electronic communications facilities leasing) and under the Facilities Leasing Regulations (Government Gazette no. 33252, Notice no. R. 468, published on 31 May, 2010).
18 See Hausman, J. & Sidak, J., 2005, “Did mandatory unbundling achieve its purpose? Empirical
evidence from Five Counties”, Journal of Competition Law and Economics, vol. 1, no. 1, pp. 173-245. See in particular section 4.14, the Annex: Econometrics Literature Review. 19
See The Berkman Centre for Internet and Society at Harvard University, February 2010, “Next Generation Connectivity: A review of broadband internet transitions and policy from around the world”, available at: http://cyber.law.harvard.edu/pubrelease/broadband/, last accessed on 2 September 2011.

Page 19 of 23
62. Section 43(1) of the ECA requires all electronic communications network service (“ECNS”) licensees to lease their facilities on request to any other licensee or licence exemptee, unless ICASA determines that such request is unreasonable.
63. The Authority’s approach to unbundling the local loop (“LLU”) through the implementation of the Facilities Leasing Regulations is therefore reasonable, feasible and acceptable.
64. Neotel further agrees with the Authority that the unbundling of the copper local loop has been the government’s policy since 2007, as a consequence of the Local Loop Unbundling Committee’s report20, and the then Minister of Communications’ policy decision that “…the unbundling process in South Africa should be urgently implemented and completed by 2011”.21
65. Neotel respectfully submits that the Authority and Licensees should at this stage focus on the unbundling of Telkom’s copper local loop rather than wireless or fibre local loops, for the following reasons:
65.1 There are currently a number of operators that offer wireless electronic communications services, and the Authority has recently intervened in respect of wholesale call termination markets in order to address competition issues in respect of voice services. These interventions, as well as the effects of licensing additional spectrum, should be allowed to take their course before further interventions are undertaken in respect of wireless electronic communications services.
65.2 It is also unclear what is meant by wireless LLU, unless this is supposed to cover wholesale mobile broadband access (APN services), which is already available from mobile providers. In the case of mobile wireless networks, there is no obvious facility that can be unbundled.
65.3 There are several nascent fibre networks currently under construction. The nascent competition developing among fibre providers should be allowed to continue before any decision is taken on unbundling fibre local loops. Furthermore, intervening in respect of unbundling fibre local access networks may discourage the investment currently being made into these networks.
65.4 Unbundling wireless and fibre local loops introduces substantial complexity into the Authority’s LLU process, which could substantially delay the unbundling of the copper local loop.
65.5 Furthermore, the Authority needs to strike a balance between increasing competition, and ensuring that incentives to invest are maintained. In respect of wireless local loops, there are fewer competition concerns at the retail level, and the Authority has begun to address competition concerns at the wholesale level in respect of voice services. Fibre local loops have only recently begun to be rolled out, and are currently being offered by several providers. The Authority should balance the reduction in incentives to invest in wireless and fibre local loops against the limited competition concerns in respect of wireless and fibre local loops.
20 The Local Loop Unbundling Committee, 23 May 2007, “Local loop unbundling: A way forward for
South Africa”, Available at: http://www.info.gov.za/view/DownloadFileAction?id=72535, last accessed on 13 September 2011. 21
See Section 8 of Government Gazette no. 30308, notice no. 876, published on 17 September 2007.

Page 20 of 23
66. There is a significant amount of learning that the Authority could draw on as it embarks on the LLU process. Some of this is summarised in the Local Loop Unbundling Committee’s report.22 In addition to this, the Berkman Centre Report highlights a number of responses by regulators to recalcitrant incumbents:23
66.1 Lessons from France and Germany:
“1. Contrary to arguments occasionally made in the United States, former government monopolies, just like private companies, have resisted regulations intended to ease entry by competitors likely to compete away their rents. This resistance comes from both management and unions. 2. Formal adoption of a given regulatory arrangement is not the end of the story. Effective engagement by a regulator, and effective implementation, are critical. 3. Lowering entry barriers by requiring the sale of facilities seems to enable different kinds of entrants than a purely facilities-based market. As in the case of Softbank, the French arrangement attracted entrepreneurial entrants that introduced radically new service models. The German approach, which limited entry to companies able to build their own facilities, seemed to produce more conservative entrants, which had a smaller impact on the market.”
66.2 Lessons from the UK:
“1. Unbundling and open access are difficult to enforce 2. Functional separation is a potential solution to this difficulty. It requires less direct monitoring of, and intervention in, the day-to-day operations of the dominant incumbent 3. The introduction of functional separation had a much more significant effect than the introduction of formal unbundling without effective enforcement.”
67. This suggests that the Regulator should take a pro-active role in the unbundling of the
local loop, and be ready to intervene where necessary.
WHAT FORM OF LOCAL LOOP UNBUNDLING DO STAKEHOLDERS REALISTICALLY 5.FAVOUR IN THE SOUTH AFRICAN MARKET?
68. The Authority has proposed the following four LLU options:
68.1 Bitstream access;
68.2 Shared loop unbundling;
68.3 Full-loop unbundling; and
68.4 Sub-loop unbundling.
22 The Local Loop Unbundling Committee, 23 May 2007, “Local loop unbundling: A way forward for
South Africa”, Available at: http://www.info.gov.za/view/DownloadFileAction?id=72535, last accessed on 13 September 2011. See, for example, sections 18.4 and 18.5. 23
See Berkman Centre Report, cited above, from p. 151.

Page 21 of 23
69. Each of these LLU options should not be seen as alternatives but should rather be implemented entirely, and wholesale customers should be allowed to select their preferred option, for each particular circumstance.
70. In respect of Bitstream access, Neotel wishes to draw the Authority’s attention to the fact that this should be offered at the national level, as well as at regional levels of Telkom’s network, so that a facilities seeker does not have to pay Telkom for backhaul services where this is not required.
71. In respect of line sharing, Neotel wishes to draw the Authority’s attention to the fact that the facility provider need not provide the DSLAM. The contrary is suggested on the Authority’s document on p. 13, section 4.2.
WHAT OTHER COST ITEMS SHOULD BE INCLUDED IN EACH FORM OF LOCAL LOOP 6.UNBUNDLING?
72. The Authority has identified the following costs in respect of each form of LLU:
Bitstream access Shared loop unbundling
Full-loop unbundling
Sub-loop unbundling
Capital costs:
• Specifying and establishing the ordering system and internal procedures
• Establishing the backhaul
• Establishing the testing arrangements
Capital costs:
• Specifying and establishing the ordering system and internal procedures
• Establishing the testing arrangements
Capital costs:
• Specifying and establishing the ordering system and internal procedures
• Installing a handover frame
• Co-location costs
• Establishing the testing arrangements
Capital costs:
• Link between primary connection point and facility seeker’s network
Variable costs:
• The costs of the DSLAM
• Per subscriber order costs
• Per subscriber modem costs
• Traffic volume costs of backhaul services
• On demand testing costs
Variable costs:
• The costs of the DSLAM
• Per subscriber order costs
• Per subscriber modem costs
• On demand testing costs
Variable costs:
• Per subscriber order costs
• On demand testing costs
Variable costs:
• Maintenance of the line
• Other costs to be negotiated between provider and seeker
73. The cost items identified by the Authority appear to be reasonable. Nonetheless, Neotel respectfully submits that the Authority may not intervene in respect of setting a wholesale price for wholesale local loops until the Authority has conducted the process set out in Chapter 10 of the ECA (i.e. define markets, identify licensees with Significant Market Power and consider alternative remedies). To the extent that the Authority seeks to link the cost items identified above to a price to be set by the Authority, Neotel respectfully submits that the Authority should first conduct a Chapter 10 process.

Page 22 of 23
74. To the extent that the cost items in the table above merely seek to identify the services to be provided by Telkom in respect of its copper local loops, Neotel’s comments are as follows:
74.1 It is important to identify which party will maintain the local loop: The facility provider or the facility seeker. Maintenance is identified in respect of sub-loop unbundling but not in respect of shared loop nor whole loop unbundling. This is an important consideration because, if the facility seeker pays for maintenance, the wholesale charge for access should be lower than the price that Telkom would charge if Telkom maintains the local loop.
74.2 In respect of shared loop unbundling: It is likely that co-location costs, and the installation of a hand-over distribution frame, will be incurred by Telkom, and these should be provided for.
SHOULD A STANDARDISED ORDERING AND SPECIFICATIONS SYSTEM BE 7.DEVELOPED?
75. A standardised ordering and specifications system specified by the Authority would greatly facilitate the LLU process. In particular, the ordering and specifications system should be developed such that Telkom’s internal retail customer businesses should be required to follow the same process that external facility seekers must follow.
76. Fixed line incumbents in other jurisdictions have often not reacted favourably to Local Loop Unbundling, and have engaged in strategic behaviour to avoid competition. In particular, incumbents have engaged in margin squeeze practices, and have avoided the supply of unbundled local loops to competitors. Margin squeeze takes place where a vertically integrated firm with market power over an upstream input charges a wholesale price for that input relative to the retail price for the downstream product such that the margin available to downstream rivals is insufficient to cover their costs. In addition to margin squeeze, incumbents have a range of options to delay and deny access to their infrastructure, including by means of slow turnaround times for the provisioning of local loops and poor maintenance of those local loops.
77. Telkom is currently facing a range of allegations of contraventions of the Competition Act, some of which relate to margin squeeze, which means that the Authority will need to be vigilant in ensuring that Telkom is prevented from engaging in these and similar actions in response to LLU.
78. The Facilities Leasing Regulations provide in section 9(3) that:
“An electronic communications facilities provider must apply similar terms and conditions, including those relating to rates and charges, in similar circumstances itself, affiliates, and other electronic communications facilities seekers requiring similar services, unless otherwise requested by the electronic communications facilities seeker”.
79. The ordering and specifications system should therefore be clear in ensuring that turnaround times in the provisioning of local loops, and the Service Level Agreements on

Page 23 of 23
the maintenance of those local loops, are no less favourable where they are supplied to third parties, as compared to Telkom’s supply of those services to itself.
80. There are a range of issues identified by the Local Loop Unbundling Committee’s report24 that must be agreed on with Telkom for LLU to be effectively implemented in South Africa. Neotel looks forward to debating these issues and arriving at solutions to ensure that LLU is successfully implemented.
IN THE EVENT THAT AN ACCESS LINE DEFICIT IS IDENTIFIED, WOULD YOU BE 8.WILLING TO CONTRIBUTE TO AN ACCESS LINE DEFICIT RECOVERY SCHEME?
81. Neotel submits that the LLU process should not be conflated with the Under-Serviced Area policymaking process. The Authority is currently developing its approach to Under-serviced area obligations, and the outcomes of this approach should apply to all licensees in a manner that is technology agnostic. Subsidising copper local loops with some form of Access Line Deficit contribution would essentially mean selecting one of the most expensive access technologies to achieve Universal Service objectives, which is not an optimal policy outcome.
82. To the extent that Telkom has been cross-subsidising some customers with revenues earned from others, Telkom should address these inefficiencies in its business model. In creating an access line deficit fund of any kind, the already high prices of copper last mile access services will be inflated even further, at the expense of customers, including many small businesses.
CONCLUSION 9.
83. Neotel looks forward to participating in the working groups that the Authority plans to establish for the LLU process.
84. Neotel remains at the Authority’s disposal to clarify anything in this submission or to assist in the finalization of these Revised Draft Regulations.
24 See sections 18.4 and 18.5, for example.