subscribe now and receive crisis and … · and welfare was assumed, at the urging of sudhir anand...
TRANSCRIPT

Subscribe to The Independent Review and receive a free book of your choice* such as the 25th Anniversary Edition of Crisis and Leviathan: Critical Episodes in the Growth of American Government, by Founding Editor Robert Higgs. This quarterly journal, guided by co-editors Christopher J. Coyne, and Michael C. Munger, and Robert M. Whaples offers leading-edge insights on today’s most critical issues in economics, healthcare, education, law, history, political science, philosophy, and sociology.
Thought-provoking and educational, The Independent Review is blazing the way toward informed debate!
Student? Educator? Journalist? Business or civic leader? Engaged citizen? This journal is for YOU!
INDEPENDENT INSTITUTE, 100 SWAN WAY, OAKLAND, CA 94621 • 800-927-8733 • [email protected] PROMO CODE IRA1703
SUBSCRIBE NOW AND RECEIVE CRISIS AND LEVIATHAN* FREE!
*Order today for more FREE book options
Perfect for students or anyone on the go! The Independent Review is available on mobile devices or tablets: iOS devices, Amazon Kindle Fire, or Android through Magzter.
“The Independent Review does not accept pronouncements of government officials nor the conventional wisdom at face value.”—JOHN R. MACARTHUR, Publisher, Harper’s
“The Independent Review is excellent.”—GARY BECKER, Noble Laureate in Economic Sciences

181
Does Annual Real GrossDomestic Product per CapitaOverstate or Understate the
Growth of IndividualWelfare over the Past Two
Centuries?—————— ✦ ——————
HENDRIK VAN DEN BERG
The decrease in the death rate, and the attendant increase in lifeexpectancy—more than doubling—during the last two centuries in thericher countries, and in the twentieth century in the poorer countries, is�sic� the most stupendous feat in human history.
—Julian Simon, introduction to The State of Humanity (26)
Angus Maddison’s (2001) historical estimates of annual real gross domestic prod-uct (GDP) per capita show that nearly all the economic growth in annual realGDP per capita that has ever occurred in the world occurred after 1820. Maddi-son’s estimate of 1820 real GDP per capita of $667 at 1990 prices and others’estimates that the real output per capita at which humanity can survive is approx-imately $250 per year at 1990 prices imply that average world real GDP per capitalittle more than doubled during the first several hundred thousand years of
The Independent Review, v.VII, n.2, Fall 2002, ISSN 1086-1653, Copyright © 2002, pp. 181– 196.
Hendrik Van den Berg is an associate professor in the Department of Economics at the University ofNebraska, Lincoln.
TIR_7-2_c_Articles_asn 8/16/02 11:49 AM Page 181

1. See Pritchett 1997 for a justification of the $250 subsistence-income estimate.
2. See, for example, the discussions of the well-known Human Development Index (HDI) published annu-ally by the United Nations Development Program (UNDP). See also Usher 1980 and Meier 1976, 12–18.GDP-based growth measures continue to receive criticism; see, for example, Briscoe 2001. Van den Berg2001 describes the many alternative measures of economic growth.
THE INDEPENDENT REVIEW
182 ✦ HENDRIK VAN DEN BERG
human existence.1 During the past two hundred years, the world’s average realGDP per capita has increased nearly ninefold. In the more developed countries,the growth of annual GDP per capita has been much greater. Figure 1 illustratesthe recent explosion of the world’s average annual real GDP per capita.
The accuracy of the stunning picture of recent economic growth shown in figure1 depends on whether annual real GDP per capita correctly reflects human welfare andeconomic growth. Many economists have accepted real GDP per capita as a reasonableproxy for human welfare. For example, Simon Kuznets explicitly defined economicgrowth as “a sustained increase in per capita or per worker product” (1966, 1), andDouglass C. North and Robert Thomas wrote that economic growth “implies that thetotal income of society must increase more rapidly than population” (1973, 1). How-ever, although few people deny that Maddison’s carefully researched historical data indi-cate what happened to annual real GDP per capita over the past two hundred years,some authors have objected to using real GDP per capita to measure human welfare.
A common theme in the economic development literature has been that thegrowth in average annual real GDP per capita overstates the improvement in humanwelfare.2 Some economists have suggested alternative measures of economic growth
$5,000
$4,000
$3,000
$2,000
$1,000
0 1000 1500 1820 1900 1998
Rea
l GD
P Pe
r C
apita
Figure 1Annual Real GDP per Capital: 0–1998
Source: Based on data from Maddison 2001.
TIR_7-2_c_Articles_asn 8/16/02 11:49 AM Page 182

VOLUME VII, NUMBER 2, FALL 2002
ANNUAL REAL GDP AND THE GROWTH OF INDIVIDUAL WELFARE ✦ 183
that focus on health, education, political rights, and many other conditions that areequated with the quality of life. Julian Simon (1995a) and others have pointed out thatvirtually all measures of human welfare have improved greatly over the past two hun-dred years, in which case the general impression given by figure 1 is not misleading.3
However, because most of the other measures have not improved by as great a multi-ple as real GDP per capita, the perception remains that the growth in annual GDP percapita overstates the improvements in human welfare during the past two centuries.
In this article, I argue that the various alternative measures of human welfare donot remedy a serious fundamental shortcoming of annual real GDP per capita as anindicator of human welfare, which is that it fails to measure the lifetime welfare ofindividuals. The many alternative measures of human welfare that have been pro-posed are, like GDP, also annual flows or point-in-time stocks, none of which tells usanything about individuals’ lifetime welfare. A simple measure of average individuallifetime welfare fortunately can be constructed easily from readily available data. Thismeasure indicates that the recent growth of individual welfare actually has exceededthe growth indicated by annual real GDP per capita.
Alternative Measures of Human Welfare
Economists have suggested many alternative measures of human welfare, includinglife expectancy, infant mortality rate, caloric intake, access to safe water, adult literacyrate, school enrollment, the distribution of income, hospital beds per capita, and along list of other similar measures of the “quality of life.” One especially popularapproach to improving on GDP measures of growth has been to use a weighted aver-age of several alternative measures of human welfare. Typical of this approach is thewell-known Human Development Index (HDI) published annually by the UnitedNations Development Program (UNDP). The HDI is a weighted average of realGDP per capita, a measure of health, and a measure of education.
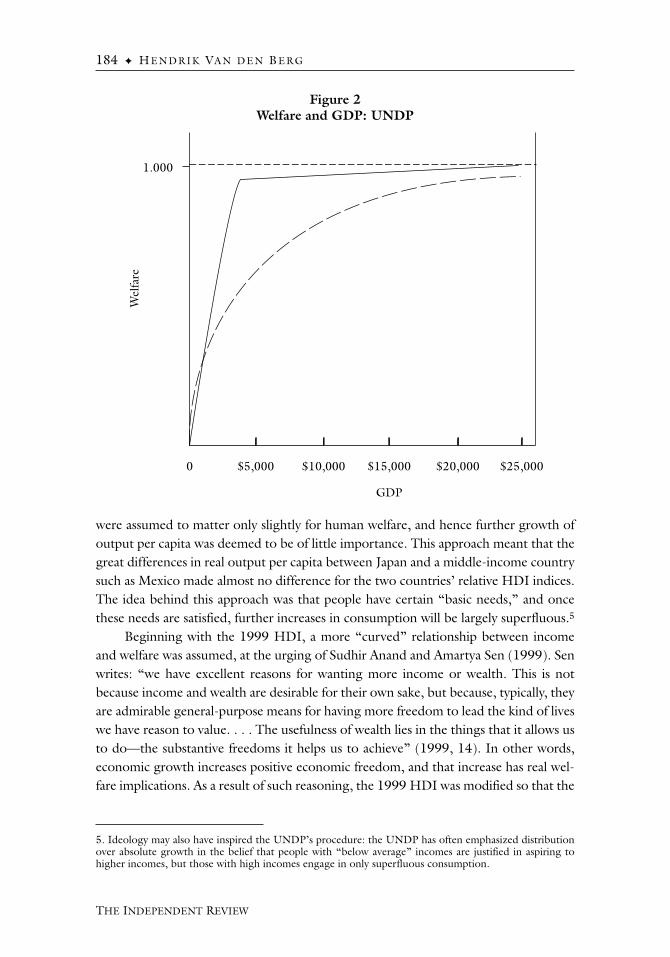
Representing many development economists’ belief that the welfare effect of mar-ginal income declines as income per capita rises, the HDI decreases the weight of realGDP per capita relative to the other measures as real output per capita rises. In fact,until recently, increases in real output per capita carried weight in the HDI only for lowlevels of annual output per capita.4 Specifically, before 1999, the relationship betweenannual real GDP per capita and human welfare that the UNDP assumed was the onedepicted by the solid “kinked” line in figure 2. Thus, increases in GDP per capita up tothe world average of about $5,000 had a strong effect on the value of the overall HDIindex because, as the solid line in figure 2 shows, in that range small increases in GDPper capita were assumed to bring large increases in human welfare. After the world’saverage GDP per capita of $5,000 was reached, however, further increases in output
3. See, for example, the many papers included in Simon 1995b.
4. The methods used to calculate the HDI are described in the “Technical Note” in the UNDP 1999,159–60.
TIR_7-2_c_Articles_asn 8/16/02 11:49 AM Page 183
1.000
Wel
fare
0 $5,000 $10,000 $15,000 $20,000 $25,000
GDP
THE INDEPENDENT REVIEW
184 ✦ HENDRIK VAN DEN BERG
were assumed to matter only slightly for human welfare, and hence further growth ofoutput per capita was deemed to be of little importance. This approach meant that thegreat differences in real output per capita between Japan and a middle-income countrysuch as Mexico made almost no difference for the two countries’ relative HDI indices.The idea behind this approach was that people have certain “basic needs,” and oncethese needs are satisfied, further increases in consumption will be largely superfluous.5
Beginning with the 1999 HDI, a more “curved” relationship between incomeand welfare was assumed, at the urging of Sudhir Anand and Amartya Sen (1999). Senwrites: “we have excellent reasons for wanting more income or wealth. This is notbecause income and wealth are desirable for their own sake, but because, typically, theyare admirable general-purpose means for having more freedom to lead the kind of liveswe have reason to value. . . . The usefulness of wealth lies in the things that it allows usto do—the substantive freedoms it helps us to achieve” (1999, 14). In other words,economic growth increases positive economic freedom, and that increase has real wel-fare implications. As a result of such reasoning, the 1999 HDI was modified so that the
5. Ideology may also have inspired the UNDP’s procedure: the UNDP has often emphasized distributionover absolute growth in the belief that people with “below average” incomes are justified in aspiring tohigher incomes, but those with high incomes engage in only superfluous consumption.
Figure 2Welfare and GDP: UNDP
TIR_7-2_c_Articles_asn 8/16/02 11:49 AM Page 184

VOLUME VII, NUMBER 2, FALL 2002
ANNUAL REAL GDP AND THE GROWTH OF INDIVIDUAL WELFARE ✦ 185
relationship between real GDP per capita and individual welfare was assumed to be theone shown by the dashed curve in figure 2 (UNDP 1999). Note, however, thatalthough the revision of the HDI accepts that welfare always is related positively to realGDP per capita, the HDI still does not assume a constant one-to-one relationship.
Apart from the possibility that welfare gains from GDP growth might be non-linear, the growth of annual real GDP per capita may exaggerate improvements inhuman welfare for other reasons. A well-known shortcoming of GDP is that it countsonly legal market transactions, omitting household production, illegal or “under-ground” production, and leisure despite their effects on human welfare. The omissionof household and underground activity, for example, causes the growth in officialGDP to overstate true growth in production if the unrecorded economic activityshrinks as a percentage of total economic activity. As Scott Fuess and I (Fuess and Vanden Berg 1996, 1998) found for the United States and Mexico, this developmentprobably has occurred in many economies as women increasingly have entered theformal labor market and have substituted paid work for previously unvalued but valu-able housework. GDP may also overstate real growth in output because it does notaccount for the depletion of nonrenewable resources. Martin Weitzman (1999) hasestimated the cost of resource depletion in order to derive net domestic product(NDP), and he has found that the annual depletion of the world’s major minerals isequivalent to approximately 1 percent of real GDP per year.
Growth of Real GDP per Capita May UnderstateImprovements in Human Welfare
Not all evidence supports the belief that the estimated growth of annual real GDP percapita overstates the growth of human welfare. Michael Boskin and others (1996)contend that the U.S. government’s consumer price index consistently has overstatedannual inflation by approximately one percentage point because it has not accountedadequately for quality improvements or product substitution.6 If inflation has beenoverstated, then the growth rate of annual real GDP per capita has been understatedby one percentage point per year, and the growth of material wealth since 1900 hasbeen more than double what GDP per capita indicates.
Annual real GDP per capita also ignores the fact that economic growth usuallyincreases not just the quantity of output but also the variety of output. Increased vari-ety, all other things being equal, enhances welfare (Federal Reserve Bank of Dallas1999). Because GDP is a measure of aggregate output, it makes no difference forGDP whether you eat the same $5.75 lunch consisting of a hamburger, french fries,and a Coca-Cola every day of the week or whether you eat the $5.75 hamburger dishonly on Monday, and you then eat a $4.50 Mexican taco platter on Tuesday, a $4.00
6. The findings of Boskin and others 1996 are summarized conveniently in Boskin and others 1998.
TIR_7-2_c_Articles_asn 8/16/02 11:49 AM Page 185

THE INDEPENDENT REVIEW
186 ✦ HENDRIK VAN DEN BERG
spaghetti dish on Wednesday, a $5.00 Chinese meal on Thursday, and a $9.50 Japan-ese sushi lunch on Friday. The value of the five lunches is $28.75 in either case, andGDP will be the same in either case. For most people, however, the variety of five dif-ferent meals is preferable to eating the same hamburger platter every day of the week.
The preceding discussion suggests that we are not yet close to a consensus onwhether annual real GDP per capita overstates the improvement in human welfare overthe past two centuries. The discussion, however, does bring out a more subtle and moreimportant point, which is that economists and statisticians have missed a critical weak-ness of annual real GDP per capita and of all the alternative measures that have been pro-posed, despite all their efforts to improve the measurement of economic growth.Annual output or any other measure used to calculate welfare at some point in time can-not capture welfare as individuals experience it over the course of a lifetime.
How Should We Measurethe Growth of Individual Welfare?
Real GDP per capita is an aggregate value measured over some arbitrary brief periodand divided by the number of people alive at that time. Individuals live for more thanone year, however, and their personal welfare depends on a lifetime’s consumption ofgoods and services. In this regard, none of the popular alternative proxies for humanwelfare is any more appropriate than real GDP per capita. For example, measures suchas literacy, years of schooling, political freedom, clean air, or the number of hospitalbeds are also either annual flows or point-in-time quantities, not lifetime totals.
It is easy to show that the current practice of using annual real GDP per capitato measure human welfare gives us a hopelessly inaccurate measurement of individualwelfare. Suppose that two countries have the identical annual real GDP per capita of$10,000. Suppose, also, that in one country everyone lives to the age of eighty, but inthe second country people live only to the age of thirty. In which country are indi-viduals better off? To suppose that these two countries provide their residents with thesame levels of welfare would be unreasonable. The human welfare that interests econ-omists cannot be captured by a collective measure of average real GDP or by the aver-age of any of the popular alternative measures of welfare, quantified over some briefperiod or at some point in time.
Individuals judge their welfare by the quality of life and by the length of time thatthey can experience a particular quality of life. Therefore, a measure of an economy’scapacity to satisfy human wants must take into account not only how much people haveat some moment or period of time, but also how long the economy can keep peoplealive and able to experience the annual flows of goods and services that the economyproduces. An acceptable measure of human welfare must be a lifetime measure.
A better measure of individual human welfare would be the average annual GDPper capita times the average life expectancy that the economy provides its citizens. Thesame point applies to the many alternative welfare measures based on point-in-time
TIR_7-2_c_Articles_asn 8/16/02 11:49 AM Page 186

VOLUME VII, NUMBER 2, FALL 2002
ANNUAL REAL GDP AND THE GROWTH OF INDIVIDUAL WELFARE ✦ 187
quantities or on annual flows. If education is deemed to be a better measure of humanwelfare, the effect of education on human welfare depends on how long people live tobenefit from their education. If health or economic freedom is an important yardstickwith which to measure human welfare, we must adjust these measures for the lengthof a lifetime that the average person experiences health or economic freedom.
If an economy provides the conditions under which individuals can live longer, thatprovision in itself increases individual welfare. If the economy can both keep people alivelonger and provide more goods, better health, and more education, then the welfare ofindividuals is enhanced further. Some of the different measures of economic growth—such as life expectancy, real income per capita, or even weighted averages of variables thatreflect quality of life—are in many cases not alternatives but multiplicatives.
Expected Individual Lifetime Welfare
The most direct approach to deriving a measure of lifetime individual welfare, forwhich data are readily available, is to calculate the product of annual real GDP percapita and life expectancy at birth. Life expectancy in a given year is the average age towhich a group of newborns would live if the members of that group remained subjectto the age-specific death rates prevailing in their year of birth. Annual real GDP percapita, of course, indicates the value of goods and services that the economy is capa-ble of providing the average person in a given year. Hence, the product of the twomeasures indicates the economy’s capacity in a certain year (1) to provide materialwelfare and (2) to sustain an individual life. Frank Lichtenberg (1998) introduced justsuch a measure, which he denotes as YL � (YA)(E), where YL is expected lifetime GDPper capita, YA is average annual GDP per capita, and E is life expectancy. Lichtenbergintroduced this measure as part of his study to estimate the value of pharmaceuticalinnovation.7 This measure can be used for studies of economic growth, human wel-fare, and overall economic performance because the data needed to calculate it arereadily available. In the remainder of this article, I refer to this multiplicative measureas the expected individual lifetime welfare (EILW).
Using Maddison’s (2001) data, the Indian economy in 1998 had the capacity toprovide the average person with $1,746 worth of goods and services each year and tokeep the person alive to enjoy that amount of consumption for sixty years. Thus,Indian EILW was equal to $104,760. In the United States in 1998, the economy pro-vided on average $27,331 worth of goods and services under conditions that wouldlet people live, on average, for seventy-seven years. Thus, U.S. EILW in 1998 was$2,104,487. Although the U.S. real GDP per capita is a little less than sixteen timesas great as that of India, its measure of expected lifetime welfare per capita is morethan twenty times as great. The average American gets to enjoy the (higher) income
7. Van den Berg 2001 calculates a historical series of Lichtenberg’s measure for India, Mexico, Spain, Rus-sia, and the United States, based on data from Maddison 1995.
TIR_7-2_c_Articles_asn 8/16/02 11:49 AM Page 187

THE INDEPENDENT REVIEW
188 ✦ HENDRIK VAN DEN BERG
seventeen years longer than the average Indian gets to enjoy the (lower) income.Thus, the average American is relatively better off than either GDP per capita or lifeexpectancy by itself indicates.
Lifetime Welfare Should Not Be Discounted
Almost thirty years ago, Dan Usher (1973) suggested the use of discounted lifetimeearnings as a measure of individual welfare. More recently, William Nordhaus (2002)and Kevin Murphy and Robert Topel (1999) have used the discounted flow of life-time consumption to measure the gains in human welfare from improved health.8 Weare indebted to Usher for introducing the idea of using a lifetime measure as a proxyfor national welfare, but his discounting procedure is not appropriate for measuringthe economy’s capacity to provide a lifetime of welfare-enhancing output.9 It is wortha brief digression to point out why discounting is not appropriate, given economists’natural tendency to discount lifetime flows of income.
By discounting the future flow of income, present income would be valuedmore highly than income that arrives later in life. There is no obvious reason toweight one year more highly than any other in calculating lifetime welfare.10 Thereis substantial evidence that at any single point in time, people value the presentmost highly and discount both the future and the past. This discounting of both thepresent and the past implies a well-known time inconsistency problem: later in lifepeople are likely to regret what they did earlier in life.11 Older people will wish theyhad studied harder, saved more, drunk less, and so forth when they were young.The importance of this observation is that in calculating lifetime welfare it is neces-sary to measure a person’s evaluation of welfare at each period of a person’s life, notfrom the perspective of one point in time as in the case of discounted lifetimeincome per capita.
Figure 3 illustrates a series of hypothetical discounted views of lifetime income atdifferent ages in an individual’s life. Individuals discount both the past and the future.They of course may discount the past differently than they discount the future, andthey may discount the past and future differently at different ages. The curves maynot be symmetrical in both directions from their peaks. The peaks may differ in heightfor different years of individuals’ lives; for example, children may view a given level of
8. The papers by Lichtenberg (1998), Murphy and Topel (1999), and Nordhaus (2002) will be publishedby the University of Chicago Press in a forthcoming volume edited by Murphy and Topel. Murphy andTopel’s research is summarized in Murphy and Topel 2000.
9. Usher (1980) uses a similar approach.
10. Carryover from the welfare of previous years or anticipation of the welfare to be experienced in futureyears may augment or diminish the welfare experienced in any given year, but that possibility does not implythat future welfare necessarily must be discounted and converted to a present welfare value.
11. For a discussion of bidirectional discounting and the time inconsistency problem that it creates, seeCaplin and Leahy 2000.
TIR_7-2_c_Articles_asn 8/16/02 11:49 AM Page 188

VOLUME VII, NUMBER 2, FALL 2002
ANNUAL REAL GDP AND THE GROWTH OF INDIVIDUAL WELFARE ✦ 189
material welfare differently than adults. Hence, the shapes of the curves in figure 3should be seen as illustrative only. What is clear, however, is that lifetime welfare is thesum of the welfare values enjoyed in each year or at each point in time, which is shownby the peaks of the curves. As an approximation, it is clearly more accurate to treatlifetime income as a sum of equal peaks, given by average annual real income percapita, as Lichtenberg suggests, than as a series of continually decreasing discountedfuture income flows, as Usher has proposed.
Growth of Expected IndividualLifetime Welfare Since 1820
Table 1 presents measures of EILW for a group of countries for which both real GDPper capita and life expectancy data are available from 1820 to the present. The tablemakes it clear that our understanding of economic growth changes substantially whenwe measure it by EILW. The EILW data specifically show that the growth of humanwelfare has been much greater than the rate of growth calculated using just real GDPper capita. In all countries, EILW growth was faster than the growth of real GDP percapita. In China, for example, EILW growth was positive between 1900 and 1950even though real GDP per capita shrank. In India, EILW grew nearly twice as fast asreal GDP per capita. Only in the case of Russia from 1950 to 1998 did EILW growthdiffer little from the growth of real GDP per capita—Russia and its predecessor, theUSSR, experienced virtually no improvement in life expectancy over this period.
Dis
coun
t
1
0t = 1 t = 2 t = 3 t = 4 t = 5 t = 6
Figure 3Discounting the Future and the Past
TIR_7-2_c_Articles_asn 8/16/02 11:49 AM Page 189

THE INDEPENDENT REVIEW
190 ✦ HENDRIK VAN DEN BERG
Tab
le 1
Exp
ecte
d L
ifet
ime
Wel
fare
Per
Cap
ita:
Lev
els
and
Ann
ual G
row
th R
ates
for
182
0–19
98
Lev
els:
Ann
ual R
eal G
DP
per
Cap
ita
Year
s of
Lif
e E
xpec
tanc
y E
ILW
(in
dolla
rs)
at B
irth
(in
dolla
rs)
____
____
____
____
____
____
____
___
____
____
____
____
____
____
____
____
____
____
____
____
____
____
____
____
__
1820
1900
1950
1998
1820
1900
1950
1998
1820
1900
1950
1998
Fran
ce1,
230
2,84
95,
270
19,5
5837
4765
7845
,510
133,
903
342,
550
1,52
5,52
4
Ger
man
y1,
058
3,13
43,
881
17,7
7941
4767
7743
,378
147,
298
260,
027
1,37
0,52
3
Ital
y1,
117
1,74
63,
502
17,7
5930
4366
7833
,510
75,0
7823
1,13
21,
385,
202
Net
herl
ands
1,82
13,
533
5,99
620
,224
3252
7278
58,2
7218
3,71
643
1,71
21,
577,
472
Spai
n1,
063
2,04
02,
397
14,2
2728
3562
7829
,764
71,4
0014
8,61
41,
109,
706
Swed
en1,
198
2,56
16,
738
18,6
8539
5670
7946
,772
143,
416
471,
660
1,47
6,11
5
Uni
ted
Kin
gdom
1,70
74,
593
6,90
718
,714
4050
6977
68,2
8022
9,65
047
6,58
31,
440,
978
Uni
ted
Stat
es1,
257
4,09
69,
561
27,3
3139
4768
7749
,023
192,
512
650,
148
2,10
4,48
7
Japa
n66
91,
135
1,92
620
,413
3444
6181
22,7
4649
,940
117,
486
1,65
3,45
3
Rus
sia
689
1,02
32,
834
3,89
328
3265
6719
,292
32,7
3618
4,21
026
0,83
1
Bra
zil
740
704
1,67
25,
459
2736
4567
19,9
8025
,344
75,2
6036
5,75
3
Mex
ico
760
1,15
72,
365
6,65
5—
3350
72—
38,1
8111
8,25
047
9,16
0
Chi
na60
054
043
93,
117
—24
4171
—12
,960
17,9
9922
1,30
7
Indi
a53
162
561
91,
746
2124
3260
11,1
5115
,000
19,8
0810
4,76
0
Wor
ld66
71,
263
2,11
45,
709
2631
4966
17,3
4239
,153
103,
586
376,
794
TIR_7-2_c_Articles_asn 8/16/02 11:49 AM Page 190

VOLUME VII, NUMBER 2, FALL 2002
ANNUAL REAL GDP AND THE GROWTH OF INDIVIDUAL WELFARE ✦ 191
Tab
le 1
(con
tinu
ed)
Ann
ual G
row
th R
ates
:Ye
ars
of L
ife
Exp
ecta
ncy
Rea
l GD
P P
er C
apit
a at
Bir
thE
ILW
____
____
____
____
____
____
____
____
____
____
____
____
____
____
____
____
____
____
____
____
____
__18
20-1
900
1900
-50
1950
-98
1820
-190
019
00-5
019
50-9
818
20-1
900
1900
-50
1950
-98
Fran
ce1.
06%
1.24
%2.
77%
0.30
%0.
65%
0.37
%1.
36%
2.17
%1.
90%
Ger
man
y1.
370.
433.
220.
170.
710.
281.
541.
143.
52
Ital
y0.
561.
403.
440.
450.
860.
341.
012.
313.
80
Net
herl
ands
0.83
1.06
2.57
0.61
0.65
0.16
1.45
1.72
2.74
Spai
n0.
820.
323.
780.
281.
150.
481.
101.
484.
28
Swed
en0.
951.
952.
150.
450.
450.
251.
412.
412.
41
Uni
ted
Kin
gdom
1.24
0.82
2.10
0.28
0.65
0.22
1.53
1.47
2.33
Uni
ted
Stat
es1.
491.
712.
210.
230.
740.
251.
722.
462.
48
Japa
n0.
661.
065.
040.
320.
660.
580.
991.
735.
66
Rus
sia
0.50
2.05
0.66
0.17
1.42
0.06
0.66
3.52
0.73
Bra
zil
0.06
1.75
2.50
0.36
0.45
0.82
0.30
2.20
3.35
Mex
ico
0.53
1.44
2.18
—0.
830.
76—
2.29
2.96
Chi
na0.
130.
414.
17—
1.08
1.13
—0.
665.
37
Indi
a0.
200.
002.
180.
170.
581.
290.
370.
563.
53
Wor
ld0.
801.
042.
090.
220.
920.
611.
021.
962.
73
Sour
ces:
Mad
diso
n 20
01 t
able
1–5
a, t
able
B-2
1. B
ecau
se M
addi
son
2001
doe
s no
t ha
ve r
eal G
DP
per
capi
ta fo
r 19
00, I
use
d A
ngus
Mad
diso
n 19
95,
tabl
e D
, whi
ch, i
n m
ost
case
s, c
orre
spon
ds p
erfe
ctly
or
very
clo
sely
to
Mad
diso
n 20
01; t
he fe
w d
iffer
ence
s w
ere
not
judg
ed t
o be
sig
nific
ant.
TIR_7-2_c_Articles_asn 8/16/02 11:49 AM Page 191

THE INDEPENDENT REVIEW
192 ✦ HENDRIK VAN DEN BERG
The more rapid growth of EILW means that the growth of annual real GDP percapita understates the growth of lifetime material welfare. Even if the relationshipbetween output and human welfare is nonlinear, human welfare still might haveincreased more rapidly than the growth of annual real GDP per capita indicates.
Convergence and Divergenceof National Welfare Levels
Because the EILW permits a more accurate depiction of individual welfare, it can alsohelp us get a better answer to the question of whether individual welfare is becomingmore or less equal among the countries of the world. The rate of absolute conver-gence of real income per capita across countries or regions can be found by estimat-ing the regression equation
ln(yt+n) – ln(yt) � a � b ln(yt),
in which yt is real income per capita in year t. If the coefficient b is negative, we canconclude that real incomes per capita converged over the period from year t to year t� n. The speed of convergence is equal to ß � – ln(1 � b)/n, and the often-reportedhalf-life, t*, of the absolute income gap is the solution to e–ßt* � 0.5, or t* � –ln(0.5)/ß. Table 2 presents regression estimates and, where the regression coeffi-cients were negative, the speed of convergence for both real GDP per capita and theEILW for the countries included in table 1.
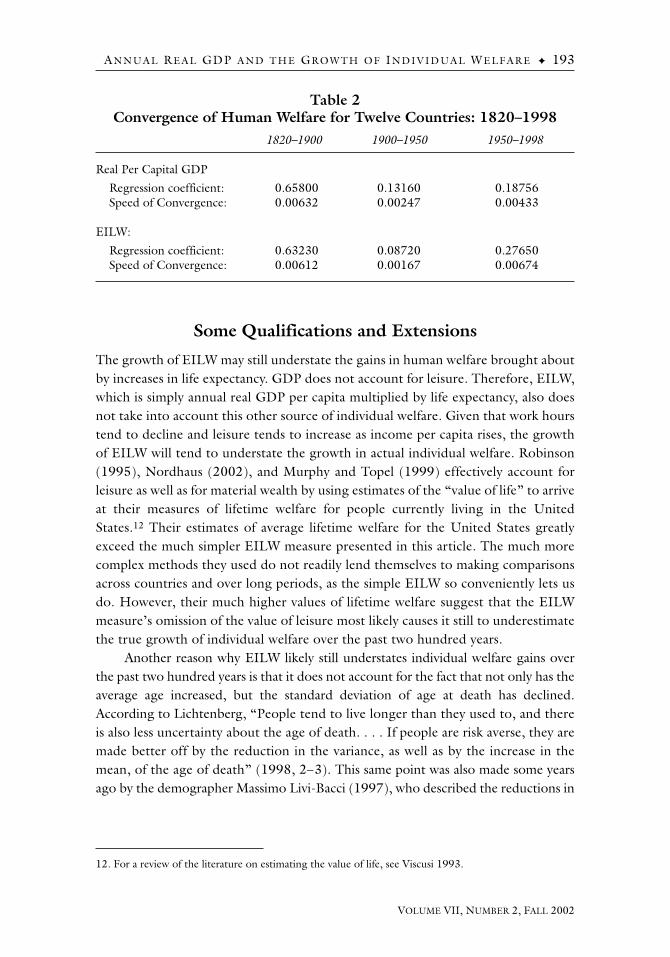
Table 2 makes it clear that average individual welfare across countries divergedsharply during the 1800s. It makes little difference whether annual real GDP percapita or the EILW is used to compare welfare across countries. The coefficients fromregressing subsequent growth on the initial levels of annual real GDP per capita andthe EILW are positive and nearly identical for the period 1820–1900.
In the twentieth century, there are substantial differences between what real GDPper capita and the EILW show about the convergence of average individual welfare.For the period 1900–1950, the regression coefficients for both annual real GDP percapita and the EILW are still positive, but they are much smaller than for the nine-teenth century. Note also that the coefficient for the EILW is considerably smaller thanin the regression equation relating the growth and initial levels of annual real GDP percapita. Thus, individual welfare appears to have diverged less rapidly during the firsthalf of the twentieth century than data for annual real GDP per capita indicate.
During the second half of the twentieth century, the relatively more rapid con-vergence of the EILW, compared to annual real GDP per capita, indicates that individ-ual welfare probably converged more rapidly than comparisons of real GDP per capitasuggest. The half-life of the differences in welfare across the sample of countries isapproximately only 100 years in the case of the EILW, but it is approximately 160 yearsfor annual real GDP per capita.
TIR_7-2_c_Articles_asn 8/16/02 11:49 AM Page 192
VOLUME VII, NUMBER 2, FALL 2002
ANNUAL REAL GDP AND THE GROWTH OF INDIVIDUAL WELFARE ✦ 193
Some Qualifications and Extensions
The growth of EILW may still understate the gains in human welfare brought aboutby increases in life expectancy. GDP does not account for leisure. Therefore, EILW,which is simply annual real GDP per capita multiplied by life expectancy, also doesnot take into account this other source of individual welfare. Given that work hourstend to decline and leisure tends to increase as income per capita rises, the growthof EILW will tend to understate the growth in actual individual welfare. Robinson(1995), Nordhaus (2002), and Murphy and Topel (1999) effectively account forleisure as well as for material wealth by using estimates of the “value of life” to arriveat their measures of lifetime welfare for people currently living in the UnitedStates.12 Their estimates of average lifetime welfare for the United States greatlyexceed the much simpler EILW measure presented in this article. The much morecomplex methods they used do not readily lend themselves to making comparisonsacross countries and over long periods, as the simple EILW so conveniently lets usdo. However, their much higher values of lifetime welfare suggest that the EILWmeasure’s omission of the value of leisure most likely causes it still to underestimatethe true growth of individual welfare over the past two hundred years.
Another reason why EILW likely still understates individual welfare gains overthe past two hundred years is that it does not account for the fact that not only has theaverage age increased, but the standard deviation of age at death has declined.According to Lichtenberg, “People tend to live longer than they used to, and thereis also less uncertainty about the age of death. . . . If people are risk averse, they aremade better off by the reduction in the variance, as well as by the increase in themean, of the age of death” (1998, 2–3). This same point was also made some yearsago by the demographer Massimo Livi-Bacci (1997), who described the reductions in
Table 2Convergence of Human Welfare for Twelve Countries: 1820–1998
1820–1900 1900–1950 1950–1998
Real Per Capital GDP
Regression coefficient: 0.65800 0.13160 0.18756Speed of Convergence: 0.00632 0.00247 0.00433
EILW:
Regression coefficient: 0.63230 0.08720 0.27650Speed of Convergence: 0.00612 0.00167 0.00674
12. For a review of the literature on estimating the value of life, see Viscusi 1993.
TIR_7-2_c_Articles_asn 8/16/02 11:49 AM Page 193
THE INDEPENDENT REVIEW
194 ✦ HENDRIK VAN DEN BERG
infant mortality and the remedies for the many diseases that randomly attacked peo-ple of all ages as adding “order” to life and permitting people to more effectively planand organize their lives.
It is not difficult to imagine multiplicative adjustments for other economic andsocial conditions that enhance or diminish the accuracy of real GDP per capita as ameasure of human welfare. For example, real GDP per capita might be multiplied bya factor representing positive economic freedom, which, as suggested by Amartya Sen(1999a, 1999b), improves as the economy increases its productive capacity. Certainlythe freedom to choose where one works and what one consumes is worth at leastsome small percentage of national income. On the other hand, dictatorships, discrim-ination, threats to personal safety, and the lack of protection of personal propertydiminish the real value of measured real GDP per capita. In this sense, Latin America’swell-documented “lost decade” of the 1980s may not have been so “lost,” given thatlife expectancy improved, access to education increased, and democracy replaced dic-tatorships in nearly all of the region’s countries.
Some extensions and refinements of EILW are worth pursuing in the future. Forexample, the Disability Adjusted Life Expectancy (DALE) data just published by theWorld Health Organization (WHO) are certainly a better means of measuring a per-son’s lifetime welfare than simple life expectancy (WHO 2000). These new estimatesof how long people can be expected to live in good health and to be able to enjoy fullytheir material wealth, their education, and their lifestyles unfortunately exist only forone year. Therefore, growth rates incorporating this measure cannot be calculated yet.
The issue of which measures best reflect human welfare remains to be settled, ofcourse. Any future improvements in the way we calculate GDP would also makeEILW a more accurate measure of lifetime welfare as well. However, the measures weuse to represent individual welfare will improve our understanding of individual wel-fare only if they reflect lifetime welfare.
Summary and Implications
The appropriate way to measure human welfare, in line with economists’ focus onindividual human welfare, is to quantify the economy’s capacity to provide the aver-age individual with a lifetime of welfare. This focus demands that our measures ofeconomic performance reflect not just the average annual or some other point-in-time level of welfare, but also how long the economy can keep the average personalive to experience that level of welfare. Julian Simon’s statement in the epigraph tothis article suggests that the actual improvement in individual welfare has been muchgreater than the customary measure of annual real GDP per capita shows. The long-running debate about how to measure economic growth and human welfare reallyhas missed the mark by focusing on which annual flows or instantaneous stocks ofoutput and other “quality of life” variables best represent the growth of human wel-fare. It is surprising that development economists have never questioned using
TIR_7-2_c_Articles_asn 8/16/02 11:49 AM Page 194

VOLUME VII, NUMBER 2, FALL 2002
ANNUAL REAL GDP AND THE GROWTH OF INDIVIDUAL WELFARE ✦ 195
annual measures of human welfare, which completely ignore the “stupendous”increase in longevity.
Perhaps the seemingly difficult task of compiling measures of lifetime welfare hasdiscouraged researchers from abandoning their annual and point-in-time stock meas-ures. The difficulties in generating historical series for a large number of countriesusing Nordhaus’s (2002) and Murphy and Topel’s (1999) methods seem to supportthe impression that lifetime welfare measures are more theoretical than practical. Thisimpression, however, is wrong. A multiplicative measure, EILW—for which data arereadily available—captures lifetime welfare at least as well as GDP captures annual wel-fare. EILW has grown more rapidly than conventional measures such as real GDP percapita. Given the “stupendous” increases in life expectancy, as well as the generalimprovements in nearly all alternative measures of human welfare, lifetime measures ofwelfare that reflect both the quality of life and the length of life confirm the generalimpression given by Maddison’s estimates of real GDP per capita—namely, that indi-vidual welfare has grown enormously over the past two hundred years. In fact, lifetimemeasures of welfare reveal that the improvement in individual welfare may have beenunderstated, not overstated, by the growth of annual real GDP per capita.
ReferencesAnand, Sudhir, and Amartya Sen. 1999. The Income Component of the HDI-Alternative For-
mulations. Occasional Paper, United Nations Development Program. New York: HumanDevelopment Report Office, United Nations.
Boskin, Michael J., Ellen R. Dulberger, Robert J. Gordon, Zvi Griliches, and Dale W. Jorgen-son. 1996. Toward a More Accurate Measure of the Cost of Living. Final Report to the Sen-ate Finance Committee, December.
———. 1998. Consumer Prices, the Consumer Price Index, and the Cost of Living. Journal ofEconomic Perspectives 12, no. 1: 3–26.
Briscoe, Simon. 2001. Statistics May Not Measure Up in Quality of Life Test. Financial Times,August 16.
Caplin, Andrew, and John Leahy. 2000. The Social Discount Rate. NBER Working Paper no.7983, October. Cambridge, Mass.: NBER.
Federal Reserve Bank of Dallas.1999. The Right Stuff, America’s Move to Mass Customization:1998 Annual Report. Dallas: Federal Reserve Bank of Dallas.
Fuess, Scott M.., Jr., and Hendrik Van den Berg. 1996. Does GNP Exaggerate Growth in“Actual” Output? The Case of the United States. Review of Income and Wealth 42, no. 1:35–48.
———. 1998. Does GDP Distort Mexico’s Economic Performance? Southern Economic Jour-nal 64, no. 4: 973–86.
Kuznets, Simon. 1966. Modern Economic Growth. New Haven, Conn.: Yale University Press.
Lichtenberg, Frank L. 1998. Pharmaceutical Innovation, Mortality Reduction, and EconomicGrowth. NBER Working Paper no. 6569, May. Cambridge, Mass.: NBER.
TIR_7-2_c_Articles_asn 8/16/02 11:49 AM Page 195

THE INDEPENDENT REVIEW
196 ✦ HENDRIK VAN DEN BERG
———. 2002. Sources of U.S. Longevity Increase, 1960–1997. NBER Working Paper no. 8755,February. Cambridge, Mass.: NBER.
Livi-Bacci, Massimo. 1997. A Concise History of World Population. 2d ed. Oxford, U.K.: Blackwell.
Maddison, Angus. 1995. Monitoring the World Economy 1820–1992. Paris: Organization forEconomic Cooperation and Development.
———. 2001. The World Economy: A Millennial Perspective. Paris: Organization for EconomicCooperation and Development.
Meier, Gerald M. 1976. Indicators of International Development. In Leading Issues in EconomicDevelopment, 3rd ed., edited by Gerald M. Meier, 12–18. New York: Oxford University Press.
Murphy, Kevin M., and Robert Topel. 1999. The Economic Value of Medical Research. Paperpresented at the Conference on the Economic Value of Americans’ Investment in Med-ical Research, sponsored by the Lasker Charitable Trust, December 1999.
———. 2000. Medical Research: What Is It Worth? Milken Institute Review 2, no. 1: 23–30.
Nordhaus, William D. 2002. The Health of Nations: The Contribution of Improved Health toLiving Standards. NBER Working Paper no. 8818, March. Cambridge, Mass.: NBER.
North, Douglass C., and Robert Paul Thomas. 1973. The Rise of the Western World: A New Eco-nomic History. Cambridge: Cambridge University Press.
Pritchett, Lant. 1997. Divergence, Big Time. Journal of Economic Perspectives 11, no.3: 3–17.
Robinson, John P. 1995. Trends in Free Time. In The State of Humanity, edited by Julian L.Simon, 224–30. Oxford, U.K.: Blackwell.
Sen, Amartya. 1999a. Development as Freedom. New York: Alfred A. Knopf.
——. 1999b. The Possibility of Social Choice. American Economic Review 89, no. 3: 349–78.
Simon, Julian L., 1995a. Introduction to The State of Humanity, edited by Julian L. Simon,1–28. Oxford, U.K.: Blackwell.
———, ed. 1995b. The State of Humanity. Oxford, U.K.: Blackwell.
United Nations Development Program (UNDP). 1999. Human Development Report 1999.New York: UNDP.
Usher, Dan. 1973. An Imputation to the Measure of Economic Growth for Changes in LifeExpectancy. The Measurement of Economic and Social Performance, edited by MiltonMoss, 193–223. New York: Columbia University Press.
———. 1980. The Measurement of Economic Growth. New York: Columbia University Press.
Van den Berg, Hendrik. 2001. Economic Growth and Development. New York: McGraw-Hill.
Viscusi, W. Kip. 1993. The Value of Risks to Life and Health. Journal of Economic Literature31, no. 4: 1912–46.
Weitzman, Martin L. 1999. Pricing the Limits to Growth from Minerals Depletion. QuarterlyJournal of Economics 114, no. 2: 691–706.
World Health Organization. 2000. WHO Issues New Healthy Life Expectancy Rankings.WHO Press Release, June 4. Figures available on the WHO Web site: www.who.org.
Acknowledgments: The author would like to acknowledge the reliable research assistance of Ying Zhou andthe valuable suggestions by two anonymous referees. The author is solely responsible for any remaining errors.
TIR_7-2_c_Articles_asn 8/16/02 11:49 AM Page 196