substance-specific and average polarity factors for
TRANSCRIPT

Journal of Chromatographic Science, Vol. 35, October 1997
Substance-Specific and Average Polarity Factors for Characterization of Stationary Phases Used in Gas—Liquid Chromatography J.M. Santiuste* Instituto de Química Física "Rocasolano", Consejo Superior de Investigaciones Científicas, C. Serrano, 119, 28006-Madrid, Spain
J.M. Takács Gas Chromatographic Research Group for the Study of Retention Index Systems, H-1165-Budapest, Fabián u.27, Hungary
Abstract
Kováts coefficients (KPC) and molecular structural coefficients (SP c i ) ,
as well as their dependences on column temperature, stationary phase polarity, and solute chemical nature, have been dealt with in some earlier papers. Three new polarity values based on the above parameters are presented to characterize gas-liquid chromatographic stationary phases: the substance-specific polarity factor, the average polarity factor, and its derived polarity. The new scales describe the interaction capacity of 26 stationary phases from squalane (retention polarity, 0) to bis(cyanoethoxy)formamide (retention polarity, 144.6) with the first five McReynolds solutes. Their physicochemical meanings are also shown.
Introduction
Polarity in gas chromatography (GC) is controversial and must be managed carefully. It is relatively simple to assign polarity to a solute because it suffices to look at its chemical constitution for associating its dipolar moment or its capacity to give or take protons or electrons (etc.) to its polarity. n-Alkanes are nonpolar (zero dipolar moment), whereas n-alcohols, ketones, esters, and amines are polar because these chemical functions have a finite dipolar moment. However, the polarity of a stationary phase (SP) toward a solute depends on the reciprocal interaction forces between them: dispersion, induction, orientation, and donor-acceptor (e.g., hydrogen bond).
Rohrschneider (1) and McReynolds (2) pioneered the work on characterization of organic liquids used as GC SPs based on these solute-SP interactions. The latter method is still widely used; McReynolds polarity is one of the most characteristic SP data appearing in commercial catalogs, although it has been claimed that n-alkanes are unadvisable as standard probes for very polar SPs (3). Other methods of characterization are the solvent selectivity triangles of Snyder and others (4-8), the Hildebrand solubility parameter approach (9-12), spectroscopic methods (13-15), and thermodynamic approaches (16-17).
* Author to whom correspondence should be addressed.
These procedures have yielded a series of standardized polarity scales for SPs. The Rohrschneider polarity (P=logrp — logr a) is the difference between the logarithms of the relative retentions (r) of butadiene and butane on a polar (p) and a nonpolar (a) SP (18), ranging from squalane (P=0) to β,β -oxydipropionitrile (P=100). Kováts (19) introduced a retention index (RI) scale to characterize SPs using the equation I = Ipx—ISQ. Schomburg (20) defined polarity as the RI differences for benzene and cyclohexane on the polar SP with respect to squalane: Ρ= I b e n z e n e - I c y c l o h e x a n e . McReynolds (2) characterized an SP by its "McReynolds polarity" (Σ[ΔI]), calculated as the sum of the differences J , Y, Z, U, and S of the retention indices for the solutes benzene, n-butanol, 2-pen-tanone, 1-nitropropane, and pyridine, respectively, on the given SP and on squalane, taken as the apolar reference SP. Lee et al. (21) proposed the RI of the polarizable biphenyl to determine the SP polarity. Snyder (4) used the solvent polarity parameter (P), determined as Ρ =1 .2+Σ Ιib/100, where b is the slope of the straight line log Vg,z versus Ζ (the carbon atom number of the n-alkanes), and ΣΔI i = Ii/xi where xi is the selectivity parameter for the three interactions of the SP and the solutes ethanol, dioxane, and nitromethane (proton acceptor, proton donor, and orientation, respectively). Novák (22) equated the SP polarity to its resistance to retain a nonpolar hydrocarbon, expressed as G°k( - C H 2 -)(T), the partial molar Gibbs energy of the solution of a methylene group. Tkján et al. (23) used the coefficients of Kováts (24-26), defined as: KPc = 100 (Z- log Vg,Z/b), depending on the column temperature and carrier gas but not on the chosen n-alkane, provided that Z is greater than 7. Szentirmai et al. (27) coined the retention polarity (RP) (see Equation 13), based on the idea that the chromatographic interaction between a substance and an SP can be characterized by the RI ratios. The scale, a refinement of the Snyder's scale, is due to Kersten et al. (7): [ΣΔIG 0
k ( i ) ]p S Q . = δ(ΔG0ethanol)PSQ
+ δ(ΔG0
Knitromethan)PSQ+ Finally, Poole et al. (28) devised the scale of the solvent strength parameter (SSP): ΔG0K(-CH2_)(T)/P, where ρ is the density of the SP.
Here average polarity factor (APF?) and polarity (P p) for 26 SPs are proposed. Also, a new concept of substance-specific polarity factor (SPF\) for some solutes is proposed, and a relationship between them and their respective molecular structural coefficients is also suggested.
Reproduction (photocopying) of editorial content of this journal is prohibited without publisher's permission. 495 Downloaded from https://academic.oup.com/chromsci/article-abstract/35/10/495/318579by gueston 03 April 2018

Journal of Chromatographic Science, Vol. 35, October 1997
Average Stationary Retention McReynolds polarity phase polarity polarity factor Polarity
Zerolane -20.83 0.0000 1.0000 0.0000 Squalane 0.00 0.8968 1.1659 1.4879 SPB-OCTYL 1.65 0.9709 1.1783 1.7312 Apolane-87 2.30 1.0000 1.1831 1.8314 Apiezon-L 6.38 1.1855 1.2131 2.5263 OV-101 7.17 1.2217 1.2188 2.6734 SE-54 10.51 1.3760 1.2427 3.3402 OV-7 18.39 1.7480 1.2973 5.1969 OV-1701 24.58 2.0481 1.3383 6.9296 SP-392 29.60 2.2969 1.3704 8.5082 OV-25 35.86 2.6140 1.4089 10.6895 SAIB 44.34 3.0563 1.4584 14.0109 OV-215 47.95 3.2492 1.4786 15.5492 Pluronic F-68 58.70 3.8407 1.5351 20.5524 NPGS 65.23 4.2131 1.5670 23.8872 PEG-20M 71.91 4.6047 1.5976 27.5170 EGA 82.61 5.2558 1.6423 33.7601 SP-2380 86.79 5.5184 1.6584 36.3320 SP-2310 99.31 6.3349 1.7014 44.4311 DEGS 102.55 6.5538 1.7112 46.6134 Silar 10-CP 114.51 7.3905 1.7431 54.9181 EGS 116.77 7.5539 1.7482 56.5241 SP-222-PS 122.51 7.9769 1.7602 60.6422 OV-275 131.38 8.6538 1.7752 67.0810 CES* 136.31 9.0428 1.7816 70.6754 BCEF 144.60 9.7188 1.7891 76.6959
Eq 3
Theory
The molecular structural coefficient for a solute at a temperature Τ was defined by Takács (29) as:
Eq 1
where S P
c x is the molecular structural coefficient of a solute χ in a given polar SP (In [cm3/g]); Tis the column temperature (°C), fixed in this case at 120°C; /p x is the isothermal retention index of a solute χ in SP ρ (according to Kováts [30]); Kp
c is the Kováts coefficient of SP ρ (-In [cm3/g]) (23-25,31,32); In is a natural logarithm; KP G X is the specific retention volume of a solute χ (cm3/g) in the SP p; and Q P (T) is the relative volatility of two adjacent n-alkanes in the SP p:
Eq 2
where tM is the dead (holdup) time (min), which is a transit ("retention time") of the inert substance used (hydrogen, neon, and in practice, methane). With the following equation in mind,
Equation 1 can be rewritten as:
Eq 5
The molecular structural coefficient has the following physico-chemical meaning (E.B. Lorenz and J.M. Takács. TWenty-fifth anniversary of the gas chromatographic research group for study of the retention index systems, private communication, Budapest, Hungary, 1996). Bearing in mind the following equations,
Eq6
Eq7
Eq8
Eq9
where [ΔG°X (T)]p is the partial molar Gibbs energy necessary to take 1 mole of solute χ from the gas phase to the SP ρ at a temperature of T; [ΔG° K( - C H 2 -) (T)]p is the partial molar Gibbs energy for the -CH2- group, whose physicochemical meaning is the energy to be spent for creating a cavity in the SP ρ to house the methylene group (i.e., it would account for the reluctance of the SP to do so). The partial molar Gibbs energy for the methylene group is equal to the product of -2.3RT and the slope (b) (Equation 4); expressing R in cal/mol K, its units are calories per mole.
According to the above (31), the molecular structural coefficient of a given solute on a given SP equals the ratio between the partial molar Gibbs energy of a solute χ at a temperature Τ and a hundredth of the value of the partial molar Gibbs energy for a methylene group:
where t'R is the adjusted retention time (min)
Eq 10
496
Table I. Four Polarity Scales: Retention Polarity, Average Polarity Factor, McReynolds Polarity, and Polarity of 26 Stationary Phases at 120°C
* Cyanoethyl sucrose.
it can be written:
Downloaded from https://academic.oup.com/chromsci/article-abstract/35/10/495/318579by gueston 03 April 2018
Journal of Chromatographic Science, Vol. 35, October 1997
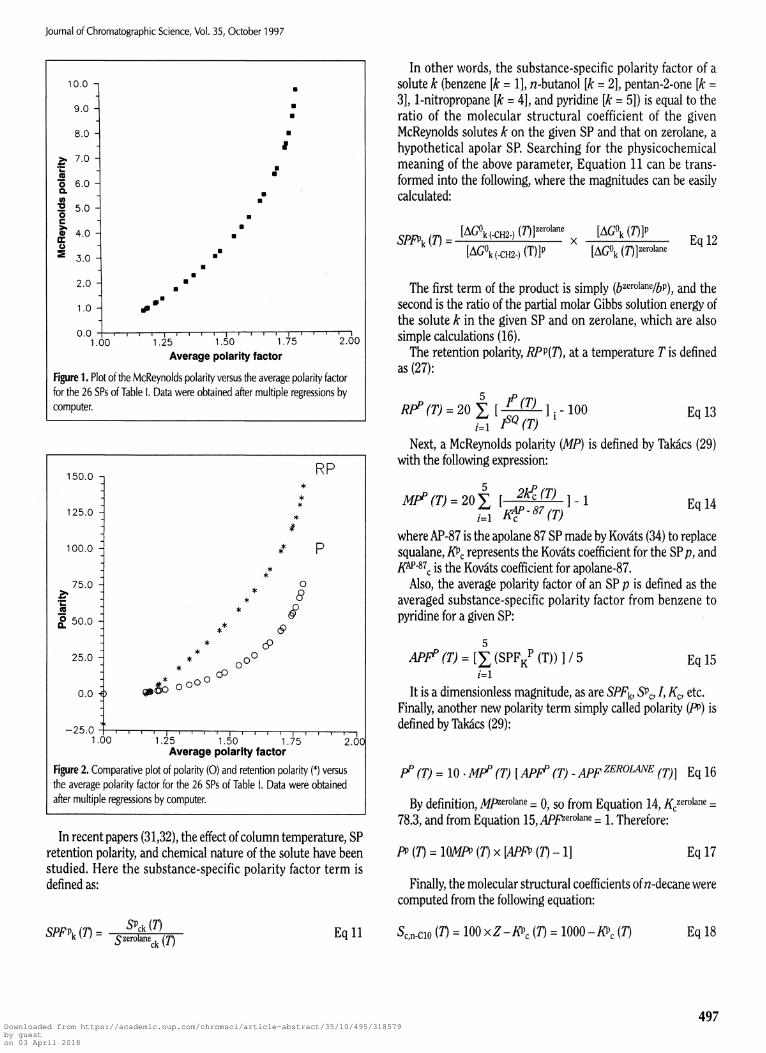
Figure 1. Plot of the McReynolds polarity versus the average polarity factor for the 26 SPs of Table I. Data were obtained after multiple regressions by computer.
Figure 2. Comparative plot of polarity (0) and retention polarity (*) versus the average polarity factor for the 26 SPs of Table I. Data were obtained after multiple regressions by computer.
In recent papers (31,32), the effect of column temperature, SP retention polarity, and chemical nature of the solute have been studied. Here the substance-specific polarity factor term is defined as:
In other words, the substance-specific polarity factor of a solute k (benzene [k=1], n-butanol [k=2], pentan-2-one [k= 3], 1-nitropropane [k=4], and pyridine [k=5]) is equal to the ratio of the molecular structural coefficient of the given McReynolds solutes k on the given SP and that on zerolane, a hypothetical apolar SP. Searching for the physicochemical meaning of the above parameter, Equation 11 can be transformed into the following, where the magnitudes can be easily calculated:
Eq 12
The first term of the product is simply (bZerolane/bp), and the second is the ratio of the partial molar Gibbs solution energy of the solute k in the given SP and on zerolane, which are also simple calculations (16).
The retention polarity, RPv(T), at a temperature Τ is defined as (27):
Eq 14
where AP-87 is the apolane 87 SP made by Kováts (34) to replace squalane, Kp
c represents the Kováts coefficient for the SP p, and KAP-87
c is the Kováts coefficient for apolane-87. Also, the average polarity factor of an SP ρ is defined as the
averaged substance-specific polarity factor from benzene to pyridine for a given SP:
It is a dimensionless magnitude, as are SPFk, SPFK,SP
C, K0 etc. Finally, another new polarity term simply called polarity (PP) is defined by Takács (29):
By definition, MPZerolane = 0, so from Equation 14,KC
Zerolane
=
78.3, and from Equation 15,APF Z e r o l a n e = 1. Therefore:
Eq 17
Finally, the molecular structural coefficients of n-decane were computed from the following equation:
Eq 18
497
Eq 13
Next, a McReynolds polarity (MP) is defined by Takács (29) with the following expression:
Eq 16
Eq 15
Eq 11
Downloaded from https://academic.oup.com/chromsci/article-abstract/35/10/495/318579by gueston 03 April 2018

Journal of Chromatographic Science, Vol. 35, October 1997
Figure 3. Dependence of the molecular structural coefficients (Sp
ck) of the first five McReynolds probes on the polarity of 26 SPs. Benzene (0), 2-pentanone (Δ), pyridine (0), n-butanol (+), and 1-nitropropane (*). Data were obtained after multiple regression by computer.
Stationary phase Benzene n-Butanol Pentan-2-one 1-Nitropropane Pyridine
Zerolane 497.5 359.6 457.6 376.3 457.3 Squalane 504.4 441.7 478.6 503.5 550.5 SPB-octyl 505.0 447.9 480.3 512.7 557.5 Apolane-87 505.2 450.3 480.9 516.3 560.2 Apiezon-L 506.7 465.1 485.2 538.5 577.2 OV-101 507.0 468.0 486.0 542.7 580.5 SE-54 508.2 479.8 489.5 560.3 594.1 OV-7 511.2 506.9 497.9 599.7 625.4 OV-1701 513.7 527.2 504.6 628.8 649.0 SP-392 515.8 543.1 510.2 651.2 667.5 OV-25 518.6 562.1 517.1 677.6 689.8 SAIB 522.4 586.4 526.8 710.8 718.6 OV-215 524.2 596.2 530.9 724.0 730.3 Pluronic F68 529.5 623.6 543.5 760.1 763.5 NPGS 533.0 638.9 551.3 779.7 782.2 PEG-20M 536.7 653.3 559.4 797.8 800.2 EGA 543.0 674.0 572.7 823.0 826.5 SP-2380 545.6 681.3 577.9 831.5 836.0 SP-2310 553.9 699.9 594.1 852.6 861.3 DEGS 556.1 704.0 598.3 857.0 867.1 Silar 10CP 565.0 716.1 614.3 869.0 885.6 EGS 566.8 717.9 617.3 870.6 888.6 SP-222-PS 571.4 721.7 625.2 873.5 895.4 OV-275 579.0 725.3 637.5 875.1 903.8 CES* 583.5 726.1 644.5 874.4 907.2 BCEF 591.4 725.4 656.3 870.6 910.9
Experimental
Different types of packed (on various supports obtained from Johns-Manville [Denver, CO] and Supelco [Bellefonte, PA]) and capillary (WCOT) columns from Hewlett-Packard (Palo Alto, CA) and Chrompack (Middburg, The Netherlands) were used; polarity ranged between squalane and bis(cyanoethoxy)for-mamide (BCEF). Two apolar SPs were used as standards: zerolane and apolane 87. The first five McReynolds probes were benzene, n-butanol, 2-pentanone, 1-nitropropane, and pyridine; the n-alkanes were used as markers.
Results and Discussion
Results were obtained at 120°C throughout. Table I shows the list of the 26 SPs used in this work together with the values of the four following polarity scales: retention polarity (RP), McReynolds polarity (MP), average polarity factor (APF), and polarity (P), calculated according to Equations 13,14,15, and 17, respectively. The range of the different polarity scales was between -21 and about 145 for RP, between 0 and about 10 for MP, between 1 and
about 2 for APF, and between 0 and about 77 for P. Therefore, the two new polarity terms, APF and P, are polarity scales as correct as the RP and the MP and can be used as a tool for characterizing SPs, but without using squalane as a standard SP. Because the first five McReynolds probes were involved in the equations leading to the calculation of these magnitudes, the values of the different columns in Table I quantify the global solute-solvent interactions of the 26 SPs listed with the mentioned McReynolds solutes. For characterizing each individual interaction, other parameters such as molecular structural coefficients and substance-specific polarity factors are much more useful, as can be seen below.
Figure 1 shows the plot of McReynolds polarity obtained using Equation 14 versus the average polarity factors obtained using Equation 15 for 26 SPs. Figure 2 shows the plot of retention polarity and polarity calculated by Equations 13 and 17, respectively, versus the average polarity factors for the same SPs (Equation 15). Data were optimized by multiple regression carried out by computer. Monotonically increasing curves were obtained in all cases. Quadratic least-mean squares fits yielded the following results. For Figure 1, the coefficients for the grade-2 polynomial fitting in decreasing order (y=ax2+bx+c) were as follows: a=6.8672, b=-7.77348, and c=0.16967; the correlation coefficient was 0.97. For the RP-APF curve in Figure 2, a=180.686, b=-320.535, and c=127.095; the correlation coefficient was 0.99. For the P-APF curve in Figure 2, a=184.171, b=-437.911, and c= 260.753; the correlation coefficient was 0.97.
498
Table II. Molecular Structural Coefficients (5P c k) for the First Five McReynolds Probes on 26 Stationary Phases at 120°C
* Cyanoethyl sucrose.
Downloaded from https://academic.oup.com/chromsci/article-abstract/35/10/495/318579by gueston 03 April 2018

journal of Chromatographic Science, Vol. 35, October 1997
Stationary phase KPC SPcn–c10 SPFn–cw
Zerolane 78.3 921.7 1.0000 Squalane 148.5 851.5 0.9237 SPB-octyl 154.3 845.7 0.9174 Apolane-87 156.6 843.4 0.9149 Apiezon L 171.1 828.9 0.8991 OV-101 173.9 826.1 0.8961 SE-54 186.0 814.0 0.8830 OV-7 215.2 784.8 0.8513 OV-1701 2387 761.3 0.8258 SP-392 258.1 741.9 0.8048 OV-25 283.0 717.0 0.7778 SAIB 317.6 682.4 0.7402 OV-215 332.7 667.3 0.7238 Pluronic F68 379.0 621.0 0.6736 NPGS 408.2 591.8 0.6419 PEG-20M 438.8 561.2 0.6087 EGA 489.8 510.1 0.5533 SP-2380 510.4 489.6 0.5311 SP-2310 574.3 425.7 0.4618 DEGS 591.5 408.5 0.4431 Silar 10CP 657.0 343.0 0.3721 EGS 669.8 330.2 0.3582 SP-222-PS 702.9 297.1 0.3223 OV-275 755.9 244.1 0.2648 Cyanoethyl sucrose 786.3 213.7 0.2318 BCEF 839.3 160.7 0.1743
Table II lists the molecular structural coefficients (SP c x) at 120°C of the first five McReynolds probes (i.e., benzene, η-butanol, 2-pentanone, 1-nitropropane, and pyridine) calculated using Equation 5. Molecular structural coefficients of n-decane (Sp
Cn-cio) for the 26 proposed SPs, calculated using Equation 18, can be seen in Table III.
Taking the differences ΔS c k = S c k
B C E F - S c k
z e r o l a n e for each solute k and ΔΡ = P B C E F _ P z e r o l a n e
= (for all K solutes), the molecular structural coefficient increment gradients relative to the polarity increment from zerolane to BCEF (ΔSck/ΔP) for benzene, n-butanol, pentan-2-one, 1-nitropropane, pyridine, and n-decane were 1.224, 4.769, 2.591, 6.445, 5.914, and -9.922, respectively. To compare with benzene, the parameter q S c k = ΔS c k /ΔS c l was used. Tcible IV shows that 1-nitropropane and pyridine had a gradient q S c k four times that of benzene, pentan-2-one had a gradient twice that of benzene, n-butanoPs gradient was three times benzene's, and n-decane had a gradient eight times that of benzene, but with the opposite sign.
Figure 3 is a plot of SPCX versus Ρ calculated using Equation 17. Optimized data were obtained by multiple regressions carried out by computer. Benzene and pentan-2-one yielded straight lines with the lowest gradients of SP c x versus Ρ when Ρ was greater than 10. The η-butanol curve lies in the middle, and both 1-nitropropane and pyridine curves lie in the upper part of the plot with the highest molecular structural coefficient values (i.e., showing the strongest solute-solvent interaction). The fitted parameters can be seen in Table IV.
Table V lists the substance-specific polarity factor values (S£f \ ) for the same solutes on the same 26 SPs, calculated using Equation 11. The molecular structural coefficients ( s c k
z e r o l a n e ) for the Zerolane standard apolar SP were: 497.5, 359.6, 457.6, 376.3, and 457.3 for benzene, n-butanol, pentan-2-one, 1-nitropropane, and pyridine, respectively (Table II).
Next, the differences ASPFk = SPFk
B C E F - S P F k
Z e r o l a n e for the first five McReynolds probes and n-decane could be calculated (Tables III and V) as 0.1889,1.0173,0.4342,1.3213,0.9916, and -0.8257 for solutes 1-5 and n-decane, respectively. In reference to benzene, q s m = ΔSPFn-C10/ΔSPF1 and qSPFk values were 5.38, 2.30, 6.99, 5.25, and -4.37 for n-butanol, pentan-2-one, 1-nitropropane, pyridine, and n-decane, respectively (substance-specific polarity factor for benzene, SPF1 = 0.1889) (Table IV). It can be inferred that 1-nitropropane had a qsPFk gradient seven times that of benzene, pyridine and n-butanol had one an average of five times as high, pentan-2-one about twice as high, and n-decane had one four times that of benzene. Again, the negative sign of the n-alkane might mean a difference with respect to the polar solutes.
Table III lists the values of the Kováts coefficients (KCP) calculated from the relevant MP values in Table I, according to Equation 14; the molecular structural coefficient ( S p
c , n - c 1 0 ) of n-decane, calculated (32) from Equation 18; and the substance-specific polarity factor of n-decane from Equation 11, bearing in mind that Kc
zerolane = 78.3 and S c , n - c 1 0
Z e r o l a n e = 100 × 10 - 78.3 = 921.7. It is shown that both S p
c , c n - 1 0 and S P F C c n - c 1 0 increased for increasingly apolar SPs; correspondingly, they reached their minimum value for the most polar SP, BCEF.
The SPFk values of the first five McReynolds probes (see Table V) and the substance-specific polarity factor for n-decane (see
499
Figure 4. Plots of substance-specific polarity factors for the first five McReynolds solutes and for n-decane versus the polarity of 26 SPs. Benzene (0), 2-pentanone (Δ), pyridine (O), n-butanol (+), 1-nitropropane (*), and n-decane ( ).
Table III. Kováts Coefficients (KP C ), Molecular Structural Coefficients ( S P c n - c 1 0 ) , and Substance-Specific Factors ( S P F n - c 1 0 ) for n-Decane on 26 Stationary Phases at 120°C
Downloaded from https://academic.oup.com/chromsci/article-abstract/35/10/495/318579by gueston 03 April 2018

Journal of Chromatographic Science, Vol. 35, October 1997
SPCk versus PP correlation data
Polynomial coefficients Correlation coefficient
Solute a b c r 2
qsck*
n-Decane 0 -9.108 838.64 0.99 -8.1 Benzene 0 1.1238 504.41 1.00 1.0 n-Butanol -0.0878 10.1395 439.18 0.96 3.0 Pentan-2-one 0 2.3762 484.17 0.98 2.1 1-Nitropropane 0.1294 14.2288 501.84 0.95 3.8 Pyridine -0.0966 11.7857 547.12 0.97 3.9
SPFPk versus PP correlation data
Polynomial coefficients Correlation coefficient
Solute a b c r 2
qsckf
n-Decane 0 -0.0099 0.9097 0.99 -4.37 Benzene 0 0.0023 1.0139 1.00 1.00 n-Butanol -0.00024 0.02820 1.2213 0.96 5.38 Pentan-2-one 0 0.00519 1.05795 0.98 2.30 1-Nitropropane -0.00034 0.03781 1.33372 0.95 6.99 Pyridine -0.00021 0.02577 1.19627 0.97 5.25
factors proposed in this work open up a new possibility for characterization of GC SPs.
Conclusion
Table III) have been plotted against the polarity values calculated using Equation 17 for the 26 (see Table I) studied SPs (Figure 4). Optimized values were obtained as those of the precedent figures. Like the previous S c k versus Ρ plots, identical curves were obtained for the latter solutes. Benzene and pentan-2-one made good straight lines showing the lowest SPF k values; the highest SPFk values corresponded to 1-nitropropane, and pyridine and n-butanol laid in the middle of the plot. On the contrary, n-decane points fell in a descending straight line with a slope of -0.0098802 (0.909723 intercept and 0.99 correlation coefficient). Then, whereas SPFk of solutes 1-5 increased from unity (zerolane) to about 2.5 (BCEF), the SPFn-C10 diminished from 1 (zerolane) to about 0.17 for BCEF, the most polar SP. The strong SPF increase for the more polar solutes (i.e., 1-nitropropane, pyridine, and n-butanol), is in contrast with the strong decrease observed in the n-alkane. The data were fitted to grade 1 and 2 polynomials, and the parameters obtained are given in Table IV As a hydrocarbon, benzene behaved somewhat similarly to n-decane because its SPF value did not increase much with P. Once again, as when the molecular structural coefficients (32) and their SP polarity dependence were examined, it is deduced from the opposite behavior of the n-alkane and the polar solutes that only dispersion interaction forces may act between the SP and n-decane, whereas, between the SPs and the McReynolds solutes, other interaction forces might intervene; the more polar the solute, the more intense the individual SPFk is. Summing up, at least qualitatively, the SPF plots allow one to distinguish fairly well between n-alkanes and other polar solutes. In light of these results, it appears that the polarity APF and Ρ scales data and the substance-specific polarity
Two new polarity scales, APF and P, are proposed and calculated for 26 SPs spanning the entire polarity range. As with other scales (i.e., McReynolds polarity, retention polarity, Kováts coefficients, solvent strength polarity, etc.), they faithfully indicate the chromatographic behavior of the organic liquids used as SPs in GC. The use of zerolane, a hypothetical apolar SP, instead of squalane minimizes the criticism of the use of both this SP and the n-alkanes as markers for very polar SPs. A new field of SP characterization has been opened.
The molecular structural coefficients (S P
C) and substance-specific polarity factors (SPFk
p) are a useful approach for determining the solute-solvent interactions. Both increased with SP polarity in polar solutes (McReynolds probes in this work), but they decreased for the apolar n-decane. This indicates that in the two cases, the SP-solute interaction is different in the sense that a polar solute may present not only dispersion interaction but also interaction
by orientation, hydrogen bond (proton donor and proton acceptor), etc. Evidence of this difference is given by the SP c and SPF versus Ρ plots reported in this work.
Finally, the thermodynamic link between the molecular structural coefficients and the substance-specific polarity factors of a solute in a given SP at 120°C is established.
Acknowledgment
Thanks are given to Dr. J. A. García-Domínguez for his help in the discussion of this manuscript.
References
1. L. Rohrschneider. A method for the characterization of gas chromatographic stationary phases. J. Chromatogr. 22: 6-22 (1966).
2. W.O. McReynolds. Characterization of some liquid phases. J. Chromatogr. Sci. 8: 685-91 (1970).
3. C.F. Poole and S.K. Poole. Characterization of solvent properties of gas chromatographic liquid phases. Chem. Rev. 89: 377-95 (1989).
4. L.R. Snyder. Classification of the solvent properties of common liquids. J. Chromatogr. Sci. 16: 223-34 (1978).
5. M.S.Klee, M.A. Kaiser, and K.B. Laughlin. Systematic approach to stationary phases selection in gas chromatography. J. Chromatogr. 279: 681-88(1983).
5 0 0
Table IV. Correlation Data of S P F P K and S P C K Versus PP
* SC increment gradient relative to benzene from zerolane to BCEF. † SPF increment gradient relative to benzene from zerolane to BCEF.
Downloaded from https://academic.oup.com/chromsci/article-abstract/35/10/495/318579by gueston 03 April 2018

Journal of Chromatographic Science, Vol. 35, October 1997
Stationary phase Benzene n-Butanol Pentan-2-one 1-Nitropropane Pyridine
Zerolane 1 1 1 1 1 Squalane 1.0139 1.2284 1.0457 1.3380 1.2036 SPB-octyl 1.0151 1.2455 1.0494 1.3626 1.2189 Apolane-87 1.0155 1.2521 1.0509 1.3722 1.2249 Apiezon-L 1.0185 1.2935 1.0602 1.4312 1.2621 OV-101 1.0191 1.3014 1.0620 1.4424 1.2692 SE-54 1.0216 1.3344 1.0697 1.4890 1.2991 OV-7 1.0277 1.4097 1.0880 1.5938 1.3673 OV-1701 1.0327 1.4662 1.1027 1.6711 1.4190 SP-392 1.0369 1.5103 1.1148 1.7306 1.4595 OV-25 1.0424 1.5631 1.1300 1.8008 1.5082 SAIB 1.0502 1.6307 1.1510 1.8890 1.5712 OV-215 1.0536 1.6581 1.1601 1.9241 1.5969 Pluronic F68 1.0644 1.7343 1.1876 2.0200 1.6693 NPGS 1.0714 1.7767 1.2046 2.0720 1.7102 PEG-20M 1.0788 1.8169 1.2223 2.1203 1.7496 EGA 1.0915 1.8744 1.2513 2.1872 1.8072 SP-2380 1.0967 1.8945 1.2629 2.2099 1.8279 SP-2310 1.1134 1.9463 1.2981 2.2659 1.8832 DEGS 1.1179 1.9576 1.3074 2.2774 1.8959 Silar 10CP 1.1358 1.9915 1.3422 2.3095 1.9364 EGS 1.1393 1.9965 1.3489 2.3137 1.9429 SP-222-PS 1.1487 2.0070 1.3661 2.3215 1.9578 OV-275 1.1640 2.0170 1.3930 2.3257 1.9760 CES* 1.1730 2.0193 1.4082 2.3238 1.9835 BCEF 1.1889 2.0173 1.4342 2.3214 1.9916
6. P.S.H. Na and LB. Rogers. Effects of test solutes on the characterization of stationary phases in gas chromatography using a Snyder triangle. J. Chromatogr. 329: 5-12 (1985).
7. B.R. Kersten and C.F. Poole. Considerations for using the solvent selectivity triangle approach for stationary phases characterization. J. Chromatogr. 452: 191-208 (1988).
8. T.J. Betts. Triangular characterization of gas chromatographic stationary phases. J. Chromatogr. 354: 1 -6 (1986).
9. B.L. Karger, L.R. Snyder, and C. Eon. An expanded solubility parameter treatment for classification and use of chromatographic solvents and adsorbents. Parameters for dispersion, dipole and hydrogen bonding interaction. J. Chromatogr. 125: 71-88 (1976).
10. R. Tijssen, H.A.H. Billiet, and P. Schoenmakers. Use of the solubility parameters for predicting selectivity and retention in chromatography. J. Chromatogr. 122: 185-203 (1976).
11. P. Laffort and F. Patte. Solubility factors in gas-liquid chromatography. Comparison between two approaches and application to some biological studies. J. Chromatogr. 126: 625-39 (1976).
12. P.H. Shetty, P.J. Younbergs, B.R. Kersten, and C.F. Poole. Solvents properties of liquid organic salts used as mobile phases in microcolumn reversed-phase liquid chromatography. J. Chromatogr. 411: 61-79(1987).
13. J.E. Brady, D. Bjorkman, C.D. Herter, and P.W. Carr. Solvatochromic investigations of polarizable polymeric liquids. Anal. Chem. 56: 278-83(1984).
14. P.W. Carr. Fundamental predictive approach to dipole-dipole interactions based on the dipole moment of the solute and the dielectric constant of the solvent.Chromatogr. 194: 105-19 (1980).
15. W. Burns and S.J. Hawkes. Choice of stationary phases in gas chromatography. J. Chromatogr. Sci. 15: 185-98 (1977).
16. R.V. Golovnya and T.A. Misharina. Determination of the energy in intermolecular interactions in gas chromatography from retention indices. J. Chromatogr. 190: 1-12 (1980).
17. B.L. Reinbold and T.H. Risby. Use of partial molar enthalpies for the characterization of stationary liquid phases. J. Chromatogr. Sci. 13: 372-77 (1975).
18. V. Pacáková and L. Feltl. Chromatographic Retention Indices. An aid to identification of organic compounds. Co-edited by Ellis Horwood Limited, Chichester, England and Informatorium , Prague, Czechoslovakia, 1992, pp. 113-14.
19. A. Wehrli and E. Kováts. Gas-Chromatographische charakterisierung organischen verbindungen. Teil 3. Berechnung der retentionsindices aliphatischer, alicyclischer und aromatischer verbindungen. Helv. Chim. Acta 42: 2709-36 (1959).
20. G. Schomburg. Gas chromatographic retention data and structure of chemical compounds. I. Alpha-branched aliphatic and alicyclic carboxylic acid methyl esters. I. Chromatogr. 14: 157-77 (1964).
21. M.J. Lee, J.C. Kuei, N.W. Adams, B.J. Tarbet, M. Mishioka, B.A. Jones, and J.S. Bradshaw. Polarizable polysiloxane stationary phases for capillary columns in gas chromatography. J. Chromatogr. 302: 303-18 (1984).
22. M. Roth and J. Novak. Correlation of two criteria of polarity for stationary phases in gas-liquid chromatography. J. Chromatogr. 234: 337-45 (1982).
23. G. Tarján, Sz. Nyiredy, M. Györ, E.R. Lombosi, T.S. Lombosi, M.V. Budahegyi, S.Y. Meszáros, and J.M. Takács. Thirtieth anniversary of the retention index according to Kováts in gas-liquid chromatography. J. Chromatogr. 472: 1-92 (1989).
24. E. Fernández-Sánchez, A. Fernández-Torres, J.A. García-Domínguez, and J.M. Santiuste. Kováts' coefficients for predicting polarities in silicone sta
tionary phases and their mixtures. Chromatographia 31: 75-79 (1991).
25. J.M. Santiuste. The use of Kováts coefficients in gas chromatography and classification of 200 non-McReynolds stationary phases. An. Quim. 90: 315-23 (1994).
26. C.F. Poole and S.K. Poole. Chromatography Today 2nd ed. Elsevier, Amsterdam, The Netherlands, 1993, p. 186.
27. Z. Szentirmai, G. Tarján, and J.M. Takács. Contribution to the theory of the retention index system. V. Characterization of polarity of stationary phases. McReynolds system. J. Chromatogr. 73: 11-18 (1972).
28. S.K. Poole and C.F. Poole. Experimental protocol for the assessment of solvent strength and selectivity of liquid phases used in gas chromatography. Chromatogr. 500: 329-48 (1990).
29. J.M. Takács. Contribution to the retention index system in gas-liquid chromatography. J. Chromatogr. Sci. 29: 382-89 (1991).
30. E. Kováts. Gas chromatographic characterization of organic compounds, I. Retention indices for aliphatic hal ides alcohols, aldehydes, and ketones. Helv. Chim. Acta 41 : 1915-32 (1958).
31. J.M. Santiuste. Molecular structural coefficients of Takács. Their dependence on column temperature, stationary phases polarity and solute chemical nature. Chromatographia 38: 701-708 (1994).
32. J.M. Santiuste. Prediction of specific retention volumes in gas chromatography by using Kováts and molecular structural coefficients. J. Chromatogr. A 690: 177-86 (1995).
33. G.A. Huber and E. Kováts. Standard stationary phases. Anal. Chem. 45:1155-63 (1973).
Manuscript accepted June 6, 1997.
501
Table V. Substance-Specific Polarity Factors (SPfK) for the First Five McReynolds Probes on 26 Stationary Phases at 120°C
* Cyanoethyl sucrose.
Downloaded from https://academic.oup.com/chromsci/article-abstract/35/10/495/318579by gueston 03 April 2018