sugar. starch. fruit. - agrana.com · high € 61.50 39.91 31.75 20.38 23.40 24.70 low € 38.40...
TRANSCRIPT

2003|04ANNUAL REPORT
AGRANA
BETEILIGUNGS-
AG
SUGAR. STARCH. FRUIT.

2003|04 2002|03 2001|02 2000|01 1999|00 1998|99
CORPORATE
DATA
Revenues €mn 866.4 875.7 842.8 760.2 703.0 684.6
Profit from operating activities €mn 76.8 80.5 76.0 66.7 47.0 42.2
Profit before income tax €mn 70.7 87.2 64.1 51.2 28.0 26.4
Consolidated earnings for the year €mn 56.5 65.4 44.3 37.6 22.0 15.3
Net cash from profit €mn 100.9 105.0 90.4 98.7 58.2 60.81
Capital investments €mn 28.5 34.0 29.0 38.1 24.4 37.9
Staff 3,841 3,916 4,463 4,753 5,290 4,506
EBIT margin 1 % 8.9 9.2 9.0 8.8 6.7 6.2
Return on sales % 8.2 10.0 7.6 6.7 4.0 3.9
Equity ratio % 54.1 51.9 47.7 44.6 41.4 36.8
PERFORMANCE ON
THE STOCK EXCHANGE
High € 61.50 39.91 31.75 20.38 23.40 24.70
Low € 38.40 28.10 17.80 17.63 18.99 19.48
Close € 61.50 39.60 29.45 17.80 19.50 20.46
Earnings per share € 5.13 5.93 4.02 3.41 2.15 1.48
Distribution per share € 1.80 1.80 1.30 1.09 1.09 1.02
Distribution yield % 2.9 4.6 4.4 6.1 5.6 5.0
P/E ratio (at close) 12.0 6.7 7.3 5.2 9.1 13.9
Stock-market capitalization
(at close) €mn 92.3 59.4 44.2 26.7 29.2 30.7
BALANCE-SHEET
DATA
Share capital €mn 80.1 80.1 80.1 80.1 80.1 73.8
Non-current assets €mn 415.5 346.3 367.2 383.7 386.2 394.6
Equity €mn 506.4 465.7 414.2 381.0 354.8 312.5
Balance-sheet total €mn 935.2 897.1 868.6 854.7 857.7 849.2
1 Applying RLG
KEY DATAapplying IFRS

ANNUAL REPORT 2003|04of AGRANA Beteiligungs-Aktiengesellschaft
for the financial year from 1 March 2003 through 29 February 2004
ADDING VALUETO THE GIFTS OF NATURE.SUGAR. STARCH. FRUIT.


HIGHLIGHTS DURING THE FINANCIAL YEART H E A G R A N A G R O U P
3HIGHLIGHTS DURING THE FINANCIAL YEAR
AGRANA Group’s consolidated earnings
for the year second-highest ever at € 56.5 million
Acquisitions create Group’s new fruit preparations
and fruit juice concentrates segment:
❚ Acquisition of Danish fruit juice concentrates
manufacturer Vallø Saft A/S
❚ Acquisition of a 34 per cent stake in Austrian
company Steirerobst AG (fruit juice concentrates
and fruit preparations)
❚ Acquisition of French company Atys S.A.
(world leader in fruit preparations) to be completed
in four stages up to the end of 2006
Profits from sugar and starch business in Austria
up on the year despite difficult market conditions
Subsidiaries in Hungary, the Czech Republic and
Slovakia ideally prepared for EU accession on 1 May 2004
AGRANA share gains 55 per cent
during the 2003/04 financial year to close
at € 61.50 (€ 64.50 on 30 April 2004)
Same distribution proposal of € 1.80 per share
for the 2003/04 financial year as for 2002/03

PREFACE BY THE CHAIRMANOF THE BOARD OF MANAGEMENT
4
PREFACE BY THE C HAIRMAN OF THE BOARD OF MANAGEMENTT H E A G R A N A G R O U P
The purpose of this preface is to give you a concentrated overview of the key developments
during the AGRANA Group’s 2003/04 financial year as well as looking forward to its probable
future development.
PROFIT IN 2003/04
The financial year was affected by poor harvests in Central and Eastern Europe. It closed with
slightly lower profit than 2002/03, when extraordinary factors such as the 14-month financial
years of the AGRANA International companies came to bear. The fact that our profit in
2003/04 came close to that of the previous year was the reward for the exceptional efficiency
with which we dealt with the short campaigns and rise in raw material costs caused by poor
harvests.
Revenues came to € 866.4 million, which was 1.1 per cent down on the year. Profit from
operating activities was 4.5 per cent down on the previous year’s figure of € 80.5 million at
€ 76.8 million. Consolidated earnings for the year were significantly down on the previous
year’s figure of € 65.4 million at € 56.5 million, but one must bear in mind that earnings in
2002/03 were boosted by sales of interests.
SHARE
We have systematically invigorated the AGRANA share over the past few years. It has gained
well-earned respect thanks to our listing in the Prime Market segment (following the conver-
sion of our preference shares into ordinary shares), thanks to the potential of Eastern Europe
that became clear to many as EU enlargement approached, and thanks to our diversification
into our new fruit juice concentrates and fruit preparations segment.
Consequently, we were able to follow up a price gain of 37 per cent in 2002/03 with a gain
of another 55 per cent in the 2003/04 financial year. As a result, the price of the AGRANA
share has risen from € 20 to over € 60 in a little over two years. As of 29 February 2004,
we had a P/E ratio of 12.0 and our share delivered a planned distribution yield of 2.9 per cent
from an unchanged distribution proposal of € 1.80 per share. The continuing growth that the
AGRANA Group will be striving for will sustain the share’s potential.
PREVAILING CONDITIONS
Enlargement of the European Union
The events of 1 May of this financial year finally justified the investments undertaken in our
core sugar and starch segments in Central and Eastern Europe since 1990 in anticipation of
the new EU accessions.
Dear Sir or Madam,
Dear Shareholder,

Our bold and early preparations for EU enlargement were
an important element of AGRANA’s strategy. Our market
shares are well secured by quotas.
WTO
The failure of Cancun delayed the Doha Round. Bilateral
negotiations between the EU and Mercosur could signal a
new beginning.
The sugar panel being called for by Brazil, Thailand and
Australia would have a crucial impact on the use of future
sugar surpluses.
EU common market organization for sugar
(sugar CMO)
The EU Commission’s efforts to reform the sugar CMO must
be seen against the background of the international work
of the WTO. The concept of a market equilibrium between EU
output and imports achieved by lowering prices has proven
to be flawed. A CMO based on community preference, region-
ality and solidarity would require market inflows to be limited.
However, that would in turn call for changes to duty-free
market access provided within the scope of the Western Bal-
kans agreement and the “Everything but arms” agreement.
The world market price of sugar
Raw materials are currently much in demand as investments,
which is keeping their dollar prices stable. However, the
strong euro is a problem because it is leading to extremely
low euro prices. 2003/04 was a year of increased global
consumption and poorer harvests, so there was virtually no
added accumulation of inventories. Consequently, the out-
look is stable.
THE SUGAR DIVISION
The flood year of 2002 was followed by the drought year of
2003. Per-hectare yields were significantly down on the year
throughout AGRANA’s markets, resulting in very short pro-
cessing campaigns. Favourable weather during the harvest
allowed us to make up for some of the losses caused by the
lack of a cost degression. Increased sugar contents reduced
energy usage, and smaller amounts of earth adhering to
the beet reduced beet delivery costs. Notwithstanding the
beet’s higher sugar content, our factories’ processing through-
put stayed at the same high level as in 2002. In the end,
the poor harvests in the EU accession countries also took
the edge off sugar surpluses on 1 May 2004.
Areas under beet in 2004 have been increased to allow for
low inventory levels.
In all, the AGRANA Group processed 4.2 metric tons of beet
(previous year: 5.3 million metric tons) into 636,000 metric
tons of sugar (previous year: 764,500 metric tons). In addi-
tion, we made 139,000 metric tons of sugar from imported
unrefined sugar in Romania.
THE STARCH DIVISION
The dry weather led to a dramatic drop in the potato harvest.
As a result, we only used 67 per cent of our EU potato starch
quota. In 2004, AGRANA will be combating the effects of
paying suppliers’ transportation costs by increasing the areas
planted with potatoes.
Exploding raw material prices seriously inflated costs in
the maize starch segment, and it was only possible to pass
a part of the increase on to the market. That was equally
true in Austria, Hungary und Romania.
Our Romanian starch subsidiary has settled in well. Follow-
ing Hungary’s accession to the EU, Hungrana in Hungary
will have an isoglucose quota of nearly 138,000 metric tons,
turning its factory into Europe’s largest isoglucose producer
and giving it an excellent competitive position.
The situation in the maize market not going to ease until
the new harvest is in. Thanks to the cut in the set-aside rate
(from 10 to 5 per cent), the harvested area will increase.
Energy costs are a particularly important factor in sugar
and starch production. From that point of view, Brussels’
endorsement of Austria’s energy-tax solution will be crucial,
as will obtaining sufficient CO2 emission certificates. It will
be essential for us to be able to obtain sufficient free certifi-
cates to cover our future growth in the starch segment.
PREFACE BY THE C HAIRMAN OF THE BOARD OF MANAGEMENTT H E A G R A N A G R O U P
5

6
PREFACE BY THE C HAIRMAN OF THE BOARD OF MANAGEMENTT H E A G R A N A G R O U P
Walter Grausam Johann Marihart Markwart Kunz

PREFACE BY THE C HAIRMAN OF THE BOARD OF MANAGEMENTT H E A G R A N A G R O U P
7
THE FRUIT DIVISION
(FRUIT JUICE CONCENTRATES
AND FRUIT PREPARATIONS)
To ensure the AGRANA Group’s continued growth once it
has achieved its primary goals in Southeastern Europe and
once the limits set by competition law in its core sugar
segment have been reached, the Board of Management
looked at a number of possible supplementary options within
the scope of a Strategy Project. The result was the develop-
ment of a new business segment, namely Fruit Juice Con-
centrates and Fruit Preparations. This segment involves the
industrial manufacture of intermediate products for the food
and beverage industries within the immediate domain of
agricultural raw materials, contract cultivation, harvest cam-
paigns, energy-intensive processing (freezing, concentrat-
ing, sterilizing, cooling) and similar areas. The division’s
products are bought by the same customer groups as sugar
and starch. Moreover, sugar and starch are also ingredients
in fruit preparations. Consequently, the segment’s strategic
“fit” is excellent. We believe that the revenue potential of
our new segment is also comparable to that of sugar and
starch, so it should keep pace with AGRANA’s present oper-
ating performance and take us to first or second place in
the European and global market rankings.
We put our fruit strategy into effect within a year by taking
over or acquiring stakes in Vallø Saft in Denmark, Steirer-
obst AG in Austria and the Atys Group in France. After their
gradual acquisition, those enterprises will generate new
revenues of between 700 and 750 million euros. That will
represent a quantum leap for AGRANA.
The cost of the acquisitions is being met out of AGRANA’s
free cash flow. The next challenge will be to successfully
assimilate the new segment and structure it in the best
possible way to enhance the synergistic benefits. Given the
global dimension of the playing field onto which AGRANA
is moving by entering the fruit preparations market, that is
going to be a complex task.
It is with great optimism that we face a future that will bring
with it years of tough economic challenges. Following our
successful preparations for Austria’s membership of the
EU and the European Union’s subsequent enlargement, we
are pleased to have been able to set a new course with the
creation of our Fruit Division.
We will continue to work for AGRANA’s further development
with the necessary transparency and clarity.
At this point, we would like to thank all those who do busi-
ness with us, our shareholders and our supervisory boards for
the trust they have placed in our company and in its manage-
ment in the course of its recent reorientation. In addition,
we would like to express our thanks to our staff, whose dedi-
cation, skill and zeal have helped us to achieve our goals
and our good results under challenging market conditions.
That same dedication, motivation and zeal will remain key to
the achievement of our corporate goals in the future.
Yours faithfully,
Johann Marihart
P.S.: Our growth has also increased our need for office
space. AGRANA will therefore be located in new premises
in the STRABAG Building at Donau-City-Strasse 9,
Vienna XXII, from June 2004.

STRUCTURE OF THE GROUPT H E A G R A N A G R O U P
9AGRANA BETEILIGUNGS-AKTIENGESELLSCHAFT
Interest Management and coordination
AGRANA ZUCKER UND STÄRKE AG
AGRANA FRUCHT GES.M.B.H. & CO KG
AGRANA INTERNATIONALEVERWALTUNGS- UNDASSET-MANAGEMENT AG & CO KG
AGRANA MARKETING- UNDVERTRIEBSSERVICE GES.M.B.H.
ÖSTERR. RÜBENSAMENZUCHT GES.M.B.H. (AUSTRIA)
AGRANA ZUCKER UND STÄRKE AG & CO KG (AUSTRIA)
RUMA HANDELSGES.M.B.H. (AUSTRIA)
MAGYAR CUKOR RT. (HUNGARY)
HUNGRANA KFT. (HUNGARY)
MORAVSKOSLEZSKÉ CUKROVARY A.S. (CZECH REPUBLIC)
SLOVENSKÉ CUKROVARY A.S. (SLOVAKIA)
S.C. AGRANA ROMANIA HOLDING AND TRADING COMP. S.R.L. (ROMANIA)
S.C. ZAHARUL ROMANESC S.A. (ROMANIA)
S.C. DANUBIANA ROMAN S.A. (ROMANIA)
S.C. A.G.F.D. TANDAREI S.R.L. (ROMANIA)
VALLØ SAFT A/S (DENMARK)
STEIREROBST AG (AUSTRIA)
ATYS S.A. (FRANCE)1
INSTANTINA GES.M.B.H. (AUSTRIA)
ZUCKERFORSCHUNG TULLN GES.M.B.H. (AUSTRIA)
HOTTLET SUGAR TRADING N.V. (BELGIUM)
PORTION PACK EUROPE HOLDING B.V. (NETHERLANDS)
1 Subject to approval by the pertinent competition authorities.

THE AGRANA SHARE10
THE AGR ANA SHAREA G R A N A B E T E I L I G U N G S - A G
The AGRANA share stood at € 39.60 at the beginning of the 2003/04 financial year. It reached
a high of € 61.50 on 27 February 2004 and a low of € 38.40 on 1 April 2003. It closed the
financial year on 29 February 2004 at € 61.50. That translates into a gain of € 55.3 per cent
during the financial year. The AGRANA share stood at € 64.50 on 30 April 2004. The com-
pany’s free float market capitalization came to € 92,250 thousand at the end of the financial
year. Over the same period, the Wiener Fliesshandelsindex (ATX) advanced by 52.6 per cent from
1,167.03 points (1 March 2003) to 1,781.0 points. It stood at 1,926.79 points on 30 April 2004.
AGRANA has been traded in the Vienna stock exchange’s Prime Market segment since 1 January
2002. To be included in the Prime Market segment, issuers must observe stricter standards of
transparency, quality and disclosure than those laid down in the provisions of the Austrian Börse-
gesetz (stock exchange act). Since 7 October 2002, the AGRANA share has been traded as an
ordinary share under security code 60.370 (ISIN Code AT0000603709).
Besides being traded in the Prime Market segment on the Vienna stock exchange, the AGRANA
share is also listed in the Präsenshandel segment on the Frankfurt stock exchange and is traded
on the Stuttgart stock exchange.
AGRANA SHARE VERSUS THE ATX OVER A THREE-YEAR PERIOD
€ 70
€ 60
€ 50
€ 40
€ 30
€ 20
€ 10
1 March 2002 1 March 2003 1 March 2004
1 March 2001 30 April 2004
AGRANA ATX (indexed)

THE AGR ANA SHAREA G R A N A B E T E I L I G U N G S - A G
11
INVESTOR AND PUBLIC RELATIONS
During an event held for institutional investors by Raiffeisen
Centrobank AG, Vienna, in St. Christoph am Arlberg from
8 to 11 February 2004, AGRANA’s Board of Management
told some 60 investors about the activities of the AGRANA
Group. In particular, the Board presented AGRANA’s activ-
ities in its new core fruit segment alongside its operations
in the sugar and starch markets.
AGRANA had a stand at the Gewinn Fair in Vienna in October
2003. In addition, information about the Group’s business
development was provided on a regular up-to-the-minute
basis in numerous press releases, at a press conference held
to present the Annual Financial Statements in May 2003, and
during one-to-one meetings with the media. In December
2003, we held a press conference to mark the acquisition of
Atys S.A. in France.
DISTRIBUTION
The Board of Management and the Supervisory Board will
be asking the General Meeting of Shareholders on 2 July
2004 to approve the distribution of a dividend of € 1.80 per
share, as for the previous year.
EVENTS, PUBLICATIONS & DIVIDENDS CALENDARFOR 2004|05 (PROVISIONAL)
24 May 2004 Publication of resultsfor the 2003/04 financial year
2 July 2004 General Meeting of Shareholders
7 July 2004 Dividend ex-day and dividend pay-day
15 July 2004 Publication of results for Q1 2004/05
15 October 2004 Publication of results for H1 2004/05
21 – 23 October 2004 Gewinn Fair
15 January 2005 Publication of resultsfor Q1 – Q3 2004/05

12
CONSOLIDATED GROUP REPORT 2003|04 13
14 The Group’s financial condition and profit position
16 The subsidiaries of
AGRANA Beteiligungs-AG
16 AGRANA Zucker und Stärke AG
16 AGRANA Marketing- und
Vertriebsservice Ges.m.b.H.
17 AGRANA Internationale Verwaltungs-
und Asset-Management AG & Co KG
17 AGRANA Frucht Ges.m.b.H. & Co KG
18 The Sugar Division
18 Prevailing conditions
20 Sugar in Austria
22 Sugar in Hungary
24 Sugar in the Czech Republic
25 Sugar in Slovakia
25 Sugar in Romania
27 The Starch Division
27 Prevailing conditions
27 Starch in Austria
30 Starch in Hungary
30 Starch in Romania
32 The Fruit Division
32 Vallø Saft A/S
33 Steirerobst AG
33 Atys S.A.
34 The environment
36 Research and development
39 Staff and social report
40 Risk report
42 Outlook for 2004|05

FINANCIAL CONDITION AND PROFIT POSITIONIN THE 2003|04 FINANCIAL YEAR
14
CONSOLIDATED GROUP REPORT 2003|04T H E A G R A N A G R O U P
Reporting in conformity with IFRS
The Consolidated Financial Statements for the 2003/04 financial year were drawn up in con-
formity with the International Financial Reporting Standards (IFRS). Reporting took place in
thousands of euros (€000). Fruit juice concentrates and fruit preparations manufacturer Vallø
Saft A/S, Køge, Denmark, acquired in April 2003, was brought into the scope of consolidation.
Profit position
Consolidated revenues during the financial year were down 1.1 per cent at € 866,423 thou-
sand (previous year: € 875,735 thousand). That was above all due to the 14-month 2002/03
financial years of the AGRANA International companies following the change in their reporting
dates. The 2003/04 financial year was a normal financial year.
Despite difficult market conditions, the Austrian members of our sugar and starch divisions
achieved a small increase in revenues. On the other hand, the Group-members in Hungary, the
Czech Republic and Slovakia recorded declines in revenues and operating profits. Those
declines attributable to the change in their reporting dates during the 2002/03 financial year,
fluctuations in exchange rates, a difficult market environment and the drought-related increase
in raw material prices in the maize segment.
For the reasons we have described, operating profit fell by 4.5 per cent to € 76,833 thousand
(previous year: € 80,476 thousand), but a very good fourth quarter fended off the decline of
13 per cent that was still being forecast after the three quarters ended 30 November 2003.
Improved sales and the systematic continuation of structural and cost optimization program-
mes in every Group company had a beneficial impact. The net loss from investing and financial
activities of € 6,055 thousand in the 2003/04 financial year did not include any of the previ-
ous year’s extraordinary income from selling interests (2002/03: sale of interests in Leipnik-
Lundenburger Invest Beteiligungs-AG ). In addition, the detrimental development of the exchange
rates of a number of Eastern European currencies versus the euro in the period up to the report-
ing date also dented earnings, resulting in a decline in profit before tax to € 70,741 thousand.
That compared with € 87,245 thousand in 2002/03. However, our favourable tax position
offset some of that drop in profit, enabling AGRANA to return consolidated earnings for the year
of € 56,539 thousand. That was the second-best result in the Group’s history.
Net cash from profit came to € 100,889 thousand (previous year: € 105,015 thousand).
REVENUES 2003|04 OPERATING PROFIT2003|04
CEECs 30%
FRUIT 5%
AUSTRIA65%
CEECs 37%
FRUIT 3%
AUSTRIA60%


16
CONSOLIDATED GROUP REPORT 2003|04T H E A G R A N A G R O U P
AGRANA ZUCKER UND STÄRKE AG
AGRANA Zucker und Stärke AG is the operating company of our Austrian sugar and starch
divisions. It has sugar factories in Hohenau, Leopoldsdorf and Tulln (all in Lower Austria),
a potato starch factory in Gmünd (Lower Austria) and maize starch factories in Aschach
(Upper Austria) and Hörbranz (Vorarlberg).
In addition, AGRANA Zucker und Stärke AG holds all our foreign subsidiaries in the sugar,
starch and fruit segments. However, their coordination and operational management are the
remit of AGRANA Internationale Verwaltungs- und Asset-Management AG & Co KG (responsible
for the sugar and starch companies in Hungary, the Czech Republic, Slovakia and Romania)
and AGRANA Frucht Ges.m.b.H. & Co KG (responsible for all companies in the Fruit Division).
AGRANA Zucker und Stärke AG recorded revenues of € 467,900 thousand during the 2003/04
financial year (previous year: € 463,300 thousand).
AGRANA MARKETING- UND VERTRIEBSSERVICE GES.M.B.H.
AGRANA Marketing- und Vertriebsservice Ges.m.b.H. (AMV) sells the products of the Austrian
subsidiaries of AGRANA Zucker und Stärke AG to the food trade (branded products) and the
food and animal feed industries and is also responsible for marketing the entire product line of
AGRANA Zucker und Stärke AG in Austria. AMV also has responsibility for brand management
and the distribution and sale of the flour brands made by Erste Wiener Walzmühle Vonwiller
Ges.m.b.H., Fritsch Mühlenbetriebsges.m.b.H. and FARINA Mühlen Ges.m.b.H., in addition to
which it handles sales of the catering products of Hellma Lebensmittel-Verpackungs-Ges.m.b.H.
(a part of Portion Pack Europe).
AMV recorded revenues of € 436,000 thousand during the 2003/04 financial year (previous
year: € 439,000 thousand).
THE SUBSIDIARIES OFAGRANA BETEILIGUNGS-AG

CONSOLIDATED GROUP REPORT 2003|04T H E A G R A N A G R O U P
17
AGRANA INTERNATIONALE VERWALTUNGS-
UND ASSET-MANAGEMENT AG & CO KG
AGRANA Internationale Verwaltungs- und Asset-Management
AG & Co KG manages the operations of all the foreign sub-
sidiaries of AGRANA Zucker und Stärke AG in the sugar and
starch segments.
AGRANA aims to expand its core business operations in the
sugar and starch segments by acquiring interests in Central
and Eastern Europe, and it plans in particular to become a
major player in the countries neighbouring Austria that joined
the European Union in the course of its recent eastward
enlargement. Within those countries, AGRANA’s primary
focus will be on exploiting opportunities to apply its produc-
tion and marketing expertise in its core sugar and starch
segments and on developing those segments to ensure their
competitiveness within the European Union. AGRANA’s plans
are based not just on transfers of cutting-edge technology
but also on the application of the Group’s wide-ranging
know-how in the raw materials, manufacturing, management,
marketing, distribution and sales fields.
AGRANA FRUCHT GES.M.B.H. & CO KG
AGRANA Frucht Ges.m.b.H. & Co KG was set up during the
2003/04 financial year. It is responsible for the operational
management of all subsidiaries in the fruit segment of
AGRANA Zucker und Stärke AG.
Fruit preparations and fruit juice concentrates make up a
new business segment for the AGRANA Group. We under-
took this diversification after carefully examining the strategic
options. The key steps in its implementation took place
rapidly within the space of a year, starting in April 2003, with
the takeover of Vallø Saft in Denmark and purchases of stakes
in Steirerobst in Austria and the Atys Group in France. The
segment will be fully consolidated as of the 2006/07 finan-
cial year and will generate additional revenues of approxi-
mately € 750 million.
One key consideration in the choice of our new business seg-
ment was that it should be a new field of operation in close
proximity to our existing core segments—sugar and starch—
and, as a consequence, be suited to AGRANA’s range of ex-
perience and capabilities. At the same time, we wanted our
new strategic business segment to be big enough (i.e. com-
parable in scale to our sugar and starch segments) to enable
us to achieve a first- or second-placed ranking in the Euro-
pean and global markets. Another important requirement
was the new segment’s compatibility with our core capabili-
ties. In other words, it should involve supplying the food and
beverage industries and should, therefore, be a business-to-
business segment.
We will be reporting on our core sugar, starch and fruit seg-
ments from page 18.

18
CONSOLIDATED GROUP REPORT 2003|04T H E A G R A N A G R O U P
PREVAILING CONDITIONS
Conditions in general
The WTO Ministers’ Conference held in Cancun in September 2003 ended without any concrete
results, jeopardizing the completion of the WTO negotiations by year-end 2004. The decisive
reason for its failure was the absence of agreement between the EU and the USA on the one
side and a coalition of 22 developing and emerging countries on the other regarding adoption
of the so-called Singapore Issues, namely investment, competition, transparency in government
procurement and trade facilitation. The EU and the USA had agreed a joint negotiating docu-
ment ahead of the conference that proposed the reduction of trade-distorting internal subsidies
by the developed countries and went beyond the proposals developed during GATT’s Uruguay
Round. In addition, it would have granted the developing countries special preference and duty-
free quotas and the retention of protection for sensitive products.
The world sugar market
Total world sugar production during 2003/04 has been estimated at about 146 million metric
tons, compared with approximately 149 million metric tons in 2002/03. Consumption is esti-
mated to have risen to 143 million metric tons (previous year: 139 million metric tons).
Consequently, a small reduction in inventories to 69.4 million metric tons has been extrapolated
for the 2003/04 sugar marketing year.
The average world market price of white sugar (as quoted in London) stood at US$ 231.50 per
metric ton at the beginning of the 2003/04 financial year (average in March 2003) and fell
steadily until November 2003 to reach US$ 190.73 per metric ton (average in November 2003).
The price of white sugar recovered slightly between December 2003 and February 2004 to
average US$ 209.82 per metric ton in February 2004 in conjunction with an average dollar
exchange rate of US$ 1.26/€ in February. At the end of the financial year (29 February 2004),
white sugar cost US$ 221.60 per metric ton at an exchange rate of US$ 1.24/€. The world
market price of white sugar continued to recover in March 2004.
The EU sugar market
Because of the dry summer of 2003, sugar production in the EU during the 2003/04 sugar
marketing year (1 July 2003 through 30 June 2004) was down on the previous year’s total of
18.4 million metric tons at an estimated 16.4 million metric tons. Areas under beet fell by
7 per cent to 1.7 million hectares in the 2003 harvest year.
The EU sugar CMO
In the spring of 2003, the European Commission initiated internal debate within the so-called
Interservice Steering Group (ISG) regarding possible reform of the EU sugar CMO. In September
2003, EU Commissioner for Agriculture Fischler presented three possible reform scenarios for
the EU sugar sector:
THE SUGAR DIVISION
CONSOLIDATED GROUP REPORT 2003|04T H E A G R A N A G R O U P
19
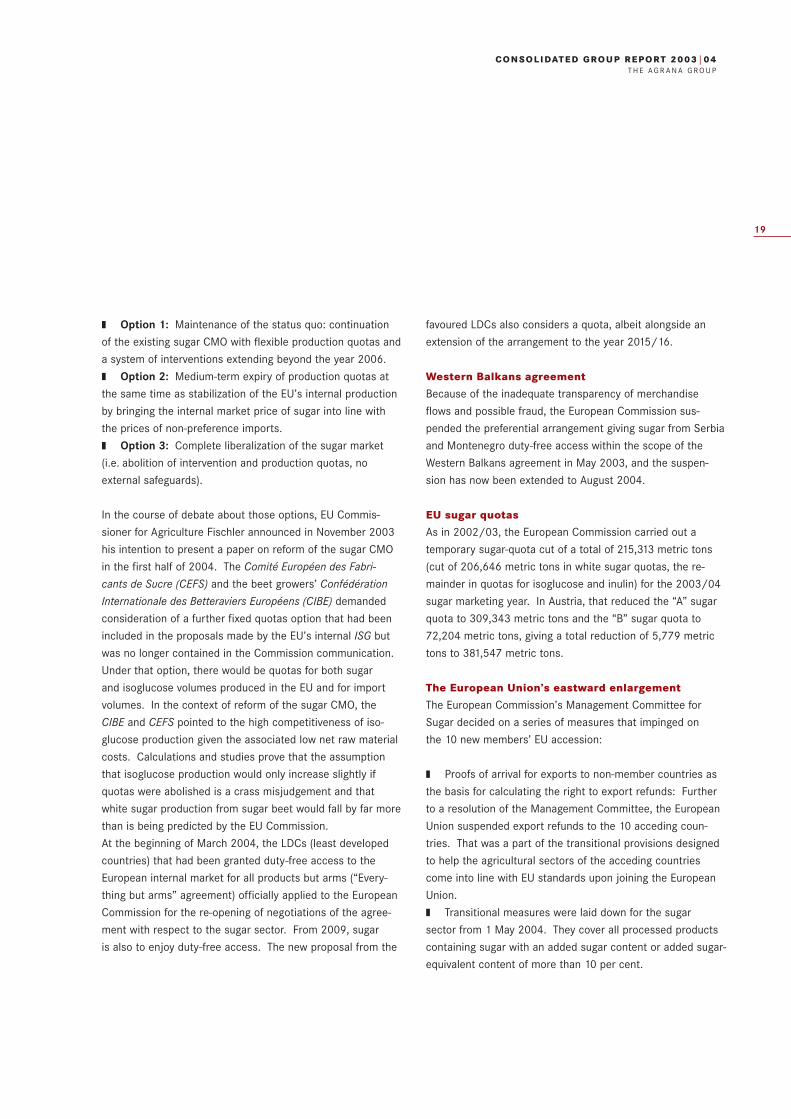
❚ Option 1: Maintenance of the status quo: continuation
of the existing sugar CMO with flexible production quotas and
a system of interventions extending beyond the year 2006.
❚ Option 2: Medium-term expiry of production quotas at
the same time as stabilization of the EU’s internal production
by bringing the internal market price of sugar into line with
the prices of non-preference imports.
❚ Option 3: Complete liberalization of the sugar market
(i.e. abolition of intervention and production quotas, no
external safeguards).
In the course of debate about those options, EU Commis-
sioner for Agriculture Fischler announced in November 2003
his intention to present a paper on reform of the sugar CMO
in the first half of 2004. The Comité Européen des Fabri-
cants de Sucre (CEFS) and the beet growers’ Confédération
Internationale des Betteraviers Européens (CIBE) demanded
consideration of a further fixed quotas option that had been
included in the proposals made by the EU’s internal ISG but
was no longer contained in the Commission communication.
Under that option, there would be quotas for both sugar
and isoglucose volumes produced in the EU and for import
volumes. In the context of reform of the sugar CMO, the
CIBE and CEFS pointed to the high competitiveness of iso-
glucose production given the associated low net raw material
costs. Calculations and studies prove that the assumption
that isoglucose production would only increase slightly if
quotas were abolished is a crass misjudgement and that
white sugar production from sugar beet would fall by far more
than is being predicted by the EU Commission.
At the beginning of March 2004, the LDCs (least developed
countries) that had been granted duty-free access to the
European internal market for all products but arms (“Every-
thing but arms” agreement) officially applied to the European
Commission for the re-opening of negotiations of the agree-
ment with respect to the sugar sector. From 2009, sugar
is also to enjoy duty-free access. The new proposal from the
favoured LDCs also considers a quota, albeit alongside an
extension of the arrangement to the year 2015/16.
Western Balkans agreement
Because of the inadequate transparency of merchandise
flows and possible fraud, the European Commission sus-
pended the preferential arrangement giving sugar from Serbia
and Montenegro duty-free access within the scope of the
Western Balkans agreement in May 2003, and the suspen-
sion has now been extended to August 2004.
EU sugar quotas
As in 2002/03, the European Commission carried out a
temporary sugar-quota cut of a total of 215,313 metric tons
(cut of 206,646 metric tons in white sugar quotas, the re-
mainder in quotas for isoglucose and inulin) for the 2003/04
sugar marketing year. In Austria, that reduced the “A” sugar
quota to 309,343 metric tons and the “B” sugar quota to
72,204 metric tons, giving a total reduction of 5,779 metric
tons to 381,547 metric tons.
The European Union’s eastward enlargement
The European Commission’s Management Committee for
Sugar decided on a series of measures that impinged on
the 10 new members’ EU accession:
❚ Proofs of arrival for exports to non-member countries as
the basis for calculating the right to export refunds: Further
to a resolution of the Management Committee, the European
Union suspended export refunds to the 10 acceding coun-
tries. That was a part of the transitional provisions designed
to help the agricultural sectors of the acceding countries
come into line with EU standards upon joining the European
Union.
❚ Transitional measures were laid down for the sugar
sector from 1 May 2004. They cover all processed products
containing sugar with an added sugar content or added sugar-
equivalent content of more than 10 per cent.

20
CONSOLIDATED GROUP REPORT 2003|04T H E A G R A N A G R O U P
❚ The self-financing mechanism and refund system will
apply in the new member-states as of 1 July 2004.
❚ Possible surplus inventories: The European Commission
will define ceilings for each new member-state to be ob-
served by not later than 1 November 2004. Surplus inven-
tories must be taken off the market by their holders without
community intervention by not later than 30 April 2005.
Traceability
From 1 January 2005, all animal feed and food manufacturers
must ensure traceability from raw materials to the finished
product (“from the farm to the fork”) in conformity with EU
Directive 178/2002.
GM labelling
The EU directive on genetically modified foodstuffs and
animal feed and regarding traceability and the labelling of
GM organisms (GMOs) has been in force since April 2004.
The traceability of GMOs is statutorily regulated to the
effect that specific information about any product put on
the market must be passed on to the next link in the food
change in writing.
SUGAR IN AUSTRIA
The sugar sector’s development during the financial year
ended was shaped by a rise in revenues generated by an
increase in domestic sugar sales to 338,000 metric tons (pre-
vious year: 309,000 metric tons) alongside a fall in the world
market price of sugar, lower molasses prices, higher costs
and increased outlay on environmental protection. Revenues
in the sugar segment totalled € 328,000 thousand (previous
year: € 324,200 thousand).
Crop growth, harvest and production
AGRANA concluded beet-cultivation contracts with 9,700
Austrian beet farmers (previous year: 10,000 Austrian beet
farmers) for an area under beet of 43,400 hectares (previ-
ous year: 44,600 hectares) during the financial year ended.
Because of the extremely dry summer of 2003, harvested
and processed beet totalled just 2.5 million metric tons
(previous year: 3.0 million metric tons). The per-hectare yield
averaged 57.5 metric tons of beet (previous year: 68.5 metric
tons). The extracted total of 386,200 metric tons of white
sugar (previous year: 455,800 metric tons) was just over the
sugar quota in place for the sugar marketing year (381,547
metric tons) at 101.2 per cent of quota.
The campaign lasted 68 days, which was shorter than the
previous year’s 83-day campaign. Despite an increased
sugar content of 17.14 per cent (previous year: 16.48 per
cent), our three sugar factories’ daily throughput was static
at the previous year’s high level of 36,750 metric tons,
and they were able to increase their daily sugar output by
3.5 per cent. That was above all thanks to a practically
glitch-free campaign and a whole number of detailed optimi-
zations. In addition, capital investments further reduced
their usage of process materials and supplies.
Nearly half of all beet deliveries reached us by rail, and for
the first time, 40,000 metric tons were also transported by
boat on the Danube from Enns to Tulln, guaranteeing supplies
to Tulln even when the Austrian railway system was at a
standstill because of a strike. Favourable weather conditions
during the harvest ensured a smooth supply of beet to the
sugar factories.
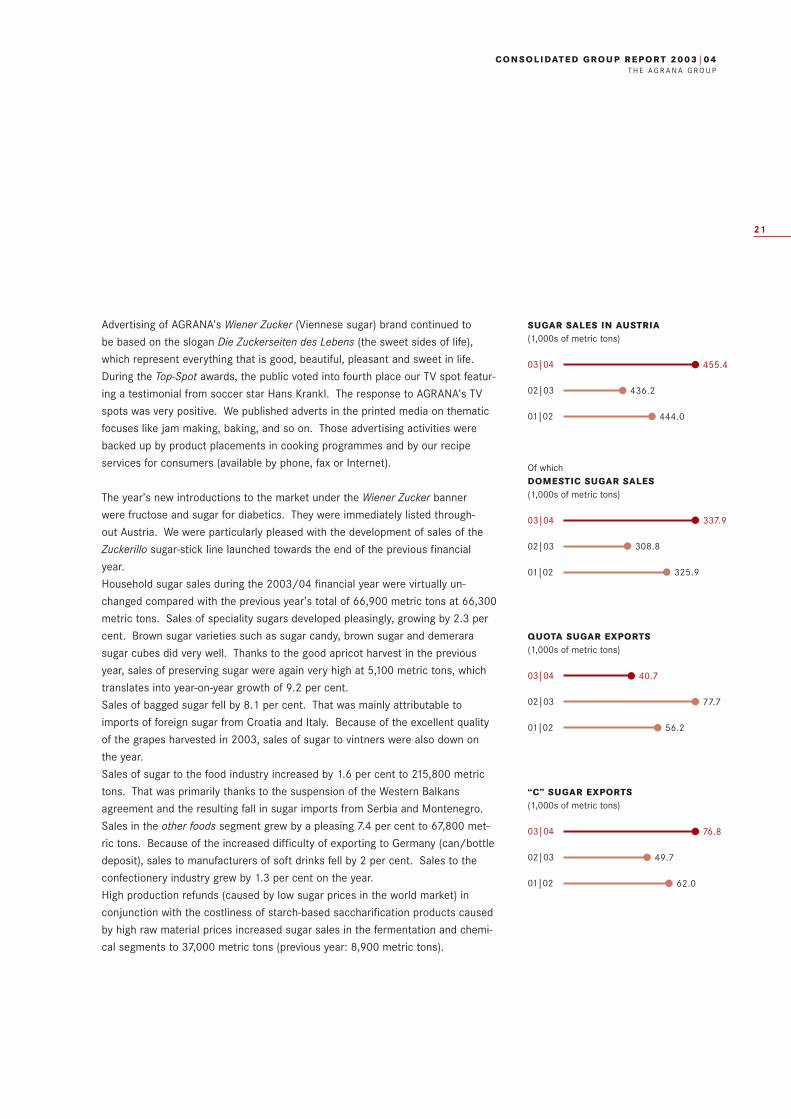
Markets
AGRANA Marketing- und Vertriebsservice Ges.m.b.H. is respon-
sible for marketing and selling our sugar products. Sugar
sales during the 2003/04 financial year totalled 455,400
metric tons, which was 19,200 metric tons or 4.4 per cent
up on the previous year’s total of 436,200 metric tons.
CONSOLIDATED GROUP REPORT 2003|04T H E A G R A N A G R O U P
21
Advertising of AGRANA’s Wiener Zucker (Viennese sugar) brand continued to
be based on the slogan Die Zuckerseiten des Lebens (the sweet sides of life),
which represent everything that is good, beautiful, pleasant and sweet in life.
During the Top-Spot awards, the public voted into fourth place our TV spot featur-
ing a testimonial from soccer star Hans Krankl. The response to AGRANA’s TV
spots was very positive. We published adverts in the printed media on thematic
focuses like jam making, baking, and so on. Those advertising activities were
backed up by product placements in cooking programmes and by our recipe
services for consumers (available by phone, fax or Internet).
The year’s new introductions to the market under the Wiener Zucker banner
were fructose and sugar for diabetics. They were immediately listed through-
out Austria. We were particularly pleased with the development of sales of the
Zuckerillo sugar-stick line launched towards the end of the previous financial
year.
Household sugar sales during the 2003/04 financial year were virtually un-
changed compared with the previous year’s total of 66,900 metric tons at 66,300
metric tons. Sales of speciality sugars developed pleasingly, growing by 2.3 per
cent. Brown sugar varieties such as sugar candy, brown sugar and demerara
sugar cubes did very well. Thanks to the good apricot harvest in the previous
year, sales of preserving sugar were again very high at 5,100 metric tons, which
translates into year-on-year growth of 9.2 per cent.
Sales of bagged sugar fell by 8.1 per cent. That was mainly attributable to
imports of foreign sugar from Croatia and Italy. Because of the excellent quality
of the grapes harvested in 2003, sales of sugar to vintners were also down on
the year.
Sales of sugar to the food industry increased by 1.6 per cent to 215,800 metric
tons. That was primarily thanks to the suspension of the Western Balkans
agreement and the resulting fall in sugar imports from Serbia and Montenegro.
Sales in the other foods segment grew by a pleasing 7.4 per cent to 67,800 met-
ric tons. Because of the increased difficulty of exporting to Germany (can/bottle
deposit), sales to manufacturers of soft drinks fell by 2 per cent. Sales to the
confectionery industry grew by 1.3 per cent on the year.
High production refunds (caused by low sugar prices in the world market) in
conjunction with the costliness of starch-based saccharification products caused
by high raw material prices increased sugar sales in the fermentation and chemi-
cal segments to 37,000 metric tons (previous year: 8,900 metric tons).
SUGAR SALES IN AUSTRIA(1,000s of metric tons)
03|04
02|03
01|02
455.4
436.2
444.0
Of whichDOMESTIC SUGAR SALES(1,000s of metric tons)
03|04
02|03
01|02
337.9
308.8
325.9
QUOTA SUGAR EXPORTS(1,000s of metric tons)
03|04
02|03
01|02
40.7
77.7
56.2
“C” SUGAR EXPORTS(1,000s of metric tons)
03|04
02|03
01|02
76.8
49.7
62.0

22
CONSOLIDATED GROUP REPORT 2003|04T H E A G R A N A G R O U P
Exports to non-member countries during the 2003/04 finan-
cial year consisted mainly of sales to Romania, Croatia,
Macedonia, Bosnia and Herzegovina and Moldova. Exports
of quota sugar and exports to non-member countries were
nearly 8 per cent down on the year at 117,600 metric tons.
Because of the poor supply of animal feed following the
drought, we were able sell dried pulp—a by-product of sugar
extraction—for 10 per cent more than in 2002/03.
The molasses market came under pressure from a glut be-
fore the start of the 2003 campaign, but relief subsequently
came from increased sales to the mixed feed industry of
nearly 16,000 metric tons at good prices to tide it over the
poor supply of harvested fodder.
Investment
The division’s capital expenditure during the 2003/04 finan-
cial year came to € 4.9 million. Among other things, that
money was spent on optimizing production plant and on
necessary replacement investments. In particular, the reno-
vation of the centrifuge in Hohenau, the new pulp press and
the reconstruction of the pressed pulp conveyor system in
Leopoldsdorf and a new preliming trough in Tulln improved
quality and energy usage and reduced our consumption of
process materials and supplies. As a result, our need for
limestone fell by another 2.8 per cent compared with the pre-
vious year’s already very good figure, putting us up among
the most efficient limestone users. The reduction made up
for increases in the prices of lime and coke.
SUGAR IN HUNGARY
Prevailing conditions
Domestic sales in the Hungarian sugar market totalled
320,000 metric tons during 2003 (previous year: 320,000
metric tons). There was an increase in imports from Poland
at the beginning of 2003, but the Hungarian authorities put
a stop to them by raising tariff safeguards. Preferred import
quotas totalling 8,000 metric tons were set for sugar from
Poland, Slovakia, the Czech Republic and EU countries for
the period from November 2003 through April 2004.
2003 was a year of powerfully fluctuating exchange rates,
rising interest rates and a hike in Hungarian VAT from
12 to 15 per cent on 1 January 2004.
The new sugar market regime in place from the time of
Hungary’s accession to the EU on 1 May 2004 was finalized
in February 2004. Agreement regarding the new EU-com-
pliant inter-trade agreement valid from the 2004 harvest
year was reached in March 2004.
During Hungary’s EU accession negotiations, its national
sugar quotas after accession were set at 400,454 metric
tons of “A” sugar and 1,230 metric tons of “B” sugar, making
401,684 metric tons in all. In addition, Hungary was given
isoglucose quotas of 127,627 metric tons of “A” isoglucose
and 10,000 metric tons of “B” isoglucose, making 137,627
metric tons in all.
Magyar Cukor Rt.’s sugar quotas total 147,137 metric tons
(146,686 metric tons of “A” sugar and 451 metric tons of
“B” sugar), giving AGRANA 36.63 per cent of Hungary’s total
sugar quotas.


24
CONSOLIDATED GROUP REPORT 2003|04T H E A G R A N A G R O U P
Magyar Cukor Rt., Budapest
During the 2003/04 financial year, Magyar Cukor recorded
revenues of € 65,400 thousand (previous year: € 83,300
thousand, albeit over a period of 14 months following the
change in reporting date).
Magyar Cukor Rt.’s two sugar factories (Petöháza and
Kaposvár) processed 637,100 metric tons of beet (previous
year: 958,000 metric tons) into 86,400 metric tons of sugar
(previous year: 131,400 metric tons) during a campaign last-
ing 53 days. The beet had a sugar content of 15.2 per cent,
which was down on the previous year’s figure of 15.6 per
cent. Because of extremely dry weather during the summer
of 2003, just 70 per cent of the contracted total of 900,000
metric tons of beet could be harvested in our Hungarian
catchment area. Per-hectare beet yields averaged 34.3 met-
ric tons during the 2003/04 financial year, which was sub-
stantially less than the previous year’s average yield of 44.3
metric tons. The catchment area of the Petöháza sugar fac-
tory was particularly hard-hit.
Massive sugar imports damaged sugar sales by Magyar
Cukor, reducing them by 10 per cent on the year. However,
it proved possible to maintain prices and defend our market
share despite stiffer competition.
The Koronas Cukor sugar range held its ground well in the
marketplace.
Most of the company’s capital expenditure during the finan-
cial year ended was on environmental protection, optimizing
energy usage and extending and optimizing capacities. Con-
struction of the sewage clarification plant at the Petöháza
sugar factory got underway.
SUGAR IN THE CZECH REPUBLIC
Prevailing conditions
A renewed attempt to reach agreement on a Czech sugar
market regime began in September 2003. Once again, it was
challenged as unconstitutional; a ruling is expected in mid-
2004. Nonetheless, the Czech agricultural ministry is among
other things preparing all the statutory changes needed for
the entry into force of an EU-compliant sugar regime and the
concomitant transitional provisions as of 1 May 2004.
Inter-trade agreements between beet growers and the sugar
industry were concluded at regional level in the Czech Repub-
lic during 2002. They will be inforce for between three and
five years. The adjustments and amendments needed to
create an EU-compliant inter-trade agreement are under pre-
paration and should be incorporated into the existing agree-
ments by not later than the start of the 2004 campaign.
The sugar quotas granted to the Czech Republic in the course
of accession negotiations total 454,862 metric tons, made
up of 441,209 metric tons of “A” sugar and 13,653 metric
tons of “B” sugar. AGRANA’s share of the Czech Republic’s
national sugar quotas was set at 18.98 per cent or 86,344
metric tons.
Moravskoslezské Cukrovary a.s., Hrusovany
This company recorded revenues of € 44,000 thousand
during the 2003/04 financial year (previous year: € 61,100
thousand, albeit over a period of 14 months following the
change in reporting date).
During the 2003 campaign, our Czech sugar factories (Hruso-
vany and Opava) processed 621,600 metric tons of sugar
beet (previous year: 760,200 metric tons) into 101,500 metric
tons of sugar (previous year: 113,000 metric tons). The beet
had a sugar content of 18.3 per cent (previous year: 16.6
per cent) and a concentrated juice purity of 92.5 per cent
(previous year: 93.3 per cent). Because of the extremely dry
weather, the per-hectare beet yield was just 41.1 metric tons
(previous year: 54.1 metric tons).
Since the legality of the Czech sugar market regime is still
unclear, the Czech market is in the sway of intensified com-
petition, severe pressure on prices and a battle for market
share between the country’s various sugar companies.
Given the market’s instability and the forthcoming period of
transition to an EU regime, the situation remains unlikely to
improve in 2004.
Domestic sugar sales by Moravskoslezské Cukrovary a.s. came
to 64,600 metric tons and the company’s sugar exports
totalled 32,700 metric tons, whereby the retail component
of its sales was well above the overall market average at over
47 per cent. AGRANA’s Korunni Cukr sugar brand is very
well-known in the Czech Republic.

CONSOLIDATED GROUP REPORT 2003|04T H E A G R A N A G R O U P
25
The company’s capital expenditure of € 2.5 million during the
financial year focused among other things on rebuilding the
boiling house at the Opava sugar factory and on investments
in the production, environmental protection and energy opti-
mization fields.
Moravskoslezské Cukrovary a.s. was ISO-certified in November
2003.
SUGAR IN SLOVAKIA
Prevailing conditions
Government instrument No. 89/2003, in force from March
2003, regulated convergence with EU conditions in the sugar
beet and sugar sectors in the period up to 1 May 2004.
The intervention agency of the Slovakian ministry of agricul-
ture apportioned the national sugar quota on the basis of
that instrument.
During Slovakia’s accession negotiations, it was granted a
total sugar quota of 207,432 metric tons made up of 189,760
metric tons of “A” sugar and 17,672 metric tons of “B” sugar.
Our subsidiary Slovenské Cukrovary a.s. was allocated a
quota of 56,671 metric tons, made up of 51,843 metric tons
of “A” sugar and 4,828 metric tons of “B” sugar. That is
27.32 per cent of the total national quota.
In November 2003, the Slovakian sugar beet growers asso-
ciation (ZPCR-SR) and the confederation of sugar manufac-
turers (SCS) concluded a national inter-trade agreement
valid until EU accession. Following EU accession on 1 May
2004, the agreement was amended as neccessary to conform
to the EU sugar CMO and was renewed by both parties.
Slovenské Cukrovary a.s., Rimavská Sobota
This company recorded revenues of € 27,100 thousand dur-
ing the 2003/04 financial year (previous year: € 28,700
thousand, albeit over a period of 14 months following the
change in reporting date).
Its sugar factories at Rimavská Sobota and Sered processed
346,100 metric tons of sugar beet (previous year: 369,500
metric tons) into 48,100 metric tons of white sugar (previous
year: 46,000 metric tons) during 2003. The beet had a
sugar content of 15.9 per cent (previous year: 14.8 per
cent) and a concentrated juice purity of 91.1 per cent (pre-
vious year: 92.4 per cent). The dry weather reduced the
per-hectare beet yield to 34.3 metric tons (previous year:
40.4 metric tons).
Sales during 2003/04 totalled 53,600 metric tons, made up
of 31,300 metric tons sold domestically and 22,300 metric
tons of exports. Sixty-one per cent of domestic sugar vol-
umes were sold to the food trade and 39 per cent were sold
to industry. Our Korunny Cukor sugar brand has become
firmly established in the Slovakian food trade. At the end
of the 2003/04 financial year, Slovenské Cukrovary a.s.
had a market share of 28 per cent in the Slovakian sugar
market.
Capital expenditure during the 2003/04 financial year came
to € 1.4 million. Most of that total was spent on rebuilding
the boiling house at Rimavská Sobota and installing new
pulp presses in Sered, and Slovenské Cukrovary a.s. also
invested in product improvements, environmental protection
and energy optimization.
Both AGRANA sugar factories in Slovakia (the Slovenské
Cukrovary a.s. factories in Rimavská Sobota and Sered) were
ISO-certified.
SUGAR IN ROMANIA
Prevailing conditions
Domestic sugar sales in Romania totalled 511,000 metric
tons during 2003 (previous year: 521,000 metric tons).
Approximately 90 per cent of that total was refined from
imported unrefined sugar. Just 10 per cent was extracted
from domestically grown sugar beet.
Despite the beneficial development of conditions for beet
growing in Romania (hike in the duty charged on imports
of unrefined sugar from 30 to 45 per cent and hike in the
white sugar tariff from 45 to 90 per cent as of October
2003), it proved impossible to boost sugar beet growing in
Romania. Furthermore, the 2003 crop was hit by extremely
dry weather.

The world market price of unrefined sugar was very unstable
during 2003. It stood at US¢ 9/lb at the beginning of 2003
but then fell steadily, reaching US¢ 6/lb by the end of Feb-
ruary 2004.
White sugar imports from Moldova dented prices from
January to May 2003, although the trough during the first
half was offset by new tariff safeguards in place from
October.
Our revenues in the Romanian sugar segment totalled
€ 59,900 thousand during the 2003/04 financial year
(previous year: € 58,900 thousand, albeit over a period of
14 months following the change in reporting date).
S.C. AGRANA Romania Holding and
Trading Company s.r.l., Bucharest
S.C. AGRANA Romania Holding and Trading Company s.r.l.
handles sales and distribution for our Romanian sugar and
starch companies. AGRANA has its own sales network with
branches spread across Romania.
We continued to extend the sugar line. Besides a variety of
50 kg bag products, it includes an extended range of sugars
for the food trade (reintroduction of icing sugar, cube sugar
and sugar sticks).
AGRANA Romania has a presence in virtually every super-
market chain in Romania with its Margaritar Zahar brand and
simultaneous sales of 1 kg sugar portions packed in poly-
ethylene bags. It is market leader in the 1 kg segment with
a retail market share of about 80 per cent. AGRANA’s sugar
sales in Romania totalled 160,000 metric tons during the
2003/04 financial year, giving it a market share of 31 per
cent.
S.C. Zaharul Romanesc S.A., Buzau
The sugar factory in Buzau extracted 101,900 metric tons
of white sugar from unrefined imported sugar during
2003. The company achieved considerable improvements
in production yields both in Buzau and at the Roman sugar
factory.
It doubled its 1 kg packaging capacity and took steps to cut
energy consumption. A combination of rationalizations and
product optimizations led to a marked increase in efficiency.
S.C. Danubiana Roman S.A., Roman
Persistent frosts delayed beet planting, and extreme heat
during the crop’s growing season led to drought damage.
A total of just 114,600 metric tons of beet (previous year:
216,200 metric tons) was processed into 13,700 metric tons
of white sugar (previous year: 18,400 metric tons) during
2003. The concentrated juice had a purity of 91.38 per
cent (previous year: 89.2 per cent), and polarization averaged
14.7 per cent (previous year: 12.6 per cent). The Roman
sugar factory extracted 50,900 metric tons of white sugar
from sugar beet and imported unrefined sugar (previous
year: 55,000 metric tons).
Capital expenditure at the Roman sugar factory doubled its
1 kg packaging capacity. In addition, action was taken to
reduce energy consumption. There too, rationalizations and
product optimizations led to a marked increase in efficiency.
26
CONSOLIDATED GROUP REPORT 2003|04T H E A G R A N A G R O U P

CONSOLIDATED GROUP REPORT 2003|04T H E A G R A N A G R O U P
27
PREVAILING CONDITIONS
Reform of the Common Agricultural Policy
On 26 June 2003, the 15 EU agriculture ministers reached agreement on the reform of the
Common Agricultural Policy (CAP). The cornerstones of the reform are the decoupling of
subsidies from production, the tying of subsidies to adherence to environmental protection
requirements combined with deductions for breaches, modulation (the diversion of parts
of direct payments to wider rural development), the retention of milk quotas until 2014 com-
bined with the retention of support prices and the introduction of a decoupled milk premium
to compensate for the cut in the intervention price, no reductions in intervention prices for
cereals, and the retention of the agreed EU funding basis for CAP of € 48,500 billion.
In the potato starch segment, the reform will retain a minimum price of € 178.31 per metric
ton of potato starch. Forty per cent of the direct payment to growers of € 110.54 per metric
ton of starch potatoes will be decoupled from production and integrated into the single farm
payment. The starch production refund will be retained. Austria will implement the so-called
single farm payment scheme, in principle completely decoupling payments.
The section on prevailing conditions in the sugar market from page 18 reports on the WTO
negotiations and the traceability requirements that will be imposed on all animal feed and
food and beverage manufacturers from January 2005.
STARCH IN AUSTRIA
Business developed satisfactorily during the 2003/04 financial year. Because of the weather,
potato starch output was very low, reducing sales of potato starch products to 43,000 metric
tons. That was 23 per cent less than in the previous year. On the other hand, there was another
increase in maize-processing capacities, and the opening up of new markets and the develop-
ment of market niches boosted sales. Overall, starch sales by volume (maize and potato starch)
were static on the year. Starch sales by value came to € 139,900 thousand (previous year:
€ 139,300 thousand). Despite the increase in raw material costs in the maize starch segment,
operating profit was up on the previous financial year thanks to the optimization of cost struc-
tures and the product portfolio.
The following action was taken ahead of planting in 2003 to ensure a sustained supply of raw
material to the Gmünd potato starch factory:
❚ Halving of the organizational levy
❚ Increase in the transportation allowance
❚ Introduction of a grower advice service
THE STARCH DIVISION

28
CONSOLIDATED GROUP REPORT 2003|04T H E A G R A N A G R O U P
Terms for the 2004 crop were made much more attractive to
further encourage starch potato growing. The new agreement
provides for freight-paid acceptance of clean starch potatoes
by AGRANA ex farm or ex terminal and distance-based com-
pensation for direct deliveries to the factory.
The extremely dry summer of 2003 and the resulting maize
shortages increased the price of maize by up to 50 per cent
on the year.
Crop growth, harvest and production
Long hot periods during the growth of the starch potato crop
in the summer of 2003 led to a massive harvest loss of 30
per cent of the contracted total. During the 2003 campaign,
1,942 farmers (previous year: 2,113 farmers) delivered just
149,600 metric tons of starch and organic starch potatoes
(previous year: 200,000 metric tons) for processing in a
campaign that lasted 92 days (previous year: 110 days). The
potatoes had a starch content of 18.3 per cent (previous
year: 17.1 per cent). Starch production fell 33 per cent short
of our EU potato starch quota of 47,691 metric tons. We
concluded cultivation contracts for 233,000 metric tons of
starch and organic starch potatoes for the 2004 harvest
year (previous year: 213,000 metric tons).
Three hundred and seventy-nine growers delivered a total
of 11,900 metric tons (previous year: 14,400 metric tons)
of potatoes and organic potatoes for the food industry. They
were used to manufacture long-life potato products and
organic products.
During the 2003/04 financial year, the Aschach maize starch
factory took delivery of and processed 280,900 metric tons
of maize (previous year: 267,000 metric tons). Processing
throughput averaged 807 metric tons a day, which was well
above the factory’s nominal capacity of 750 metric tons a
day. The gas-turbine power plant met the entirety of the
factory’s heat and power needs, and we were also able to
supply electricity to the public grid.
Markets
Despite the fall-off in starch potato volumes in the after-
math of the dry weather, it proved possible to sustain sales
of starch products with the help of maize starch products.
As a result, sales by volume during the 2003/04 financial
year were static on 2002/03.
The NON-FOOD segment (technical starches) accounted
for 26 per cent of aggregate sales by volume. In spite of
the weakening economy, they grew by 2.5 per cent during
the financial year.
Domestic sales by volume to the paper industry declined
in a period of severe downward pressure on prices, but it
proved possible to sustain the level of exports. Overall,
sales by volume were nearly 7 per cent down on the year.
Total sales by volume to the corrugated cardboard industry
in Austria fell, but exports increased, resulting in a 12 per
cent advance in overall sales by volume. Prices recovered
from year-end 2003 following severe pressure on prices
during the first half.
Sales by volume to the textile industry fell by 21 per cent.
That was attributable to a drop in exports to Asia as a result
of very low US dollar exchange rates and to imports of
Chinese and Thai tapioca starch into Asian markets. The
Turkish market, which had been stagnating because of the
War on Iraq, was very slow to recover.
Sales by volume to the construction industry increased by
40 per cent.
Sales by volume in the FOOD segment (starches for the
food industry) fell by 5 per cent. That was above all due to
the reduced availability of potato starch as a result of the
drought. Sales of long-life potato products were up on the
year in both volume and value terms.

CONSOLIDATED GROUP REPORT 2003|04T H E A G R A N A G R O U P
29
Volumes in the organic segment grew by 5.5 per cent, although powerful pres-
sure on prices did cause a small decline in revenues. For more than 10 years,
AGRANA has been processing organically grown potatoes and maize into organic
starches, organic saccharification products and organic long-life potato products
(potato flakes and dried potatoes) at the Gmünd and Aschach factories and,
since 2003, in Hörbranz. Those products are sold throughout the food industry
and are primarily used in products such as—to name just a few—fruit prepara-
tions, confectionery, baby foods, cakes and pastries and delicatessen products.
AGRANA also makes household products that include mashed potato and
dumpling mixes for major European manufacturers of branded products. Roughly
90 per cent of AGRANA’s output of organic products is exported (EU countries,
Switzerland, North America and Southeast Asia). The Gmünd, Aschach and
Hörbranz factories are certified organic producers within the meaning of Council
Regulation (EC) 2092/91 (as amended).
AGRANA has been manufacturing GM-free maize-based and waxy maize-based
products in Aschach since 1998. Ingredients are tested in a PCR (polymerase
chain reaction) laboratory set up at the Aschach factory in 2002. Testing
encompasses the entire production process, from the selection of seed, cultiva-
tion and harvesting to processing. Testing and certification are carried out in
accordance with the Austrian Codex, Germany’s Verordnung zur Änderung der
Neuartige Lebensmittel- und Lebensmittelzutaten-Verordnung and Switzerland’s
Lebensmittelverordnung. The product line includes native starches, pregela-
tinized starches, malto-dextrine and dried glucose syrups for use, for example,
in blancmanges, soups and sauces, dairy foods for infants and baby food in
jars, spice mixtures and fruit and vegetable powders.
AGRANA is one of the biggest suppliers of both organic and GM-free industrial
intermediate products in the European marketplace.
Investment
Another spray drying tower was successfully put into operation at the Gmünd
potato starch factory. Among other things, it is being used in the manufacture
of spray-dried baby foods. A new drum drying plant was installed, and bagging
on both lines was automated at the same time.
We completed planning processes ahead of the increase in maize-processing
capacities at the Aschach maize starch factory to 1,000 metric tons a day. The
first phase of that investment began at the end of the 2003/04 financial year.
Enlargement will take place in three yearly stages and will be completed in the
2006/07 financial year.
STARCH SALES IN AUSTRIA(€mn)
03|04
02|03
01|02
139.9
139.3
129.1
Of whichEXPORTED(Per cent)
03|04
02|03
01|02
59%
57%
58%

30
CONSOLIDATED GROUP REPORT 2003|04T H E A G R A N A G R O U P
STARCH IN HUNGARY
Prevailing conditions
During Hungary’s EU accession negotiations, its national
isoglucose quotas were set at 127,627 metric tons of “A”
isoglucose and 10,000 metric tons of “B” isoglucose, mak-
ing 137,627 metric tons in all. Those quotas are wholly at
Hungrana’s disposal as the only company in the Hungarian
isoglucose market.
Dry weather also made maize scarce in Hungary. Above
all, it caused an explosion in raw material prices.
HUNGRANA Keményitö- és Isocukorgyártó és
Forgalmazó Kft., Szabadegyhaza
This company’s shares are held equally by AGRANA Zucker
und Stärke AG with a subsidiary of Tate & Lyle and by ADM
(Szabadegyházai Szolgáltató és Vagyonkezelö Kft).
Hungrana recorded revenues of € 112,300 thousand during
the 2003/04 financial year (previous year: € 138,400 thou-
sand, albeit over a period of 14 months following the change
in reporting date).
Tight raw material supplies following the drought reduced
maize-processing volumes by 3 per cent on the year to
408,000 metric tons. The extremely dry weather increased
maize prices by 50 per cent on the year.
STARCH IN ROMANIA
Prevailing conditions
The Romanian starch and glucose market grew a little, but
it is still relatively small by the standards of other countries.
S.C. A.G.F.D. Tandarei s.r.l.
Our Romanian maize starch factory recorded revenues of
€ 3,300 thousand during the 2003/04 financial year.
Production having only begun in 2002, no prior-year revenue
comparisons are available.
The extremely dry summer of 2003 also led to a poor maize
harvest in Romania, resulting in a 100 per cent increase in
the price of our raw material in the maize starch segment.
S.C. A.G.F.D. Tandarei s.r.l. processed 13,000 metric tons of
maize.
Capital expenditure during 2003 focused mainly on optimiz-
ing capacities and quality and getting ready to make oxidized
starches.
Domestic starch sales, most of which were to the food and
paper industries, developed very well. The company had
market shares of about 33 per cent in both the glucose and
the maize starch market. Prices were up on the year, mainly
because of the increase in raw material costs. New packag-
ing units (Big Bags, small glucose containers) were added to
the line.

32
CONSOLIDATED GROUP REPORT 2003|04T H E A G R A N A G R O U P
The fruits preparations and fruit juice concentrates segment is a new field of activity for the
AGRANA Group. The decision to diversify into this segment was taken after professional screen-
ing of the available strategic options. The key steps in its implementation took place within
the space of a year, starting with the takeover of Denmark’s Vallø Saft in April 2003 and con-
tinuing with the acquisition of stakes in Austria’s Steirerobst and the Atys Group in France. The
segment is to be fully consolidated as of the 2006/07 financial year. It will boost the Group’s
revenues by about € 750 million.
The key consideration in the choice of our new business segment was that it should, on the
one hand, be a new field of operation close to our existing core segments—sugar and starch—
and, as a consequence, be appropriate to AGRANA’s range of experience and expertise. On the
other hand, we wanted our new strategic business segment to be big enough to enable us to
achieve a first- or second-placed ranking in the European and global markets. Another crucial
requirement was that the new segment should involve supplying the food and beverage indus-
tries (i.e. not supplying consumers). In other words, it should be a business-to-business segment.
VALLØ SAFT A/S, DENMARK
We acquired 99.34 per cent of Denmark’s Vallø Saft A/S, domiciled in Køge, on 11 April 2003.
The remaining shares were transferred in January 2004, so AGRANA now holds a 100 per cent
stake.
Vallø Saft is one of Europe’s leaders in the apple and fruit juice concentrates market. It has
in particular been able to establish itself at the high-quality end of the red berries (berry fruits)
segment. It has been marketing its apple and fruit juice concentrates particularly successfully
in Central and Western Europe, the UK and Scandinavia.
The company has two factories. Its main site is in Denmark (Køge). It built a new factory in
Lipnik, Poland (southeast of Warsaw) in 1997 and increased its capacity in 2001 and 2002.
Vallø Saft ’s buying strategy extends beyond Europe. Its products guarantee high quality for
its customers. Vallø Saft ’s specialities include processing cherries and berries, turning red-
currants, blackcurrants, raspberries and strawberries as well as elderberries, arnica berries
and many other fruits into berry juice concentrates.
The company processed 122,000 metric tons of raw fruit (apples and berries) during its 2003
financial year.
Vallø Saft ’s revenues during its 2003 financial year came to € 39 million. It employed 120
people in Denmark and Poland. Vallø Saft was already accounted for as a fully consolidated
member of the Group in our 2003/04 financial year.
THE FRUIT DIVISION
CONSOLIDATED GROUP REPORT 2003|04T H E A G R A N A G R O U P
33
STEIREROBST AG, AUSTRIA
At the close of the 2003/04 financial year, AGRANA had a
total stake of 34 per cent (direct and indirect) in Steirerobst
AG, which is domiciled in Gleisdorf, Styria.
Steirerobst has carried out very successful geographical diver-
sification during the past few years. It has one factory each
in Austria, Hungary, Poland, Romania and the Ukraine. The
company’s home factory is in Gleisdorf. It makes apple juice
concentrates and fruit preparations. Its R&D centre of excel-
lence, located in Gleisdorf, guarantees innovative power and
high product quality throughout the Steirerobst Group. The
company is excellently positioned in its strategic raw material
markets (Hungary, Poland, Ukraine). It has successfully
achieved vertical integration in the raw materials field in the
Ukraine, where it grows apples and berries on land leased
on a long-term basis. The company’s own crop management
system ensures not just high quality but also the unbroken
traceability of the fruit from the farm to the customer. The
key markets for its Ukrainian fruit products are neighbouring
countries. Because of high rates of growth in the Russian
market, it is building a new fruit preparations factory near
Moscow.
The company is a longstanding supplier to Europe’s bever-
age bottlers and dairy companies and will continue to pur-
sue that successful path. It buys its raw material inputs from
around the world and also purchases them locally during
the months when fresh fruit is harvested in Europe.
The Steirerobst Group is one of Europe’s largest fruit juice
concentrates and fruit preparations enterprises.
During the 2003 financial year, the company processed a
total of 286,000 metric tons of raw fruit into 40,200 metric
tons of apple and berry juice concentrates and 51,500 met-
ric tons of fruit preparations.
Steirerobst AG recorded revenues of € 107 million during the
2003 financial year. It had 650 year-round employees.
ATYS S.A., FRANCE
On 27 January 2004, French investment company Butler
Capital Partners signed the contract for AGRANA’s gradual
takeover of the Atys Group. The takeover will be completed
in four stages up to the end of 2006. At the time of writ-
ing, it was still pending approval by a number of national
competition authorities.
The Atys Group is the world’s leader in fruit preparations.
It has 20 factories in 16 countries in every continent.
In Europe, Atys has factories in France, Germany, Austria,
Poland, the Czech Republic, Bulgaria and Turkey. Those
factories supply customers across Europe (focus on the
dairy, baking and ice cream industries as well as on supply-
ing SMEs).
The Atys Group’s key customers include a multitude of
industrial dairies located in every continent.
Fruit preparations are fresh products with very limited shelf
lives, so they make considerable demands on manufactur-
ing facilities and organizational structures. They are also
very energy-intensive (boiling, cooling, freezing), call for
high standards of hygiene and necessitate energy-optimized
manufacturing processes.
The company recorded revenues of € 405.6 million during
its 2003 financial year. It had 1,900 year-round and 650 tem-
porarily employed staff around the world.

34
CONSOLIDATED GROUP REPORT 2003|04T H E A G R A N A G R O U P
AGRANA has spent approximately € 180,000 thousand on environmental protection in Austria
over the past 15 years. That was roughly half of total capital expenditure by the Group’s sugar
and starch divisions over the same period. The principal emphases have been energy and
water management.
The success of AGRANA’s efforts to protect the environment is amply illustrated by the sugar
factories’ energy usage. The processing heat and electrical energy needed to process the
sugar beet (i.e. to evaporate its water content of about 75 per cent) is created by combined
heat and power generating plants (steam and gas turbines). The highly efficient use of energy
resources decreases our consumption of fossil fuels and also cuts specific emissions. Since
1996, AGRANA has only been burning natural gas. Thanks to our capital outlay on reducing
energy consumption, our specific energy usage has fallen by more than 30 per cent since
1990. Over the same period, CO2 emissions have been cut by 34 per cent, making a significant
contribution to lessening harm to the environment. The Austrian sugar industry has there-
fore already achieved the Kyoto target of a 13 per cent reduction in CO2 emissions in Austria
between 1990 and 2010.
Roughly half of the beet delivered to the sugar factories in Hohenau, Leopoldsdorf and Tulln
arrives by rail. For the first time, we also transported sugar beet from Enns to Tulln by boat
during the 2003 campaign. About one third of the potato volumes processed at the starch
factory in Gmünd arrive by rail.
Hygiene is essential when manufacturing foodstuffs. AGRANA Zucker und Stärke AG applies
a Hazard Analysis Critical Control Point (HACCP) system. It is constantly updated in line with
the latest research.
THE ENVIRONMENT

CONSOLIDATED GROUP REPORT 2003|04T H E A G R A N A G R O U P
35
AGRANA uses hop extracts and natural resins for disinfecting
purposes in its sugar extraction plants. The technique was
developed by Zuckerforschung Tulln Ges.m.b.H. International
patents are pending.
The greatest possible use of closed circuits and the state-of-
the-art biological sewage clarification systems installed at
all our sugar and starch factories in Austria have optimized
our management of water resources and sewage. Proces-
sing and treating the earth stuck to the beet when it arrives
at the factory is also of considerable ecological importance.
Having been drained, the soil is stabilized in so-called soil
cassettes with a storage period of three years. After being
stabilized in this way, it can be returned to the field.
Both the sugar factories and the potato starch factory in
Gmünd sell the by-products of their manufacturing proc-
esses—so-called carbolime and potato run-off—as high-grade
fertilizers and soil enhancers.
We have greatly improved the sound insulation and filter
systems at all our factories during the past few years to con-
trol noise and dust pollution. Extensive measures were taken
to reduce dust, odour and noise pollution during the final
stage of the enlargement of the Aschach maize starch factory.
In addition, a modern biological filter now cleans exhaust
flows from the by-product lines. Those improvements have
reduced odour and noise pollution by more than half.
We offer beet and potato growers comprehensive commer-
cial and ecological advice. The gypsum absorber block
method for measuring moisture in the soil near the root of
the plant guarantees that beet fields are irrigated at exactly
the right time. Soil analyses using electro-ultra-filtration
(EUF) enable us to develop precise fertilization recommen-
dations, in turn making sure that each plant only gets exactly
what it needs to grow in addition to the nutrients already
available in the soil without over-fertilizing the land or dirty-
ing the ground water below. The inter-trade agreement be-
tween AGRANA and Austria’s beet growers includes rewards
for participating in those analyses.

36
CONSOLIDATED GROUP REPORT 2003|04T H E A G R A N A G R O U P
The research and development programme for the entirety of the AGRANA Group is in the hands
of Zuckerforschung Tulln Ges.m.b.H. (ZFT) and its 50 staff-members. The company’s activities
cover a broad range of fields from agriculture to food technology, chemistry and other technolog-
ical disciplines to microbiology and biotechnology.
THE SUGAR DIVISION
Alongside hop and pine resin products, we have now successfully developed the use of palm
nut oil products to combat the unwanted development of microorganisms and to control the
desired limited fermentation of lactic acid in extraction towers in our sugar factories. A patent
has been applied for. Our new palm nut products were presented for the first time at an
American sugar congress in April 2004 and have been offered to other sugar makers under
licence.
The technique that has been used at the Tulln factory for a number of years to admix milk of
lime in exactly the right quantities during juice purification was successfully implemented in
sugar factories with filter stations during the 2003 campaign. Further improvements were
carried out to the metering system, leading to significantly reduced consumption of lime during
the 2003 beet campaign.
The introduction of the Syrup and Magma Rapid Analysis (SIMAS) system developed by ZFT,
which makes it possible to gauge juice qualities without any labour-intensive input, significantly
reduced the Austrian sugar factories’ laboratory costs.
ZFT ’s agricultural department carried out field tests in every problematic area of practical beet
growing. One of its focuses was on cutting application rates. As a testing laboratory certified
under EN ISO/IEC 17025, ZFT also carried out tests and studies needed for the registration of
crop varieties and plant protection chemicals.
The activities of the certified testing department at Zuckerforschung Tulln were scrutinized during
a number of internal audits to check compliance with current quality standards and adherence
to procedural and testing standards. The certifying authority (Bundesministerium für Wirtschaft
und Arbeit ; federal ministry of economics and labour) periodically checked the Zuckerforschung
Tulln testing department’s proper changeover to the current ÖNORM standard EN 17025 (for-
merly EN 45001) and awarded it an unqualified certificate for the certified areas of its activities.
The officially certified testing department at ZFT also received an extended authorization to test
plant protection chemicals for sugar beet.
RESEARCH AND DEVELOPMENT
CONSOLIDATED GROUP REPORT 2003|04T H E A G R A N A G R O U P
37
Healthy soil and sustainable soil fertility are the key prerequi-
sites for reliable and cheap beet production. Soil-processing
trials paid special attention to the planting of intermediate
crops. ZFT prepared fertilization recommendations for sugar
beet and potatoes on the basis of tests of 12,500 soil sam-
ples using electro-ultra-filtration (EUF).
Trials on a total of about 4,500 plots were carried out by ZFT
itself or jointly with, among others, breeders, manufacturers
of plant protection chemicals, public testing agencies, private
consultancy firms and vocational colleges.
ZFT ’s Betaexpert Internet project created an IT-based region-
ally differentiated warning system for the integrated control
of sugar beet and potato leaf diseases. Betaexpert offers
beet growers an objective and independent source of advice.
THE STARCH DIVISION
The market’s demands and, in the final analysis, the demands
of consumers make it necessary to continuously adapt and
optimize our various starch products to suit specific appli-
cations. The prime purpose of R&D is therefore the regular
adaptation and optimization of the products we sell. Going
beyond that, one primary goal of market-orientated research
is the development of innovative starch products in new
areas of application, and we strive for close collaboration
with manufacturers when carrying out that development
work. Giving concentrated applications support to the cus-
tomer facilitates a product’s introduction to the market.
In recent years, starch products have gained a firm foothold
in the construction industry. Here too, working closely with
starch users has proven important. Product development
work in the cement-based plaster and tile adhesive segments
has been particularly prominent, and we are also continuing
to develop newer fields of use such as shotcrete.
In the textiles segment, we continued to optimize the exist-
ing product line, which has been very successful, and added
a range of special starch products for selected applications.
We have further goals in the paper and paper-processing
sectors. Our principal focus in the corrugated cardboard seg-
ment is the optimization of existing adhesive systems.
Services are also a priority alongside our research work. We
use a mobile laboratory to provide the paper industry with
prompt and professional analytical and applications support
on a direct on-the-spot basis.
A new starch adhesive for use by paper bag manufacturers
has done very well in initial practical trials. It combines
excellent adhesive properties with rapid adhesion.
Development work in the food starches segment centred on
the development of modified waxy maize starches for use
in a wide variety of areas such as mayonnaises, creams and
fruit preparations.
Steadily rising demand has created a growing need for
organic starches with improved technological properties.
Intensive trials have made it possible to enhance the proper-
ties of maize starches and waxy maize starches for use in
the organic products segment.
Pilot plants for extracting maize starch and potato starch
have given us valuable information about the industrial pro-
cessability of individual potato, waxy maize and maize
varieties and have enabled us to evaluate the characteristics
and possible applications of pure starches.
We continued our small-scale precision trials in the combat-
ing of potato weeds, phytophthora and potato beetle near
Tulln as part of our development of a potato testing facility
that meets the requirements for a certified testing depart-
ment.


CONSOLIDATED GROUP REPORT 2003|04T H E A G R A N A G R O U P
39
The AGRANA Group employed an average of 3,841 staff during the 2003/04
financial year (previous year: 3,916). That total was made up of 1,353 employees
in Austria (previous year: 1,362), 2,371 employees working for foreign Group-
members in the sugar and starch segments (previous year: 2,554), and 117
employees working for Danish fruit juice concentrates manufacturer Vallø Saft,
which was consolidated for the first time in the year under review (previous year:
no employees). That translates into a reduction of nine employees in Austria
(decrease of 26 in the Sugar Division, increase of 17 in the Starch Division).
The number of staff working for foreign Group-members in the sugar and starch
segments fell by 183.
The Group’s average total workforce during the year was 75 smaller than in
2002/03.
On our reporting date (29 February 2004), 1,247 people were working for the
consolidated members of the Group in Austria (previous year: 1,244), 2,229
were working for foreign Group-members in the sugar and starch segments
(previous year: 2,198), and 107 (previous year: no employees) were working in
the Fruit Division (Vallø Saft), making 3,583 employees in all (previous year:
3,442). The increase was mainly attributable to the addition of 107 employees
working for the Fruit Division and to staffing adjustments in Romania.
The Austrian members of the AGRANA Group spent € 495 thousand on basic
and advanced staff training during the 2003/04 financial year (previous year:
€ 473 thousand). The primary focuses of that outlay were information tech-
nology, personality development seminars and honing the English-language skills
of all staff-members working in international departments as well as on-the-job
training and apprentice training.
Management and behavioural training consisted of a number of further training
programmes targeting management skills and personality development as well
as in-house workshops for management staff at the Group’s Austrian and foreign
companies. In addition, training modules in presentation techniques and project
management were organized for young management personnel, and a meeting
was held for them at which they had an opportunity to exchange views and con-
verse with other members of the organization.
Apprentice training is an important aspect of our activities. Our Austrian Group-
members had 69 apprentices in training during the 2003/04 financial year.
The most common apprenticeship professions were engine fitter and chemical
laboratory assistant and the combined trades of engine fitter/lathe operator
and works electrician/process control technician.
Since the beginning of 2003, the AGRANA Group has been running a programme
called AGRANA-Fit that aims to improve and preserve the health of staff-mem-
bers and increase their health-awareness. The programme launched with check-
ups in which 45 per cent of our employees took part. Further focuses of the
programme are diet, exercise, smoking, stress and a healthy lifestyle.
STAFF AND SOCIAL REPORT
NUMBER OF STAFF
03|04
02|03
01|02
3,841
3,916
4,463
Of whichAUSTRIA
03|04
02|03
01|02
1,353
1,362
1,341
CEECs
03|04
02|03
01|02
2,371
2,554
3,122
FRUIT
03|04 117
40
CONSOLIDATED GROUP REPORT 2003|04T H E A G R A N A G R O U P
Risk management is integral to the structure of and processes within the AGRANA Group and,
therefore, to all its operational and strategic business processes. The principal instruments of
risk monitoring and risk control are the planning and controlling process and regular reporting.
Reporting activities and our IT-supported information systems play a particularly important part
in monitoring and controlling the business risks associated with our day-to-day business acti-
vities. The Board of Management is kept continuously up-to-date within the scope of regular
reporting activities and it also has instant online access to all the pertinent information and data.
The Board of Management has overall responsibility for the monitoring of risk management
processes. Within the scope of its monitoring activities, it receives support from an internal
auditing unit that is directly assigned to it.
The principal risks that could threaten the Group’s future development can be summarized as
follows:
MARKET RISKS
EU enlargement
In its core sugar segment, AGRANA has interests in the Czech Republic, Slovakia and Hungary.
Following those countries’ accession to the European Union, we may briefly experience market
distortions caused by delays in bringing conditions into line with the EU sugar CMO.
The EU sugar CMO
The reform announced for mid-2006 still depends on a number of uncertain external factors:
❚ The decision pending from the WTO panel on “C” sugar could seriously limit European sugar
makers’ exporting opportunities if the panel reaches a ruling that is to the European Union’s
disadvantage.
❚ Another cut in the European market’s external safeguards is under discussion in the WTO ’s
Doha Development Round.
❚ The European Union’s “Everything but arms” (EBA) agreement has given the LDCs duty-free
access for sugar imports from 2009.
RISK REPORT

CONSOLIDATED GROUP REPORT 2003|04T H E A G R A N A G R O U P
41
All those factors could jeopardize the EU sugar CMO and
might therefore cause material changes to the market
policy conditions under which the European sugar industry
operates.
PROCUREMENT RISKS
Availability of raw materials
As a processor of raw materials from primary agricultural
sources, AGRANA is affected by the procurement risks that
arise from weather conditions and the development of agri-
cultural policy in general. Because of drought-related failures
of the potato and, above all, maize harvests, our raw mate-
rial costs rose considerably in 2003. Although a carry-over
system diminishes the risk attached to failing to fully utilize
sugar beet quotas, we have nonetheless increased areas
under beet for the 2004 harvest.
In order to stimulate starch potato growing, we have
extended the area around the factory in which potatoes are
grown by reimbursing growers’ transportation costs. Con-
tracted areas have increased by about 7 per cent in 2004 as
a result. Current high maize prices and the cut in set-aside
from 10 per cent to 5 per cent have boosted maize planting,
in turn improving the harvest outlook.
The increase in raw material prices that will result from
accession to the EU has made growing our raw materials suf-
ficiently lucrative for farmers in the new EU member-states.
ENVIRONMENTAL RISKS
Kyoto emission certificates
The Austrian sugar industry was granted sufficient CO2 emis-
sion certificates during the national allocations process, but
just half of the needs of the Aschach maize starch factory
(following its ongoing enlargement) are covered. The factory’s
allowance is thus about 15,000 metric tons of CO2 short
of its requirements, which could cost it a total of between
€ 300,000 and € 450,000 a year.
LEGAL RISKS
Competition authority approval of acquisitions
by the Group’s new Fruit Division
Our acquisition of the Atys Group required separate approval
in the United States of America, France, Germany, Austria,
Mexico, Hungary, the Czech Republic and Slovakia. Compe-
tition authorities in France, Mexico and Hungary have already
approved the merger, and approval in the United States is
expected before the end of April. The acquisition was initially
disallowed in Germany (which accounts for 10 per cent of
the Atys Group’s revenues), but we are appealing against the
decision.
All the necessary competition authority approvals have
already been obtained for the Vallø Saft and Steirerobst acqui-
sitions.

42
CONSOLIDATED GROUP REPORT 2003|04T H E A G R A N A G R O U P
THE AUSTRIAN SUGAR DIVISION
The Austrian Sugar Division concluded cultivation contracts with 9,500 farmers to plant some
44,750 hectares with beet for the 2004 harvest. That was an increase in area of 3 per cent,
motivated by the low beet volumes harvested in 2003 as a result of the drought. The beet’s
growth this year has been in line with the long-term average. We anticipate a beet harvest of
2.7 million metric tons.
The inter-trade agreement was amended with regard to dried pulp refining and the basis of
assessment for “C1” beet volumes for the 2003, 2004 and 2005 harvest years, and a premium
was introduced for participating in EUF soil analyses.
Domestic sugar sales in March 2004 were 6,200 metric tons up on the same period of the pre-
vious year at 30,600 metric tons, whereby household sugar sales grew by 3 per cent to 6,000
metric tons but sales to industrial customers were 32 per cent or nearly 6,000 metric tons
up on the year. The market may experience temporary upsets caused by imports in the wake
of EU enlargement. However, the problem will be limited in duration and will cease once the
EU sugar CMO has been fully implemented.
Our three Austrian sugar factories will be investing € 10,900 thousand this year. Capital expen-
diture will focus primarily on process control, production systems, pallet storage and backup
control of the high-rack warehouse as well as on food and beverage security (traceability).
THE AUSTRIAN STARCH DIVISION
Cultivation contracts for the 2004 harvest were concluded for 233,000 metric tons of starch
and organic starch potatoes and 16,300 metric tons of potatoes and organic potatoes for
the food industry. Areas under maize in the 2004/05 financial year are likely to be static on
the year.
The Starch Division will be investing € 23,200 thousand during the 2004/05 financial year.
Capital expenditure will focus mainly on the first stage of the next increase in the daily process-
ing capacity of the Aschach maize starch factory (to 1,000 metric tons of maize) and on instal-
ling an extrusion plant at the potato starch factory in Gmünd.
SUGAR AND STARCH ABROAD
The AGRANA sugar factories have contracted the following quantities of beet for the
2004 harvest:
❚ Hungary 1,130,000 metric tons of beet
❚ Czech Republic 651,600 metric tons of beet
❚ Slovakia 400,000 metric tons of beet
OUTLOOK FOR 2004|05

CONSOLIDATED GROUP REPORT 2003|04T H E A G R A N A G R O U P
43
No beet contracts have been concluded for the 2004/05
financial year in Romania because it has proven impossible
to conclude the minimum number of contracts needed for
a beet campaign. AGRANA will only be refining imported
unrefined sugar in Romania in 2004.
AGRANA’s subsidiaries in Hungary, the Czech Republic and
Slovakia were ideally prepared for accession to the EU on
1 May 2004.
Hungary
An inter-trade agreement has been concluded between
Hungary’s beet growers and its sugar industry. In addition,
beet contracts have been brought into line with EU stan-
dards. They are already in effect for the 2004 campaign.
Preparations for EU membership in Hungary proceeded in an
orderly manner. Since sugar inventories throughout Hungary
are currently low, we anticipate few problems transferring
sugar volumes into the new EU system.
The selling price of sugar has been steadily raised towards
EU price levels. However, there are uncertainties that could
jeopardize further increases in prices and volumes after
EU accession.
The Czech Republic
Enlargement of the European Union will cause turbulence in
the Czech sugar market. Developments during the 2004/05
financial year will mainly depend on three factors:
❚ The adjustment of Czech sugar prices to bring them
into line with Western Europe. The sugar industry will be
compelled to undertake price adjustments because of rising
costs, including above all raw material costs.
❚ The need to sell the EU sugar quota of 455,000 metric
tons, which is well in excess of net domestic demand,
because the industry cannot depend on receiving the full
amount of export refunds.
❚ The bigger market that will now be competing with Czech
sugar, which has to date been relatively well safeguarded.
Those three factors may even reduce the Czech industry’s
domestic sugar sales to below last year’s total of about
300,000 metric tons.
Slovakia
The Slovakian sugar market regime introduced in March 2003
made it possible to increase Slovakian prices significantly
last year. However, volumes in the market were undermined
by imports, so domestic sales only came to roughly 135,000
metric tons. The sugar quota of 207,432 metric tons granted
to Slovakia by the EU will therefore create a situation like
that of the Czech Republic.
Romania
Sugar sales developed well during the first calendar quarter
of the 2004/05 financial year. Thanks to the development
of its own nationwide sales network, AGRANA’s market share
has continued to grow.
THE FRUIT DIVISION
Competition authorities in France, Hungary and Mexico have
already approved our acquisition of the Atys Group. Approval
in the USA has been announced, and approval in the Czech
Republic, Slovakia and Austria is to be expected in the near
future. The Bundeskartellamt (federal office of fair trading)
as the authority of original jurisdiction in Germany disallowed
the acquisition, but AGRANA will be challenging the decision
in the Land’s court of appeal in Düsseldorf.
We anticipate further growth in the fruit segment. Among
other things, Steirerobst will be putting up a new fruit prepa-
rations factory near Moscow. Building work will commence
in May 2004.

44

45CONSOLIDATED FINANCIAL STATEMENTSFOR 2003|04of the AGRANA Group applying IFRS
46 Consolidated Income Statement
47 Consolidated Cash Flow Statement
48 Consolidated Balance Sheet
49 Consolidated Equity Statement
50 Consolidated Non-Current Assets Statements
52 Notes to the Consolidated Financial Statements
52 General principles
52 Consolidation policies
61 Segment Report
61 Notes to the Income Statement
67 Notes to the Cash Flow Statement
69 Notes to the Balance Sheet
76 Notes on financial instruments and
derivative financial instruments
79 Information regarding business relationships
with companies and individuals considered
to be related parties
80 Group interests
82 The company’s boards and officers
83 Auditors’ Report and Certificate
84 Performance indicators

46
CONSOLIDATED FINANCIAL STATEMENTS FOR 2003|04T H E A G R A N A G R O U P
CONSOLIDATED INCOME STATEMENTFOR THE 2003/04 FINANCIAL YEARfrom 1 March 2003 through 29 February 2004
2003/04 Previous yearNote €000 €000
1. Sales revenues (1) 866,423 875,7352. Change in stocks of finished
and unfinished products (2) 1,814 (25,324)3. Other capitalized self-produced items (2) 1,483 1,4324. Other operating income (3) 17,222 21,8105. Expenditure on materials
and other purchased inputs (4) (548,276) (533,419)6. Expenditure on staff (5) (96,411) (97,393)7. Depreciation/amortization/
write-downs of intangible non-currentassets (without goodwill) andtangible non-current assets (6) (39,930) (40,351)
8. Other operating expenses (7) (125,492) (122,014)9. Profit (loss) from operating activities 76,833 80,476
(subtotal of items 1 – 8)
10. Amortization/write-downs of goodwill (37) (4,950)11. Net income from restructuring (8) 0 (382)12. Profit/(loss) from ordinary activities 76,796 75,144
(subtotal of items 1 – 11)
13. Net interest income (9) (1,463) (1,778)14. Net income from interests
held as investments (10) 3,225 3,37215. Other profit (loss) from investing
and financial activities (11) (7,817) 10,50716. Profit/(loss) from investing (6,055) 12,101
and financial activities(subtotal of items 13 – 15)
17. Profit before income tax 70,741 87,24518. Income tax expense (12) (13,199) (19,934)
19. Profit after income tax 57,542 67,31120. Minority interests in
consolidated earnings for the year (1,003) (1,929)21. Consolidated earnings for the year 56,539 65,382
Earnings per share (13) € 5.13 € 5.93Diluted earnings per share (13) € 5.13 € 5.93

CONSOLIDATED FINANCIAL STATEMENTS FOR 2003|04T H E A G R A N A G R O U P
47CONSOLIDATED CASH FLOW STATEMENTFOR THE 2003/04 FINANCIAL YEARfrom 1 March 2003 through 29 February 2004
2003/04 Previous yearNote €000 €000
Profit after income tax 57,542 67,311Depreciation/amortization/write-downsof non-current assets 40,017 45,803Write-ups of non-current assets (186) (124)Changes in long-term provisions 5,393 (6,586)Gains (losses) arising from the inclusion of associates (1,589) 122Gains (losses) arising from disposals/retirements of non-current assets (288) (1,511)Net cash from profit (14) 100,889 105,015
Changes in inventories (7,600) 19,853Changes in accounts receivableand deferred tax assets (12,120) (9,839)Changes in other provisions (8,923) 2,733Changes in accounts payable 11,289 (24,668)Effect of changes in foreign exchange rateson non-fund positions 554 (1,098)Net cash from operating activities (14) 84,089 91,996
Proceeds from disposals/retirementsof non-current assets 12,136 24,374Expenditure on investments in tangibleand intangible non-current assets (28,479) (34,024)Expenditure on financial investments (36,820) (13,039)Changes in the scope of consolidation (15,580) 0Net cash from investing activities (15) (68,743) (22,689)
Changes in long-term financial obligations (49,722) (4,357)Changes in short-term financial obligations (4,119) 9,320Distribution (20,690) (15,189)Net cash from financing activities (16) (74,531) (10,226)
Net increase (decrease) in cash and cash equivalents (59,185) 59,081Effect of changes in foreign exchange rateson cash and cash equivalents (151) 77Revaluations in accordance with IAS 39 (263) 254Cash and cash equivalents at beginning of period 156,527 97,115Cash and cash equivalents at end of period 96,928 156,527Of which available-for-sale securities 46,835 103,675
Of which means of payment 50,093 52,852

48
CONSOLIDATED FINANCIAL STATEMENTS FOR 2003|04T H E A G R A N A G R O U P
29 February End of2004 previous year
Note €000 €000
A. Non-current assets (17)
I. Intangible non-current assets 29,379 22,238II. Tangible non-current assets 266,229 265,840III. Financial investments 119,910 58,215
415,518 346,293B. Current assets
I. Inventories (18) 291,585 259,107II. Accounts receivable
and other assets (19) 127,120 132,243III. Deferred tax assets (20) 4,061 2,916IV. Shares and other securities (21) 46,835 103,675V. Cash, cheques, bank balances 50,093 52,852
519,694 550,793Total assets 935,212 897,086
A. Equity (22)
I. Share capital 80,137 80,137II. Capital reserves 213,463 213,463III. Retained earnings reserves 156,309 106,750IV. Consolidated earnings for the year 56,539 65,382
506,448 465,732B. Minorities 9,374 9,273
C. ProvisionsI. Provisions for retirement benefits,
severance/redundancy paymentsand anniversary bonuses (23a) 55,574 57,415
II. Provisions for deferred taxes (23b) 25,651 21,528III. Provisions for other taxes
and other provisions (23c) 83,471 84,824164,696 163,767
D. Accounts payable (24)
I. Financial obligations 120,508 140,369II. Other accounts payable 134,186 117,945
254,694 258,314Total equity and liabilities 935,212 897,086
Contingent liabilities (25) 3,532 4,161
CONSOLIDATED BALANCE SHEETDATED 29 FEBRUARY 2004
A S S E T S
E Q U I T Y A N DL I A B I L I T I E S

CONSOLIDATED FINANCIAL STATEMENTS FOR 2003|04T H E A G R A N A G R O U P
49CONSOLIDATED EQUITY STATEMENTFOR THE 2003/04 FINANCIAL YEAR
Retained earnings reservesOther
retainedShare Capital Revaluation earnings Exchange Earnings Total
capital reserves reserve reserves differences for the year€000 €000 €000 €000 €000 €000 €000
On 29 February 2004
On 1 March 2003 80,137 213,463 1,653 117,454 (12,357) 65,382 465,732Consolidated earningsfor the year 0 0 0 0 0 56,539 56,539Distribution 0 0 0 0 0 (19,849) (19,849)Changes in foreignexchange rates 0 0 0 0 (3,563) 0 (3,563)Revaluations (IAS 39) 0 0 7,499 0 0 0 7,499Allocated to reserves 0 0 0 45,533 0 (45,533) 0Other changes 0 0 0 90 0 0 90
On 29 February 2004 80,137 213,463 9,152 163,077 (15,920) 56,539 506,448156,309
Previous year
On 1 March 2002 80,137 213,463 2,212 86,215 (12,170) 44,325 414,182Consolidated earningsfor the year 0 0 0 0 0 65,382 65,382Distribution 0 0 0 0 0 (14,335) (14,335)Changes in foreignexchange rates 0 0 0 0 (187) 0 (187)Revaluations (IAS 39) 0 0 (559) 0 0 0 (559)Allocated to reserves 0 0 0 29,990 0 (29,990) 0Other changes 0 0 0 1,249 0 0 1,249
On 28 February 2003 80,137 213,463 1,653 117,454 (12,357) 65,382 465,732106,750

50
CONSOLIDATED FINANCIAL STATEMENTS FOR 2003|04T H E A G R A N A G R O U P
CONSOLIDATED NON-CURRENT ASSETS STATEMENTSFOR THE 2003/04 FINANCIAL YEAR
Costs of purchase and/or conversion
Effect ofchange inscope of Revalua-
1 March consoli- Exchange Additions Reallo- Disposals/ tions 29 February2003 dation differences cations retirements (IAS 39) 2004€000 €000 €000 €000 €000 €000 €000 €000
I. Intangiblenon-current assets
1. Commercial privileges,licences, software 16,949 0 (76) 817 116 235 0 17,571
2. Goodwill 21,712 6,615 (12) 0 0 0 0 28,31538,661 6,615 (88) 817 116 235 0 45,886
II. Tangiblenon-current assets
1. Land, land-equivalent rights,buildings 254,965 7,339 (1,646) 4,093 756 892 0 264,615
2. Technical plantand machinery 534,678 15,017 (3,315) 15,272 3,042 5,229 0 559,465
3. Other plant, office furnitureand equipment 58,547 (6) (420) 4,769 130 2,124 0 60,896
4. Prepayments,plant under construction 5,136 0 (104) 3,528 (4,044) 4 0 4,512
853,326 22,350 (5,485) 27,662 (116) 8,249 0 889,488III. Financial investments1. Interests in subsidiaries 3,381 0 0 0 0 0 0 3,3812. Interests in associates 28,038 0 0 11,271 (24,658) 3,050 0 11,6013. Interests held as investments
in other enterprises 182 0 (1) 22,937 24,658 25 10,200 57,9514. Loans to companies
in which the Group hasinterests held as investments 254 0 (5) 40 0 40 0 249
5. Securities classified asnon-current assets 33,271 0 (4) 4 0 10,888 1,219 23,602
6. Other loans 137 0 (7) 51 0 49 0 1327. Prepayments for
financial investments 0 0 0 27,000 0 0 0 27,00065,263 0 (17) 61,303 0 14,052 11,419 123,916
Total non-current assets 957,250 28,965 (5,590) 89,782 0 22,536 11,419 1,059,290

CONSOLIDATED FINANCIAL STATEMENTS FOR 2003|04T H E A G R A N A G R O U P
51
Depreciation/amortization/write-downs Book values
Effect of Depreciation,change in amortization,scope of write-downs
1 March consoli- Exchange during Reallo- Disposals/ Write-ups 29 February 29 February 28 February2003 dation differences year cations retirements 2004 2004 2003€000 €000 €000 €000 €000 €000 €000 €000 €000 €000
16,423 0 (69) 317 11 204 0 16,478 1,093 5260 0 (8) 37 0 0 0 29 28,286 21,712
16,423 0 (77) 354 11 204 0 16,507 29,379 22,238
138,444 703 (743) 8,978 0 643 14 146,725 117,890 116,521
401,593 6,381 (2,301) 26,512 3 4,903 170 427,115 132,350 133,085
47,209 (6) (280) 4,123 0 1,851 2 49,193 11,703 11,338
240 0 0 0 (14) 0 0 226 4,286 4,896587,486 7,078 (3,324) 39,613 (11) 7,397 186 623,259 266,229 265,840
2,015 0 0 0 0 0 0 2,015 1,366 1,3663,050 0 0 0 0 3,050 0 0 11,601 24,988
35 0 0 20 0 25 0 30 57,921 147
254 0 (5) 0 0 0 0 249 0 0
1,694 0 0 30 0 12 0 1,712 21,890 31,5770 0 0 0 0 0 0 0 132 137
0 0 0 0 0 0 0 0 27,000 07,048 0 (5) 50 0 3,087 0 4,006 119,910 58,215
610,957 7,078 (3,406) 40,017 0 10,688 186 643,772 415,518 346,293

The IFRS-compliant Consolidated Financial Statements of the AGRANA Group for 2003/04 were
drawn up in conformity with the standards (IFRS, IAS) published by the International Account-
ing Standards Board (IASB) inclusive of the interpretations issued by the International Financial
Reporting Interpretations Committee (IFRIC) as applicable to the financial year under review.
We apply new IASB standards from the time of their entry into force. Their application and
changes in our recognition and measurement policies are elucidated in the pertinent sections
in the Notes. Following the recommendation of the IASB, AGRANA applied IFRS 3 ahead of
time in conjunction with the revised versions of IAS 36 and IAS 38:
❚ IFRS 3 Business Combinations
❚ IAS 36 (revised) Impairment of Assets
❚ IAS 38 (revised) Intangible Assets
The financial statements of the fully consolidated companies accounted for in the Consolidated
Financial Statements were subject to homogeneous recognition and measurement policies.
When preparing the Consolidated Financial Statements, we observed the principles of clarity,
intelligibility and materiality. The total costs method was used in the Income Statement.
The financial statements of all the principal fully consolidated Group-members and of all fully
consolidated Group-members that were subject to compulsory audits under national legislation,
whether domestic or foreign, were audited by independent auditors and were granted unquali-
fied auditors’ certificates. The auditors also attested the proper transition between local annual
financial statements drawn up in conformity with commercial law and the IFRS-compliant
individual financial statements drawn up in accordance with policies applied homogeneously
throughout the Group.
Scope of consolidation
Besides AGRANA Beteiligungs-AG, the Consolidated Financial Statements generally include all
domestic and foreign Group-members in which AGRANA Beteiligungs-AG held voting majorities
by way of direct or indirect shareholdings or which were under its sole control and which were
not Group-members of minor significance. On the reporting date, 23 companies (previous
year: 20 companies) were accounted for in the Consolidated Financial Statements as fully con-
solidated Group-members. Two companies (previous year: two companies) underwent propor-
tionate consolidation in proportion to the stake held in them by the Group.
GENERAL
PRINCIPLES
CONSOLIDATION
POLICIES
NOTES TO THE CONSOLIDATEDFINANCIAL STATEMENTSof the AGRANA Group
52
CONSOLIDATED FINANCIAL STATEMENTS FOR 2003|04T H E A G R A N A G R O U P

Changes in the scope of consolidation came about as follows:
Additions❚ Vallø Saft A/S, Køge, Denmark
Activity: production of fruit juice concentrates | Acquired: April 2003 | Stake: 100 per cent
❚ Vallø Saft Polska SP z.o.o., Lipnik, Poland
Activity: production of fruit juice concentrates | Acquired: April 2003 | Stake: 100 per cent
❚ AGRANA Frucht Gesellschaft m.b.H., Vienna
Activity: management | Acquired: May 2003 | Stake: 100 per cent
❚ AGRANA Frucht Gesellschaft m.b.H. & Co KG, Vienna
Activity: management | Founded: May 2003 | Stake: 100 per cent
The associated acquisitions cost a total of € 15,707 thousand.
Excluded❚ S.C. Romecanica s.r.l., Roman, Romania
The changes in the scope of consolidation affected the Consolidated Financial Statements
as follows, expressed in terms of changes in items on the Balance Sheet and in the Income
Statement:
At time of 29 February
acquisition 2004
€000 €000
Non-current assets 17,048 16,168
Current assets 32,124 31,943
Total assets 49,172 48,111
Equity 9,119 6,938
Provisions and accounts payable 40,053 41,173
Total equity and liabilities 49,172 48,111
2003/04
€000
Revenues 38,696
Profit from operating activities 2,219
Earnings for the year (1,927)
CONSOLIDATED FINANCIAL STATEMENTS FOR 2003|04T H E A G R A N A G R O U P
53

HUNGRANA Kft., which is jointly managed, and its subsidiary Hungranatrans Kft., Szabadegy-
haza, Hungary, in which AGRANA Zucker und Stärke AG, Vienna, holds a 50 per cent stake,
underwent proportionate consolidation. Companies that underwent proportionate consolida-
tion were recorded on the Consolidated Balance Sheet with non-current assets of € 16,040
thousand (previous year: € 17,675 thousand), current assets of € 22,578 thousand (previous
year: € 18,253 thousand), equity of € 15,622 thousand (previous year: € 17,206 thousand)
and provisions and accounts payable of € 22,996 thousand (previous year: € 18,721 thou-
sand). In the Income Statement, those companies were recorded with revenues of € 56,165
thousand (previous year: € 68,986 thousand).
Eight companies (previous year: one company) were accounted for as associates using the
equity method. The following companies were added to the list of companies accounted for
using the equity method:
❚ Steirische Agrarbeteiligungsgesellschaft m.b.H., Raaba
Activity: holding company | Acquired: July 2003 | Stake: 25.1 per cent
❚ Steirerobst AG, Gleisdorf, and its five subsidiaries
Activity: production of fruit juice concentrates and fruit preparations |
Acquired: July 2003 | Stake: 16.7 per cent direct (34.42 per cent in all)
Reporting date
During the 2002/03 financial year, the reporting dates of all the AGRANA International com-
panies were harmonized with the Consolidated Group’s reporting date, namely the last day of
February, insofar as that was allowed by national statutory provisions. Special reporting-date
financial statements were drawn up for the Romanian Group-members for the period up to and
including that date. Consequently, the Group-members in Central and Eastern Europe were
brought into the Consolidated Financial Statements for 2002/03 with respect to a period of
14 months (i.e. to include January and February 2003). That must be taken into account when
comparing figures for the 2003/04 financial year with figures for 2002/03.
2003/04 2002/03 2002/03
12 Months 14 Months 12 Months
€000 €000 €000
Revenues 866,423 875,735 835,437
Profit after tax 57,542 67,311 65,184
Consolidated earnings for the year 56,539 65,382 63,374
54
CONSOLIDATED FINANCIAL STATEMENTS FOR 2003|04T H E A G R A N A G R O U P

The new additions to the circle of fully consolidated Group-members—Vallø Saft A/S, Køge,
Denmark, and Vallø Saft Polska SP z.o.o., Lipnik, Poland—were included with a reporting date
of 31 December 2003. As allowed by IAS 27, interim financial statements were not prepared
because their reporting dates did not differ from the Consolidated Group’s reporting date by
more than three months.
Accounting for the Steirerobst Group using the equity method was based on its consolidated
financial statements as of and for the period ended 31 December 2003.
Consolidation
❚ Capital underwent consolidation using the purchase method, offsetting costs against the
Group’s interest in the equity of the Group-members concerned as at the time of their acquisi-
tion. Resulting goodwill was recorded under non-current assets insofar as its fair value differed
from its book value. Goodwill remaining after first-time consolidation was captured under
Intangible non-current assets.
❚ Up to and including 2002/03, goodwill was amortized over its expected useful life (gener-
ally over 20 years on a straight-line basis) in conformity with IAS 22.
❚ IFRS 3, published by the IASB on 31 March 2004, was applied with effect from 1 March
2003. Pursuant to IFRS 3, goodwill is no longer amortized. Instead, it is tested for impairment
at least once a year, which can lead to a write-down (impairment-only approach).
❚ Interests in associates were accounted for using the equity method on the basis of their
most recently available annual financial statements. Local measurement methods were retained
for companies accounted for using the equity method. In conformity with IFRS 3, the excess
of the enterprise’s interest in a company’s equity in the year of acquisition over the cost of the
acquisition was recorded under Income from associates. In conformity with IFRS 3, goodwill
arising from first-time valuation is no longer amortized.
❚ Intragroup sales, expenses and income as well as all receivables, payables and provisions
arising within the scope of transactions between the consolidated Group-members were
eliminated.
❚ Assets arising from intragroup deliveries as included in non-current assets and invento-
ries were adjusted by the amount of intercompany results insofar as they were not of minor
significance.
CONSOLIDATED FINANCIAL STATEMENTS FOR 2003|04T H E A G R A N A G R O U P
55

56
CONSOLIDATED FINANCIAL STATEMENTS FOR 2003|04T H E A G R A N A G R O U P
Foreign-currency translation
❚ The annual financial statements of foreign Group-members were translated into euros from
their reporting currencies in accordance with IAS 21. The reporting currency of every Group-
member except the Group-members in Romania was the local currency of the country concerned
on the grounds that foreign Group-members were trading autonomously from a financial, com-
mercial and organizational point of view.
❚ Their non-current assets, other assets and debts were translated on that basis applying the
middle rates of exchange ruling on the reporting date. Expenses and income were translated
at annual average rates of exchange.
❚ The financial statements of the Romanian Group-members were drawn up in euros because
the euro was to a considerable extent the currency in which transactions were denominated
and because the euro had a significant impact on those companies’ financial success. Trans-
actions were translated into euros as at the time of being booked. Consequently, it was not
necessary to translate financial statements as laid down by IAS 29.
❚ The following exchange rates were applied to companies employing a reporting date of
29 February 2004:
Rate on reporting date Average rate
Country Currency 2003/04 2002/03 2003/04 2002/03
€ € € €
Romania € (EUR) 1.00 1.00 1.00 1.00
Slovakia Sk (SKK) 40.53 41.89 41.30 42.57
Czech Republic Kc (CZK) 32.45 31.77 32.03 30.91
Hungary Ft (HUF) 257.18 243.76 257.04 242.93
❚ The following exchange rates were applied to companies consolidated for the first time
with a reporting date of 31 December 2003:
Rate on
reporting date Average rate
Country Currency 2003/04 2003/04
€ €
Denmark DKr (DKK) 7.44 7.43
Poland Zl (PLN) 4.73 4.41
ˇ

Recognition and measurement
❚ In March 2004, the International Accounting Standard Board (IASB) published IFRS 3 in
conjunction with revisions of IAS 36 and IAS 38. AGRANA has applied those standards with
effect from 1 March 2003.
❚ Acquired goodwill is recorded under Intangible non-current assets. Until 28 February 2003,
goodwill was amortized on a straight-line basis over a useful life of 20 years. As from 1 March
2003, goodwill and intangible non-current assets with an indefinite useful life have no longer
been amortized. Instead, they have been tested for the need for an unscheduled impairment
write-down at least once a year.
❚ To satisfy the provisions of IFRS 3 in conjunction with IAS 36 and to facilitate the detection
of any impairments of goodwill, AGRANA generally structures its cash-generating units along
business segment lines (sugar, starch and fruit).
❚ Below, the book value of each cash-generating unit is measured by allocating assets and
liabilities, including ascribable goodwill and intangible assets. Unscheduled write-downs are
carried out if the amount recoverable on a cash-generating unit declines below its book value
inclusive of goodwill.
❚ When testing for impairment using discounted cash flow analysis, AGRANA only recognizes
discounted expected future cash flows from cash-generating units. The measurement of cash
flows from each cash-generating unit is based on business plans with a plan horizon of five
years. Plan calculations make allowance for possible risks associated with future amendments
to the EU sugar CMO.
❚ The weighted average cost of capital is used as the basis for discounting future cash
flows, whereby equity costs are based on a 4.83 per cent yield on a 30-year federal bond
plus reasonable charges for risks. The costs of borrowed capital are brought into the
measurement of the weighted average cost of capital on the basis of actual circumstances.
❚ We established that the goodwill recognized in the Consolidated Financial Statements
was free from impairments. No unscheduled write-downs were needed during the 2003/04
financial year.
CONSOLIDATED FINANCIAL STATEMENTS FOR 2003|04T H E A G R A N A G R O U P
57

❚ Other intangible non-current assets acquired for valuable consideration were captured
at cost and are being amortized on a straight-line basis over their expected useful lives of
between five and 15 years.
❚ Tangible non-current assets were valued at cost of purchase and/or conversion less
depreciation and unscheduled write-downs. Besides material and labour costs, overheads on
a prorated basis were captured in the conversion costs of self-produced assets. Financing
costs were not included.
❚ In conformity with IAS 20, public grants received for purchasing or converting assets
(capital investment grants and allowances) were recorded under Accounts payable (prepaid
income) and are subject to release in accordance with the useful lives of those assets.
❚ For the most part, depreciation of tangible non-current assets is based on the following
useful lives:
Buildings 30 – 50 years
Technical plant and machinery 10 – 15 years
Office furniture and equipment 3 – 10 years
❚ Unscheduled write-downs were carried out in conformity with IAS 36 if the recoverable
amount of an asset had declined below its book value. The recoverable amount was taken to
be the higher of the asset’s net selling price and value in use.
❚ Interests in associates, insofar as not of minor significance, were accounted for at their
book values using the equity method.
❚ Interests in non-consolidated subsidiaries and other interests held as investments were
generally measured to fair value in accordance with IAS 39. Insofar as that fair value could
not be reliably measured, they were recognized at cost. A write-down was carried out if there
was evidence of a permanent impairment.
❚ Loans were recognized at nominal values. Non-interest-bearing and low-interest long-term
loans were recorded at present values.
❚ Held-to-maturity securities were recognized at cost or—if a permanent impairment was to
be expected—at a lower market or stock-exchange price. Other securities (available-for-sale
securities) were recognized at market values, whereby changes in valuations were carried to
a special reserve in equity.
58
CONSOLIDATED FINANCIAL STATEMENTS FOR 2003|04T H E A G R A N A G R O U P

❚ Where was substantial evidence of impairment and if the estimated recoverable amount of
a financial investment was lower than its book value, an unscheduled write-down was captured
in profit for the period.
❚ Inventories were recognized at the lower of cost of purchase and/or conversion and net
selling prices. The average price method was used. In conformity with IAS 2, the conversion
costs of unfinished and finished products included reasonable proportions of the necessary
material costs and production overheads inclusive of depreciation of manufacturing plant
(assuming normal usage) as well as administrative costs in addition to directly attributable unit
costs. Financing costs were not taken into account. Insofar as inventories were at risk because
of longer periods of storage or reduced usability, valuation markdowns were carried out.
❚ Receivables recognized as current assets were capitalized at nominal values. Adequate
revaluation reserves were allocated to allow for the counterparty risks and other risks associated
with receivables. Receivables denominated in foreign currencies were translated applying the
middle rates of exchange ruling on the reporting date.
❚ Capitalization of available-for-sale securities took place at stock-market values as at the
end of the financial year in conformity with IAS 39.
❚ Provisions for the promised performance-based retirement benefit, severance/redundancy
payment and anniversary bonus obligations of Austrian Group-members were measured using
the internationally accepted projected unit credit method in accordance with IAS 19. Expert
actuarial opinions were obtained for that purpose. The measurement of such provisions was
based on trend extrapolations of the future development of remunerations and retirement bene-
fits and of fluctuations and on a discounting rate of 5.25 per cent (previous year: 5.75 per cent).
❚ A part of promised retirement benefits was transferred to a pension fund. Retirement
benefit contributions were calculated in such a way as to fully fund promised retirement bene-
fits by the time of retirement. Should a funding gap develop, there is an obligation to top up
the necessary amounts. The individual assets allocated to the pension fund are netted against
the provision for retirement benefits.
❚ Other provisions were allocated at the amounts permitted by IAS 37, capturing all identifi-
able risks and indefinite liabilities and the time of their probable occurrence.
❚ The risks arising from contingent liabilities were covered by adequate provisions.
CONSOLIDATED FINANCIAL STATEMENTS FOR 2003|04T H E A G R A N A G R O U P
59

❚ Tax deferrals were calculated on the basis of the differences between the IFRS-compliant
Balance Sheet and the tax base with respect to valuations of assets, equity and liabilities, on
the basis of processes taking place during consolidation and on the basis of realizable carry-
forwards of unused tax losses.
There were significant differences between the IFRS-compliant Balance Sheet and the tax base
with respect to the following items: tangible non-current assets, inventories and provisions.
Deferred tax assets were capitalized with respect to carryforwards of unused tax losses insofar
as they were usable within three years.
Tax deferrals were calculated using the internationally customary liability method (IAS 12),
taking into account the pertinent national rates of income taxation.
Consequently, with the exception of goodwill arising on consolidation, tax deferrals were recog-
nized for all temporary differences in recognition and measurement between the IFRS-compliant
Balance Sheet and the tax base.
Deferrals were calculated on the basis of the future tax rates expected at the time of the reso-
lution of such differences. Future changes in tax rates were taken into account if the change in
a tax rate had already been enacted in law at the time the Balance Sheet was drawn up.
Deferred tax assets were recognized as a separate item within current assets, whereas deferred
tax liabilities were reported as provisions for deferred taxes. Deferred tax assets were offset
against deferred tax liabilities in cases where income taxes were to be collected by the same
tax authority.
❚ All accounts payable were recognized at amounts payable. Accounts payable in foreign
currencies were recognized at the middle rates of exchange ruling on the reporting date.
❚ Revenues from deliveries were recognized if substantially all the risks and rewards incident
to the delivered item had passed to the purchaser. Operating expenses were recognized in the
Income Statement upon use of the product or service or at the time they were caused.
60
CONSOLIDATED FINANCIAL STATEMENTS FOR 2003|04T H E A G R A N A G R O U P

CONSOLIDATED FINANCIAL STATEMENTS FOR 2003|04T H E A G R A N A G R O U P
61
SEGMENT REPORT
NOTES TO THE
INCOME STATEMENT
Because of the homogeneity of the enterprise, segment reporting by business segment was
unnecessary. Segmentation along geographical lines showed the following pattern of develop-
ment:
2003/04 2002/03
Revenues Assets Investments Revenues Assets Investments
€000 €000 €000 €000 €000 €000
Austria 564,737 644,733 12,975 566,917 662,644 19,759
Hungary 128,682 110,752 5,686 159,347 117,948 6,979
CzechRepublic 43,990 43,894 2,603 60,950 42,795 1,052
Slovakia 27,102 33,076 2,054 28,491 31,405 1,715
Romania 63,215 54,720 2,478 60,030 42,294 4,519
Denmark 36,401 24,380 145
Poland 2,296 23,657 2,538
Total 866,423 935,212 28,479 875,735 897,086 34,024
Revenues and assets are stated at their consolidated amounts. Figures for investments encom-
pass additions to intangible non-current assets (without goodwill) and tangible non-current
assets.
The breakdown into regions is based on company domiciles.
(1) Sales revenues
By business segment2003/04 2002/03
Revenues Of which Of which Revenues Of which Of which
sugar and other sugar and other
starch starch
€000 €000 €000 €000 €000 €000
Revenues fromthe sale ofself-produceditems 751,639 693,673 57,966 754,414 728,662 25,752
Revenues fromthe sale ofgoods purchasedfor resale 110,432 6,804 103,628 115,111 13,601 101,510
Servicerevenues 4,352 0 4,352 6,210 0 6,210
Total 866,423 700,477 165,946 875,735 742,263 133,472
See the Segment Report (above) for a regional breakdown.

(2) Changes in inventories and
other capitalized self-produced items
2003/04 2002/03
€000 €000
Change in stocks of finished and unfinished products 1,814 (25,324)
Other capitalized self-produced items 1,483 1,432
(3) Other operating income
2003/04 2002/03
Income from €000 €000
Disposals/retirements of non–current assets
other than financial investments 783 1,833
Disposals of current assets 83 1,064
Release of provisions 4,019 2,247
Storage levy reimbursements 0 856
Group levies (non-consolidated companies) 788 572
Services rendered to third parties 971 1,103
Insurance benefits and payments for damages 160 887
Leases 1,112 1,211
Exchange differences 1,785 3,551
Release of valuation reserves for accounts receivable 740 430
Amounts invoiced on 2,814 2,624
Other items 3,967 5,432
Total 17,222 21,810
(4) Expenditure on materials and
other purchased inputs
2003/04 2002/03
Expenditure on €000 €000
Raw materials 328,286 330,886
Goods purchased for resale 120,986 104,202
Process materials and supplies 82,604 83,779
Purchased services 16,400 14,552
Total 548,276 533,419
62
CONSOLIDATED FINANCIAL STATEMENTS FOR 2003|04T H E A G R A N A G R O U P

(5) Expenditure on staff
2003/04 2002/03
€000 €000
Wages and salaries 75,148 75,136
Social security levies 20,185 21,059
Expenditure on retirement benefits and obligations 239 175
Expenditure on severance/redundancy payments
and obligations 839 1,023
Total 96,411 97,393
Allocations to the provisions for retirement benefits, severance/redundancy payments and
anniversary bonuses were recognized in Expenditure on staff but without their interest
component. Net interest expense arising from those items was recognized under Profit (loss)
from investing and financial activities at the amount of € 3,266 thousand (previous year:
€ 3,288 thousand).
Average number of staff employedduring the financial year
2003/04 2002/03
By employee category
Blue-collar (Arbeiter) 2,739 2,816
White-collar (Angestellte) 1,033 1,041
Apprentices 69 59
Total 3,841 3,916
By region
Austria 1,353 1,362
Romania 1,042 1,175
Slovakia 317 336
Czech Republic 387 382
Hungary 625 661
Denmark 40 0
Poland 77 0
Total 3,841 3,916
CONSOLIDATED FINANCIAL STATEMENTS FOR 2003|04T H E A G R A N A G R O U P
63

(6) Depreciation/amortization/write-downs
(7) Other operating expenses
2003/04 2002/03
€000 €000
Production contribution and additional levy 7,304 6,228
Operating and administrative expenses 46,128 49,579
Selling and freight costs 32,686 30,759
Advertising expenses 8,886 8,524
Other taxes 1,834 3,489
Losses arising from disposals/retirements
of non-current assets 361 322
Third-party operating expenses 13,988 7,654
Other 14,305 15,459
Total 125,492 122,014
(8) Net income from restructuring
This entry of € 382 thousand related to the disposal of non-current assets in the course of
structural streamlining in Romania.
64
CONSOLIDATED FINANCIAL STATEMENTS FOR 2003|04T H E A G R A N A G R O U P
2003/04 2002/03
Un- Un-
Total Scheduled scheduled Total Scheduled scheduled
€000 €000 €000 €000 €000 €000
Intangible non-current assets 317 317 0 488 488 0
Tangible non-current assets 39,613 38,179 1,434 39,863 39,819 44
Depreciation/amortization/write-downs recognized inProfit (loss) from operating activities 39,930 38,496 1,434 40,351 40,307 44Goodwill 37 37 0 4,950 1,621 3,329
Depreciation/amortization/write-downs recognized inProfit (loss) from ordinary activities 39,967 38,533 1,434 45,301 41,928 3,373Financial investments 50 0 50 502 0 502
Depreciation/amortization/write-downs affecting Profit (loss)from investing and financial activities 50 0 50 502 0 502Depreciation/amortization/write-downs as per theNon-Current Assets Statement 40,017 38,533 1,484 45,803 41,928 3,875
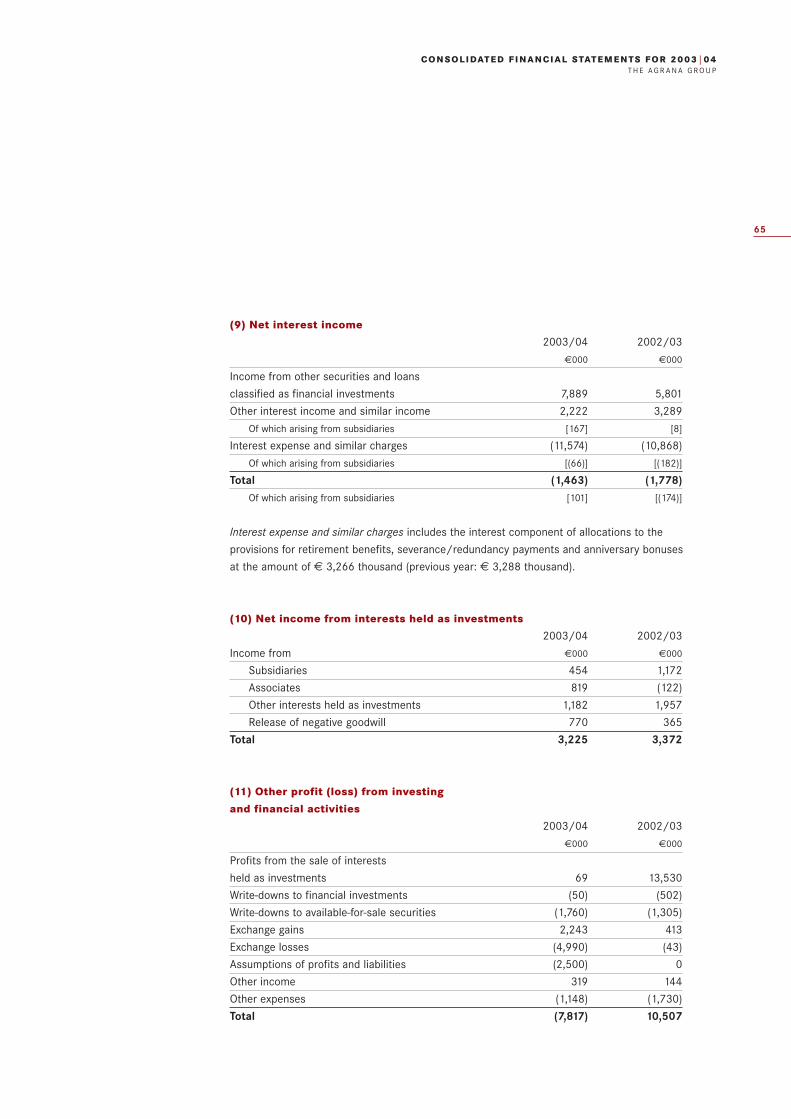
(9) Net interest income
2003/04 2002/03
€000 €000
Income from other securities and loans
classified as financial investments 7,889 5,801
Other interest income and similar income 2,222 3,289
Of which arising from subsidiaries [167] [8]
Interest expense and similar charges (11,574) (10,868)
Of which arising from subsidiaries [(66)] [(182)]
Total (1,463) (1,778)Of which arising from subsidiaries [101] [(174)]
Interest expense and similar charges includes the interest component of allocations to the
provisions for retirement benefits, severance/redundancy payments and anniversary bonuses
at the amount of € 3,266 thousand (previous year: € 3,288 thousand).
(10) Net income from interests held as investments
2003/04 2002/03
Income from €000 €000
Subsidiaries 454 1,172
Associates 819 (122)
Other interests held as investments 1,182 1,957
Release of negative goodwill 770 365
Total 3,225 3,372
(11) Other profit (loss) from investing
and financial activities
2003/04 2002/03
€000 €000
Profits from the sale of interests
held as investments 69 13,530
Write-downs to financial investments (50) (502)
Write-downs to available-for-sale securities (1,760) (1,305)
Exchange gains 2,243 413
Exchange losses (4,990) (43)
Assumptions of profits and liabilities (2,500) 0
Other income 319 144
Other expenses (1,148) (1,730)
Total (7,817) 10,507
CONSOLIDATED FINANCIAL STATEMENTS FOR 2003|04T H E A G R A N A G R O U P
65

(12) Income tax expense
Actual income tax expense and credits and tax deferrals pertained to Austrian and foreign
income taxes and broke down as follows:
2003/04 2002/03
€000 €000
Actual tax expense 13,804 28,230
Of which Austrian [8,862] [20,390]
Of which foreign [4,942] [7,840]
Deferred taxes (605) (8,296)
Of which Austrian [(241)] [(8,531)]
Of which foreign [(364)] [235]
Total 13,199 19,934Of which Austrian [8,621] [11,859]
Of which foreign [4,578] [8,075]
Deferred taxes of € 3,468 thousand (previous year: € 185 thousand) were carried to the
revaluation reserve (IAS 39) without being recognized in the Income Statement.
Transition from profit before income taxto income tax expense
2003/04 2002/03
€000 €000
Profit before income tax 70,741 87,245
Austrian tax rate 34% 34%
Theoretical tax expense 24,052 29,663
Change versus theoretical tax expense because of
Divergent applicable tax rate (4,207) (7,560)
Reduction in tax burden due to deduction
of tax-exempt income (5,084) (2,243)
Increase in tax burden due to
non-tax-deductible expenses and
additional tax debits 3,561 74
Non-temporary differences arising
from consolidation (6,666) 0
Changes in tax rates, out-of-period tax 1,543 0
Income tax expense 13,199 19,934Effective tax rate 19% 23%
66
CONSOLIDATED FINANCIAL STATEMENTS FOR 2003|04T H E A G R A N A G R O U P

The figure for theoretical tax expense results from applying Austria’s corporation tax rate of
34 per cent.
Because the announced tax reform in Austria had yet to be enacted by the Nationalrat (national
assembly), the prior tax rate was retained when calculating tax deferrals. The application of
the announced rate of 25 per cent tax that is to be levied on Austrian corporates would have
reduced deferred tax assets by € 445 thousand and reduced deferred tax liabilities by € 5,577
thousand.
Tax deferrals were based on differences between valuations in the Consolidated Financial
Statements and the individual tax bases for taxes imposed in individual countries and on carry-
forwards of unused tax losses.
In the interests of cautious planning, tax deferrals only took into account carryforwards of
unused tax losses to the extent that a taxable profit of a kind that could be expected to suffice
for the utilization of the pertinent deferred tax asset was foreseeable within the ensuing three
years.
(13) Earnings per share
2003/04 2002/03
Consolidated earnings for the year (€000) 56,539 65,382
Number of shares 11,027,040 11,027,040
Earnings per share
Diluted and undiluted (€) 5.13 5.93
Because of the harmonization of reporting dates, Consolidated earnings for the year includes
the results of the AGRANA International companies over a period of 14 months in 2002/03.
Earnings per share over 12 months in 2002/03 came to € 5.75 on the basis of consolidated
earnings for the year of € 63,374 thousand.
Assuming that the General Meeting of Shareholders approves the proposed appropriation of
profit for the 2003/04 financial year, AGRANA Beteiligungs-AG will be distributing € 19,849
thousand (previous year: € 19,849 thousand).
The Cash Flow Statement drawn up in accordance with the pertinent provisions of IAS 7
shows the change in the AGRANA Group’s holdings of cash and cash-equivalents arising from
day-to-day operating activities, investing activities and financing activities.
Cash and cash-equivalents comprised cash, bank balances and available-for-sale securities.
Short term accounts payable to banks were not included.
The effects of acquisitions were eliminated and recorded in the entry for Changes in the
scope of consolidation.
Non-cash movements in exchange rates were already eliminated within the scope of the perti-
nent items on the Balance Sheet.
CONSOLIDATED FINANCIAL STATEMENTS FOR 2003|04T H E A G R A N A G R O U P
67
NOTES TO THE
CASH FLOW
STATEMENT

(14) Net cash from operating activities
Net cash from profit came to € 100,889 thousand (previous year: € 105,015 thousand), which
was 11.6 per cent of revenues (previous year: 12.0 per cent of revenues). Distributions arising
from other interests held as investments came to € 1,182 thousand (previous year: € 1,850
thousand). After allowing for changes in working capital, net cash from operating activities
amounted to € 84,089 thousand (previous year: € 91,996 thousand).
Net cash from operating activities included the following interest and tax payments:
2003/04 2002/03
€000 €000
Interest received 11,075 9,090
Interest paid 7,983 7,741
Tax paid 23,826 19,568
(15) Net cash from investing activities
€ 68,743 thousand (previous year: € 22,689 thousand) was needed to finance our investing
activities.
Expenditure on capital investments in tangible and intangible non-current assets fell to
€ 28,479 thousand (previous year: € 34,024 thousand).
Proceeds from disposals/retirements of non-current assets came to € 12,136 thousand
(previous year: € 24,374 thousand).
Expenditure on financial investments rose to € 36,820 thousand (previous year: € 13,039
thousand). That total consisted above all of the prepayment for Atys S.A. and expenditure on
the acquisition of an interest in the Steirerobst Group.
€ 15,662 thousand of the movement in cash and cash equivalents arising from the change
in the scope of the Consolidated Group comprised the cost of acquiring Vallø Saft A/S and
€ 82 thousand thereof was made up of the increase in cash and cash equivalents caused by
that company’s first-time consolidation.
The change in non-current assets included the sum of € 22,897 thousand incoming from
other interests held as investments. That addition resulted from the assumption of an account
receivable from a company in which we held an interest for investment. As a non-cash inflow,
it was excluded from Net cash from investing activities.
(16) Net cash from financing activities
Financial obligations of € 53,841 thousand were redeemed during the 2003/04 financial year.
Distributions resulted predominantly from the cash dividends payable to the shareholders of
AGRANA Beteiligungs-AG.
68
CONSOLIDATED FINANCIAL STATEMENTS FOR 2003|04T H E A G R A N A G R O U P

(17) Non-current assets
❚ A breakdown of the non-current asset items subsumed under one heading on the Balance
Sheet and of their development is provided in the Non-Current Assets Statement.
❚ Consolidated holdings of intangible and tangible non-current assets came to € 28,479
thousand (previous year: € 34,024 thousand). Goodwill and undisclosed reserves arising from
the first-time consolidation of subsidiaries were recorded in the Non-Current Assets Statement
under Changes in the scope of consolidation.
❚ Intangible non-current assets includes in particular the goodwill arising from corporate
acquisitions during and after the 1995/96 financial year, capitalized in accordance with IFRS 3
(previously IAS 22), and also includes purchased computer software and industrial property
rights, similar rights and prepayments at the amount of € 371 thousand.
❚ Under IFRS 3, goodwill can no longer be amortized, so write-downs as contained in the
financial statements for the first three quarters of 2003/04 totalling € 1,262 thousand had to
be written back.
❚ The cash-generating units in the Czech Republic accounted for € 8,811 thousand of total
goodwill, and the cash-generating units in Slovakia accounted for € 8,575 thousand thereof.
❚ Exchange differences are shown at the amounts arising from the differences in the values
of the assets of foreign Group-members between their initial values measured applying the
exchange rates ruling at the start of the year and their closing values measured applying the
exchange rates ruling at year-end.
❚ Financial investments totalled € 80,997 thousand at the end of the year under review (pre-
vious year: € 27,992 thousand). The Non-Current Assets Statement shows capital investments
totalling € 61,303 (previous year: € 13,039 thousand). The difference of € 19,694 thousand
(previous year: € 14,953 thousand) was accounted for by fully consolidated subsidiaries.
❚ The balance-sheet entry for Interests in subsidiaries shows only the book values of the
companies excluded from consolidation because of their minor significance.
❚ Interests in associates increased by € 11,271 thousand (previous year: decrease of
€ 122 thousand). The allocation of profit recorded by companies accounted for using the
equity method came to € 819 thousand (previous year: deduction of € 122 thousand), and the
remainder of the increase, totalling € 10,452 thousand, resulted from interests acquired.
❚ Prepayments for financial investments recognized at € 27,000 thousand arose from the
acquisition of a 25 per cent stake in Atys S.A. The full approval of the competition regulators
was still pending at the time of reporting.
CONSOLIDATED FINANCIAL STATEMENTS FOR 2003|04T H E A G R A N A G R O U P
69
NOTES TO THE
BALANCE SHEET

(18) Inventories
29/28 February 2004 2003
€000 €000
Raw materials, process materials, supplies 36,975 26,992
Unfinished products 18,475 1,293
Finished products and goods 236,133 230,821
Prepayments 2 1
Total 291,585 259,107
(19) Accounts receivable and other assets
29/28 February 2004 2003
€000 €000
Accounts receivable for goods and services 84,412 64,702
Accounts receivable from subsidiaries 7,985 2,011
Of which with a maturity of more than 1 year [69] [118]
Accounts receivable from associates 1,725 2,655
Of which with a maturity of more than 1 year [0] [185]
Accounts receivable from other companies
in which the Group has interests held as investments 18 549
Tax credits 18,499 19,500
Other assets 13,525 42,069
Of which with a maturity of more than 1 year [1,039] [1,301]
Deferred items 956 757
Total 127,120 132,243Of which with a maturity of more than 1 year [1,108] [1,604]
Accounts receivable from subsidiaries derived exclusively from accounts with excluded
Group-members.
Other assets contains accounts receivable from public institutions and sundry receivables.
70
CONSOLIDATED FINANCIAL STATEMENTS FOR 2003|04T H E A G R A N A G R O U P

(20) Deferred tax assets
Tax deferrals were attributable to the following items on the Balance Sheet:
29/28 February 2004 2003
€000 €000
Deferred tax assets
Provisions for retirement benefits,
severance/redundancy payments
and anniversary bonuses 2,735 4,139
Inventories and accounts receivable 1,046 1,513
Other provisions and other liabilities 1,725 2,349
Carryforwards of unused tax losses 1,303 140
Total deferred tax assets 6,809 8,141
Reconciliation of deferred tax assets
and deferred tax liabilities with respect
to the same tax authority (2,748) (5,225)
Net deferred tax assets 4,061 2,916
Prior-year figures were adjusted to allow for a change in the breakdown of provisions.
The calculation of deferred tax liabilities gave net deferred tax liabilities of € 25,651 thousand
(previous year: € 21,528 thousand). This item is elucidated under point 23 (b).
(21) Securities
Shares and other securities were recognized at the amount of € 46,835 thousand (previous
year: € 103,675 thousand). This item consists mainly of fixed-interest securities held as part
of our liquidity reserves.
(22) Equity
❚ Subscribed capital came to € 80,136.625 thousand on the reporting date. It was sub-
divided into 11,027,040 no-par shares.
❚ The development of the Group’s equity is detailed in a separate Equity Statement.
CONSOLIDATED FINANCIAL STATEMENTS FOR 2003|04T H E A G R A N A G R O U P
71

(23) Provisions
29/28 February 2004 2003
€000 €000
Provisions for
Retirement benefits 33,740 35,393
Severance/redundancy payments 16,948 17,288
Anniversary bonuses 4,886 4,734
Deferred taxes 25,651 21,528
Other taxes 20,750 31,607
Other 62,721 53,217
Total 164,696 163,767
a) Provisions for retirement benefits, severance/redundancy payments and anniversary bonusesProvisions for retirement benefits and for severance/redundancy payments were measured
using the projected unit credit method taking into account future developments on an actuarial
basis. In both cases, defined benefit plans are in place.
The following assumptions were made regarding probable future increases in wages, salaries
and retirement benefits within the scope of the Austrian Group-members:
29/28 February 2004 2003
Per cent Per cent
Wage/salary trend 2.50 2.50
Interest rate 5.25 5.75
Abroad, we modified our assumptions to suit prevailing circumstances.
Provisions developed as follows:
Severance/
Retirement redundancy Anniversary
benefits payments bonuses
€000 €000 €000
2003/04 financial yearBalance-sheet provisionon 1 March 2003 35,393 17,288 4,734
Service cost 152 790 208
Interest cost 2,077 929 260
Expected income from plan assets (40) 0 0
Actuarial (gain) loss 0 (5) 192
Total recognized in profit
for the period 2,189 1,714 660
72
CONSOLIDATED FINANCIAL STATEMENTS FOR 2003|04T H E A G R A N A G R O U P

Severance/
Retirement redundancy Anniversary
benefits payments bonuses
€000 €000 €000
Benefits payments (3,614) (2,054) (508)
Allocated to plan assets (228) 0 0
Balance-sheet provisionon 29 February 2004 33,740 16,948 4,886Disregarded actuarial (gain) loss 2,883 (1,943) 0
Fair value of plan assets 1,578 0 0
Present valueon 29 February 2004 38,201 15,005 4,886
Previous yearBalance-sheet provisionon 1 March 2002 38,013 17,365 4,449
Service cost 129 776 208
Interest cost 2,079 945 264
Actuarial (gain) loss 0 (15) 321
Total recognized in profit
for the period 2,208 1,706 793
Benefits payments (3,534) (1,783) (508)
Allocated to plan assets (1,294) 0 0
Balance-sheet provisionon 28 February 2003 35,393 17,288 4,734Disregarded actuarial (gain) loss 1,070 (1,662) 0
Fair value of plan assets 1,294 0 0
Present valueon 28 February 2003 37,757 15,626 4,734
There were no expenses on or income from changes in benefit promises and benefit payments
or as a result of changes in our assumptions.
The projected unit credit value shows staff members’ benefit rights measured as the circum-
stances were on the reporting date. It includes actuarial gains and losses resulting from differ-
ences between expected and individually occurring risks. The provision for direct benefit
obligations did not take into account actuarial gains and losses within the corridor allowed by
IAS 19 (± 10 per cent of projected unit credit value).
The foreign Group-members had similar obligations. They were measured on an actuarial basis
and taking future cost trends into account.
CONSOLIDATED FINANCIAL STATEMENTS FOR 2003|04T H E A G R A N A G R O U P
73

b) Provisions for deferred taxesTax deferrals were attributable to the following items on the Balance Sheet:
29/28 February 2004 2003
€000 €000
Deferred tax liabilities
Non-current assets 1,406 1,731
Inventories and accounts receivable 15,420 11,542
Extraordinary fiscal items
in individual financial statements 9,205 10,425
Other provisions 2,368 3,055
Total deferred tax liabilities 28,399 26,753Reconciliation of deferred tax assets and deferred tax
liabilities with respect to the same tax authority (2,748) (5,225)
Net deferred tax liabilities 25,651 21,528
The calculation of deferred tax assets gave net deferred tax assets of € 4,061 thousand
(previous year: € 2,916 thousand) as elucidated under point 20.
c) Provisions for other taxes and other provisions
74
CONSOLIDATED FINANCIAL STATEMENTS FOR 2003|04T H E A G R A N A G R O U P
Effect of Effect ofchanges in change in
foreign scope of1 March exchange consoli- Released Used Added 29 February
2003 rates dation 2004€000 €000 €000 €000 €000 €000 €000
Provisions for taxes 31,607 (13) 469 2,242 17,355 8,284 20,750Other provisions
Provisions for obligationsarising from the EU sugar CMO 14,478 0 0 307 13,830 15,818 16,159Provisions for the costs ofmeeting recultivation obliga-tions, clearing landfills andremoving waste residues 17,887 (45) 0 2,641 837 7,578 21,942Provision for expenditureon staff 7,699 (26) 345 113 6,083 6,718 8,540Sundry provisions 13,153 (77) 262 957 8,636 12,335 16,080
Total 53,217 (148) 607 4,018 29,386 42,449 62,721Provisions for taxes andother provisions 84,824 (161) 1,076 6,260 46,741 50,733 83,471
Of which long-term provisions 15,598 21,434
Of which short-term provisions 69,226 62,037

29 February Of which with a maturity of 28 February Of which with a maturity of
2004 Up to > 1 to 2003 Up to > 1 to
1 year 5 years > 5 years 1 year 5 years > 5 years
€000 €000 €000 €000 €000 €000 €000 €000
Bonds 672 672 0 0 0 0 0 0
Accounts payable to banks 119,836 111,194 8,049 593 140,369 89,229 50,058 1,082
Financial obligations 120,508 111,866 8,049 593 140,369 89,229 50,058 1,082
Prepayments for orders 29 29 0 0 142 142 0 0
Accounts payable
for goods and services 99,551 99,452 64 35 91,790 91,498 203 89
Accounts payable
to subsidiaries 9,596 9,596 0 0 3,330 3,330 0 0
Prepaid income 4,392 4,392 0 0 5,123 5,123 0 0
Other accounts payable 20,618 17,094 2,460 1,064 17,560 13,196 2,972 1,392
Of which tax [1,710] [1,510] [200] [0] [2,370] [2,119] [204] [47]
Of which relating
to social security [1,715] [1,715] [0] [0] [1,117] [1,117] [0] [0]
Other accounts payable 134,186 130,563 2,524 1,099 117,945 113,289 3,175 1,481
Total 254,694 242,429 10,573 1,692 258,314 202,518 53,233 2,563
(24) Accounts payable
More detailed information about accounts payable to banks is provided in the section on
financial instruments and derivative financial instruments.
On the reporting date, the following collateral was in place to secure accounts payable to
banks:
29/28 February 2004 2003
€000 €000
Real-estate liens 0 9,758
Other liens 0 7,344
Total 0 17,102
Other accounts payable consists mainly of tax liabilities, payables to benefit schemes and
payables on payroll accounts.
CONSOLIDATED FINANCIAL STATEMENTS FOR 2003|04T H E A G R A N A G R O U P
75

(25) Contingent liabilities and other financial obligations
29/28 February 2004 2003
€000 €000
Bills 104 83
Sureties 1,213 1,214
Guarantees, cooperative liabilities 1,899 1,551
Letters of comfort 316 1,313
Contingent liabilities 3,532 4,161Present value of finance lease instalments
due within 4 years 128 50
Orders for capital investments
in tangible non-current assets 4,901 3,117
Other financial obligations 5,029 3,167Total 8,561 7,328
To steer seasonally fluctuating cash flows, conventional investments are undertaken (call-money,
time-deposit and securities investments), funds are borrowed by way of call-money and fixed
borrowings and fixed-rate loan transactions are effected within the AGRANA Group in the course
of day-to-day financial management activities.
Financial instruments are typically subject to interest-rate, currency and credit risks.
Interest-rate risk
In the case of a financial instrument for which a fixed interest rate has been agreed for its
entire term, the risk is that its price may change as the market interest rate fluctuates (interest-
rate related price risk). The interest rate on a variable-rate financial instrument is adjusted on
an almost concurrent basis and to that extent corresponds roughly to the market rate.
Currency risk
Currency risk is defined as the risk that the value of an item on the Balance Sheet will fluctuate
due to changes in foreign exchange rates.
Credit risk
We minimize the credit risks associated with non-current assets and securities and with
receivables arising from derivative hedges by only transacting business with counterparties of
the highest credit standing.
76
CONSOLIDATED FINANCIAL STATEMENTS FOR 2003|04T H E A G R A N A G R O U P
NOTES ON FINANCIAL
INSTRUMENTS AND
DERIVATIVE FINANCIAL
INSTRUMENTS

The most important primary investment and borrowing instruments held on 29 February 2004
broke down as follows, by balance-sheet item:
Book value as per
Non-current assets: Contracted the domestic
securities currency Market value balance sheet
€000 €000
Stocks, Ges.m.b.H. (Ltd. Co.) shares, € 8,558 6,768
shares in cooperatives Kc 183 183
Debt instruments issued by corporates € 13,149 12,541
Total 21,890 19,492
Book value as per
Current assets: Contracted the domestic
securities currency Market value balance sheet
€000 €000
Stocks, Ges.m.b.H. (Ltd. Co.) shares, € 1,384 1,384
shares in cooperatives Ft 29 29
Debt instruments issued € 34,561 34,526
by foreign sovereigns € 98 98
Debt instruments issued by corporates € 10,763 10,582
Total 46,835 46,619
Book value as per
the domestic
Current assets: National balance sheet
cash and cash equivalents currency (= market value)
€000
Time deposits and € 45,756
other banks balances Ft 2,215
Sk 339
Kc 825
ROL 862
DKr 6
Zl 90
Total 50,093
Unrealized differences between cost and the market values recognized on the Balance Sheet
were carried to the revaluation reserve and were not recognized in the Income Statement.
CONSOLIDATED FINANCIAL STATEMENTS FOR 2003|04T H E A G R A N A G R O U P
77
ˇ
ˇ

78
CONSOLIDATED FINANCIAL STATEMENTS FOR 2003|04T H E A G R A N A G R O U P
Financial obligations Contracted Interest rate Book value
currency (nominal)
Per cent €000
Maturity of up to 1 year € 3.18 69,045
Ft 12.64 19,180
Kc 2.70 4,623
Sk 6.00 17,395
ROL 23.40 1,171
DKr 2.65 452
Maturity of more than 1 to 5 years € 4.60 4,248
DKr 7.67 3,801
Maturity of more than 5 years € 2.62 593
Total 120,508
Accounts payable were recognized at amounts payable. In the case of payables denominated
in foreign currencies, nominal values were translated into euros applying the foreign exchange
rates ruling on the reporting date. Consequently, market values could be higher or lower,
depending on the development of exchange rates.
Derivative financial instruments and risk management
In order to hedge part of the risks arising from its operating activities (due to movements in
interest rates, foreign exchange rates and raw material prices), the AGRANA Group makes
limited use of derivative financial instruments. It only employs instruments that are commonly
used and have sufficient liquidity in the marketplace (e.g. interest-rate swaps, interest-rate
options, caps, forward exchange contracts, currency options). The use of those instruments
is regulated by Group guidelines within the scope of the Group’s risk management system.
Those guidelines rule out the speculative use of derivative financial instruments, set ceilings
that are appropriate to the underlying transactions, define authorization procedures, minimize
credit risks, and regulate internal reporting and functional firewalls. Compliance with those
guidelines and the proper management and valuation of transactions are regularly monitored
by an impartial internal unit.
The nominal and market values of the derivative financial instruments held by the AGRANA
Group and the associated credit risks broke down as follows:
Nominal values Market values
29/28 February 2004 2003 2004 2003
€000 €000 €000 €000
Forward exchange contracts 24,246 0 (351) 0
Currency options 0 4,112 0 (5)
Raw material futures 1,483 2,893 41 (179)
Total 25,729 7,005 (310) (184)
ˇ

Nominal values
The nominal value of a derivative financial instrument is the reference value underlying the
hedge. Price movements versus that reference value, not absolute nominal values, are the
object of hedging and the source of risk.
Market values
Market values were measured to quoted market prices on the reporting date without offsetting
any countermovements in the values of hedged items.
The market value is the amount that the AGRANA Group would have had to pay or would have
received in the event of premature termination of a hedge.
Z & S Zucker und Stärke Holding AG holds roughly 86 per cent of AGRANA’s ordinary share
capital. Z & S Zucker und Stärke Holding AG is not required to draw up consolidated financial
statements because it is accounted for in the consolidated financial statements of Südzucker AG,
Mannheim/Ochsenfurt.
Possible related parties within the meaning of IAS 24 are Südzucker AG, Mannheim/Ochsen-
furt, Germany, and Zuckerbeteiligungsges.m.b.H, Vienna, as shareholders of Z & S Zucker und
Stärke Holding AG. AGRANA’s Consolidated Financial Statements are accounted for in the con-
solidated financial statements of Südzucker AG, Mannheim/Ochsenfurt. There were no material
business dealings with related parties during the year under review.
Remunerations paid by the company to members of the Board of Management of AGRANA
Beteiligungs-AG totalled € 790 thousand (previous year: € 738 thousand). Remunerations
paid to members of the Supervisory Board totalled € 165 thousand (previous year: € 111 thou-
sand). Retirement benefit obligations vis-à-vis the Board of Management were transferred to
an external pension fund. The excess over the accumulated savings component of € 1,279
thousand (previous year: € 1,246 thousand) was recorded under Provisions.
Vienna
29 April 2004
The Board of Management
Johann Marihart (by his own hand)
Walter Grausam (by his own hand)
Markwart Kunz (by his own hand)
CONSOLIDATED FINANCIAL STATEMENTS FOR 2003|04T H E A G R A N A G R O U P
79
INFORMATION
REGARDING BUSINESS
RELATIONSHIPS
WITH COMPANIES
AND INDIVIDUALS
CONSIDERED TO BE
RELATED PARTIES

Stake in share capital
Name of company Location Country Direct Indirect1
Per cent Per cent
Interests in fully-consolidated Group-members
AGRANA Frucht Gesellschaft m.b.H. Vienna 100.00 —
AGRANA Frucht Gesellschaft m.b.H. & Co KG Vienna 100.00 —
AGRANA Internationale Verwaltungs-
und Asset-Management AG Vienna 100.00 —
AGRANA Internationale Verwaltungs-
und Asset-Management AG & Co KG Vienna 100.00 —
AGRANA Marketing- und Vertriebsservice
Gesellschaft m.b.H. Vienna 100.00 —
AGRANA Zucker und Stärke Aktiengesellschaft Vienna 98.91 1.09
Agrofrucht, Handel mit landwirtschaftlichen
Produkten Gesellschaft m.b.H. Vienna — 100.00
Brüder Hernfeld Gesellschaft m.b.H. Vienna — 100.00
INSTANTINA Nahrungsmittel Entwicklungs-
und Produktions Gesellschaft m.b.H. Vienna 66.67 —
RUMA Handelsges.m.b.H. Hagenbrunn — 100.00
AGRANA Magyarorzág Értékesitési Kft. Budapest Hungary — 87.36
Elsö Hazai Cukorgyártó és Forgalmazó Kft. Budapest Hungary — 99.19
INSTANTINA Hungária Élelmiszergyartó
és Kereskedelmi Kft. Petöhaza Hungary — 66.67
Magyar Cukorgyártó és Forgalmazó Rt. Budapest Hungary — 87.32
Moravskoslezské Cukrovary a.s. Hrusovany Czech Republic — 97.54
Slovenské Cukrovary a.s. Rimavská Sobota Slovakia — 100.00
S.C. A.G.F.D. Tandarei s.r.l. Tandarei Romania — 99.97
S.C. Zaharul Romanesc S.A. Buzau Romania — 86.51
S.C. Danubiana Roman S.A. Roman Romania — 96.15
S.C. Romana Prod s.r.l. Roman Romania — 96.16
S.C. AGRANA Romania Holding
and Trading Company s.r.l. Bucharest Romania — 100.00
Vallø Saft A/S Køge Denmark — 100.00
Vallø Saft Polska SP z.o.o. Lipnik Poland — 100.00
1 Figures for indirect stakes represent the computed total stakes of AGRANA Beteiligungs-AG in the Group-members concerned.
80
CONSOLIDATED FINANCIAL STATEMENTS FOR 2003|04T H E A G R A N A G R O U P
GROUP INTERESTS ON 29 FEBRUARY 2004(interests held of at least 20 per cent of share capital)

CONSOLIDATED FINANCIAL STATEMENTS FOR 2003|04T H E A G R A N A G R O U P
81
Stake in share capital
Name of company Location Country Direct Indirect1
Per cent Per cent
Companies accounted
for using the equity method
Österreichische Rübensamenzucht
Gesellschaft m.b.H. Vienna — 86.00
Steirerobst AG Gleisdorf — 34.42
Steirische Agrarbeteiligungsgesellschaft m.b.H. Raaba — 25.10
Hungariaobst Kft. Hadhazi Hungary — 34.42
Podilljaobst TOF Winniza Ukraine — 34.27
Luka TOF Winniza Ukraine — 34.36
Polobst SP z.o.o. Gora Kalvaria Poland — 34.42
Steirerobst o.o.o. Moscow Russia — 34.42
Excluded Group-members
Leipnik-Lundenburger Unterstützungs-
einrichtung Gesellschaft m.b.H. Vienna — 100.00
Sugana Altersvorsorge-Einrichtung
Gesellschaft m.b.H. Vienna — 100.00
Zuckerforschung Tulln Ges.m.b.H. Vienna 100.00 —
Dr. Hauser Gesellschaft m.b.H. Garmisch-Partenkirchen Germany — 51.00
Hottlet Sugar Trading N.V. Berchem Belgium 25.10 —
Schoko-Schwind Kft. Kecskemet Hungary — 100.00
AGRANA Skrob s.r.o. Hrusovany Czech Republic — 100.00
AGRANA Zucker und Stärke AG & Co KG Hörbranz — 100.00
Companies for which we waived use
of the equity method
Fruktex Kft. Gutorfölde Hungary — 34.42
S.C. Caracrimex S.A. Carei Romania — 34.17
PFD-Processed Fruit Distribution Ltd. Nicosia Cyprus — 34.42
S.C. Caraobst s.r.l. Carei Romania — 34.42
Companies accounted for
by proportionate consolidation
HUNGRANA Keményitö- és
Isocukorgyártó és Forgalmazó Kft. Szabadegyhaza Hungary — 50.00
Hungranatrans Kft. Szabadegyhaza Hungary — 50.00

82
CONSOLIDATED FINANCIAL STATEMENTS FOR 2003|04T H E A G R A N A G R O U P
THE COMPANY’S BOARDS AND OFFICERS
Supervisory Board
Christian KONRAD, Vienna
Chairman
Rudolf MÜLLER, Ochsenfurt
Vice-Chairman
Erwin HAMESEDER, Mühldorf
Vice-Chairman
(from 10 July 2003)
Ferdinand GASSAUER-FLEISSNER, Vienna
Vice-Chairman
(to 9 July 2003)
Hans-Jörg GEBHARD, Eppingen
Christoph KIRSCH, Weinheim/Bergstrasse
Hermann SCHULTES, Zwerndorf
Richard SCHWAIGER, Aiterhofen
Christian TEUFL, Vienna
(from 10 July 2003)
Staff Council delegates:
Ernst HERZIG, Breitenfurt
Harald TOTH, Leopoldsdorf
Peter VYMYSLICKY, Leopoldsdorf
Erich WEISSENBÖCK, Gmünd
Board of Management
Johann MARIHART, Limberg
Chairman
Walter GRAUSAM, Vienna
Klaus KORN, Ochsenfurt
(to 30 September 2003)
Markwart KUNZ, Worms
(from 1 October 2003)

CONSOLIDATED FINANCIAL STATEMENTS FOR 2003|04T H E A G R A N A G R O U P
83
We audited the attached Consolidated Financial Statements of AGRANA Beteiligungs-Aktien-
gesellschaft, Vienna, as of and for the period ended 29 February 2004, which were drawn up
in conformity with the International Financial Reporting Standards (IFRS) as published by the
International Accounting Standards Board (IASB). Those Consolidated Financial Statements
were the responsibility of the enterprise’s management. Our responsibility was to give an
auditors’ opinion on those Consolidated Financial Statements on the basis of our audit.
We performed our audit observing the principles governing the proper execution of audits as
valid in Austria and the International Standards on Auditing (ISA). Those standards require an
audit to be planned and executed in such a way that a sufficiently sound judgement can be
reached as to whether financial statements are free from material misstatements. The audit
included a random-sample supported examination of the evidence substantiating the amounts
and other disclosures furnished in the financial statements. It also included an evaluation of
the accounting principles applied and material estimates undertaken by the enterprise’s
management and an appraisal of the overall testimony provided by the financial statements.
We believe that our audit constituted a sufficiently reliable basis for our audit opinion.
It is our conclusion that the Consolidated Financial Statements do in all material respects
provide as true and fair a view as possible of the assets and financial condition of AGRANA
Beteiligungs-Aktiengesellschaft, Vienna, on 29 February 2004, and of its profit position and
cash flows during the financial year ended, in compliance with IFRS.
Vienna
30 April 2004
MULTICONT Revisions- und
KPMG Alpen-Treuhand GmbH Treuhand Gesellschaft m.b.H.
Wirtschaftsprüfungs- und Wirtschaftsprüfungs- und
Steuerberatungsgesellschaft Steuerberatungsgesellschaft
Walter Knirsch Wilhelm Kovsca Hans Chaloupka Robert Breitner
Certified Accountants and Tax Consultants Certified Accountant Tax Consultant
and Tax Consultant
AUDITORS’ REPORT AND CERTIFICATE[TRANSLATION]

84
CONSOLIDATED FINANCIAL STATEMENTS FOR 2003|04T H E A G R A N A G R O U P
Abbreviation Indicator 2003/04 Previous yearDefinition €000 €000
BFS Gross financial dept 121,880 141,199Accounts payable to banks plus payables arising from billsplus financial obligations of non-consolidated Group-members
CE Capital employed 521,499 494,352SAV + IAV + WC
Distribution yield Distribution per share divided by the share’s closing price 2.9% 4.6%
EBIT 1 Earnings before interest and tax (Item 9 of Income Statement) 76,833 80,476Profit from operating activities
EBIT margin 1 EBIT 1 times 100 divided by revenues 8.9% 9.2%
EBIT 2 Earnings before interest and tax (Item 12 of Income Statement) 76,796 75,144Profit from ordinary activities after amortization of goodwill
EBIT margin 2 EBIT 2 times 100 divided by revenues 8.9% 8.6%
EBITDA Earnings before interest, tax, depreciationand amortization (Items 7 + 10 + 12 of Income Statement) 116,763 120,445EBIT plus depreciation/amortization plus amortization of goodwill
EBITDA margin EBITDA times 100 divided by revenues 13.5% 13.7%
EKQ Equity ratio 54.2% 51.9%Equity divided by total capital
EPS Earnings per share € 5.13 € 5.93Consolidated earnings for the year divided by the number of shares
EVS Equity value per share € 45.93 € 42.24Equity divided by the number of shares
FCF Free cash flow 15,346 69,307Net cash from operating activities plusnet cash from investing activities1
Gearing NFS divided by (equity plus minority interests in equity) times 100 4.8% (3.2%)
IAV Intangible non-current assets with goodwill 29,379 22,238
KGV (Ultimo) P/E ratio 12.00 6.70Closing price divided by EPS
NFS Net financial dept 24,952 (15,328)Gross financial dept less (cash plus cheques plus other bank balances)
ROCE Return on capital employed 14.7% 15.3%(Profit from operating activities less amortization of goodwill)divided by capital employed
ROS Return on sales 8.2% 10.0%Profit before tax times 100 divided by revenues
SAV Tangible non-current assets 266,229 265,840
WC Working capital 225,891 206,274Short-term current assets minus short-term debts
1 Net cash from operating activities less capital investments (in quarterly reports)
PERFORMANCE INDICATORS[For the reader’s convenience, the original abbreviations have been retained.]

85ANNUAL FINANCIAL STATEMENTSFOR 2003|04of AGRANA Beteiligungs-AG applying RLG
86 Balance Sheet
87 Income Statement
88 Auditors’ Certificate
89 Proposal regarding profit appropriation

86
FINANCIAL STATEMENTS FOR 2003|04A G R A N A B E T E I L I G U N G S - A G
29 February End of2004 previous year€000 €000
A. Non-current assetsI. Intangible non-current assets 70 12II. Tangible non-current assets 736 930III. Financial investments 275,154 262,184
275,960 263,126B. Current assets
I. Accounts receivable and other assets 48,184 99,341II. Securities 20,582 20,582III. Cash, bank balances 20,164 47
88,930 119,970Total assets 364,890 383,096
A. EquityI. Share capital 80,137 80,137II. Capital reserves 213,463 213,463III. Retained earnings reserves 19,377 18,136IV. Net profit 19,853 19,867
Of which profit carryforward: € 18 thousand
(previous year: € 12 thousand)
332,830 331,603B. Untaxed reserves 7 13
C. ProvisionsI. Provision for retirement benefits,
severance/redundancy paymentsand anniversary bonuses 1,204 1,319
II. Provision for taxes and other provisions 6,984 8,2078,188 9,526
D. Accounts payableI. Financial obligations 21,802 39,970II. Other accounts payable 2,063 1,984
23,865 41,954Total equity and liabilities 364,890 383,096
Contingent liabilities 1,034 3,982
BALANCE SHEET DATED 29 FEBRUARY 2004
A S S E T S
E Q U I T Y A N DL I A B I L I T I E S

FINANCIAL STATEMENTS FOR 2003|04A G R A N A B E T E I L I G U N G S - A G
87INCOME STATEMENTFOR THE 2003/04 FINANCIAL YEARfrom 1 March 2003 through 29 February 2004
2003/04 Previous year€000 €000
1. Sales revenues 287 2842. Other operating income 12,802 13,0863. Expenditure on staff (7,386) (7,421)4. Depreciation/amortization/write-downs
of intangible and tangible non-current assets (389) (333)5. Other operating expenses (6,103) (8,109)6. Profit (loss) from operating activities (789) (2,493)
(subtotal of items 1 – 5)
7. Income from interests held as investments 20,517 21,133Of which from subsidiaries: € 20,517 thousand
(previous year: € 21,029 thousand)
8. Income from other securities classifiedas financial investments 177 402
9. Other interest income and similar income 3,935 2,698Of which from subsidiaries: € 425 thousand
(previous year: € 1,341 thousand)
10. Income from the disposal of financial investments 194 12,38611. Expenditure on financial investments
and available-for-sale securities (1,200) (238)12. Interest expense and similar charges (1,750) (1,742)13. Profit (loss) from investing 21,873 34,639
and financial activities(subtotal of items 7 – 12)
14. Profit/(loss) from ordinary activities 21,084 32,146(subtotal of items 1 – 12)
15. Income tax expense (14) (6,098)16. Earnings for the year 21,070 26,048
17. Released from untaxed reserves 7 718. Allocated to retained earnings reserves (1,242) (6,200)19. Profit carryforward from previous year 18 1220. Net profit 19,853 19,867

AUDITORS’ CERTIFICATE [TRANSLATION]88
FINANCIAL STATEMENTS FOR 2003|04A G R A N A B E T E I L I G U N G S - A G
We audited the Annual Financial Statements for the year ended 29 February 2004 as drawn
up by the Board of Management of AGRANA Beteiligungs-AG in accordance with the provisions
of commercial law applying in Austria, thereby observing the principles of our profession in
Austria regarding the proper execution of audits. Having completed our audit, we granted
the full German Annual Financial Statements of AGRANA Beteiligungs-AG, Vienna, for the year
ended 29 February 2004 the following unqualified Auditors’ Certificate in accordance with
§ 274 Abs 1 HGB (commercial code):
“According to our mandatory examination thereof, the accounting records and the Annual
Financial Statements comply with the statutory requirements. The Annual Financial Statements
conform to the principles of proper accounting and provide as true and fair a view as possible
of the company’s assets, financial condition and profit position. Management’s Report is in
conformity with the Annual Financial Statements.”
Vienna
30 April 2004
MULTICONT Revisions- und
KPMG Alpen-Treuhand GmbH Treuhand Gesellschaft m.b.H.
Wirtschaftsprüfungs- und Wirtschaftsprüfungs- und
Steuerberatungsgesellschaft Steuerberatungsgesellschaft
Walter Knirsch Wilhelm Kovsca Hans Chaloupka Robert Breitner
Certified Accountants and Tax Consultants Certified Accountant Tax Consultant
and Tax Consultant

2003/04
€000
The financial year from 1 March 2003 through
29 February 2004 closed with net profit of 19,852.622
The Board of Management recommends to the
General Meeting of Shareholders that this net profit
be appropriated as follows:
The distribution of a dividend of € 1.80 per ordinary share
(no-par share) on 11,027,040 dividend-bearing ordinary shares,
that is a Total distribution of 19,848.672
To be carried forward to a new account 3.950
19,852.622
FINANCIAL STATEMENTS FOR 2003|04A G R A N A B E T E I L I G U N G S - A G
89PROPOSAL REGARDING PROFITAPPROPRIATION

During the 2003/04 financial year, the Supervisory Board kept abreast of the company’s
business and financial position, the course and development of business, the company’s
financial condition and investment plans and unusual transactions as well as corporate policy
in numerous discussions and meetings and with the help of regular reports from the Board of
Management and extensive written material, and it discussed those matters with the Board
of Management. Those in-depth discussions dealt in particular with corporate strategies, future
opportunities for growth and the company’s acquisitions and the financing thereof.
The Annual Financial Statements and Consolidated Financial Statements presented by the
Board of Management and the Board of Management’s Report on the 2003/04 financial year
as well as the accounting records were examined by the auditors appointed by the General
Meeting of Shareholders, namely KPMG Alpen-Treuhand Ges.m.b.H., Wirtschaftsprüfungs- und
Steuerberatungsgesellschaft, Vienna, and MULTICONT Revisions- und Treuhand Ges.m.b.H.,
Wirtschaftsprüfungs- und Steuerberatungsgesellschaft, Vienna, and were granted an unquali-
fied Auditors’ Certificate. The Supervisory Board has taken note of and endorses the results
of that audit.
The Supervisory Board committee set up to examine the Annual Financial Statements and
make preparations for their final approval examined the Annual Financial Statements and
reported to the Supervisory Report in the presence of the Auditors. The Supervisory Board
examined the Annual Financial Statements, the Board of Management’s proposal regarding
profit appropriation and the Board of Management’s Report on the 2003/04 financial year.
None of the final results of those examinations gave any cause for objections.
SUPERVISORY BOARD’S REPORT90
SUPERVISORY BOARD’S REPORTT H E A G R A N A G R O U P

The Supervisory Board has approved the Annual Financial Statements prepared by the Board
of Management for the 2003/04 financial year, which are thus final for the purposes of
§ 125 Abs 2 AktG (corporation act). The Supervisory Board takes note of and approves the
Board of Management’s Report on the 2003/04 financial year and endorses the proposal
regarding profit appropriation.
The Supervisory Board would like to express its appreciation and thanks to the Board of
Management and to all the staff of the company and the AGRANA Group for their work.
In particular, it thanks Supervisory Board member Klaus Korn, who left the Board of Manage-
ment in September 2003. Markwart Kunz has succeeded him.
Vienna
May 2004
The Chairman of the Supervisory Board
Christian Konrad
SUPERVISORY BOARD’S REPORTT H E A G R A N A G R O U P
91

IMPORTANT ADDRESSES92
IMPORTANT ADDRESSEST H E A G R A N A G R O U P
AGRANA BETEILIGUNGS-
AKTIENGESELLSCHAFT
Donau-City-Strasse 9, A-1220 Vienna
Phone: +43-1-211 37-0; Fax: -2998
e-mail: [email protected]
www.agrana.com
Group Communications/Investor Relations:
Brigitte Gampe
Phone: +43-1-211 37-2930; Fax: -2045
e-mail: [email protected]
SUBSIDIARIES
AGRANA Zucker und Stärke
Aktiengesellschaft
Headquarters:
Donau-City-Strasse 9, A-1220 Vienna
Phone: +43-1-211 37-0; Fax: -2998
e-mail: [email protected]
SUGAR DivisionAdministration:
Reitherstrasse 21–23, A-3430 Tulln
Phone: +43-2272-602-0; Fax: -225
e-mail: [email protected]
Factories:
Bahnstrasse 25, A-2273 Hohenau
Phone: +43-2535-2311-0; Fax: -201
Bahnstrasse 104, A-2285 Leopoldsdorf
Phone: +43-2216-2341-0; Fax: -299
Reitherstrasse 21–23, A-3430 Tulln
Phone: +43-2272-602-0; Fax: -225
STARCH DivisionAdministration:
Conrathstrasse 7, A-3950 Gmünd
Phone: +43-2852-503-0; Fax: -420
e-mail: [email protected]
Factories:
Conrathstrasse 7, A-3950 Gmünd
Phone: +43-2852-503-0; Fax: -420
Raiffeisenweg 2–6, A-4082 Aschach
Phone: +43-7273-6441-0; Fax: -43
AGRANA Zucker und Stärke AG & Co KG
Seestrasse 10, A-6912 Hörbranz
Phone: +43-5573-858 28-0; Fax: -15
AGRANA Marketing- und Vertriebs-
service Gesellschaft m.b.H.
Donau-City-Strasse 9, A-1220 Vienna
Phone: +43-1-211 77-0; Fax: -2009
e-mail: [email protected]
AGRANA Internationale
Verwaltungs- und Asset-Management
Aktiengesellschaft
Donau-City-Strasse 9, A-1220 Vienna
Phone: +43-1-211 37-0; Fax: -2766
e-mail: [email protected]
AGRANA Frucht Ges.m.b.H.
Donau-City-Strasse 9, A-1220 Vienna
Phone: +43-1-211 37-0; Fax: -2853
e-mail: [email protected]

Acknowledgements
Published by: AGRANA Beteiligungs-AG
Donau-City-Strasse 9, A-1220 Vienna
Group Communications/Investor Relations:
Brigitte Gampe
Phone: +43-1-211 37-2930; Fax: +43-1-211 37-2045
e-mail: [email protected]
Design: Kreativstudio Marchesani
Layout and typesetting: Kreativstudio Marchesani
Photos: Claudio Alessandri (photo of the
Board of Management), Heinz Henninger
Printing: Die Drucker, Mauerbach (Vienna)
English translation: Adrian Weisweiller M.A. (Oxon)
This Annual Report is available in German and English.

WWW.AGRANA.COM