sugarcane expansion and dairy farmer´s responses in brazil · introduction : brazil: local...
TRANSCRIPT

1
Sugarcane expansion and dairy farmer´s responses in Brazil
André L. M. NovoK. Giller; M . Slingerland; K. Jansen
Brasília, March, 2013

2
3
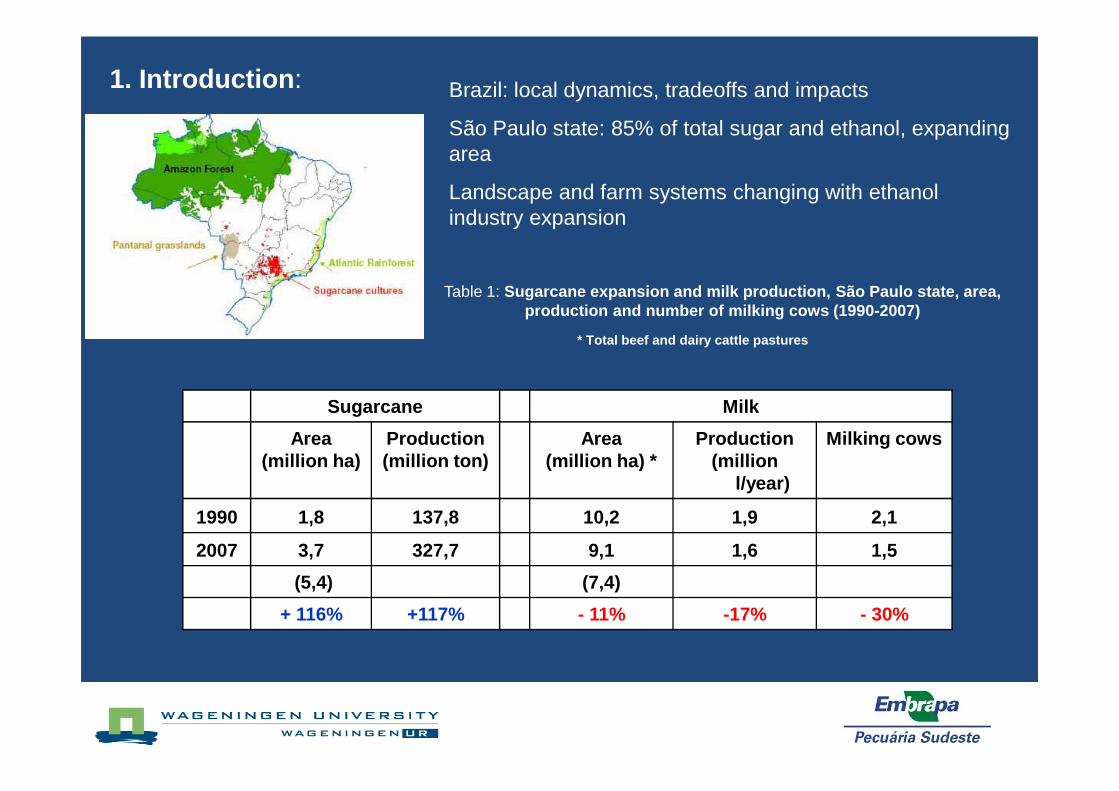
1. Introduction : Brazil: local dynamics, tradeoffs and impacts
São Paulo state: 85% of total sugar and ethanol, expanding area
Landscape and farm systems changing with ethanol industry expansion
Sugarcane Milk
Area (million ha)
Production(million ton)
Area (million ha) *
Production(million
l/year)
Milking cows
1990 1,8 137,8 10,2 1,9 2,1
2007 3,7 327,7 9,1 1,6 1,5
(5,4) (7,4)
+ 116% +117% - 11% -17% - 30%
Table 1: Sugarcane expansion and milk production, São Paulo state, area, production and number of milking cows (1990-2007)
* Total beef and dairy cattle pastures
4
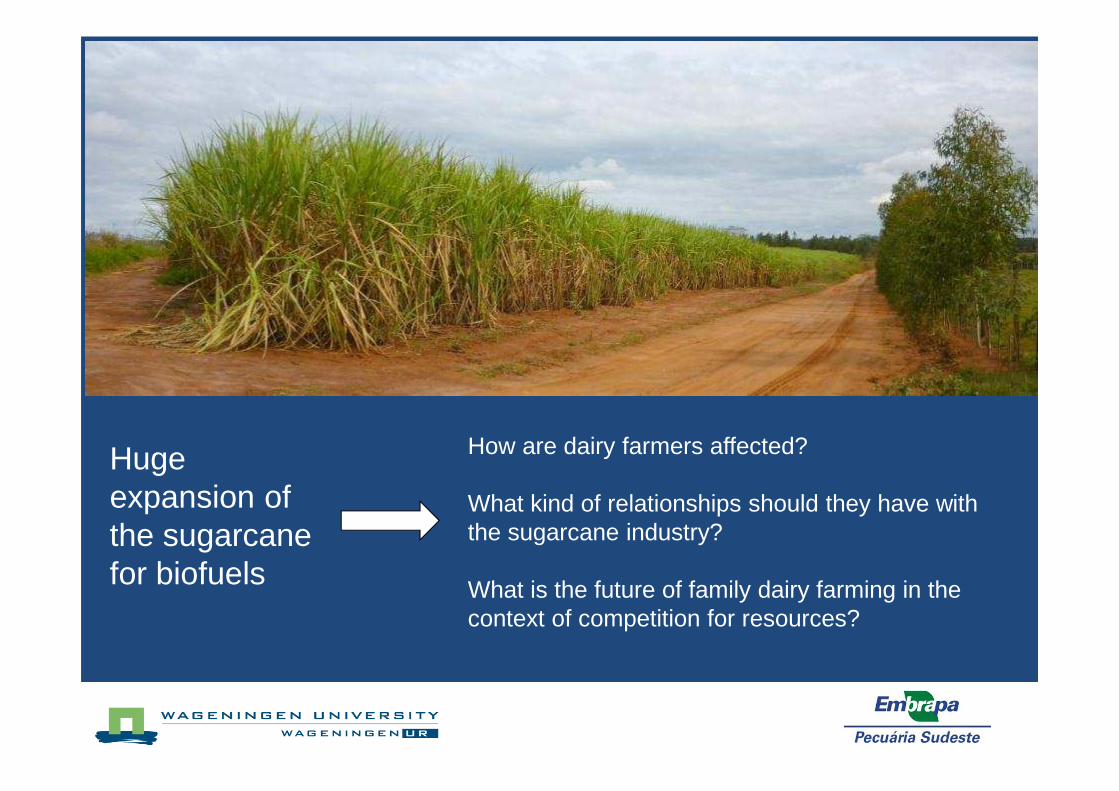
Hugeexpansion ofthe sugarcanefor biofuels
How are dairy farmers affected?
What kind of relationships should they have withthe sugarcane industry?
What is the future of family dairy farming in thecontext of competition for resources?

5
Figure 1 : Sugarcane and ethanol productivity in Brazil, 1975-2004.
Source: Martines-filho et al (2006)
High economic efficiency
90
100
110
120
130
140
150
160
170
1975 1980 1985 1990 1995 2000
YEAR
Inde
x (1
975
= 10
0)
Ton of sugarcane/hectare
litres of ethanol/ton of sugarcane
90
100
110
120
130
140
150
160
170
1975 1980 1985 1990 1995 2000
YEAR
Inde
x (1
975
= 10
0)
Ton of sugarcane/hectare
litres of ethanol/ton of sugarcane
2. The strength of the sugarcane sector:
- Long-term governmental support; several ups and downs; “Proálcool” programme (1979-1986)- After 1990: Self regulation and efficiency: blending rules, flex fuel, co-production of energy- 2005-2007: Just a recent impetus; oil prices blew up and available capital worldwide

6
� lack of long term policies � little to no subsidies� higher vulnerability to market forces
3. Dairy production in Brazil: the opposite model
- Unclear political scenario
- Inflation:1.000%/year
Land, pastures and cattle as capital protection
Milk intervention (prices)
Deregulation, concentration and new technology in t he 1990s
Withdrew all the regulations
Broke down all the barriers to external competition (importation)
Massive concentration in dairy industry and retail sector
“Longa Vida”: UHT technology

7
The milk frontier: the expansionist model of the dairy chain
5th. World biggest milk producer
Steady increasing rates
Horizontal expansion
-Ranchers consider milk as a by-product: monthly revenue
- Low risk, no specific investments, no contractual obligations
- Despite the distance, lower prices
-Easier and quicker than develop farmers

8
0
5
10
15
20
25
30
35
40
1980 1985 1990 1995 2000 2005 2008
year
Milk
pro
duct
ion
(bill
ion
litre
s/ye
ar)
0
5
10
15
20
25
30
35
40
Num
ber o
f cow
s (m
illio
ns)
Milk production
Milking cows
Figure 3: Number of milking cows and milk production in Brazil.Source: EMBRAPA, 2008. Original data, IBGE-PPM.
Low competitiveness as a pulling force for land use changes
-1.200 l/cow/year (2005) 1.000 l/cow/year (1994);
- Herd structure: 23 % milking cows (2005)
- Animal density: 1,2 AU/ha
- Gross income of R$ 300,00 -350,00/ha/year (2007)

9
0.0
1.0
2.0
3.0
4.0
5.0
6.0
7.0
8.0
1987 1989 1991 1993 1995 1997 1999 2001 2003 2005 2007
Ani
mal
hea
ds (M
illion
s)
1.0
1.5
2.0
2.5
3.0
3.5
4.0
4.5
Are
a (M
ha)
area beef dairy mix
EconomicStabilization
Figure 6: Bovine herd (beef, mix and dairy cattle) and sugarcane area, SP state, 1987-2007

10
25.00
30.00
35.00
40.00
45.00
50.00
55.00
2000 2001 2002 2003 2004 2005 2006 2007
year
R$/
t
50.00
55.00
60.00
65.00
70.00
75.00
80.00
85.00
90.00
95.00
R$/
@
sugarcane
beef
Figure 7 : Sugarcane and beef prices (deflated values by IGP-DI, R$/ton and R$/@);
@ = 30 kg of live weight
International oilprices rise
Foot and mouth disease
11
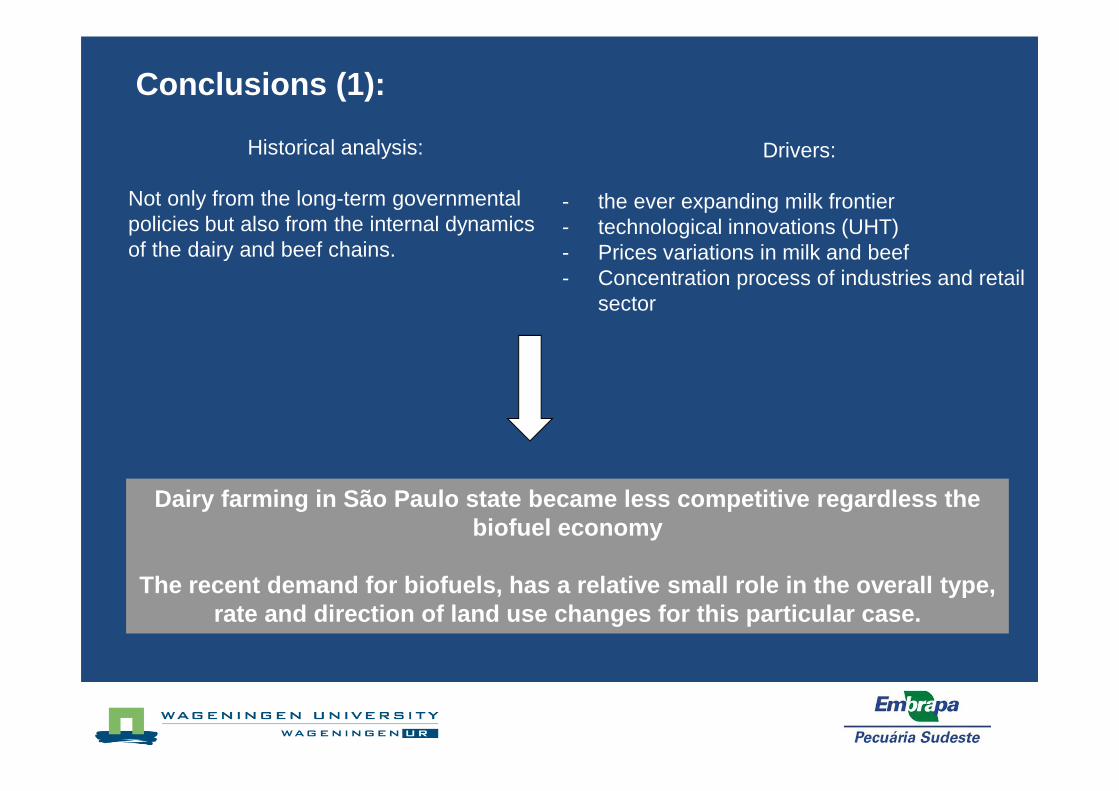
Historical analysis:
Not only from the long-term governmental policies but also from the internal dynamics of the dairy and beef chains.
Drivers:
- the ever expanding milk frontier - technological innovations (UHT)- Prices variations in milk and beef- Concentration process of industries and retail
sector
Dairy farming in São Paulo state became less compet itive regardless the biofuel economy
The recent demand for biofuels, has a relative smal l role in the overall type, rate and direction of land use changes for this par ticular case.
Conclusions (1):

12
Table 2: Complementary data of the COONAI dataset: average production; area, main occupation and educational level. N= 438.
* 18% works in services (lawyers, doctors, and dentists), 6.7% in commerce and 0.8% in the industry.Source: COONAI, unpublished data.
Production/farm(litre/day)
from 5 to 1,350Average: 158 l/daySD= 186.8
Total area(hectare)
from 1.6 to 1,305Average: 88,7 haSD= 145.1
Landowners’ mainoccupation
74.4% were farmers24.6% other activity *
31.6 % of farmers areretired
Educational level
29.6% university level14.0% high school9.3% fundamental46.8 % basic/no education
2/3 of those who haduniversity level areabsentee
Biofuels expansion: would it mean the same for every farmer?

13
The biggest challenge: labour availability
1. Intense, non-stop job
2. Labour laws
3. Small scale
4. Increasing wages and cheaper milk
- 1991: 202 litres/month- 2012: 850 litres/month
Minimum wage: + 133% Milk at farm gate: - 33%
Retired: - Advanced life cycle - Absence of
sons/daughters
Absentee: - Low qualification- Administrative problems- dependency
Family:- Size of the family- Intensity of the
production system
Entrepreneurs: - Large scale, several
employees- Professional support

14
Franca :
300 thousand inhab., high rates of population growth, 500 industries of shoes and food industry (coffee, dairy, sugarcane and beef)
São José do Rio Preto :
420 thousand inhabitants, agro-industries, furniture, health and educational centre.
The dynamic urban economy affecting labour availability: the competition for resources goes beyond the limits of the rural space.

15
The economic environment and farmers ´ strategies
The sugarcane industry : - Very efficient and able to make good offers- Long term contracts and monthly payments- Higher values than beef or dairy extensively
If it is so attractive, why not every farmer rent their land to sugarcane?
1. Capital accumulation and resilience
- Milk to create some income from the herd (asset)- Liquidity (climatic events, bankruptcy, health expenses, marry a son)
16
2. Flexible strategies
- Avoid investments and loans- Second milk, concentrates and less milk to calves
3. Technology introduction
- Reduce labour, exhibitionist behaviour and supervision of the employee
- Reach very high productivity in small areasPROJETO
BALDE CHEIO

17
Sugarcane as a diversification option
Less operation than annual cropsLogisticLess sensible to droughts and diseases
Provide capital to investments in other activity
Less risk of bankrupt than local farmers
Reduce the labour load
4. Dairy as a diversification option
- Hilly topography - Provide a monthly revenue while wait the best selling moment (grains,
coffee)

18
At farm level: labour availability, household resilience and techno logy introduction are the key factors for farmers’ decisions
Profit maximization is not the farmers’ main goal but risks perceptions and labour organization
Conclusions (2):
Leasing land respond to farmers’ needs: labour alleviation, safety and monthly payment. Wealthier farmers (large areas, size of the operation)
Quitting farming and living from the rent: a ‘one way street’. Very small farm sizes (< 10 ha): quitting farming is no option
Is it a threat oropportunity?
Sugarcane can support the conditions for intensific ation of family dairy farming
As a form of diversification: extra income, increas es the resilience and lowering risks and uncertainties

19
Technology Transfer MethodologyPROJETO
BALDE CHEIO
3.700 small holders farmers
550 extension service technicians
24 states
136 different partnershipsNutrition : intensive pasture managementsugarcane + urea (dry period)
oat and ryegrass over seed tropical grasslocal by-products as concentrates
Management : Herd structureImprovement on ambience (night grazing,
shade)
Reproduction : unproductive animals dismiss
regular controlHealth : parasites control; brucelosis and tuberculosisexams
Genetic : gradual herd improvement
Technical indexes and economic controls