summary of clinical impressions for respiratory system
TRANSCRIPT
University of New MexicoUNM Digital Repository
Native Health Database Full Text Health Sciences Center Archives and SpecialCollections
1996
Summary of clinical impressions for respiratorysystem disease: Indian heath service and tribaldirect and contract facilitiesSF Kaufman
Follow this and additional works at: https://digitalrepository.unm.edu/nhd
This Article is brought to you for free and open access by the Health Sciences Center Archives and Special Collections at UNM Digital Repository. Ithas been accepted for inclusion in Native Health Database Full Text by an authorized administrator of UNM Digital Repository. For more information,please contact [email protected].
Recommended CitationKaufman SF. Summary of clinical impressions for respiratory system disease: Indian heath service and tribal direct and contractfacilities Indian Health Service, Staff Office of Planning, Evaluation and Research, Rockville, MD 20857. 1996
SUMMARY OF CLINICAL IMPRESSIONS FOR RESPIRATORY SYSTEM DISEASES.
INDIAN HEALTH SERVICE AND TRIBAL DIRECT AND CONTRACT FACILITIES
FISCAL YEAR 1994
Department of Health and Human Services Public Health Service Indian Health Service
Office of Planning, Evaluation, and Legislation Division of Program Statistics Patient Care Statistics Branch
12300 Twinbrook Parkway, Suite 450 Rockville, Maryland 20852
(301) 443-1180

Indian Health Service
Michael H. Trujillo, M.D., M.P.H. Director
Office of Planning, Evaluation, and Legislation
Leo J. Nolan Acting Associate Director
Richard J. McCloskey Acting Deputy Associate Director
Division of Program Statistics
Anthony J. D'Angelo Director
Patient Care Statistics Branch
Stephen F. Kaufman, Chief Bonnie M. Matheson, Computer Assistant

SUMMARY OF CLINICAL IMPRESSIONS FOR RESPIRATORY SYSTEM DISEASES
INDIAN HEALTH SERVICE AND TRIBAL DIRECT AND CONTRACT FACILITIES
FISCAL YEAR 1994
Steve Kaufman Division of Program Statistics Patient Care Statistics Branch February 1996

TABLE OF CONTENTS
INTRODUCTION
OVERALL LEADING DIAGNOSTIC CATEGORIES 1
OVERALL LEADING SPECIFIC CAUSES. . . . . . . . . . . . . . . . . . . . . . . . . . . . . . . . . . . .. 2
SPECIFIC RESPIRATORY SYSTEM DISEASES. . . . . . .. . . . . . . . . . . . . . . . . . . . . . . .. 2
SPECIFIC RESPIRATORY SYSTEM DISEASES BY TYPE OF FACILITY. . . . . . . . . .. 3
OVERALL LEADING SPECIFIC CAUSES BY SEX " 3
SPECIFIC RESPIRATORY SYSTEM DISEASES BY SEX. . . . . . . . . . . . . . . . . . . . . . .. 4
RESPIRATORY SYTEM DISEASE BY AGE AND SEX '" . 4
SPECIFIC RESPIRATORY SYSTEM DISEASES BY AGE AND SEX. . . . . . . . . . . . . .. 5 Upper Respiratory Infection. . . . . . . . . . . . . . . . . . . . . . . . . . . . . . . . . . . . . . . . . . .. 5 Pharyngitis and Tonsillitis (Non-strep) . . . . . . . . . . . . . . . . . . . . . . . . . . . . . . . . . . .. 6 Respiratory Allergy, Asthma, and Hay Fever 7
FIGURES:
1. Distribution of Clinical Impressions for Respiratory System Diseases illS and Tribal Direct and Contract Facilities, FY 1994 . . . . . . . . . . . . . . . . . . . . . . . .. 11
2. Distribution of Clinical Impressions for Respiratory System Diseases by Age and Sex IHS and Tribal Direct and Contract Facilities, FY 1994 . . . . . . . . . . . . . . . . . . . . . . . .. 12
3. Median Age (in Years) for All Clinical Impressions, for All Respiratory System Impressions, and Impressions for Three Leading Specific Respiratory System Diseases illS and Tribal Direct and Contract Facilities, FY 1994 . . . . . . . . . . . . . . . . . . . . . . . .. 13
TABLES:
1. Number of Clinical Impressions by Leading Diagnostic Category, FY 1994 Indian Health Service and Tribal Direct and Contract Facilities . . . . . . . . . . . . . . . . . .. 14
TABLE OF CONTENTS
2. Number of Problems/Clinical Impressions for Leading Specific Conditions Indian Health Service and Tribal Direct and Contract Facilities Fiscal Year 1994 . . . . . . . . . . . . . . . . . . . . . . . . . . . . . . . . . . . . . . . . . . . . . . . . . . . . .. 15
3. Number and Percentage Distributions of Clinical Impressions for Specific Respiratory System Diseases by Type (Direct, Contract) Indian Health Service and Tribal Direct and Contract Facilities Fiscal Year 1994 . 16
4. Number of Clinical Impressions for Leading Specific Conditions by Sex Indian Health Service and Tribal Direct and Contract Facilities Fiscal Year 1994 . . . . . . . . . . . . . . . . . . . . . . . . . . . . . . . . . . . . . . . . . . . . . . . . . . . . .. 17
5. Number and Percentage Distributions of Clinical Impressions for Specific Respiratory System Diseases by Sex Indian Health Service and Tribal Direct and Contract Facilities Fiscal Year 1994 . . . . . . . . . . . . . . . . . . . . . . . . . . . . . . . . . . . . . . . . . . . . . . . . . . . . .. 18
6. Number and Percentage Distributions of Clinical Impressions for Respiratory System Diseases by Age and Sex Indian Health Service and Tribal Direct and Contract Facilities Fiscal Year 1994 . . . . . . . . . . . . . . . . . . . . . . . . . . . . . . . . . . . . . . . . . . . . . . . . . .. 19
7. Number and Percentage Distributions of Clinical Impressions for Upper Respiratory Infection, Including Common Cold, by Age and Sex Indian Health Service and Tribal Direct and Contract Facilities Fiscal Year 1994 . . . . . . . . . . . . . . . . . . . . . . . . . . . . . . . . . . . . . . . . . . . . . . . . . . . . .. 20
8. Number and Percentage Distributions of Clinical Impressions for Pharyngitis and Tonsillitis (Non-Strep) by Age and Sex Indian Health Service and Tribal Direct and Contract Facilities Fiscal Year 1994 . ............. , 21
9. Number and Percentage Distributions of Clinical Impressions for Respiratory Allergy, Asthma, and Hay Fever, by Age and Sex Indian Health Service and Tribal Direct and Contract Facilities Fiscal Year 1994 . . . . . . . . . . . . . . . . . . . . . . . . . . . . . . . . . . . . . . . . . . . . . . . . . . . . .. 22
II
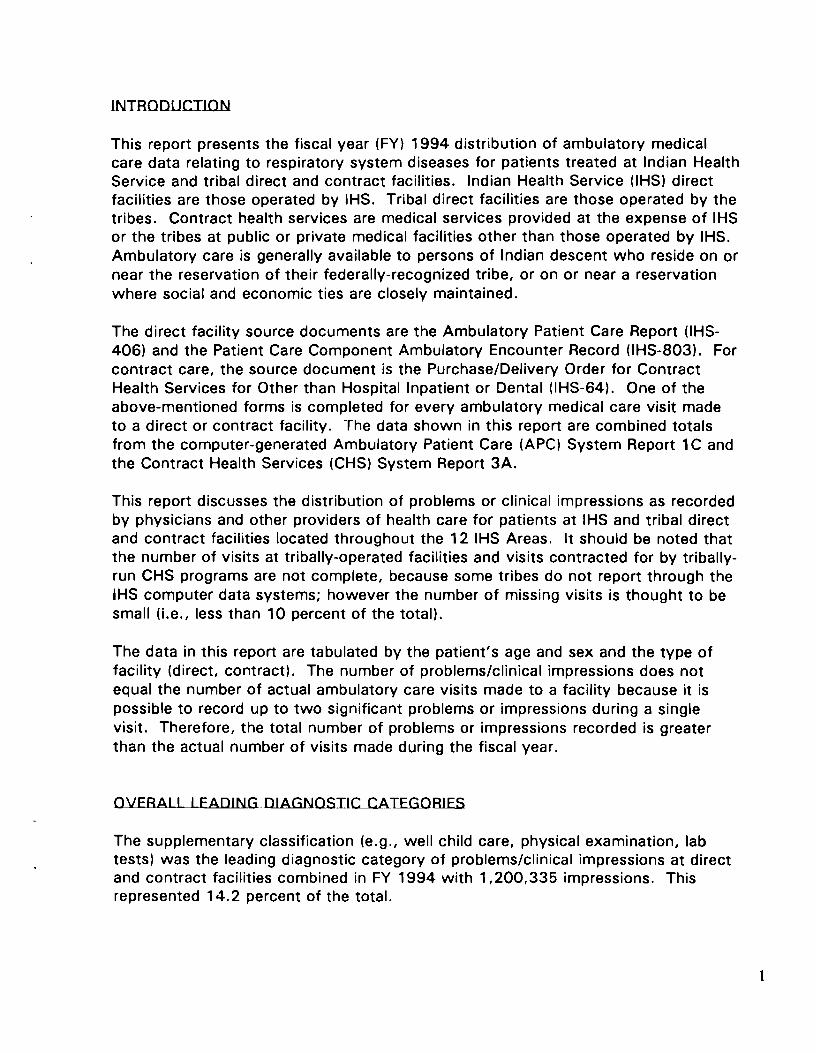
INTRODUCTION
This report presents the fiscal year (FY) 1994 distribution of ambulatory medical care data relating to respiratory system diseases for patients treated at Indian Health Service and tribal direct and contract facilities. Indian Health Service (IHS) direct facilities are those operated by IHS. Tribal direct facilities are those operated by the tribes. Contract health services are medical services provided at the expense of IHS or the tribes at public or private medical facilities other than those operated by IHS. Ambulatory care is generally available to persons of Indian descent who reside on or near the reservation of their federally-recognized tribe, or on or near a reservation where social and economic ties are closely maintained.
The direct facility source documents are the Ambulatory Patient Care Report (IHS406) and the Patient Care Component Ambulatory Encounter Record (IHS-803). For contract care, the source document is the Purchase/Delivery Order for Contract Health Services for Other than Hospital Inpatient or Dental (IHS-64). One of the above-mentioned forms is completed for every ambulatory medical care visit made to a direct or contract facility. The data shown in this report are combined totals from the computer-generated Ambulatory Patient Care (APe) System Report 1C and the Contract Health Services (CHS) System Report 3A.
This report discusses the distribution of problems or clinical impressions as recorded by physicians and other providers of health care for patients at IHS and tribal direct and contract facilities located throughout the 12 IHS Areas. It should be noted that the number of visits at tribally-operated facilities and visits contracted for by triballyrun CHS programs are not complete, because some tribes do not report through the IHS computer data systems; however the number of missing visits is thought to be small (Le., less than 10 percent of the total).
The data in this report are tabulated by the patient's age and sex and the type of facility (direct, contract). The number of problems/clinical impressions does not equal the number of actual ambulatory care visits made to a facility because it is possible to record up to two significant problems or impressions during a single visit. Therefore, the total number of problems or impressions recorded is greater than the actual number of visits made during the fiscal year.
OVERAl L lEADING DIAGNOSTIC CATEGORIES
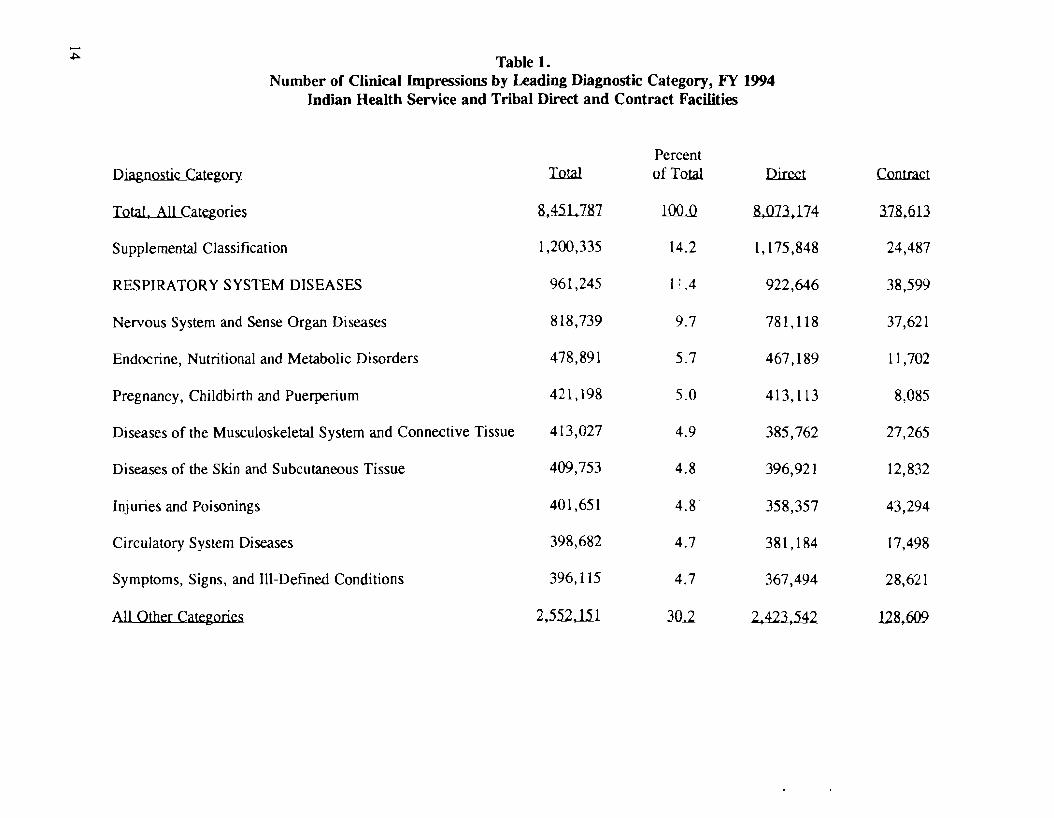
The supplementary classification (e.g., well child care, physical examination, lab tests) was the leading diagnostic category of problems/clinical impressions at direct and contract facilities combined in FY 1994 with 1,200,335 impressions. This represented 14.2 percent of the total.
1
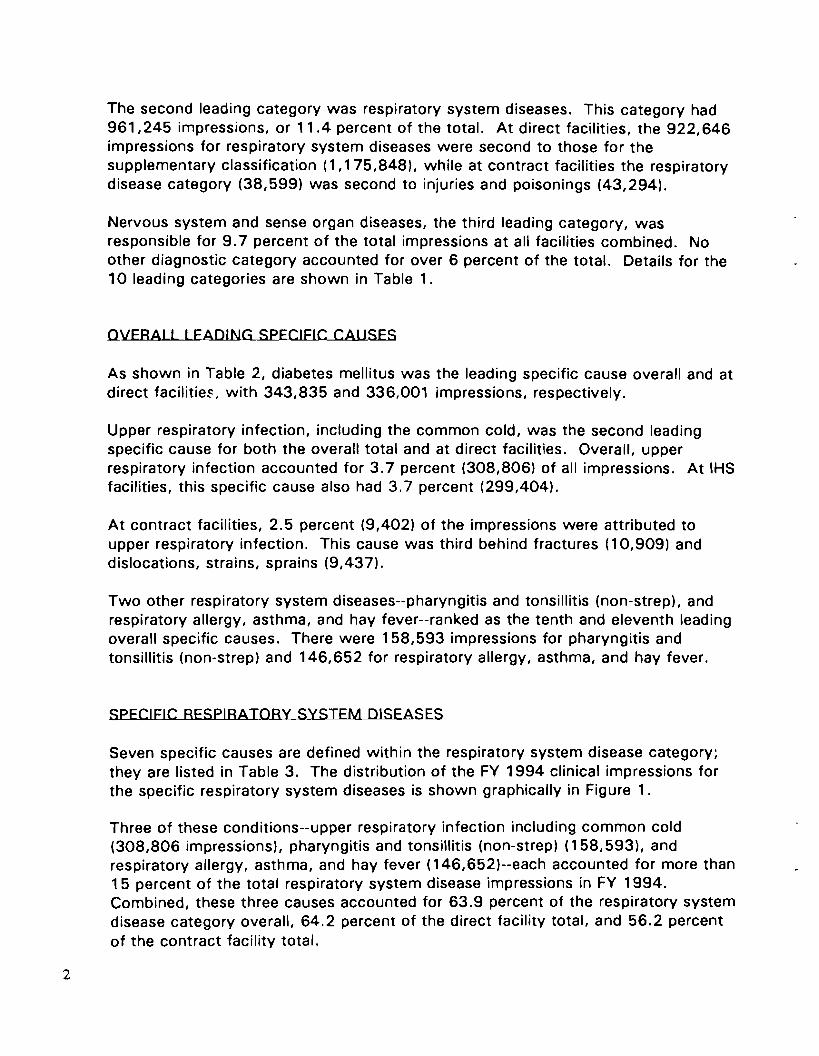
The second leading category was respiratory system diseases. This category had 961,245 impressions, or 11.4 percent of the total. At direct facilities, the 922,646 impressions for respiratory system diseases were second to those for the supplementary classification (1,175,848), while at contract facilities the respiratory disease category (38,599) was second to injuries and poisonings (43,294).
Nervous system and sense organ diseases, the third leading category, was responsible for 9.7 percent of the total impressions at all facilities combined. No other diagnostic category accounted for over 6 percent of the total. Details for the 10 leading categories are shown in Table 1.
OVERALL LEADING SPECIFIC CAUSES
As shown in Table 2, diabetes mellitus was the leading specific cause overall and at direct facilities, with 343,835 and 336,001 impressions, respectively.
Upper respiratory infection, including the common cold, was the second leading specific cause for both the overall total and at direct facilities. Overall, upper respiratory infection accounted for 3.7 percent (308,806) of all impressions. At IHS facilities, this specific cause also had 3.7 percent (299,404).
At contract facilities, 2.5 percent (9,402) of the impressions were attributed to upper respiratory infection. This cause was third behind fractures (10,909) and dislocations, strains, sprains (9,437).
Two other respiratory system diseases--pharyngitis and tonsillitis (non-strep), and respiratory allergy, asthma, and hay fever--ranked as the tenth and eleventh leading overall specific causes. There were 158,593 impressions for pharyngitis and tonsillitis (non-strep) and 146,652 for respiratory allergy, asthma, and hay fever.
SPECIFIC RESPIRATORY SYSTEM DISEASES
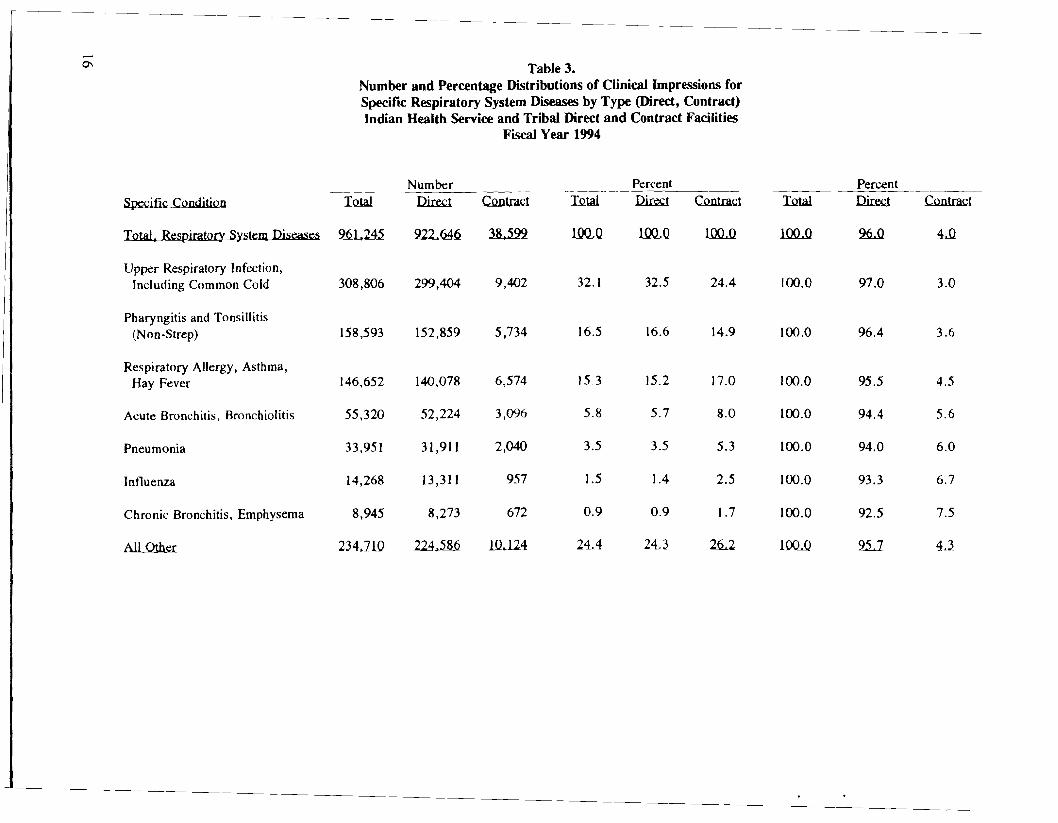
Seven specific causes are defined within the respiratory system disease category; they are listed in Table 3. The distribution of the FY 1994 clinical impressions for the specific respiratory system diseases is shown graphically in Figure 1.
Three of these conditions--upper respiratory infection including common cold (308,806 impressions), pharyngitis and tonsillitis (non-strep) (158,593), and respiratory allergy, asthma, and hay fever (146,652)--each accounted for more than 15 percent of the total respiratory system disease impressions in FY 1994. Combined, these three causes accounted for 63.9 percent of the respiratory system disease category overall, 64.2 percent of the direct facility total, and 56.2 percent of the contract facility total.
2
The remaining four specific causes overall ranged from 55,320 impressions for the acute bronchitis, bronchiolitis to 8,945 for the chronic bronchitis, emphysema. Added together, these four causes (112,484) accounted for fewer impressions than the third leading cause--respiratory allergy, asthma, and hay fever (146,652).
SPECIFIC RESPIRATORY SYSTEM DISEASES BY TYPE OF FACILITY
At direct facilities, the three leading specific respiratory system causes were the same as for all facilities and in the same order: upper respiratory infection (299,404 impressions), pharyngitis and tonsillitis (non-strep) (152,859), and respiratory allergy, asthma, and hay fever (140,078). At contract facilities, the three leading causes were the same but the order differed: upper respiratory infection (9,402), respiratory allergy, asthma, and hay fever (6,574), and pharyngitis and tonsillitis (5,734).
At direct facilities, upper respiratory infection accounted for 32.5 percent of the total respiratory system disease impressions; however, at contract facilities this specific cause accounted for only 24.4 percent. The other two leading causes showed more similar percentages of total at direct and contract facilities--pharyngitis and tonsillitis (direct: 16.6, contract: 14.9) and respiratory allergy, asthma, and hay fever (direct: 15.2; contact: 17.0).
The remaining four specific causes were in the same order at direct and at contract facilities: acute bronchitis, bronchiolitis (direct: 52,224; contract: 3,096), pneumonia (31,911, 2,040), influenza (13,311; 957), and chronic bronchitis, emphysema (8,273; 672). However, each cause accounted for a higher percentage of the total respiratory system impressions at contract facilities. For example, acute bronchitis, bronchiolitis accounted for 8.0 percent of the respiratory impressions at contract facilities, but only 5.7 percent at direct facilities.
Overall, 96.0 percent of all the respiratory system impressions were seen at direct facilities (thus, 4.0 percent were seen at contract facilities). The percentages at direct facilities ranged from 97.0 (contract: 3.0) for upper respiratory infection to 92.5 (contract: 7.5) for chronic bronchitis, emphysema.
OVERALL LEADING SPECIFIC CAUSES BY SEX
Table 4 shows the number of clinical impressions in FY 1994 for the leading specific causes by sex. Otitis media (146,761 impressions) was the leading condition for males and diabetes mellitus (209,905) was leading cause among females. Diabetes mellitus (133,930) was the second leading cause for males, while prenatal care (203,720) was the second for females.
3
Upper respiratory infection was the third leading specific cause among males (127,446) and was the fourth for females (181,360). Pharyngitis and tonsillitis was the ninth leading male cause (63,113) and eleventh for females (95,480). Respiratory allergy, asthma, and hay fever was eleventh among males (61,719), but was not among the top 11 specific causes for females; this cause accounted for 84,933 female clinical impressions.
SPECIFIC RESPIRATORY SYSTEM DISEASES BY SEX
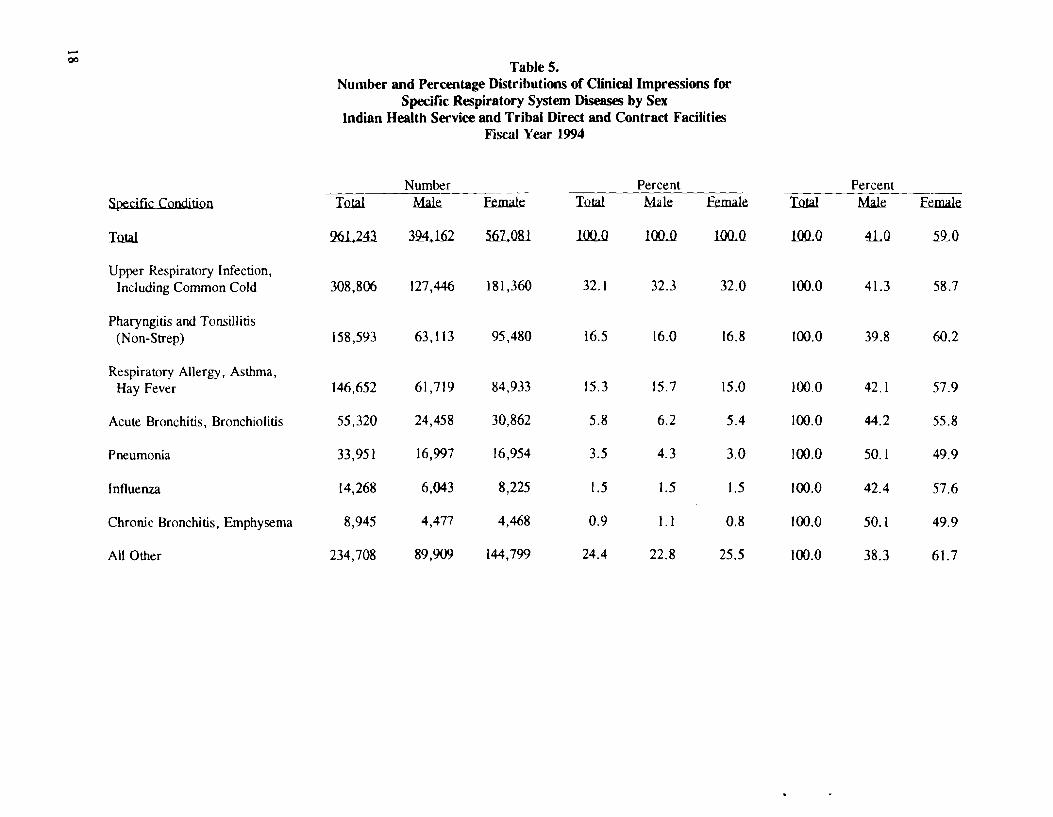
Females accounted for 567,081 (59.0 percent) of the total of 961,243 clinical impressions for respiratory system diseases in FY 1994, while males accounted for 394,162 (41 .0). As shown in Table 5, impressions for females outnumbered those for males in all seven specific respiratory system causes except pneumonia and chronic bronchitis, emphysema; for both of these causes, males represented 50.1 percent of the total.
Females accounted for 181,360 (58.7 percent) of the upper respiratory infection impressions, the overall leading specific respiratory system cause. Among the pharyngitis and tonsillitis (the second leading respiratory system cause overall) impressions, females represented 60.2 percent; this was the highest percentage of total for females except for the "all other" category (61.7).
Each of the specific causes accounted for similar percentages within the female and within the male categories. For example, upper respiratory infection accounted for 32.3 percent of the total male respiratory system impressions and 32.0 percent of the total for females. The three leading specific causes accounted for 64.0 percent of the male impressions and 63.8 percent of the female impressions; in each case the three leading causes were upper respiratory infection, pharyngitis and tonsillitis, and respiratory allergy, asthma, and hay fever.
RESPIRATORY SYSTEM DISEASE BY AGE AND SEX
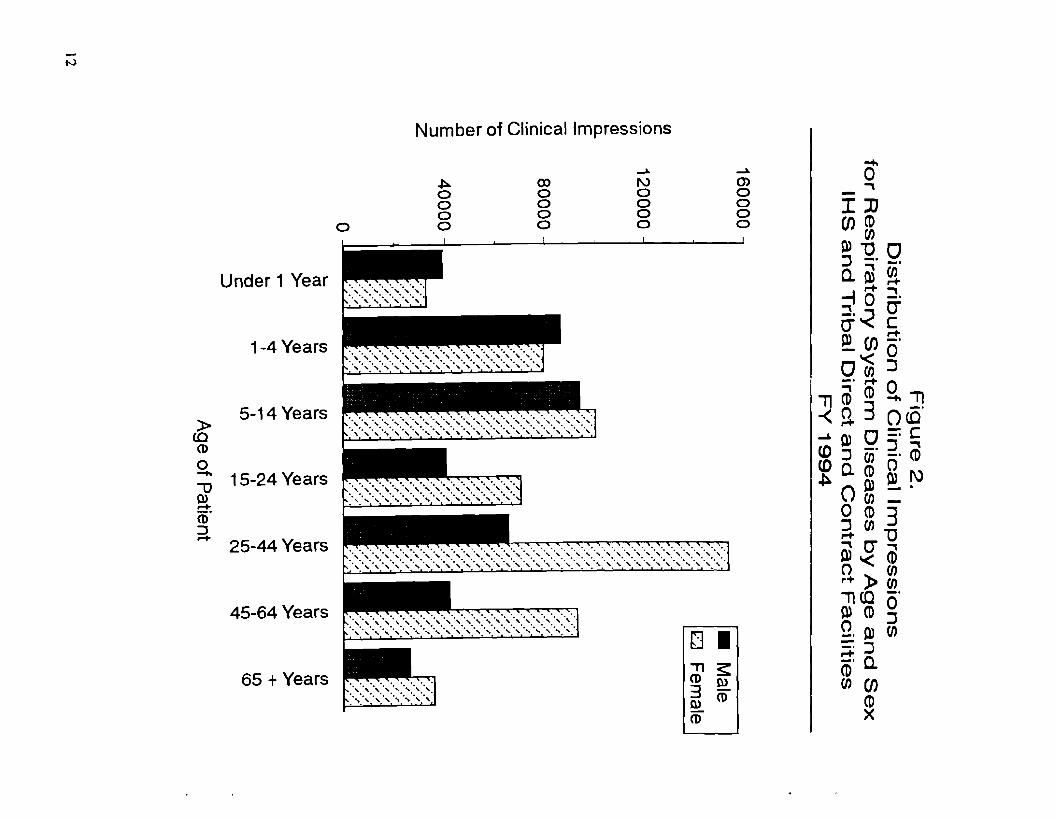
Table 6 shows the numerical and percentage distributions of the respiratory system disease category impressions by age and sex for FY 1994. The numerical distribution by age and sex is shown graphically in Figure 2.
Overall, females accounted for 59.0 percent of all respiratory system disease impressions. Interestingly, males outnumbered females in the youngest age groups (under 1 year, 1-4 years old). However, females had a higher number of impressions in each of the other age groups. There were more than twice as many female impressions as male impressions in the 25-44 and 45-64 year old age groups. In the 25-44 year old age group, 70.1 percent of the impressions were for females. In the 45-64 year old age group, the female percentage was 69.0.
4
The median age for a respiratory system clinical impression was 19.3 years, while the median age for all impressions in FY 1994 was 32.6 years. Figure 3 shows this graphically, and in addition shows the median ages for the three leading specific causes of respiratory system disease.
Nearly half (45.0 percent) of the respiratory system impressions were for pediatric patients, i.e., patients under 15 years old. This percentage is considerably higher than the pediatric percentage (26.1) for all clinical impressions in FY 1994.
The pediatric respiratory system impressions were nearly evenly divided between males (219,502) and females (212,921). However, male pediatric impressions accounted for 55.6 percent of the total male respiratory system impressions, while female pediatric impressions accounted for only 37.5 percent of the total for females. Thus, the average age for male respiratory impressions was much younger than the average female age. In fact, the median age of a male respiratoiY system disease impression (12.6 years) was half that of a female (25.0 years).
SPECIFIC RESPIRATORY SYSTEM DISEASES BY AGE ANn~
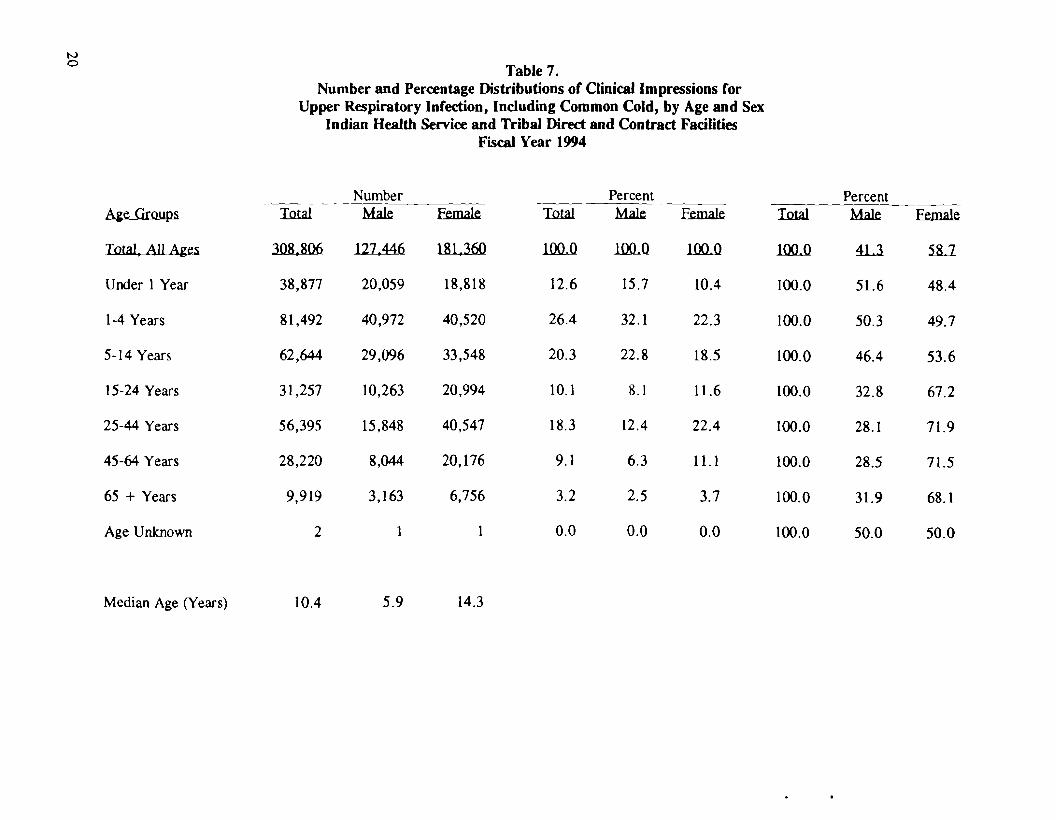
Tables 7, 8, and 9 show the numerical and percentage distributions of impressions by age and sex for the three leading specific causes of respiratory system diseases-upper respiratory infection (Table 7), pharyngitis and tonsillitis (Table 8), and respiratory allergy, asthma, and hay fever (Table 9)--for FY 1994. These three specific causes accounted for nearly two-thirds (63.9 percent) of all of the respiratory system disease impressions.
Upper Respiratory Infection
Impressions for females comprised 58.7 percent of the total upper respiratory infection impressions. This was very similar to the percentage for females (59.0) for all respiratory system disease impressions.
Nearly three-fifths (183,013; 59.2 percent) of the 308,806 impressions for upper respiratory infection were for pediatric patients. Pediatric patients accounted for 90,127 (70.7 percent) of the 127,446 male upper respiratory infection impressions, and 92,886 (51.2 percent) of the 181,360 female impressions. These percentages were considerably higher than those for all respiratory system diseases (total: 45.0 percent; male: 55.7; female: 37.5).
Patients under 5 years old accounted for more than one-third (39.0 percent) of the total impressions for upper respiratory infection. Of males, patients under 5 years accounted for nearly one-half (47.8 percent) of the total impressions. For females, the percentage was 32.7.
5
Conversely, ages 25 years and over accounted for only 30.6 percent of all upper respiratory infection impressions. Among males, ages 25 years or older represented only 21 .2 percent of the total; while the comparable percelltage for females was 37.2 percent.
The average age for those seen for upper respiratory infection (median age 10.4 years) was much younger than the average for all respiratory system disease impressions (median age 19.3 years). The median age for male upper respiratory infection impressions was only 5.9 years, while the median female age was 14.3 years. These were only about one-half the median age for male (12.6 years) and female (25.0 years) impressions for all respiratory system diseases.
Upper respiratory infection impressions for males (61,031) slightly outnumbered those for females (59,338) in the age groups under 5 years old. However, females outnumbered males in all of the other age groups. In each of the adult age groups (15-24 years, 25-44 years, 45-64 years, 65 years and older), the number of female impressions was more than double the male impressions. In total, there were 88,473 adult female impressions, compared to 37,318 for adult males, for upper respiratory infection.
Pharyngitis and Tonsillitis (Non-strep)
Female impressions (95,480) accounted for 60.2 percent of the total pharyngitis and tonsillitis impressions (158,593). This was close to the percentage for females (59.0) for all respiratory system disease impressions.
One-half (79,425; 50.1 percent) of the pharyngitis and tonsillitis impressions were for pediatric patients. Pediatric patients accounted for 36,838 (58.4 percent) of the 63,113 male pharyngitis and tonsillitis impressions, and 42,587 (44.6 percent) of the 95,480 female impressions. These percentages were slightly higher than those for all respiratory system diseases (total: 45.0 percent; male: 55.7; female: 37.5),
Patients 5-14 years old accounted for more than one-third (34.5 percent) of the total impressions for pharyngitis and tonsillitis. Among male patients, this age group accounted for 38.5 percent of the total. For females, the percentage was 32.0.
There were very few patients over age 44 seen for pharyngitis and tonsillitis. These age groups contributed only 8.8 percent of the pharyngitis and tonsillitis impressions; this compares to 20.6 percent of impressions for all respiratory system diseases.
6
The average age of pharyngitis and tonsillitis impressions (median age 15.0 years) was somewhat younger than that for all respiratory system diseases (median age 19.3 years). The median age for male pharyngitis and tonsillitis impressions (12.8 years) was slightly older than the male median age for all respiratory system diseases (12.6 years). For females, the pharyngitis median age (17.8 years) was much younger than that for all respiratory system diseases (25.0 years).
Pharyngitis and tonsillitis impressions for males (12,569) slightly outnumbered those for females (12,066) in the age groups under 5 years old. However, females outnumbered males in all of the other age groups. In each of the age groups over 24 years old (25-44 years, 45-64 years, 65 years and older), the number of female impressions was more than double the male impressions.
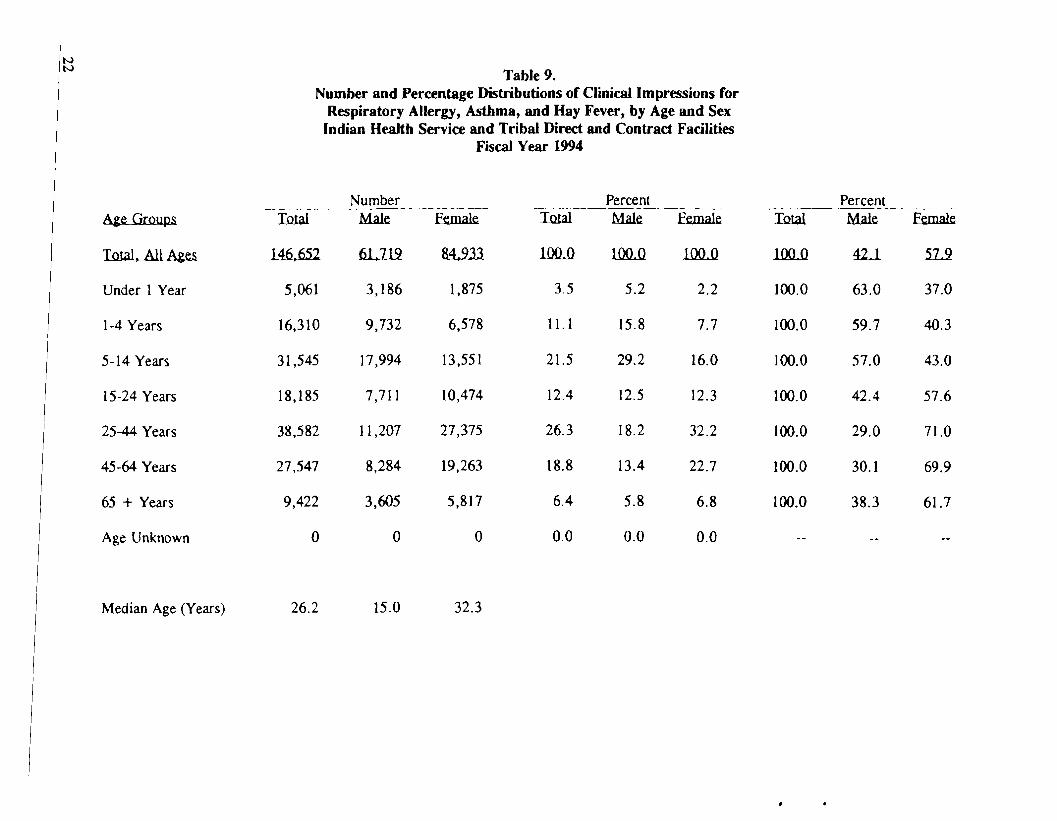
Respiratory Allergy, Asthma, and Hay Fever
Female impressions (84,933) accounted for 57.9 percent of the total impressions for respiratory allergy, asthma, and hay fever (146,652). This was slightly less than the percentage for females (59.0) for all respiratory system disease impressions.
A little more than one-third (52,916; 36.1 percent) of the respiratory allergy, asthma, and hay fever impressions were for pediatric patients. Pediatric patients accounted for one-half (30,912; 50.1 percent) of the 61,719 male impressions for respiratory allergy, asthma, and hay fever, but only one-quarter (22,004; 25.9 percent) of the 84,933 female impressions. These percentages were considerably lower than those for all respiratory system diseases (total: 45.0 percent; male: 55.7; female: 37.5).
No particular age group stood out with a high percentage of impressions for these diseases. However, patients on average were older than those seen for all respiratory system diseases, and also older than those seen for upper respiratory infection or for pharyngitis and tonsillitis. One-quarter (36,969; 25.2 percent) of the impressions for respiratory allergy, asthma, and hay fever were for patients 45 years or older. This compares to only 20.6 percent of impressions for all respiratory system diseases.
The average age for respiratory allergy, asthma, and hay fever impressions (median age 26.2 years) was 7 years older than the average for all respiratory system diseases (median age 19.3 years). The median age for female respiratory allergy, asthma, and hay fever impressions (32.3 years) was more than twice the age of males (15.0 years) seen for these diseases. Both the male and female median ages for respiratory allergy, asthma, and hay fever impressions were greater than the median ages for impressions for all respiratory system diseases (female: 25.0 years; male: 12.6 years).
7
Respiratory allergy, asthma, and hay fever impressions for males outnumbered those for females in all three pediatric age groups (under 1 year, 1-4 years, 5-14 years). There were 30,912 impressions for males under 15 years old and 22,004 impressions for females. However, in each of the adult age groups, the number of female respiratory allergy, asthma, and hay fever impressions outnumbered those for males. In both the 25-44 and 45-64 year old age groups, the number of female impressions was more than double the male impressions.
8
FIGURES AND TABLES
9

10
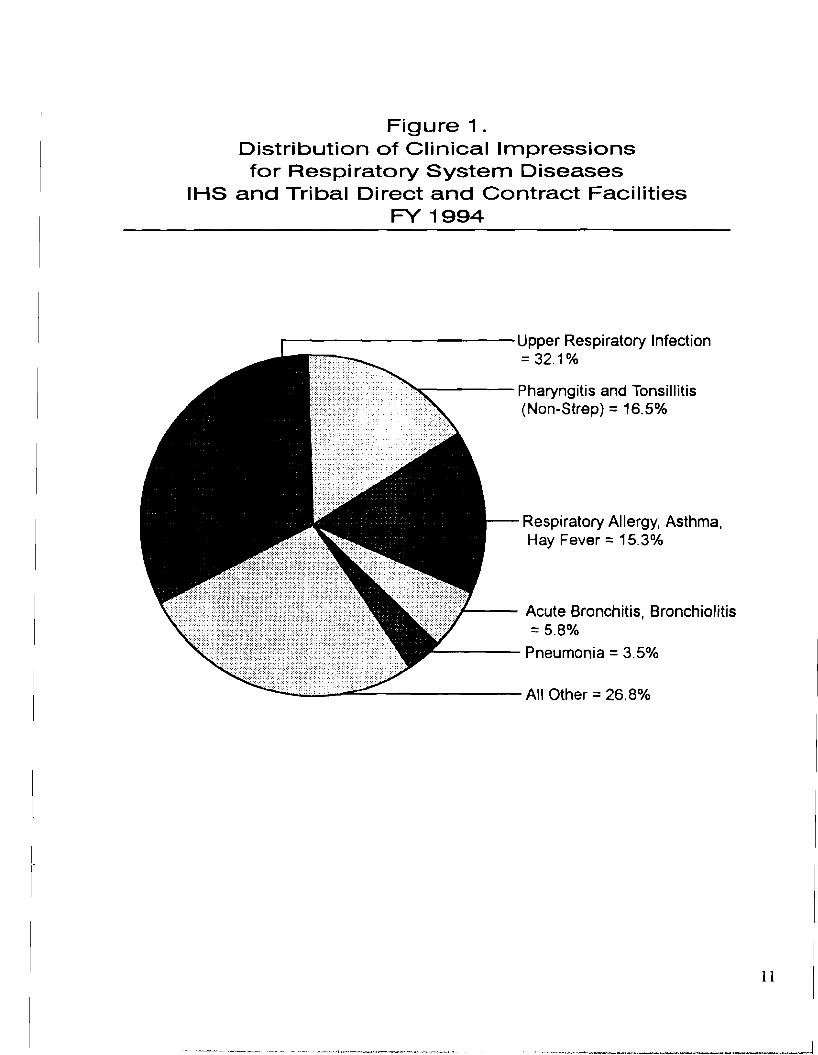
Figure 1 . Distribution of Clinical Impressions for Respiratory System Diseases
IHS and Tribal Direct and Contract Facilities FY 1994
r------------Upper Respiratory Infection = 32.1%
--
----
Respiratory Allergy, Asthma, Hay Fever = 15.3%
",.,"'"",....----- Pharyngitis and Tonsillitis (Non-Strep) = 16.5%
Acute Bronchitis, Bronchiolitis = 5.8%
Pneumonia = 3.5%
~.:£.2.2Jj.:;;' --------- All Other = 26.8%
11
...... N
Number of Clinical Impressions
...... ......
o
,tl. o o o o
00 o o o o
r-v o o o o
0> o o o o
Under 1 Year
1-4 Years
5-14 Years » eo co o
15-24 Years -"'0 em" :::J .-+
25-44 Years
45-64 Years
65 +Years
lJ • 'TI~ CD Q)3 co Q)
CD
..... o,IlJ en CD en r&> "0 CJ ~ -._. Q.~~ -f r-+,0
6=< [ _.
r&> en _. -'< 0 CJen~ _. r-+ 0 'CD ..... 11
" ~ 3 0 cO'-<r-+ -c ~ r&> 9 5' ,CO ~ en _. CD COQ.CD~f\) ~()r&>-
en o CD 3 ~en"O ~O', r&> '< CD() en ,.+ » ~. 11 CO 0 r&> CD ~ Q. r&> en =~ ~Q.
men CD X
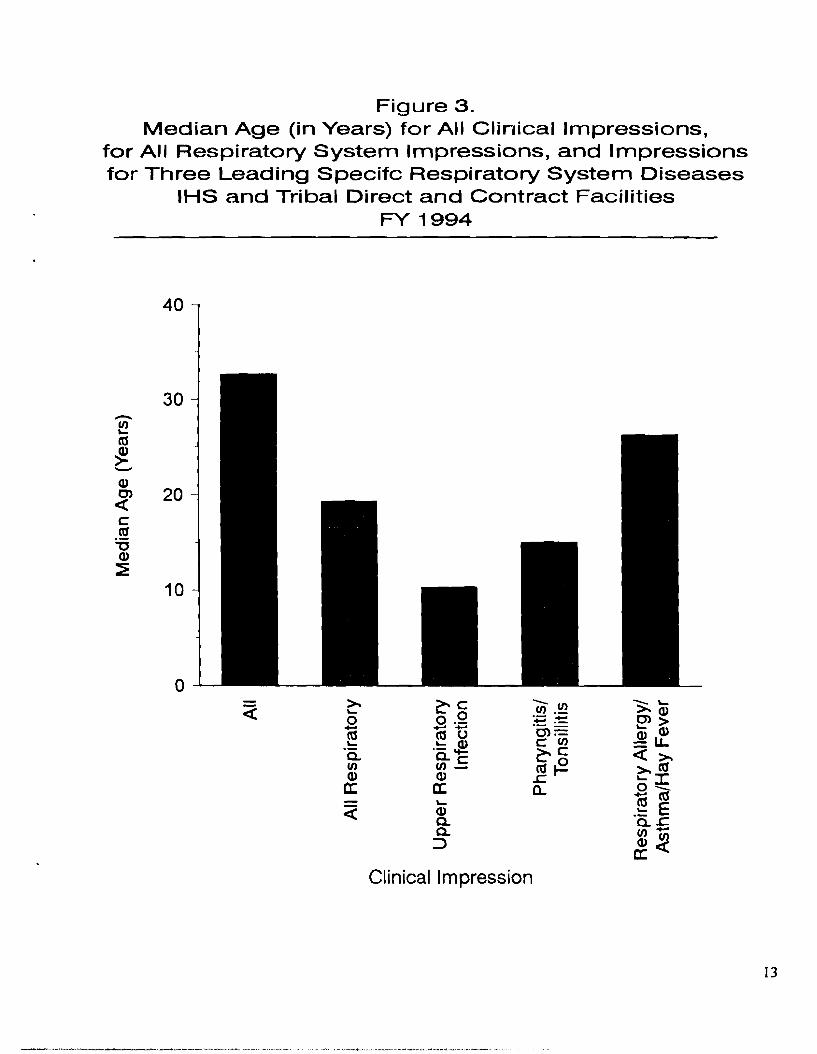
Figure 3. Median Age (in Years) for All Clinical Impressions,
for All Respiratory System Impressions, and Impressions for Three Leading Specifc Respiratory System Diseases
IHS and Tribal Direct and Contract Facilities FY 1994
40
>. ~c -II) >. ........ (1). 0>Q)0.2 .-- .-09 .......... .... > ta () '6>= Q) Q)
II)~ .~~ c =U
a. a.c ~c «>. II) rJ) ta~ >.taQ) Q) .c .... J:0_c: 0: Q..
.... - ta Q) .~ E« a. a..c a. rJ)
Q) rJ):::> 0:«
Clinical Impression
30 -II).... ta
~ ...Q) 0> 20 -« c .~ "'C Q)
~
10
o
I3
~ Table 1. Number of Clinical Impressions by Leading Diagnostic Category, FY 1994
Indian Health Service and Tribal Direct and Contract Facilities
Diagnostic Category
Total, All Categories
Supplemental Classification
RESPIRATORY SYSTEM DISEASES
Nervous System and Sense Organ Diseases
Endocrine, Nutritional and Metabolic Disorders
Pregnancy, Childbirth and Puerperium
Diseases of the Musculoskeletal System and Connective Tissue
Diseases of the Skin and Subcutaneous Tissue
Injuries and Poisonings
Circulatory System Diseases
Symptoms, Signs, and Ill-Defined Conditions
All Other Cate2:ories
Percent Iillal of Total
8..451,787 lOOJ)
1,200,335 14.2
961,245 1: .4
818,739 9.7
478,891 5.7
421,198 5.0
413,027 4.9
409,753 4.8
401,651 4.8
398,682 4.7
396,115 4.7
2.552.151 lQ.2
.I2lli:d Contracl
8,073,174 ll8Ji13
1,175,848 24,487
922,646 38,599
781,118 37,621
467,189 11 ,702
413,113 8,085
385,762 27,265
396,921 12,832
358,357 43,294
381,184 17,498
367,494 28,621
~542 128.609
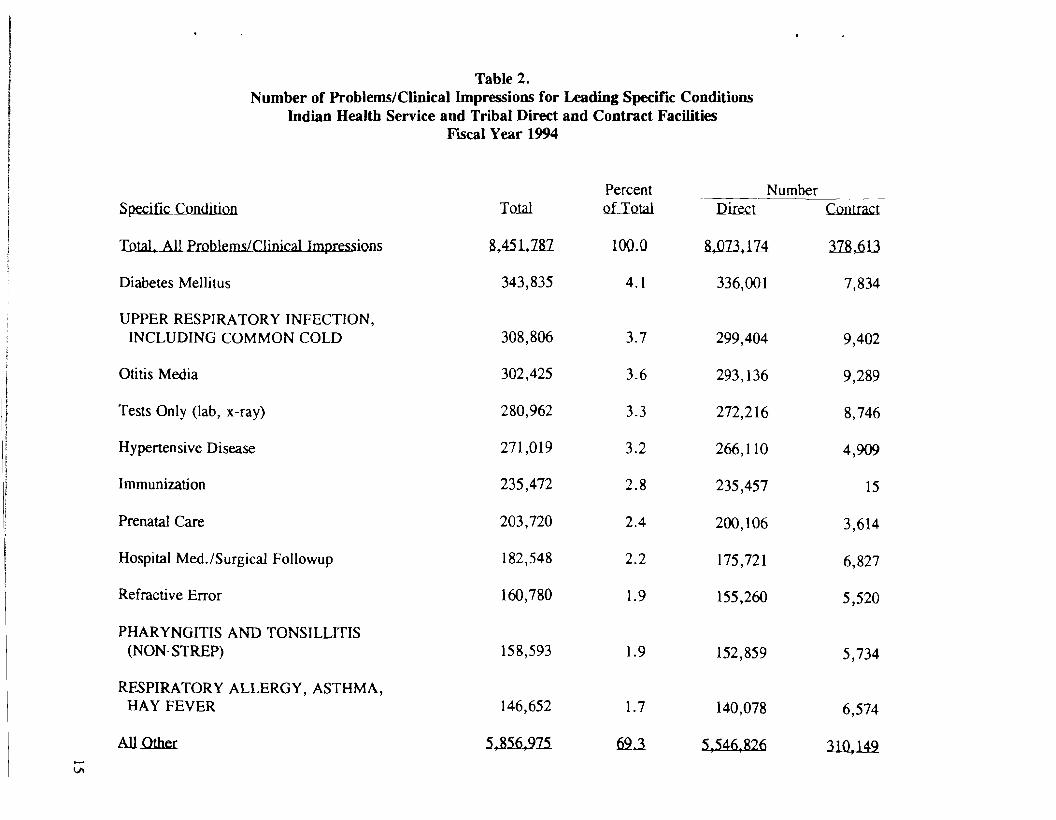
Table 2. Number of Problems/Clinical Impressions for Leading Specific Conditions
Indian Health Service and Tribal Direct and Contract Facilities
Specific Condition
Thtal. All Problems/Clinical Impressions
Diabetes Melli tus
UPPER RESPIRATORY INFECTION, INCLUDING COMMON COLD
Otitis Media
Tests Only (lab, x-ray)
Hypertensive Disease
Immunization
Prenatal Care
Hospital Med./Surgical Followup
Refractive Error
PHARYNGITIS AND TONSILLITIS (NON-STREP)
RESPIRATORY ALLERGY, ASTHMA, HAY FEVER
All Other
-V\
Fiscal Year 1994
ToW
8,451,787
343,835
308,806
302,425
280,962
271,019
235,472
203,720
182,548
160,780
158,593
146,652
5,856,975
Percent QLImal
lOOil
4.1
3.7
3.6
3.3
3.2
2.8
2.4
2.2
1.9
1.9
1.7
62.3
Number I2.irect CQntract
8,073,174 378,613
336,001 7,834
299,404 9,402
293,136 9,289
272,216 8,746
266,110 4,909
235,457 15
200,106 3,614
175,721 6,827
155,260 5,520
152,859 5,734
140,078 6,574
5,546,826 310,149
0\ Table 3. Number and Percentage Distributions of Clinical Impressions for Specific Respiratory System Diseases by Type (Direct, Contract) Indian Health Service and Tribal Direct and Contract Facilities
Fiscal Year 1994
Specific Condition Iillal Number
Direct Contract --_._--
I!Hal Percent
~ Contract Thtal Percent Diced
---~
Contract
Iotal, Respiratory System Diseases 961,245 922,646 18.i22 lOO..Q lOO..Q lOO.Q 1OO.Q 2M 4.0
Upper Respiratory Infection, Including Common Cold 308,806 299,404 9,402 32.1 32.5 24.4 100.0 97.0 3.0
Pharyngitis and Tonsillitis (Non-Strep) 158,593 152,859 5,734 16.5 16.6 14.9 100.0 %.4 3.6
Respiratory Allergy, Asthma, Hay Fever 146,652 140,078 6,574 153 15_2 17.0 100.0 95.5 4.5
Acute Bronchitis, Bronchiolitis 55,320 52,224 3,096 5.8 5.7 8.0 100_0 94.4 5.6
Pneumonia 33,951 31,911 2,040 3.5 3.5 5.3 100.0 94.0 6.0
Influenza 14,268 13,311 957 1.5 1.4 2.5 100.0 93.3 6.7
Chronic Bronchitis, Emphysema 8,945 8,273 672 0.9 0.9 1.7 100.0 92.5 7.5
All Other 234.110 lli~ H4124 24.4 24~3 ~ lQQ.Q 9D 4.3
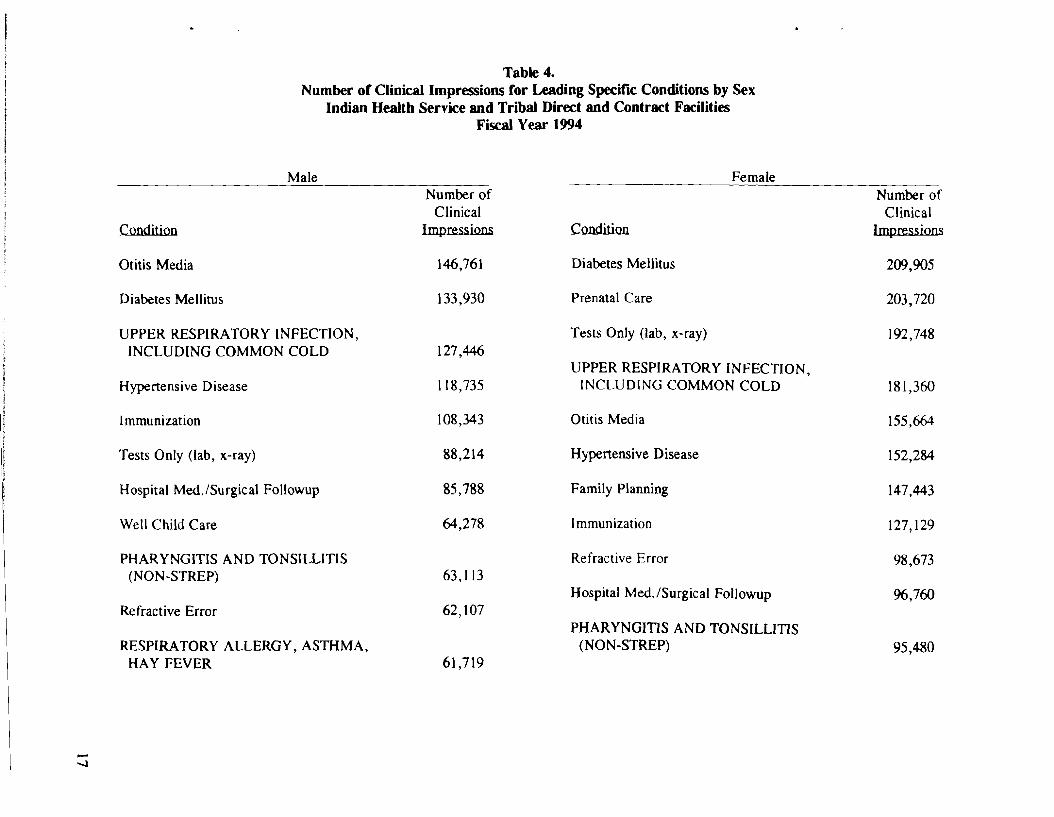
Table 4. Number of Clinical Impressions for Leading Specific Conditions by Sex
Indian Health Service and Tribal Direct and Contract Facilities Fiscal Year 1994
Male Female Number of Number of
Clinical Clinical Condition Impressions Condition Impressions
Otitis Media 146,761 Diabetes Mellitus 209,905
Diabetes Mellitus 133,930 Prenatal Care 203,720
UPPER RESPIRATORY INFECTION, Tests Only (lab, x-ray) 192,748 INCLUDING COMMON COLD 127,446
UPPER RESPIRATORY INFECTION, Hypertensive Disease 118,735 INCLUDING COMMON COLD 181,360
Immunization 108,343 Otitis Media 155,664
Tests Only (lab, x-ray) 88,214 Hypertensive Disease 152,284
Hospital Med.lSurgical Followup 85,788 Family Planning 147,443
Well Child Care 64,278 Immunization 127,129
PHARYNGITIS AND TONSILLITIS Refractive Error 98,673 (NON-STREP) 63,113
Hospital Med./Surgical Followup 96,7fIJ Refractive Error 62,107
PHARYNGITIS AND TONSILLITIS RESPIRATORY ALLERGY, ASTHMA, (NON-STREP) 95,480
HAY FEVER 61,719
--..,J
00 Table S.
Number and Percentage Distributions of Clinical Impressions for Specific Respiratory System DiseBses by Sex
Indian Health Service and Tribal Direct and Contract Facilities Fiscal Year 1994
Specific Condition Iillal Number Male Female Thtal
Percent Mak &male llial
Percent Male &male.
Total 961,243 394,162 5&081 lOO.Q lOOJ} 100..0 lOOJl 4LQ 5~.O
Upper Respiratory Infection, Including Common Cold 308,806 127,446 181,360 32.1 32.3 32.0 100.0 41.3 58.7
Pharyngitis and Tonsillitis (Non-Strep) 158,593 63,113 95,480 16.5 16.0 16.8 100.0 39.8 60.2
Respiratory Allergy, Asthma, Hay Fever 146,652 61,719 84,933 15.3 15.7 15.0 100.0 42.1 57.9
Acute Bronchitis, Bronchiolitis 55,320 24,458 30,862 5.8 6.2 5.4 100.0 44.2 55.8
Pneumonia 33,951 16,997 16,954 3.5 4.3 3.0 100.0 50.1 49.9
Influenza 14,268 6,043 8,225 1.5 1.5 1.5 100.0 42.4 57.6
Chronic Bronchitis, Emphysema 8,945 4,477 4,468 0.9 1.1 0.8 100.0 50.1 49.9
All Other 234,708 89,909 144,799 24.4 22.8 25.5 100.0 38.3 61.7
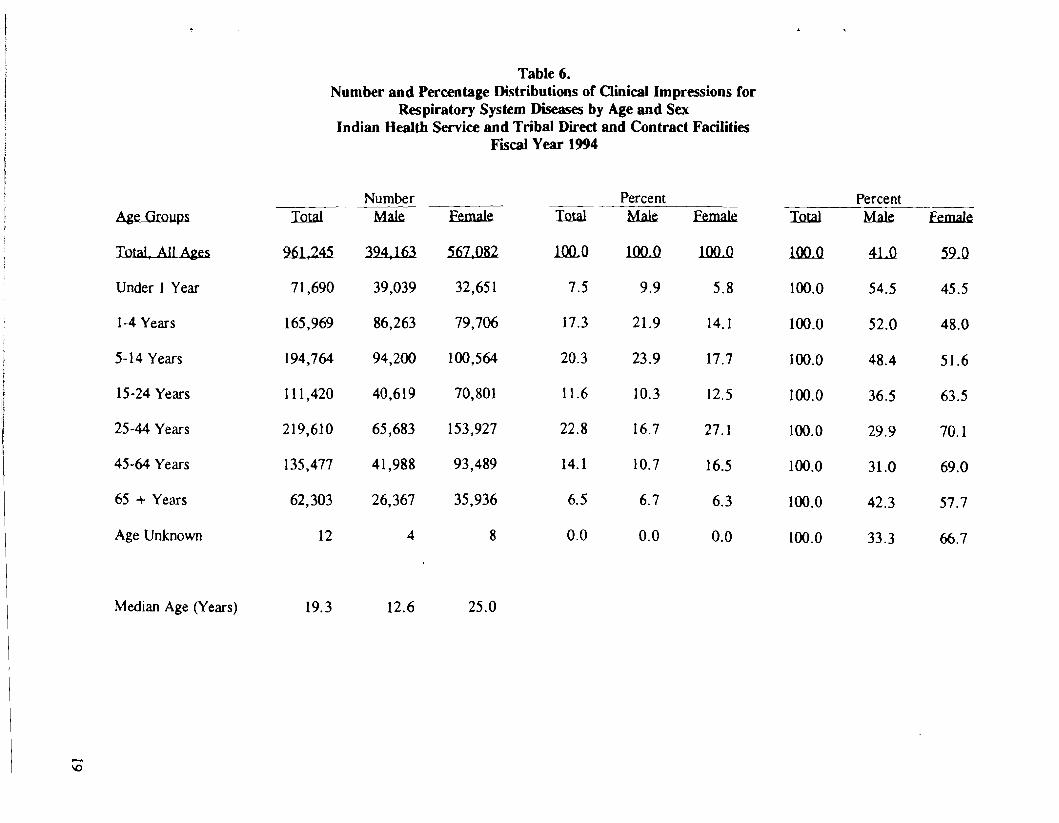
Table 6. Number and Percentage Distributions of Clinical Impressions for
Respiratory System Diseases by Age and Sex Indian Health Service and Tribal Direct and Contract Facilities
Fiscal Year 1994
Number -- Percent Percent -- Age Groups Iotal Male female Iotal Male Female Iotal Male Female
Iotal, AU Ages 961,245 394,163 567,082 lOOJ} lOOJl 1OO.Jl 1OO.Jl ~ 59J}
Under 1 Year 71 ,690 39,039 32,651 7.5 9.9 5.8 100.0 54.5 45.5
1-4 Years 165,969 86,263 79,706 17.3 21.9 14.1 100.0 52.0 48.0
5-14 Years 194,764 94,200 100,564 20.3 23.9 17.7 100.0 48.4 51.6
15-24 Years 111,420 40,619 70,801 11.6 10.3 12.5 100.0 36.5 63.5
25-44 Years 219,610 65,683 153,927 22.8 16.7 27.1 100.0 29.9 70.1
45-64 Years 135,477 41,988 93,489 14.1 10.7 16.5 100.0 31.0 69.0
65 + Years 62,303 26,367 35,936 6.5 6.7 6.3 100.0 42.3 57.7
Age Unknown 12 4 8 0.0 0.0 0.0 100.0 33.3 66.7
Median Age (Years) 19.3 12.6 25.0
-\l:)
N o Table 7.
Number and Percentage Distributions of Clinical Impressions for Upper Respiratory Infection, Including Common Cold, by Age and Sex
Indian Health Service and Tribal Direct and Contract Facilities Fiscal Year 1994
Age Groups Iotal Number
Male female Iotal Percent Male Female Iotal
Percent Male Female
Total, All Ages 308,806 127,446 181,360 lOO..Q 100Jl lQOj} lOO..Q ~ 5U
Under 1 Year 38,877 20,059 18,818 12.6 15.7 10.4 100.0 51.6 48.4
1-4 Years 81,492 40,972 40,520 26.4 32.1 22.3 100.0 50.3 49.7
5-14 Years 62,644 29,096 33,548 20.3 22.8 18.5 100.0 46.4 53.6
15-24 Years 31,257 10,263 20,994 10.1 8.1 11.6 100.0 32.8 67.2
25-44 Years 56,395 15,848 40,547 18.3 12.4 22.4 100.0 28.1 71.9
45-64 Years 28,220 8,044 20,176 9.1 6.3 11.1 100.0 28.5 71.5
65 + Years 9,919 3,163 6,756 3.2 2.5 3.7 100.0 31.9 68.1
Age Unknown 2 1 1 0.0 0.0 0.0 100.0 50.0 50.0
Median Age (Years) 10.4 5.9 14.3
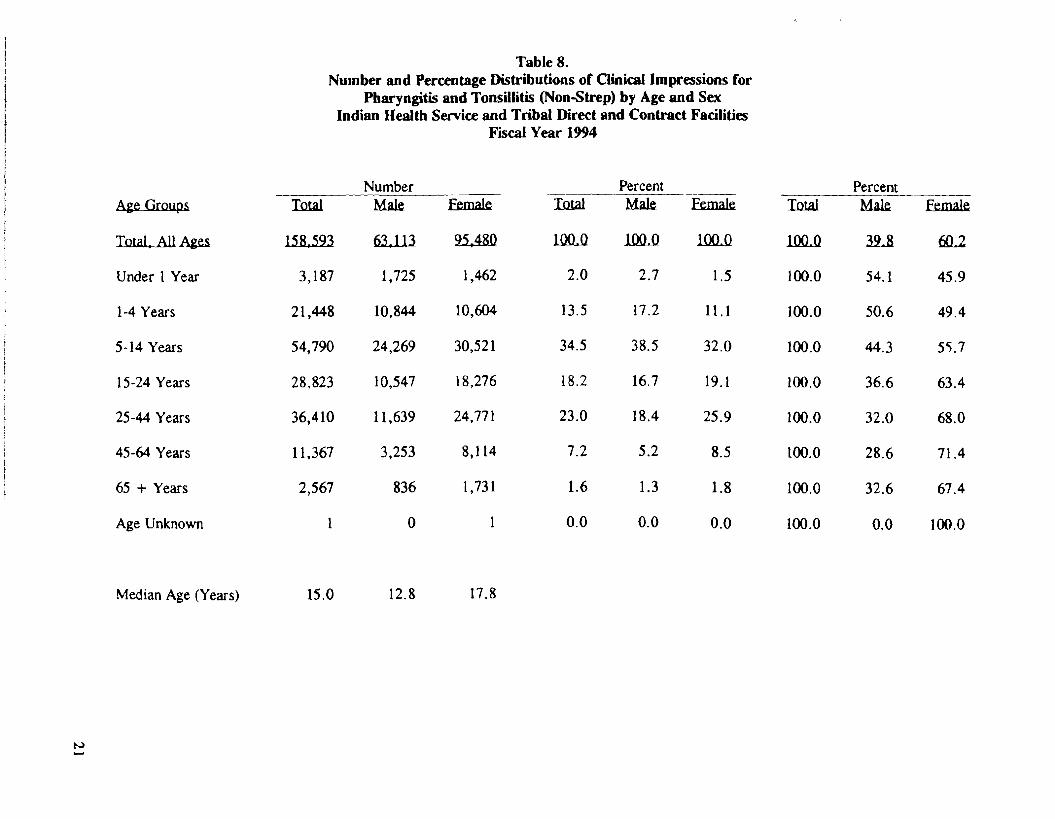
Table 8. Number and Percentage Distributions of Clinical Impressions for
Pharyngitis and Tonsillitis (Non-Strep) by Age and Sex Indian Health Service and Tribal Direct and Contract Facilities
Fiscal Year 1994
Number Percent Percent Age Groups Total Male Female Total Male Female Total Male Female
Total, All Ages 158,593 63,113 95,480 lOOJl .lOOll l.QQj} lOO.Jl 3tl 602
Under 1 Year 3,187 1,725 1,462 2.0 2.7 1.5 100.0 54.1 45.9
1-4 Years 21,448 10,844 10,604 13.5 17.2 11.1 100.0 50.6 49.4
5-14 Years 54,790 24,269 30,521 34.5 38.5 32.0 100.0 44.3 5'>.7
15-24 Years 28,823 10,547 18,276 18.2 16.7 19.1 100.0 36.6 63.4
25-44 Years 36,410 11,639 24,771 23.0 18.4 25.9 100.0 32.0 68.0
45-64 Years 11,367 3,253 8,114 7.2 5.2 8.5 100.0 28.6 71.4
65 + Years 2,567 836 1,731 1.6 1.3 1.8 100.0 32.6 67.4
Age Unknown 1 0 1 0.0 0.0 0.0 100.0 0.0 100.0
Median Age (Years) 15.0 12.8 17.8
N
N N Table 9.
Number and Percentage Distributions of Clinical Impressions for Respiratory Allergy, Asthma, and Hay Fever, by Age and Sex
Indian Health Service and Tribal Direct and Contract Facilities Fiscal Year 1994
Age Groups Io1al Number Male Female Thtal
Percent Male female Iotal
Percent Male Female
Total, All Ages 146.652 61.719 84,933 lQQJ} lOOJl lOOJ} 1OOJ) 42..l 5l.2
Under 1 Year 5,061 3,186 1,875 3.5 5.2 2.2 100.0 63.0 37.0
1-4 Years 16,310 9,732 6,578 11.1 15.8 7.7 100.0 59.7 40.3
5-14 Years 31,545 17,994 13,551 21.5 29.2 16.0 100.0 57.0 43.0
15-24 Years 18,185 7,711 10,474 12.4 12.5 12.3 100.0 42.4 57.6
25-44 Years 38,582 11,207 27,375 26.3 18.2 32.2 100.0 29.0 71.0
45-64 Years 27,547 8,284 19,263 18.8 13.4 22.7 100.0 30.1 69.9
65 + Years 9,422 3,605 5,817 6.4 5.8 6.8 100.0 38.3 61.7
Age Unknown 0 0 0 0.0 0.0 0.0
Median Age (Years) 26.2 15.0 32.3

•