superintendent’s 2012-13 proposed13 proposed … general...•feb 17 – governors budget proposed...
TRANSCRIPT

Superintendent’s 2012 13 Proposed Budget
Superintendent’s 2012 13 Proposed Budget2012-13 Proposed Budget
Recommendation2012-13 Proposed Budget
Recommendation
March 13 2012March 13 2012March 13, 2012 March 13, 2012
2011-12 Budget Reflections
2

2011-12 Budget Timeline•Nov 19 – Board of Education Budget kick-off worksession
•Jan 11 – Budget reduction recommendation presented to Board of Education
•Jan 19 – Budget reduction recommendation presented to BOCC
•Feb 17 – Governors Budget proposed a 4.4% net reduction in Public Schools’ budget (not including cost transfer for tort claims,replacement buses, and workers comp)
•Mar 8 – Joint Appropriations Subcommittee on Education prepared a 19.3% worst case reduction scenario
•Mar 22 – Board of Education Budget worksession
•Apr 12 – Superintendent’s Budget Recommendation presentation
•May 1 – Deadline for notifying administrators of superintendent’s intent to non-renew contracts
•May 4 – House Budget proposed a 9.6% net reduction in Public Schools’ budget
•May 10 – BOE's 2011-12 proposed budget approved with $101 million total reductions including an 11% state cut
•May 15 – Deadline for notifying teachers of superintendent’s intent to non-renew
•May 15 – Deadline for Board of Education to submit budget request to county•May 15 – Deadline for Board of Education to submit budget request to county
•May 17 – County Manager’s Recommended Operating and Capital Budgets presented to BOCC
•May 24 – Board of Education presented budget proposal to BOCC
•May 31 – Senate Budget proposed a 5.8% net reduction in Public Schools’ budget
•June 1 – Deadline for notifying administrators of non-renewal
•June 7 – FY2011-12 County Operating Budget and 3-year CIP adopted
•June 15 – Deadline for notifying teachers of non-renewal
•June 15 – State budget finalized including a 5.8% net reduction in public schools budget
3
•July 5 – DPI to provided allotments to LEA's - CMS now able to compute exact impact

Positive Impacts of 2011-12 State and County Funding (as approved June 2011)
Final approved budgets from our two primary funding sources had a positive impact on our budget plan. As a result, we are making several adjustments to our proposed budget including –
– Reinstate Tier 4 reductions from the 2011-12 Proposed Budget as well as a few items in Tier 3
– Reinstate Tier 5 reductions from the 2010-11 Budget as well as some critical items in Tier 3
– Permanently fund the ARRA cliff and use one time funding for critical projects
– Prepare for projected increase in the discretionary reduction in next year’s b dbudget
4

Spring 2011: 2011-12 Proposed Budget: Plan was to use the EduJobs
Preparation for the EduJobs Funding Cliffp g p g
funding to delay the remainder of Federal ARRA cliff until 2012-13*Federal ARRA
(expired)Custodial and
Federal EduJobsCustodial and
LocalCustodial and Custodial and
Clerical Positions Clerical Positions Clerical Positions
Summer 2011: 2011-12 Adopted Budget: State funding was higher than anticipated – prepared to permanently fund EduJobs
Created local funding for one year to use for
tig p p p p y
cliff
State Federal EduJobs Local
one-time projects
StateCustodial and
Clerical Positions
Federal EduJobsCustodial and
Clerical Positions
• Technology• Deferred maintenance• Move management
Spring 2012: 2012-13 Proposed Budget: ProposedSpring 2012: 2012 13 Proposed Budget: Proposed budget without Edu Jobs funding
StateCustodial and
Local Custodial and
Federal EduJobs (expired)
Clerical PositionsCustodial and
Clerical Positions
* Federal ARRA Stabilization funds
Custodial and Clerical Positions
Permanently funds EduJobs cliff5
Superintendent’s 2012-13 Proposed BudgetProposed Budget
6

Key Highlights
f f f• After four consecutive years of multimillion-dollar cuts and redirections within our budget (more than $212 million since FY 2009), CMS is at a critical juncture. We do not want to lose ground we have worked so hard to gain so we must begin rebuilding in core areas to prevent declines in our academic progress
• CMS continues to absorb increases in operating costs such as utilities and employee benefits – costs we do not control but must pay – which reduces the amount we can spend on each student
• CMS is continuing to optimize resources and identify efficiency savings as well as budget cuts and redirections ($23.3 million for 2012-13) to help cover rising costs and anticipated state cuts
• Strategically planning ahead for the EduJobs funding cliff coming in 2012-13 prevented the need for a reduction in force or other unplanned cuts
7

Key Highlights (cont)
• Recruitment and retention of highly effective staff is critical to help us move• Recruitment and retention of highly effective staff is critical to help us move academic achievement forward, thus this budget includes a 3% cost of living increase for our staff who have continued to deliver strong results while not receiving a salary adjustment in nearly four years (seeking increased funding from the county for 2% of that cost – less any amount the state may provide)
• CMS is also seeking money from the county to help us pay for some of the costs of sustaining operations, including a cost of living increase, as well as growth – increases consistent with those areas the county is planning to fund in their 2012 13 budgettheir 2012-13 budget
• If the county fully funds our request of $355.9 million, CMS would receive only $4.5 million more than the highest ever county funding level reached in 2008-09 but would be almost $400 per pupil less than the 2008 09 per pupil county09, but would be almost $400 per pupil less than the 2008-09 per pupil county funding level due to enrollment growth
• The budget proposal is based on the best information we have at this time and is subject to change based on final approved funding from all sourcesis subject to change based on final approved funding from all sources
8
Key Highlights (cont)
• CMS will continue to align our resources with the BOE’s Theory of Action, Core Beliefs, and SP2014 goals including those strategies that have helped us increase academic achievement, close the gap, and improve the graduation rate
• CMS hopes the citizens of Mecklenburg County will recognize the value of an outstanding school district and the importance of that on the economic development in our area and will actively support our funding requestp y pp g q
9

What is the financial investment needed for nextinvestment needed for next
year?y
10
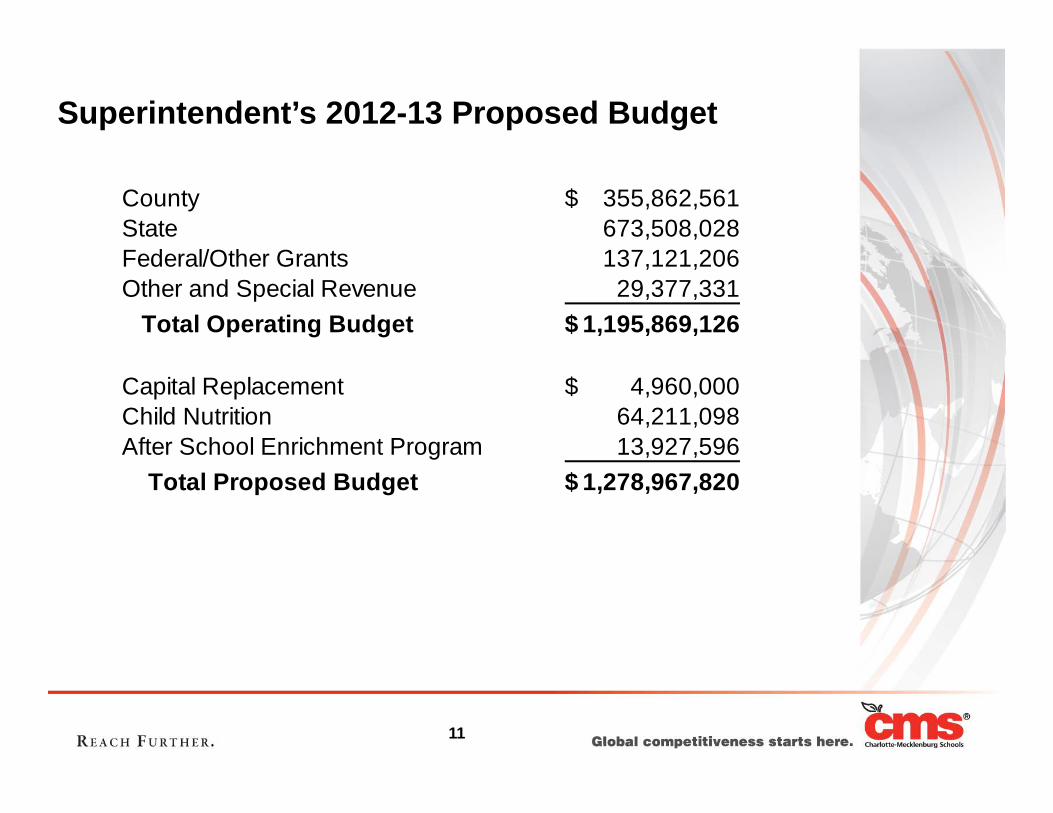
Superintendent’s 2012-13 Proposed Budget
County 355,862,561$ State 673,508,028 F d l/Oth G t 137 121 206Federal/Other Grants 137,121,206 Other and Special Revenue 29,377,331 Total Operating Budget 1,195,869,126$
Capital Replacement 4,960,000$ Child Nutrition 64,211,098 After School Enrichment Program 13,927,596 g , , Total Proposed Budget 1,278,967,820$
11

Comparison to Prior Year
2012-13 Proposed Operating Budget* 1,195,869,126$
2011-12 Adopted Operating Budget* 1,169,398,626$
Increase 26,470,500$
% Change 2 3%% Change 2.3%
* Operating Budget only – does not include Capital or Enterprise Funds
12

Superintendent’s 2012-13 Proposed Budget*SOURCESSOURCES
$355.9 – (30%)
$29.4M - (2%)
$673.5M - 56%$137.1M - 12%
State Federal and Other Grants
County Other and Special Revenue
* O ti B d t l d t i l d C it l E t i F d* Operating Budget only – does not include Capital or Enterprise Funds
13

Superintendent’s 2012-13 Proposed Budget*USESUSES
$120 2M - 10%
$58.6M - 5%
$1.6M - (<1%)
$20.3M - 2%
$120.2M - 10%
$743.4M - 62% $251.8M - 21%
Salaries Benefits Purchased Services
Supplies and Materials Furniture and Equipment Other
* Operating Budget only does not include Capital or Enterprise Funds Operating Budget only – does not include Capital or Enterprise Funds
14

Superintendent’s 2012-13 Proposed Budget*
$98.5M – 8%$113.9M - 10%
$983.5M - 82%
Central Office Schools Support - Schools
* Operating Budget only does not include Capital or Enterprise Funds* Operating Budget only – does not include Capital or Enterprise Funds
15

Proposed Budget Reductions and Redirections
County Reductions and Redirections
Adjust bell schedules 624,150$Adjust bell schedules 624,150$
Reduce utilities consumption 1,143,758
Reduce Central Office - salary and benefits 937,523
Reduce Central Office - contracted services 248,623Reduce Central Office contracted services 248,623
Reduce Central Office - supplies 195,735
Reduce contracted legal fees 163,424
Eliminate leased space cost 518,650Eliminate leased space cost 518,650
Eliminate contracted staff for opening schools info lines 150,000
Transportation efficiency savings 1,545,300
Adjust budgeted average salary 3,891,984 djust budgeted a e age sa a y 3,89 ,98
SUBTOTAL 9,419,147$
16
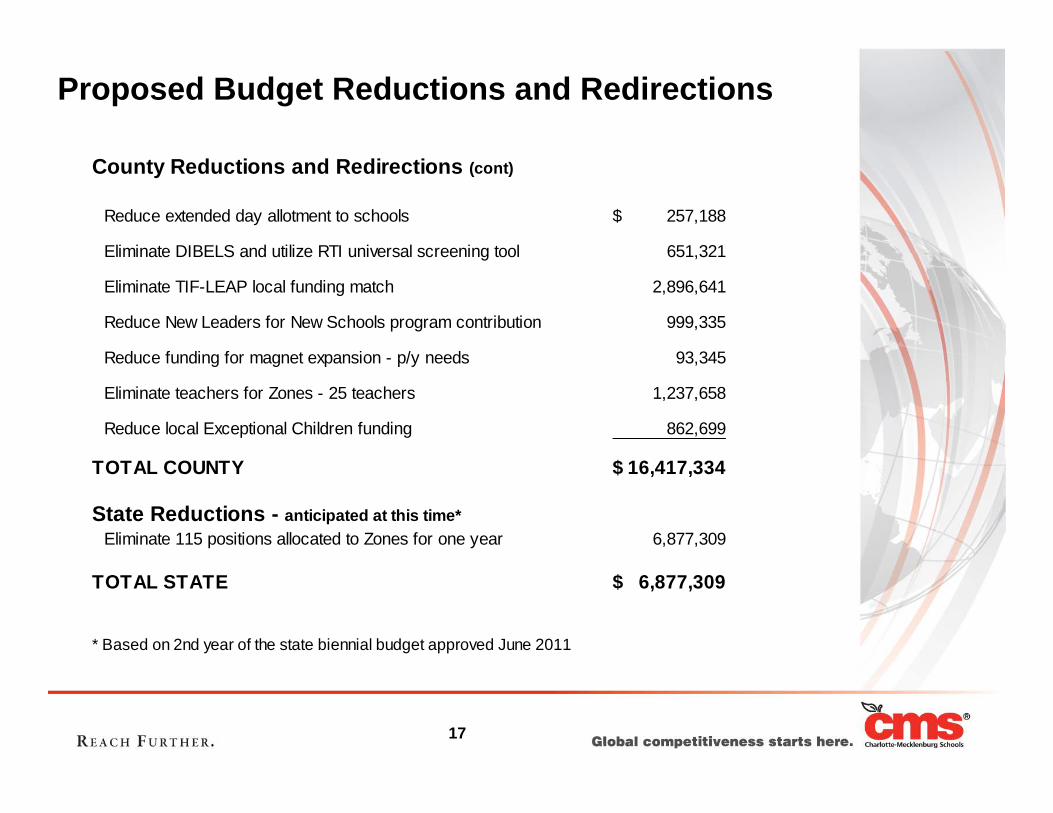
Proposed Budget Reductions and Redirections
County Reductions and Redirections (cont)
Reduce extended day allotment to schools 257,188$
Eliminate DIBELS and utilize RTI universal screening tool 651 321Eliminate DIBELS and utilize RTI universal screening tool 651,321
Eliminate TIF-LEAP local funding match 2,896,641
Reduce New Leaders for New Schools program contribution 999,335
Reduce funding for magnet expansion p/y needs 93 345Reduce funding for magnet expansion - p/y needs 93,345
Eliminate teachers for Zones - 25 teachers 1,237,658
Reduce local Exceptional Children funding 862,699
TOTAL COUNTY 16,417,334$
State Reductions - anticipated at this time*Eliminate 115 positions allocated to Zones for one year 6,877,309
TOTAL STATE 6,877,309$
* Based on 2nd year of the state biennial budget approved June 2011
17

Proposed Budget Reductions and Redirections2012-13
State & LocalState & Local Budgeted Total
Budget Total Positions* PositionsArea FY2011-2012 Reductions FY2011-2012 Reduced
% of Area Budget (State & Local)
% of Area Budget (State & Local)
Central Office 83,250,446 (2,289,434) (2.8%) 854 (12) (1.4%)Support 91,416,047 (3,118,954) (3.4%) 1,453 - 0.0%Schools 816,004,011 (17,886,255) (2.2%) 13,013 (148) (1.1%)Total 990,670,504 (23,294,643) (2.4%) 15,320 (160) (1.0%)
County Total 16,417,334$
State Total 6,877,309
TOTAL REDUCTIONS AND REDIRECTIONS 23,294,643$
18
*Totals do not include Federal, Other, Child Nutrition, or ASEP positions
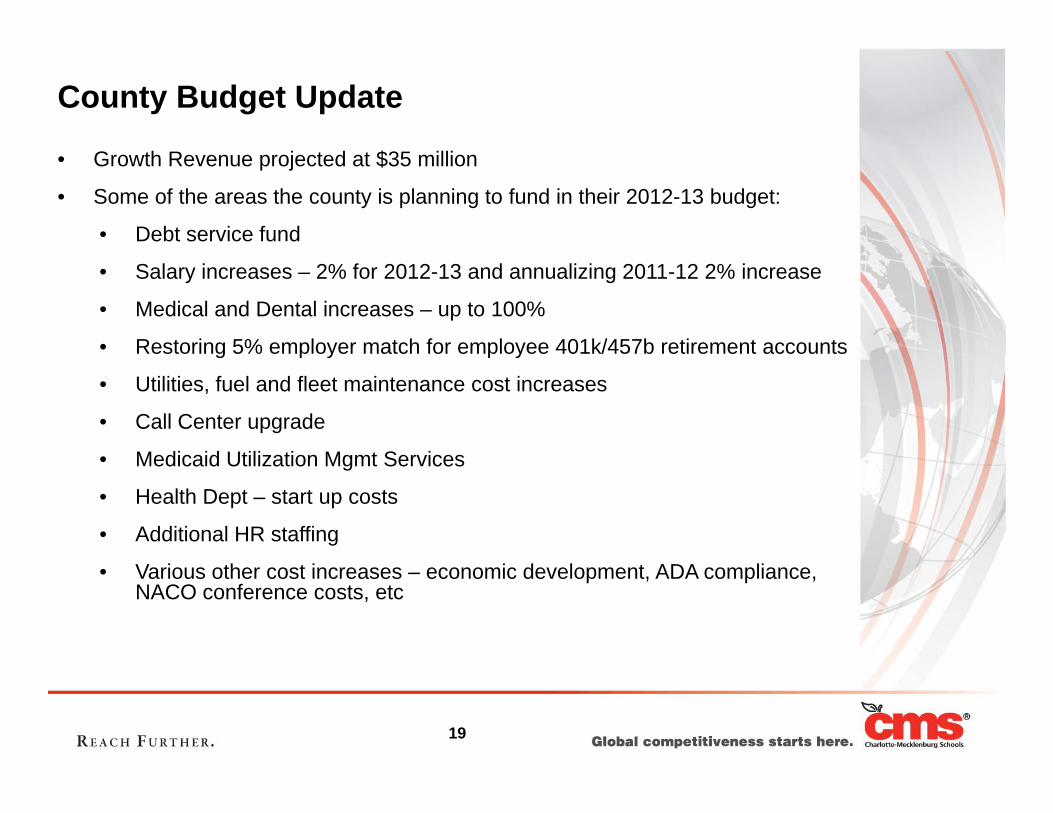
County Budget Update
$• Growth Revenue projected at $35 million
• Some of the areas the county is planning to fund in their 2012-13 budget:
• Debt service fund
• Salary increases – 2% for 2012-13 and annualizing 2011-12 2% increase
• Medical and Dental increases – up to 100%
• Restoring 5% employer match for employee 401k/457b retirement accountsg p y p y
• Utilities, fuel and fleet maintenance cost increases
• Call Center upgrade
• Medicaid Utilization Mgmt Services• Medicaid Utilization Mgmt Services
• Health Dept – start up costs
• Additional HR staffing
• Various other cost increases – economic development, ADA compliance, NACO conference costs, etc
19

Factors Increasing the 2012-13 Proposed Budget
SUSTAINING OPERATIONS
Salaries and Benefits County Total
1% Cost of Living Increase (funded from redirections) 7,480,112$ 8,169,884$1% Cost of Living Increase (funded from redirections) 7,480,112$ 8,169,884$ Additional 2% Cost of Living Increase and Market Adjustment 18,555,613 19,935,157 Estimated Health Insurance Increase - 5.3% ($4,931 to $5,192) 720,477 4,309,739 Estimated Retirement Rate Increase - (13.12% to 14.31%) 2,053,116 8,204,920
Program ContinuationProgram ContinuationCMPD School Resource Officer Contract Increase 2,078,728$ 2,078,728$ Utilities Rate Increase 1,838,100 1,838,100 Charter School Rate Adjustment 1,121,122 1,121,122 Response to Intervention (RTI) - Universal Screening Tool 645,362 645,362 Communities in Schools - Cost Model Adjustment 71,669 71,669 j , ,Project L.I.F.T. Support 205,364 4,255,383 Insurance Increase 108,771 108,771 Deferred Maintenance - 9,000,000 Mobile Unit Movement - 1,800,000 Common Core Support - 3,722,104
Total Sustaining Operations 34,878,434$ 65,260,939$
Shaded areas represent items consistent with those areas the county is planning to fund in their 2012-13 budget
20
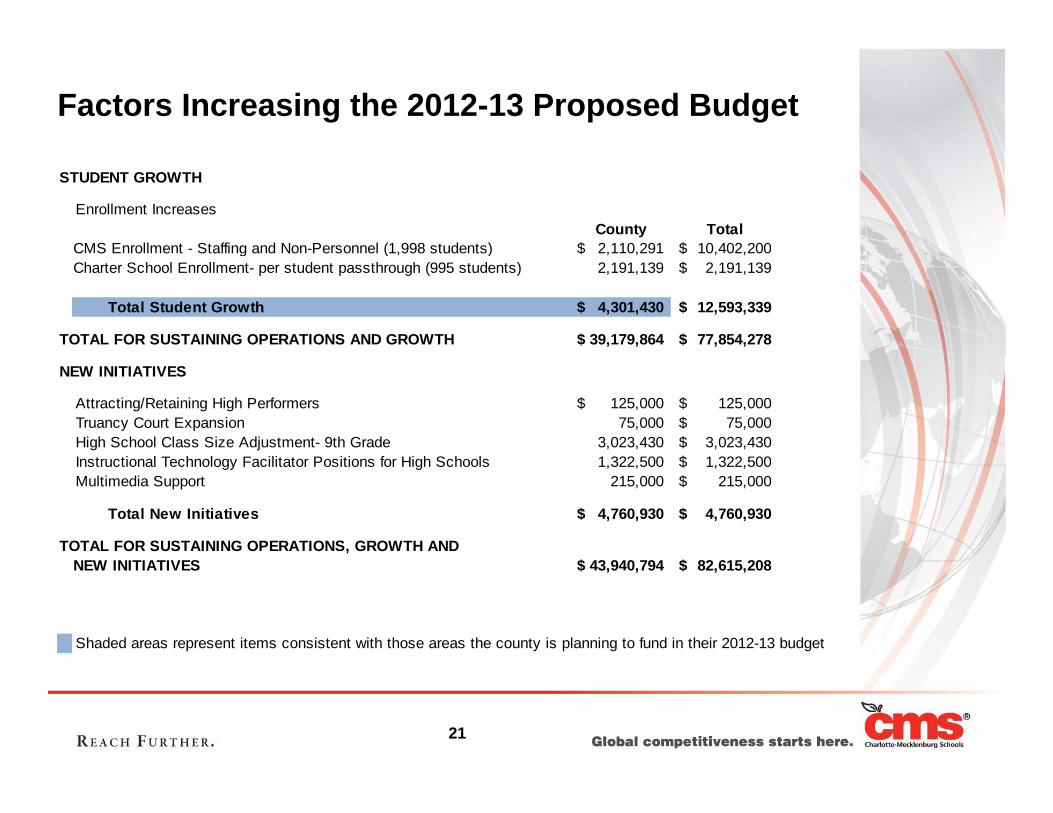
Factors Increasing the 2012-13 Proposed Budget
STUDENT GROWTH
Enrollment IncreasesCounty Total
CMS Enrollment - Staffing and Non-Personnel (1,998 students) 2,110,291$ 10,402,200$CMS Enrollment Staffing and Non Personnel (1,998 students) 2,110,291$ 10,402,200$ Charter School Enrollment- per student passthrough (995 students) 2,191,139 2,191,139$
Total Student Growth 4,301,430$ 12,593,339$
39,179,864$ 77,854,278$ TOTAL FOR SUSTAINING OPERATIONS AND GROWTH
NEW INITIATIVES
Attracting/Retaining High Performers 125,000$ 125,000$ Truancy Court Expansion 75,000 75,000$ High School Class Size Adjustment- 9th Grade 3,023,430 3,023,430$ I t ti l T h l F ilit t P iti f Hi h S h l 1 322 500 1 322 500$Instructional Technology Facilitator Positions for High Schools 1,322,500 1,322,500$ Multimedia Support 215,000 215,000$
Total New Initiatives 4,760,930$ 4,760,930$
43 940 794$ 82 615 208$TOTAL FOR SUSTAINING OPERATIONS, GROWTH AND
NEW INITIATIVES 43,940,794$ 82,615,208$
Shaded areas represent items consistent with those areas the county is planning to fund in their 2012-13 budget
NEW INITIATIVES
21

Superintendent’s Recommendation for 2012-13 County Budget Request
2011-12 Base Budget $ 328,339,101
Redirections/Reductions (16,417,334)
Sustaining Operations 34,878,434 Student Growth 4,301,430 Program Expansion and New Initiatives 4,760,930
Total Needed for Sustaining, Growth, and New Initiatives 43,940,794
Increase Requested from County $ 27,523,460
2012-13 County Budget Request $ 355,862,561
22
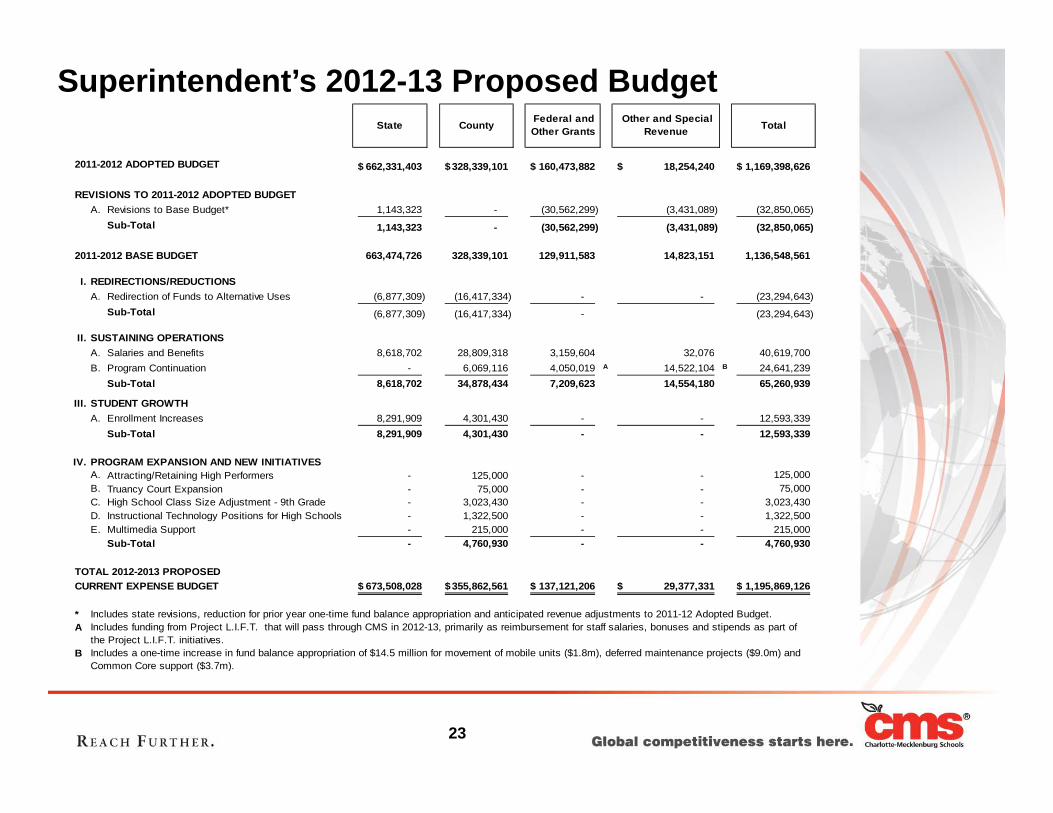
Superintendent’s 2012-13 Proposed BudgetState County Federal and
Other Grants Other and Special
Revenue Total
2011-2012 ADOPTED BUDGET 662,331,403$ 328,339,101$ 160,473,882$ 18,254,240$ 1,169,398,626$
REVISIONS TO 2011-2012 ADOPTED BUDGETA. Revisions to Base Budget* 1,143,323 - (30,562,299) (3,431,089) (32,850,065)
Sub-Total 1,143,323 - (30,562,299) (3,431,089) (32,850,065)
2011 2012 BASE BUDGET 663 474 726 328 339 101 129 911 583 14 823 151 1 136 548 5612011-2012 BASE BUDGET 663,474,726 328,339,101 129,911,583 14,823,151 1,136,548,561
I. REDIRECTIONS/REDUCTIONSA. Redirection of Funds to Alternative Uses (6,877,309) (16,417,334) - - (23,294,643)
Sub-Total (6,877,309) (16,417,334) - (23,294,643)
II. SUSTAINING OPERATIONSA. Salaries and Benefits 8,618,702 28,809,318 3,159,604 32,076 40,619,700A. Salaries and Benefits 8,618,702 28,809,318 3,159,604 32,076 40,619,700 B. Program Continuation - 6,069,116 4,050,019 A 14,522,104 B 24,641,239
Sub-Total 8,618,702 34,878,434 7,209,623 14,554,180 65,260,939
III. STUDENT GROWTHA. Enrollment Increases 8,291,909 4,301,430 - - 12,593,339
Sub-Total 8,291,909 4,301,430 - - 12,593,339
IV. PROGRAM EXPANSION AND NEW INITIATIVESA. Attracting/Retaining High Performers - 125,000 - - 125,000 B. Truancy Court Expansion - 75,000 - - 75,000 C. High School Class Size Adjustment - 9th Grade - 3,023,430 - - 3,023,430 D. Instructional Technology Positions for High Schools - 1,322,500 - - 1,322,500 E. Multimedia Support - 215,000 - - 215,000
Sub-Total - 4,760,930 - - 4,760,930
TOTAL 2012-2013 PROPOSEDCURRENT EXPENSE BUDGET 673,508,028$ 355,862,561$ 137,121,206$ 29,377,331$ 1,195,869,126$
* Includes state revisions, reduction for prior year one-time fund balance appropriation and anticipated revenue adjustments to 2011-12 Adopted Budget.A Includes funding from Project L.I.F.T. that will pass through CMS in 2012-13, primarily as reimbursement for staff salaries, bonuses and stipends as part of
the Project L.I.F.T. initiatives.B Includes a one-time increase in fund balance appropriation of $14.5 million for movement of mobile units ($1.8m), deferred maintenance projects ($9.0m) and
C C t ($3 7 )
23
Common Core support ($3.7m).
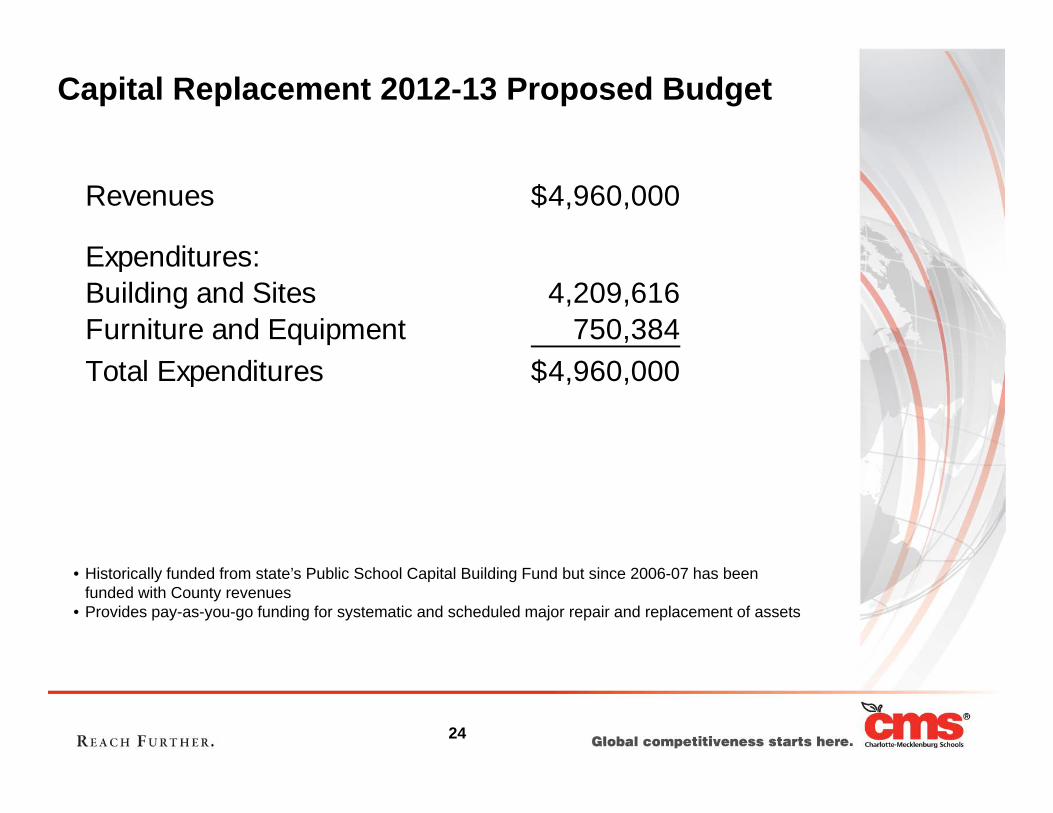
Capital Replacement 2012-13 Proposed Budget
Revenues 4,960,000$
Expenditures:Expenditures:Building and Sites 4,209,616 Furniture and Equipment 750,384 Total Expenditures 4,960,000$
• Historically funded from state’s Public School Capital Building Fund but since 2006-07 has been funded with County revenues
• Provides pay-as-you-go funding for systematic and scheduled major repair and replacement of assets
24

Child Nutrition 2012-13 Proposed Budget
Operating Revenues 18,324,519$ Operating Expenses 64 211 098Operating Expenses 64,211,098 Operating Income (Loss) (45,886,579)$ Non-operating RevenuesU S Government Subsidy and Commodities 45 210 311$U.S. Government Subsidy and Commodities 45,210,311$ Interest Revenue and Other Misc. Revenue 159,453 Transfer from General Fund 516,815
Net Income -$Net Income -$
• Child Nutrition serves more than 30,000 breakfasts and 80,000 lunches per day• The lunch price will increase by 5 cents per meal in 2012-13 to comply with federal law
25
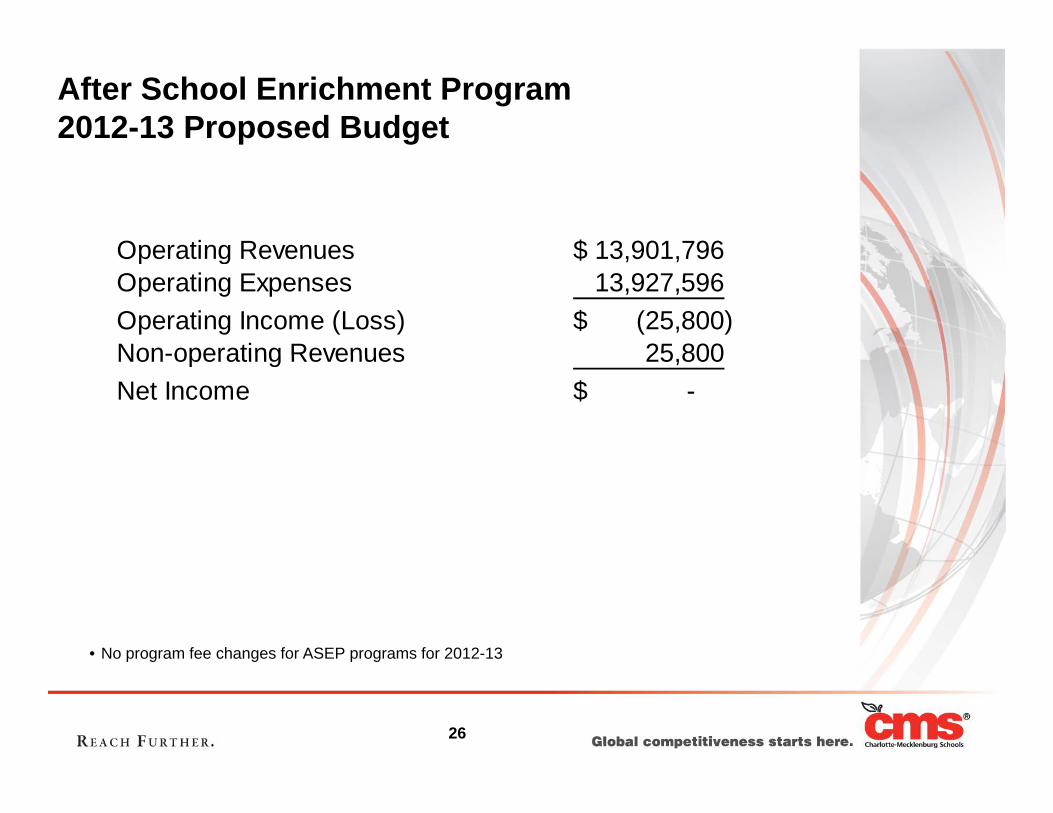
After School Enrichment Program 2012-13 Proposed Budget
Operating Revenues 13 901 796$Operating Revenues 13,901,796$ Operating Expenses 13,927,596 Operating Income (Loss) (25,800)$ Non-operating Revenues 25 800Non-operating Revenues 25,800 Net Income -$
• No program fee changes for ASEP programs for 2012-13
26

What factors and data did we consider?we consider?
27

Framework for Budget Development
Ali t t St t i Pl 2014• Align resources to support Strategic Plan 2014
• Keep strong academic focus coupled with data driven decision making
• Recognize and plan for the impact of the economic environment and employ sound fiscal management
A k l d t i t di t d f di l l f ll• Acknowledge uncertainty regarding expected funding levels from all sources, but use best information available to prepare plan
• Identify efficiency savings as well as reductions and resource di ti t ff t i i tredirections to offset rising costs
• Request funding from County for some sustaining operations cost increases (including cost of living increase and to cover student growth
t )costs)
• Establish flexibility in the budget to allow for various reduction levels
28

2010-11 Per Pupil Expenditures
Per Pupil Expenditure Ranking2010 11 Per Pupil Expenditures
(per student in fall enrollment)
Rank State Per Pupil Rank State Per Pupil1 New York 17,750 42 Texas 8,751 2 New Jersey 17,717 43 Mississipi 8,713 3 Vermont 17,447 44 North Dakota 8,631 4 Alaska 16,744 45 North Carolina 8,572 5 W i 15 997 46 T 8 2135 Wyoming 15,997 46 Tennessee 8,213 6 Rhode Island 15,803 47 Idaho 8,101 7 Maryland 15,060 48 Nevada 8,089 8 Maine 15 032 49 Oklahoma 8 0588 Maine 15,032 49 Oklahoma 8,058 9 Connecticut 14,989 50 Utah 6,672 10 Massachussets 14,902 51 Arizona 6,448
National Average = $10,770
29
Source: National Education Association Research December 2011
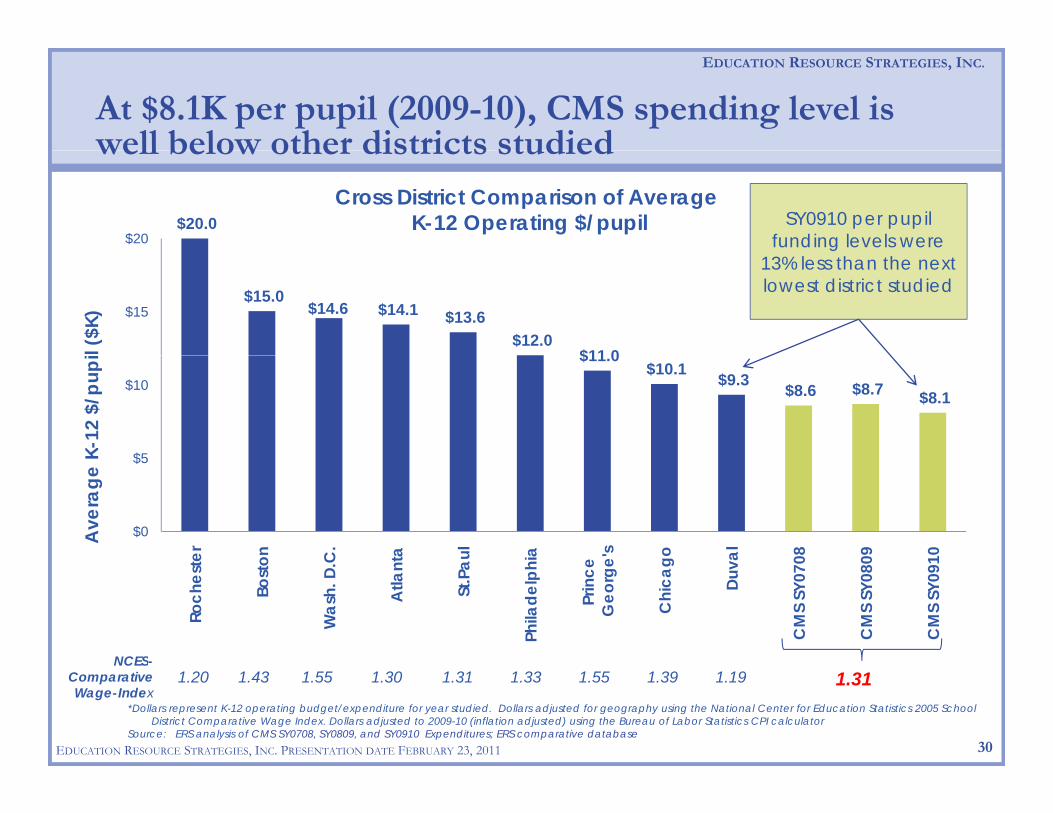
At $8.1K per pupil (2009-10), CMS spending level is well below other districts studied
EDUCATION RESOURCE STRATEGIES, INC.
well below other districts studied
$20.0 $20
Cross District Comparison of AverageK-12 Operating $/pupil SY0910 per pupil
funding levels were
$15.0 $14.6 $14.1 $13.6
$12.0 $11 0
$15
l ($K
)
13% less than the next lowest district studied
$11.0 $10.1 $9.3 $8.6 $8.7 $8.1
$5
$10
K-12
$/p
upi
$0
$5
er on C. ta ul ia e e's
go al 08 09 10
Ave
rage
K
NCES-
Roch
este
Bost
o
Was
h. D
.C
Atla
nt
St.P
a
Phila
delp
h
Prin
ceG
eorg
e
Chi
cag
Duv
CM
S SY
070
CM
S SY
080
CM
S SY
091
NCESComparativeWage-Index
1.20 1.43 1.55 1.30 1.31 1.33 1.55 1.39 1.19
30
*Dollars represent K-12 operating budget/expenditure for year studied. Dollars adjusted for geography using the National Center for Education Statistics 2005 School District Comparative Wage Index. Dollars adjusted to 2009-10 (inflation adjusted) using the Bureau of Labor Statistics CPI calculator
Source: ERS analysis of CMS SY0708, SY0809, and SY0910 Expenditures; ERS comparative database
1.31
EDUCATION RESOURCE STRATEGIES, INC. PRESENTATION DATE FEBRUARY 23, 2011
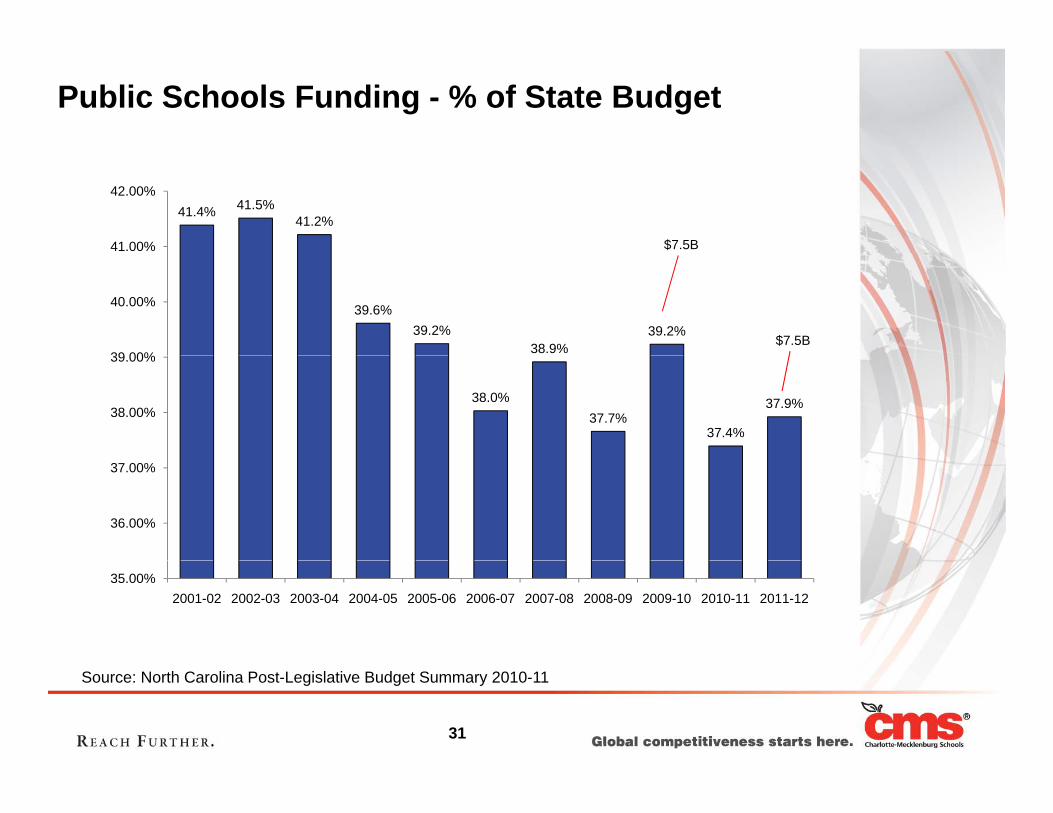
Public Schools Funding - % of State Budget
41.4% 41.5%41.2%
41.00%
42.00%
$7.5B
39.6%39.2%
38.9%39.2%
39 00%
40.00%
$7.5B
38.0%37.7%
37.4%
37.9%38.00%
39.00%
36.00%
37.00%
35.00%2001-02 2002-03 2003-04 2004-05 2005-06 2006-07 2007-08 2008-09 2009-10 2010-11 2011-12
31
Source: North Carolina Post-Legislative Budget Summary 2010-11

Public Schools Funding - % of County Revenues
0.0% 0.0% 0.0%0 0% 0 0% 0 6% 0.5% 0 5% 0 5% 0 5%45 0%
50.0%
7.8% 8.4% 9.0%9.5% 10.0% 9.6%
8.7%10.3%
11.3% 12.2% 11.8%
0.0% 0.0% 0.6%0.5%
0.5% 0.5% 0.5% 0.5%
30 0%
35.0%
40.0%
45.0%
37.2% 37.1% 35.6% 33.4% 33.2% 34.1% 33.1% 33.6% 31.8% 31.4% 31.8%15.0%
20.0%
25.0%
30.0%
0.0%
5.0%
10.0%
15.0%
2001-02 2002-03 2003-04 2004-05 2005-06 2006-07 2007-08 2008-09 2009-10 2010-11 2011-12
Operating Debt Services Capital Replacement
Note: Excludes fines and forfeitures
32
Note: Excludes fines and forfeituresSource: Mecklenburg County Adopted Budget Book
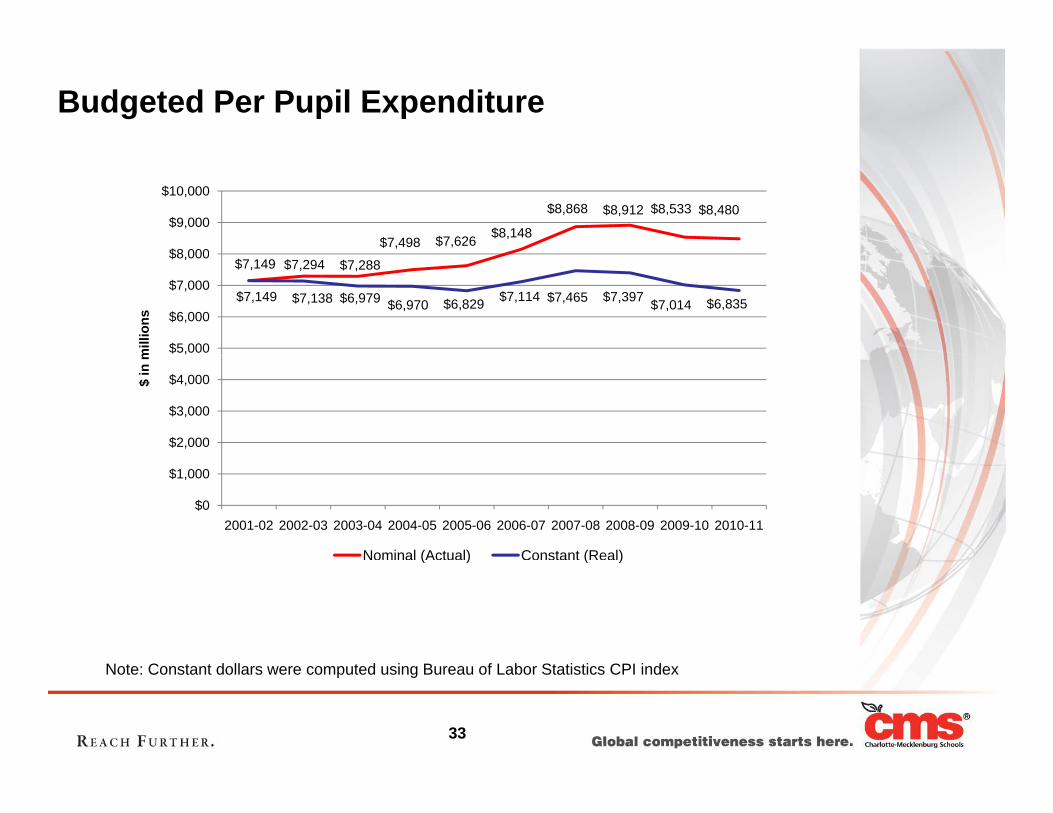
Budgeted Per Pupil Expenditure
$7,498 $7,626 $8,148
$8,868 $8,912 $8,533 $8,480
$8 000
$9,000
$10,000
$7,149 $7,294 $7,288
$7,149 $7,138 $6,979 $6,970 $6,829 $7,114 $7,465 $7,397 $7,014 $6,835
$5,000
$6,000
$7,000
$8,000
mill
ions
$2,000
$3,000
$4,000$ in
m
$0
$1,000
2001-02 2002-03 2003-04 2004-05 2005-06 2006-07 2007-08 2008-09 2009-10 2010-11
Nominal (Actual) Constant (Real)
C f S C
( ) ( )
33
Note: Constant dollars were computed using Bureau of Labor Statistics CPI index

Total Student Enrollment
135 638138,012
140,010
120,000
130,000
140,000
109,605113,859
118,599123,789
129,011132,281
134,060 133,664 135,638
of S
tude
nts
90,000
100,000
110,000
Num
ber o
80,00002-03 03-04 04-05 05-06 06-07 07-08 08-09 09-10 10-11 11-12 12-13
School Year
Projected
34

Economically Disadvantaged Students
50.0%
60.0%
41.7%43.7%
47.9% 47.0% 45.5% 47.3% 48.7%51.6% 53.4% 54.4%
latio
n
20.0%
30.0%
40.0%
of S
tude
nt P
opu
0.0%
10.0%
02-03 03-04 04-05 05-06 06-07 07-08 08-09 09-10 10-11 11-12
%o
School YearSchool Year
35

Limited English Proficiency Students
12 000
14,000
16,000
18,000
20,000
10 944 11,51012,493
14,883
17,03518,407
16,631 16,220 15,505
dent
s
4,000
6,000
8,000
10,000
12,000 9,885 10,944 ,
Num
ber o
f Stu
d
0
2,000
,000
02-03 03-04 04-05 05-06 06-07 07-08 08-09 09-10 10-11 11-12
N
School YearSchool Year
36

Homeless Students
4 500
5,000 4,453
4,711
3,000
3,500
4,000
4,500
2,493
2,989
ents
1,000
1,500
2,000
2,500
1,038 1,432
1,841 2,208
Num
ber o
f Stu
de
-
500
03-04 04-05 05-06 06-07 07-08 08-09 09-10 10-11
School Year
37

Employer Benefits Cost TrendsRetirement
12.00%
14.00%
16.00%
10.51%
13.12%14.31%
Retirement
4.00%
6.00%
8.00%
10.00%
12.00%
5.00%
7.83% 8.14% 8.75%10.51%
0.00%
2.00%
2001-02 2007-08 2008-09 2009-10 2010-11 2011-12 Proposed 2012-13
Health
$2 000
$4,000
$6,000
$2,764
$4,097 $4,157 $4,527 $4,929 $4,931 $5,192
$0
$2,000
2001-02 2007-08 2008-09 2009-10 2010-11 2011-12 Proposed 2012-13
38

Historical Salary Increases
8.0%
9.0%
5 0%
6.0%
7.0%
3.0%
4.0%
5.0%
0 0%
1.0%
2.0%
0.0%2001-2002 2002-2003 2003-2004 2004-2005 2005-2006 2006-2007 2007-2008 2008-2009 2009-2010 2010-2011 2011-2012
Central Office and Non-Certified Principal/AP Teachers and Certified Staff
39

Historical Budget Reductions by AreaState & Local
2011-12% of Area % of Area
State & Local Budgeted TotalBudget Total Positions* Positions
Area FY2010-2011 Reductions FY2010-2011 ReducedCentral Office 85,662,147 (6,613,642) (7.7%) 893 (60) (6.7%)Support 82,232,185 (10,161,756) (12.4%) 1,573 (235) (14.9%)Schools 769 086 720 (31 084 995) (4 0%) 11 809 (212) (1 8%)
Budget (State & Local)
Budget (State & Local)
Schools 769,086,720 (31,084,995) (4.0%) 11,809 (212) (1.8%)Total 936,981,052 (47,860,393) (5.1%) 14,275 (506) (3.5%)
State & LocalState & Local Budgeted Total
Budget Total Positions* Positions
2010-11% of Area Budget (State &
% of Area Budget (State &Budget Total Positions Positions
Area FY2009-2010 Reductions FY2009-2010 ReducedCentral Office 97,464,429 (9,405,886) (9.7%) 920 (61) (6.6%)Support 99,080,367 (9,601,118) (9.7%) 1,631 (80) (4.9%)Schools 756,478,796 (39,739,730) (5.3%) 11,957 (675) (5.6%)
Total 953,023,592 (58,746,734) (6.2%) 14,508 (816) (5.6%)
(State & Local)
(State & Local)
, , ( , , ) ( ) , ( ) ( )
State & LocalState & Local Budgeted Total
Budget Total Positions* PositionsArea FY2008-2009 Reductions FY2008-2009 Reduced
2009-10% of Area Budget (State & Local)
% of Area Budget (State & Local)
Central Office 103,776,661 (9,380,942) (9.0%) 999 (98) (9.8%)Support 128,229,321 (11,217,486) (8.7%) 2,206 (133) (6.0%)Schools 837,951,318 (66,304,143) (7.9%) 13,367 (736) (5.5%)Total 1,069,957,300 (86,902,571) (8.1%) 16,572 (967) (5.8%)
40
*Totals do not include Federal, Other, Child Nutrition, or ASEP positions

How does the proposed investment compare toinvestment compare to
prior investment trends?p
41
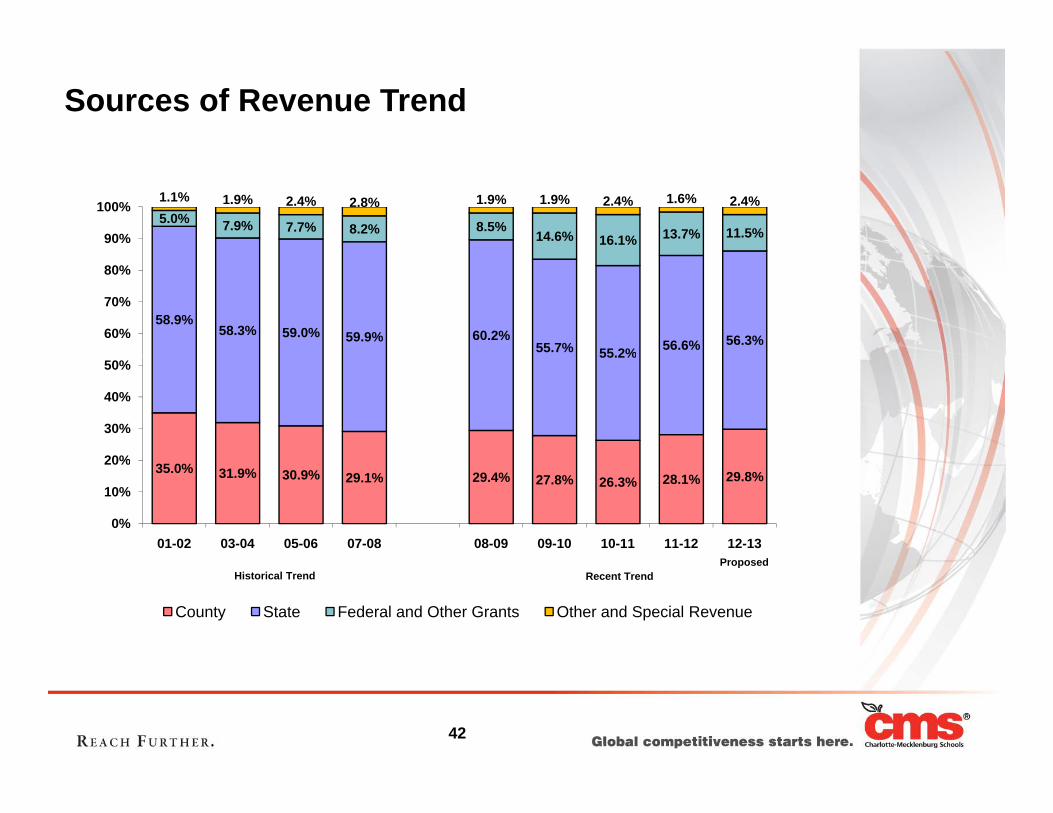
Sources of Revenue Trend
5.0% 7.9% 7.7% 8.2% 8.5%14.6% 16.1% 13.7% 11.5%
1.1% 1.9% 2.4% 2.8% 1.9% 1.9% 2.4% 1.6% 2.4%
90%
100%
58.9%58.3% 59.0% 59.9% 60.2%
55.7% 55 2% 56.6% 56.3%60%
70%
80%
55.2%
20%
30%
40%
50%
35.0% 31.9% 30.9% 29.1% 29.4% 27.8% 26.3% 28.1% 29.8%
0%
10%
20%
01-02 03-04 05-06 07-08 08-09 09-10 10-11 11-12 12-13Proposed
Recent Trend
County State Federal and Other Grants Other and Special Revenue
Historical TrendProposed
42

Per Pupil Expenditure Trend
$726 $758$258
$247 $173$162 $202 $132 $210
9,000
10,000
$5,314 $5,360
$358 $503 $574 $651 $586$604
$726 $758$1,241 $1,370 $1,163 $979
$80 $116 $137 $141 $186$258
5 000
6,000
7,000
8,000
$4,207 $4,257 $4,250 $4,472 $4,500$4,835
$5,314 ,$4,756 $4,680 $4,799 $4,810
2,000
3,000
4,000
5,000
$2,504 $2,418 $2,327 $2,234 $2,354 $2,451 $2,581 $2,621 $2,374 $2,228 $2,379 $2,542
-
1,000
2,000
01-02 02-03 03-04 04-05 05-06 06-07 07-08 08-09 09-10 10-11 11-12 12-13Proposed
County State Federal and Other Grants Other and Special Revenue
Total Per Pupil:
Proposed
7,149$ 7,294$ 7,288$ 7,498$ 7,626$ 8,148$ 8,868$ 8,912$ 8,533$ 8,480$ 8,473$ 8,541$
43
Note: Reflects budgeted per pupil expenditure

What has been the return on past investments?on past investments?
Are we at a critical juncture academically?
44

Math Proficiency (with retests)
Math Proficiency*
2008-09 2009-10 2010-11Change08-09 to
10-11
Change09-10 to
10-11
Grade 3 80 82 80 0 2Grade 3 80 82 80 0 -2
Grade 4 80 83 85 +5 +2
Grade 5 81 83 83 +2 0Grade 5 81 83 83 2 0
Grade 6 76 79 79 +3 0
Grade 7 75 79 79 +4 0
Grade 8 80 84 85 +5 +1
Composite 79 82 82 +3 0
The change between 08-09 and 10-11 indicates that all comparisons except 3rd grade increased proficiency between 2 – 5 percentage points. The change between 09-10 and 10-11 indicates only 2 positive increases between 1 to 2 percentage points.
*Percentage of scores at Levels III and IV
45

Math Trends Between Subgroups- Grades 3-8 (with retests)
Subgroups 2008-09 2009-10 2010-11Change08-09 to
09-10
Change09-10 to
10-11
AfricanAmerican
vs.White
27 24 23 -3 -1
Hispanic vs.
White 19 16 16 -3 0
EconomicallyEconomically Disadvantaged
vs. Not
Economically Disadvantaged
19 20 20 +1 0
*Mathematics for 2008-09 reflects the first year the state began reporting EOG scores with retests.
g
46
Change Change
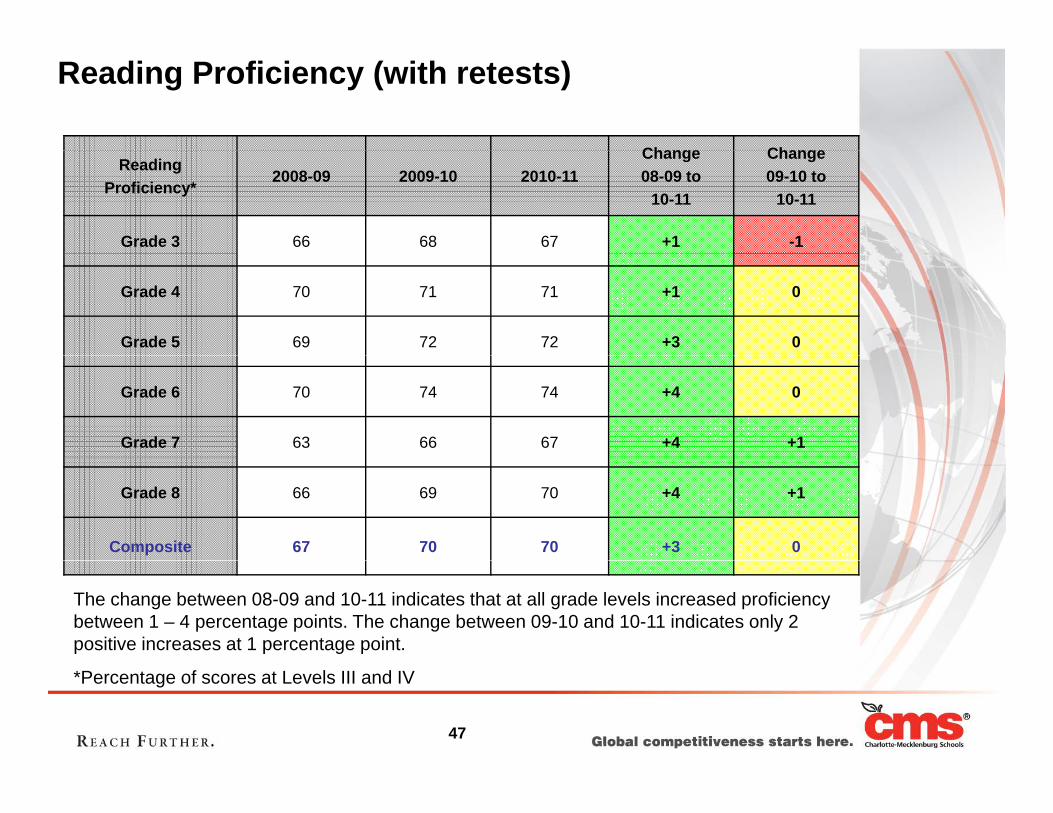
Reading Proficiency (with retests)
Reading Proficiency*
2008-09 2009-10 2010-11Change08-09 to
10-11
Change09-10 to
10-11
Grade 3 66 68 67 +1 -1
Grade 4 70 71 71 +1 0
Grade 5 69 72 72 +3 0
Grade 6 70 74 74 +4 0
Grade 7 63 66 67 +4 +1
Grade 8 66 69 70 +4 +1
Composite 67 70 70 +3 0
The change between 08-09 and 10-11 indicates that at all grade levels increased proficiency between 1 – 4 percentage points. The change between 09-10 and 10-11 indicates only 2 positive increases at 1 percentage point.
*Percentage of scores at Levels III and IV
47

Reading Trends Between Subgroups- Grades 3-8 (with retests)
Subgroups 2008-09 2009-10 2010-11Change08-09 to
09-10
Change09-10 to
10-1109-10 10-11
African-American vs.
White 35 33 32 -2 -1
Hispanic vs.
White 33 32 31 -1 -1
Economically DisadvantagedEconomically Disadvantaged vs.
Not EconomicallyDisadvantaged
28 31 30 +3 -1
*Reading for 2008-09 reflects the first year the state began reporting EOG scores with retests.
48

End-of-Course Proficiency (with retests)
2009-10* 2010-11 Change
Algebra I 84 79 -5
Algebra II 85 79 -6
Biology 85 83 -2Biology 85 83 2
Civics & Economics 83 82 -1
English I 85 81 -4
Physical Science 71 71 0
US History 89 86 -3
C i 84 81 3Composite 84 81 -3
*2009-10 was the first year that EOC scores were reported with retests.
*Percentage of scores at Levels III and IV
49

Trends Between Subgroups (with retests)
Algebra Ig
African-American vs.
White
Hispanic vs.
White
Economically Disadvantaged
vs.Not EconomicallyWhite White Not Economically Disadvantaged
Year Gap Gap Trend Gap Gap Trend Gap Gap Trend
2009-10* 19 n/a 12 n/a 14 n/a
2010-11 25 +6 17 +5 19 +5
*2009-10 was the first year the state reported EOCs with retests.
50

Trends Between Subgroups (with retests)
Algebra II
African-American vs.
White
Hispanic vs.
White
Economically Disadvantaged
vs.Not EconomicallyWhite White Not Economically Disadvantaged
Year Gap Gap Trend Gap Gap Trend Gap Gap Trend
2009-10* 13 n/a 7 n/a 8 n/a
2010 11 21 +8 12 +5 15 +72010-11 21 +8 12 +5 15 +7
*2009-10 was the first year the state reported EOCs with retests
51
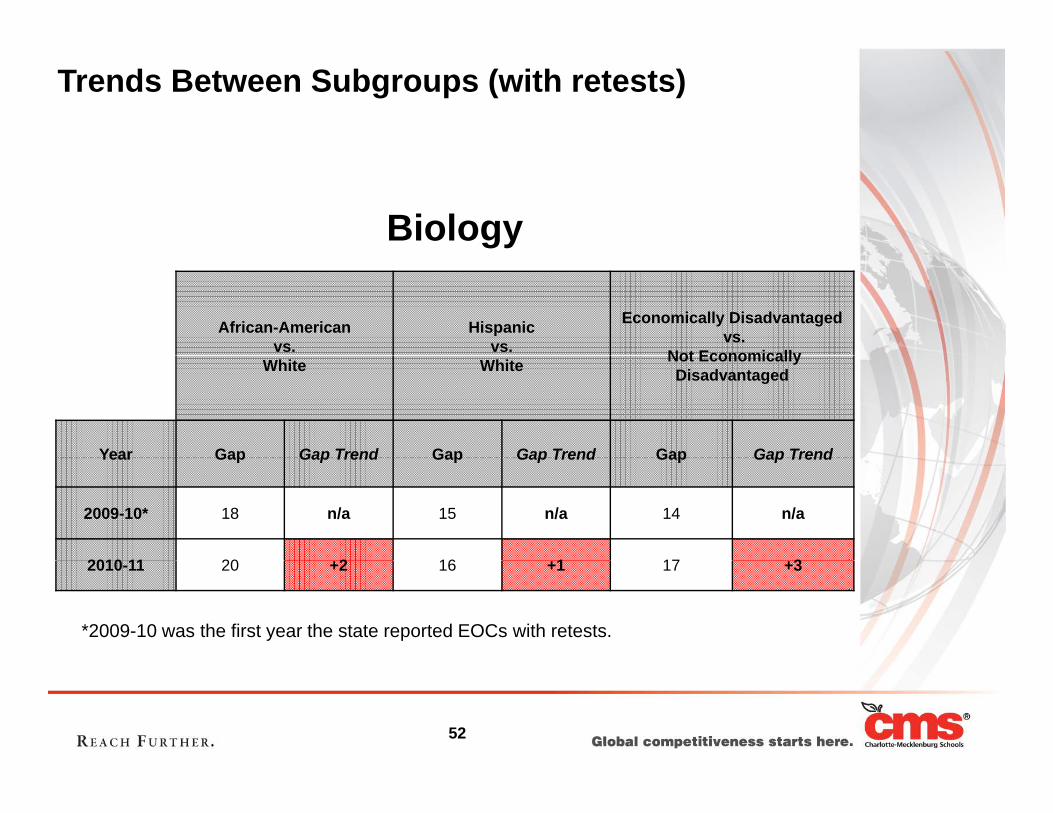
Trends Between Subgroups (with retests)
Biology
African-American vs.
Hispanic vs.
Economically Disadvantagedvs.
Not EconomicallyWhite White Not Economically Disadvantaged
Year Gap Gap Trend Gap Gap Trend Gap Gap TrendYear Gap Gap Trend Gap Gap Trend Gap Gap Trend
2009-10* 18 n/a 15 n/a 14 n/a
2010 11 20 2 16 1 17 32010-11 20 +2 16 +1 17 +3
*2009-10 was the first year the state reported EOCs with retests.
52

Trends Between Subgroups (with retests)
Civics & Economics
African-American vs.
White
Hispanic vs.
White
Economically Disadvantaged vs.
Not Economically Disadvantaged
Year Gap Gap Trend Gap Gap Trend Gap Gap Trend
2009-10* 19 n/a 18 n/a 17 n/a
2010-11 21 +2 22 +4 19 +2
*2009-10 was the first year the state reported EOCs with retests.
53

Trends Between Subgroups (with retests)
English I
African-American vs.
White
Hispanic vs.
White
Economically Disadvantagedvs.
Not Economically Disadvantagedg
Year Gap Gap Trend Gap Gap Trend Gap Gap Trend
2009-10* 16 n/a 17 n/a 16 n/a
2010-11 21 +5 21 +4 21 +5
*2009-10 was the first year the state reported EOCs with retests.
54

Trends Between Subgroups (with retests)
Physical SciencePhysical Science
African-American vs.
Hispanic vs.
Economically Disadvantaged vs.
Not EconomicallyWhite White Not Economically Disadvantaged
Year Gap Gap Trend Gap Gap Trend Gap Gap Trend
2009-10* 18 n/a 15 n/a 12 n/a
2010-11 23 +5 13 -2 14 +2
*2009-10 was the first year the state reported EOCs with retests
55

Trends Between Subgroups (with retests)
US Historyy
African-American vs.
White
Hispanic vs.
White
Economically Disadvantaged vs.
Not Economically White White yDisadvantaged
Year Gap Gap Trend Gap Gap Trend Gap Gap Trend
2009-10* 13 n/a 10 n/a 10 n/a
2010-11 17 +4 12 +2 15 +5
*2009-10 was the first year the state reported EOCs with retests
56

SAT Tests Taken
2007-08 2008-09 2009-10 2010-11
School System # Tested % Tested Total* # Tested %
Tested Total* # Tested % Tested Total* # Tested %
Tested Total*
United States (All Students)
1,518,859 45.0 1511 1,530,128 46.0 1509 1,547,990 47.0 1509 1,647,123 50.0 1500
North Carolina (All Students) 55,442 63.0 1489 57,147 63.0 1486 57,841 63.0 1485 62,149 64.0 1475
Charlotte-Mecklenburg 4,656 68.4 1489 4,450 60.6 1492 5,007 65.7 1497 5,240 68.5 1482
* The combined Math, Critical Reading and Writing sub-scores
Please note: In 2010, the College Board began including students in its annual cohort for test administrations through March as well as through June, but only reported scores through March. In previous years, the cohort only included students who were tested through M h S d b h C ll B d i 2011 i l d d ll k h h J d h f bl i h
57
March. Scores reported by the College Board in 2011 included all test-takers through June, and are therefore not comparable withreleased district and schools' scores from previous years.

AP Pass Rates (%)
2006-07 2007-08 2008-09 2009-10 2010-11
Global 59 58 59 58 57
NC 58 58 59 59 53
CMS 47 48 49 51 64
58

AP Tests Taken
Number of Exams Taken
2006-07 2007-08 2008-09 2009-10 2010-11
Global 2,533,431 2,736,445 2,929,929 3,213,225 3,365,617
NC 81,151 85,378 89,344 92,334 94,061
CMS 11 287 12 231 13 293 13 362 9 520CMS 11,287 12,231 13,293 13,362 9,520
59
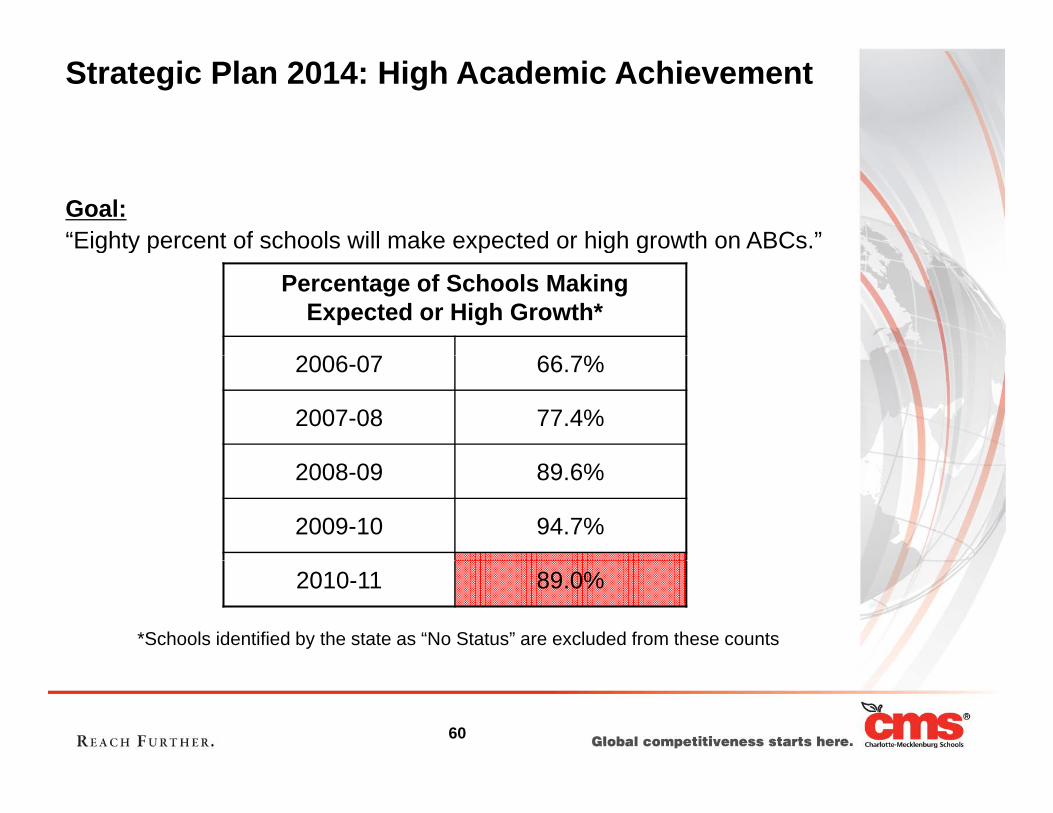
Strategic Plan 2014: High Academic Achievement
Goal:“Eighty percent of schools will make expected or high growth on ABCs.”g y p p g g
Percentage of Schools Making Expected or High Growth*
2006 07 66 7%2006-07 66.7%
2007-08 77.4%
2008-09 89.6%
2009-10 94.7%
2010-11 89.0%
*Schools identified by the state as “No Status” are excluded from these counts
60
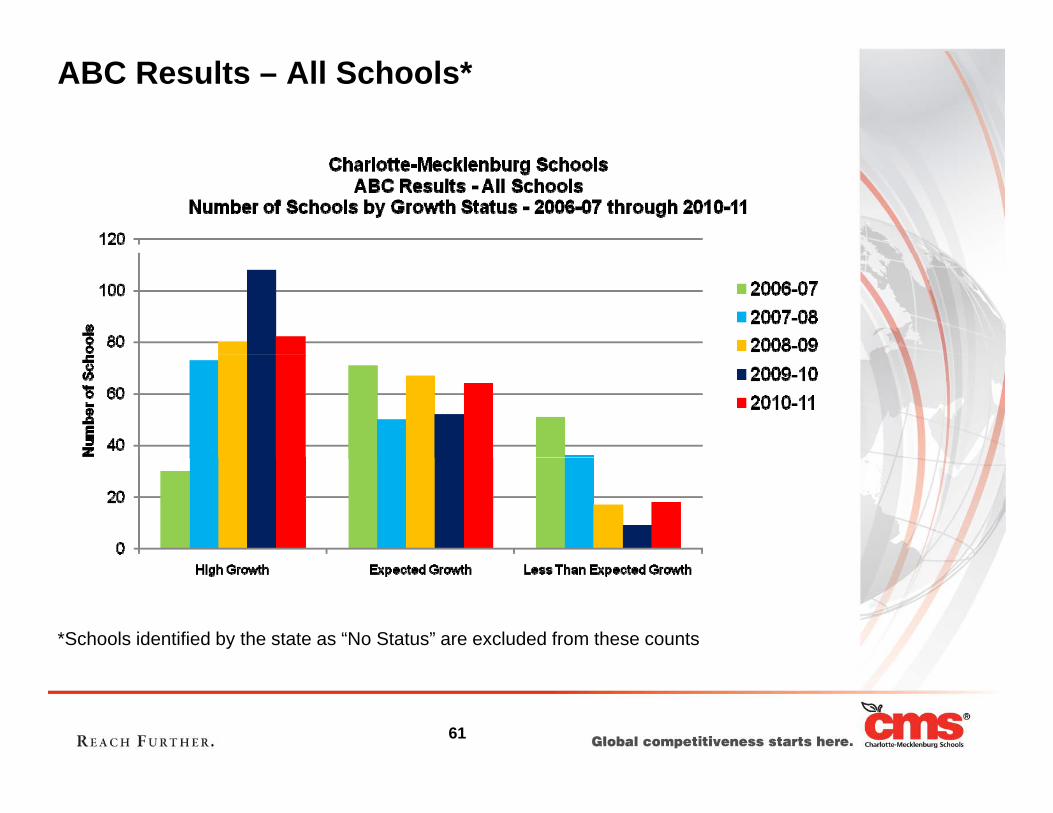
ABC Results – All Schools*
*Schools identified by the state as “No Status” are excluded from these counts
61
Key Highlights
f f f• After four consecutive years of multimillion-dollar cuts and redirections within our budget (more than $212 million since FY 2009), CMS is at a critical juncture. We do not want to lose ground we have worked so hard to gain so we must begin rebuilding in core areas to prevent declines in our academic progress
• CMS continues to absorb increases in operating costs such as utilities and employee benefits – costs we do not control but must pay – which reduces the amount we can spend on each student
• CMS is continuing to optimize resources and identify efficiency savings as well as budget cuts and redirections ($23.3 million for 2012-13) to help cover rising costs and anticipated state cuts
• Strategically planning ahead for the EduJobs funding cliff coming in 2012-13 prevented the need for a reduction in force or other unplanned cuts
62
Key Highlights (cont)
• Recruitment and retention of highly effective staff is critical to help us move• Recruitment and retention of highly effective staff is critical to help us move academic achievement forward, thus this budget includes a 3% cost of living increase for our staff who have continued to deliver strong results while not receiving a salary adjustment in nearly four years (seeking increased funding from the county for 2% of that cost – less any amount the state may provide)
• CMS is also seeking money from the county to help us pay for some of the costs of sustaining operations, including a cost of living increase, as well as growth – increases consistent with those areas the county is planning to fund in their 2012 13 budgettheir 2012-13 budget
• If the county fully funds our request of $355.9 million, CMS would receive only $4.5 million more than the highest ever county funding level reached in 2008-09 but would be almost $400 per pupil less than the 2008 09 per pupil county09, but would be almost $400 per pupil less than the 2008-09 per pupil county funding level due to enrollment growth
• The budget proposal is based on the best information we have at this time and is subject to change based on final approved funding from all sourcesis subject to change based on final approved funding from all sources
63

Key Highlights (cont)
• CMS will continue to align our resources with the BOE’s Theory of Action, Core Beliefs, and SP2014 goals including those strategies that have helped us increase academic achievement, close the gap, and improve the graduation rate
• CMS hopes the citizens of Mecklenburg County will recognize the value of an outstanding school district and the importance of that on the economic development in our area and will actively support our funding requestp y pp g q
64
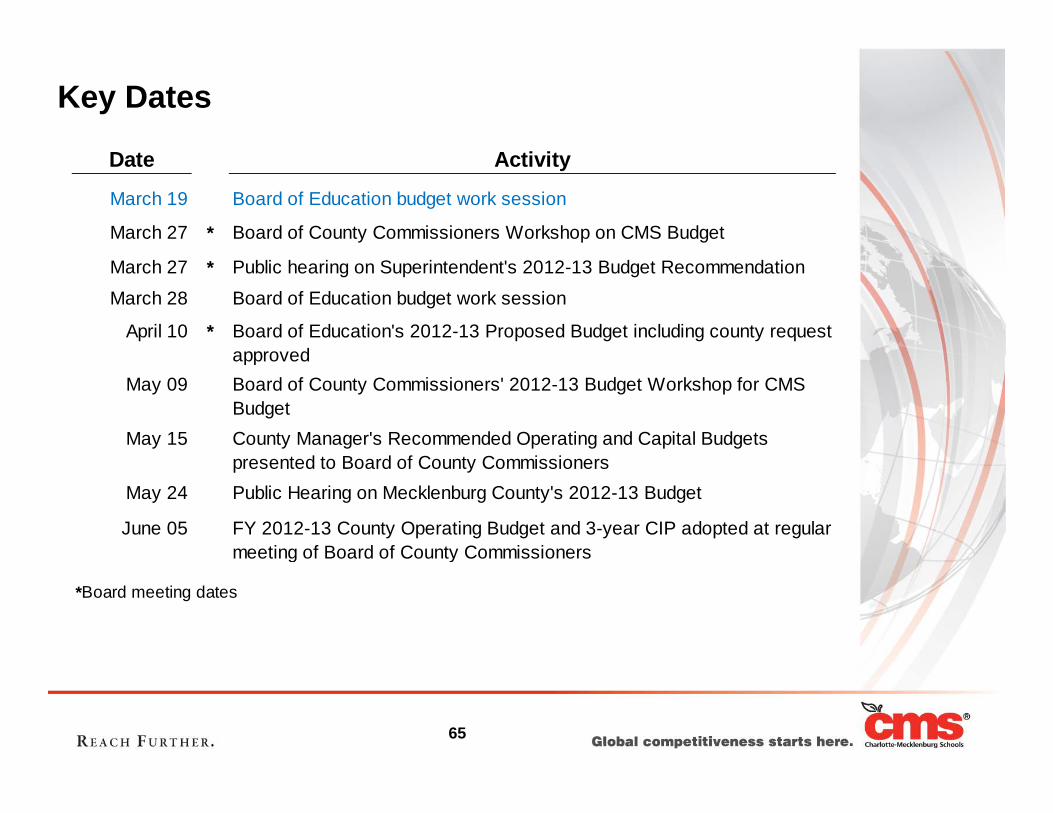
Key Dates
Date Activity
March 19 Board of Education budget work session
March 27 * Board of County Commissioners Workshop on CMS Budget
March 27 * Public hearing on Superintendent's 2012-13 Budget Recommendation
March 28 Board of Education budget work session
April 10 * Board of Education's 2012-13 Proposed Budget including county request approvedapproved
May 09 Board of County Commissioners' 2012-13 Budget Workshop for CMS Budget
May 15 County Manager's Recommended Operating and Capital Budgets t d t B d f C t C i ipresented to Board of County Commissioners
May 24 Public Hearing on Mecklenburg County's 2012-13 Budget
June 05 FY 2012-13 County Operating Budget and 3-year CIP adopted at regular meeting of Board of County Commissionersg y
*Board meeting dates
65
Conclusion
• Superintendent’s closing remarks• Superintendent s closing remarks• Q & A
66