supplement of challenges associated with the sampling and
TRANSCRIPT

Supplement of Atmos. Meas. Tech., 9, 1325–1340, 2016http://www.atmos-meas-tech.net/9/1325/2016/doi:10.5194/amt-9-1325-2016-supplement© Author(s) 2016. CC Attribution 3.0 License.
Supplement of
Challenges associated with the sampling and analysis of organosulfurcompounds in air using real-time PTR-ToF-MS and offline GC-FID
Véronique Perraud et al.
Correspondence to:Barbara J. Finlayson-Pitts ([email protected]) and Donald R. Blake ([email protected])
The copyright of individual parts of the supplement might differ from the CC-BY 3.0 licence.

1. Mixing ratios measurements using PTR-MS parameters:
The PTR-MS records in real time the intensity of protonated ions [M+H]+ as a
function of time. Ultimately, mixing ratio (Mppb in ppb) from the PTR-MS
measurements can be determined from the following equation:
∑
(S1)
with Cppb, the concentration of the [M+H]+ ion generated in the ion drift source; k,
the reaction rate constant (cm3 s-1) between a target molecule and protonated water
reagent (H3O+) forms by the hallow cathode; 0, the reduced ion mobility (= 2.8 cm2
V-1 s-1); Udrift the total voltage of the drift tube (= 600 V); NA the Avogadro number (=
6.023 x 10²³ molecules mole-1); l, the length of the reaction chamber (= 9.3 cm); Tdrift
(= 60°C = 333 K) and T0 (273.15 K), the drift temperature and the temperature at
standard condition respectively; pdrift (2.11-2.15 mbar) and p0 (1013.25 mbar) the
drift pressure and the pressure at standard condition respectively; C+ and H3O+ the
signal measured for the [M+H]+ ion and the H3O+ ion (taken at m/z 21; typical count
rate were ~2 x 10⁶ s-1), respectively; TRCi+ and TRH3O+ the transmission efficiency of
the ion of interest and the H3O+ ion (m/z 21) respectively; and Iab, the isotopic
abundance of the ion of interest.
2. Dynamic injection system.
A dynamic solution injection system was used to calibrate the two analytical
methods for dimethyl trisulfide (DMTS). The system was first validated using
dimethyl sulfide (DMS) and dimethyl disulfide (DMDS) standards by comparing the
data obtained with the certified gas cylinder. The dynamic solution injection
method was adapted from Jardine et al. (Jardine et al., 2010). Briefly, a standard
solution of the OSC pure standard was prepared each day in cyclohexane (Fluka,
Spectranalyzed grade) with concentrations of about 1-3 × 10⁻⁵ mol ml-1. These
solutions were then injected using a syringe pump (Pump systems Inc., model NE-

1000) at a flow rate of 0.5 L min-1 into an empty, septum-sealed 20-mL scintillator
glass vial. A controlled stream of dry synthetic air was flowing in and out of the vial
at a constant flow rate set by a mass flow controller (Alicat), allowing the OSC
standard to vaporize entirely. The outflow of the system was directed to the inlet of
the PTR-ToF-MS without further dilution. From this system, the fluctuations of the
syringe pump were visible, and we chose to average over several cycles to get the
value of the signal intensity for a given concentration during calibration.
Concentrations in the range of 0-200 ppb were generated, with an accuracy of ~4 to
10% (2 standard deviations). No metal connector or tubing was used in this system.
Figure S1. Dynamic injection system

Figure S2. High-resolution mass spectra for each individual OSC fragments:

Figure S3. Fragmentation ratio observed for DMDS as a function of the electric field strength (E/N) values. Adapted from Schuhfried et al. (Schuhfried et al., 2013)

Figure S4. High-resolution mass spectra for DMTS nominal mass m/z 96:

Figure S5. Calibration curves for DMS, DMDS, DMTS and MTO. The hydronium ion signal intensity was 2.4-2.9 × 10⁶ counts per second for these measurements

Figure S6. PTR-MS signal intensity profile acquired from a certified gas cylinder containing 4.03 ppm MTO standard in nitrogen. (a) Normalized signal intensity for mass m/z 49 - Loss of MTO on different surfaces including 20-cm long tubing made of stainless steel (ss), copper (Cu) or glass (all the connections were PTFE tubing and connectors). (b) The mixture was stored overnight in the regulator prior measurement to test the reactivity of CH3SH on metal surface.
(b)
(a)

Figure S7. Representative PTR-MS mass spectrum from a bin sample. The red
signal in (a) corresponds to the MS spectra with intensities multiplied by 2; the grey
signal corresponds to a background MS spectrum. In the high resolution mass spectra (b)
and (c), the signal intensity for DMDS (red trace) was overlaid on the bin sample.
(a)
(b) (c)
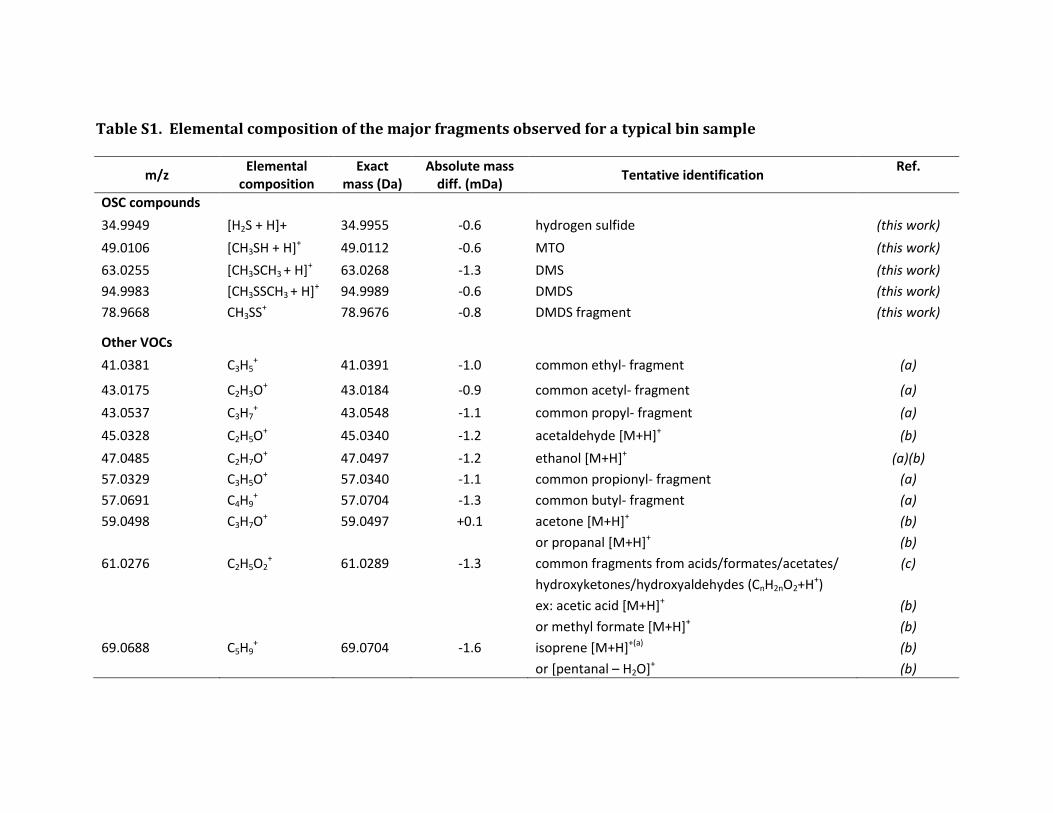
Table S1. Elemental composition of the major fragments observed for a typical bin sample
m/z Elemental
composition Exact
mass (Da) Absolute mass
diff. (mDa) Tentative identification
Ref.
OSC compounds
34.9949 [H2S + H]+ 34.9955 -0.6 hydrogen sulfide (this work)
49.0106 [CH3SH + H]+ 49.0112 -0.6 MTO (this work)
63.0255 [CH3SCH3 + H]+ 63.0268 -1.3 DMS (this work)
94.9983 [CH3SSCH3 + H]+ 94.9989 -0.6 DMDS (this work)
78.9668 CH3SS+ 78.9676 -0.8 DMDS fragment (this work)
Other VOCs
41.0381 C3H5+ 41.0391 -1.0 common ethyl- fragment (a)
43.0175 C2H3O+ 43.0184 -0.9 common acetyl- fragment (a)
43.0537 C3H7+ 43.0548 -1.1 common propyl- fragment (a)
45.0328 C2H5O+ 45.0340 -1.2 acetaldehyde [M+H]+ (b)
47.0485 C2H7O+ 47.0497 -1.2 ethanol [M+H]+ (a)(b)
57.0329 C3H5O+ 57.0340 -1.1 common propionyl- fragment (a)
57.0691 C4H9+ 57.0704 -1.3 common butyl- fragment (a)
59.0498 C3H7O+ 59.0497 +0.1 acetone [M+H]+ (b)
or propanal [M+H]+ (b)
61.0276 C2H5O2+ 61.0289 -1.3 common fragments from acids/formates/acetates/
hydroxyketones/hydroxyaldehydes (CnH2nO2+H+)
(c)
ex: acetic acid [M+H]+ (b)
or methyl formate [M+H]+ (b)
69.0688 C5H9+ 69.0704 -1.6 isoprene [M+H]+(a) (b)
or [pentanal – H2O]+ (b)

or cyclopentene [M+H]+ (b)
or [2-methyl-3-buten-1-ol – H2O]+ (b)
73.0637 C4H9O+ 73.0653 -1.6 butanone [M+H]+ (b)(f)
or butanal [M+H]+ (b)(f)
75.0430 C3H7O2+ 75.0446 -1.6 common fragments from acids/formates/acetates/
hydroxyketones/hydroxyaldehydes (CnH2nO2+H+)
(c)
ex: hydroxyacetone [M+H]}+ (b)
or propionic acid [M+H]+ (b)
81.0693 C6H9+ 81.0704 -1.1 common fragment observed for monoterpenes (d)
83.0843 C6H11+ 83.0861 -1.8 [3-hexen-1-ol – H2O]+ (b)
or hexadiene [M+H]+ (b)
or cyclohexene [M+H]+ (b)
or 2,4 dimethyl-buta-1,3 diene [M+H]+ (b)
89.0589 C4H9O2+ 89.0603 -1.4 common fragments from acids/formates/acetates/
hydroxyketones/hydroxyaldehydes (CnH2nO2+H+)
(c)
ex: butanoic acid [M+H]+ (f)
95.0470 C6H7O+ 95.0497 -2.7 phenol [M+H]+ (b)
95.0832 C7H11+ 95.0861 -2.9 norbornene [M+H]+ (b)
or heptanedienol [M+H]+ (e)
103.0740 C5H11O2+ 103.0759 -1.9 common fragments from acids/formates/acetates/
hydroxyketones/hydroxyaldehydes (CnH2nO2+H+)
(c)
ex: methyl butyrate [M+H]+ (a)
or ethyl propionate [M+H]+ (a)
or ethyl pentanoate fragment (a)
or 3-methyl butanoic acid[M+H]+ (f)
or pentanoic acid [M+H]+ (f) (a) from (Buhr et al., 2002)

(b) Source: (Williams et al., 2001) (c) from (Inomata et al., 2010) (d) from (Maleknia et al., 2007) and (Tani et al., 2003) (e) from (Morisco et al., 2013) (f) from (Feilberg et al., 2010)

REFERENCES Buhr, K., van Ruth, S., and Delahunty, C.: Analysis of volatile flavour compounds by
proton-transfer reaction mass spectrometry: Fragmentation patterns and discrimination between isobaric and isomeric compounds, Int. J. Mass Spectrom., 221, 1-7, 2002.
Feilberg, A., Liu, D. Z., Adamsen, A. P. S., Hansen, M. J., and Jonassen, K. E. N.: Odorant emissions from intensive pig production measured by online proton-transfer-reaction mass spectrometry, Environ. Sci. Technol., 44, 5894-5900, 2010.
Inomata, S., Tanimoto, H., Kato, S., Suthawaree, J., Kanaya, Y., Pochanart, P., Liu, Y., and Wang, Z.: PTR-MS measurements of non-methane volatile organic compounds during an intensive field campaign at the summit of Mount Tai, China, in June 2006, Atmos. Chem. Phys., 10, 7085-7099, 2010.
Jardine, K. J., Henderson, W. M., Huxman, T. E., and Abrell, L.: Dynamic Solution Injection: a new method for preparing pptv-ppbv standard atmospheres of volatile organic compounds, Atmos. Meas. Tech., 3, 1569-1576, 2010.
Maleknia, S. D., Bell, T. L., and Adams, M. A.: PTR-MS analysis of reference and plant-emitted volatile organic compounds, Int. J. Mass Spectrom., 262, 203-210, 2007.
Morisco, F., Aprea, E., Lembo, V., Fogliano, V., Vitaglione, P., Mazzone, G., Capellin, L., Gasperi, F., Mascone, S., Domenico De Palma, G., Marmo, R., Caporaso, N., and Biasioli, F.: Rapid "Breath-Print" of liver cirrhosis by proton transfer reaction time-of-flight mass spectrometry. A pilot study, PLoS ONE, 8, 2013.
Schuhfried, E., Probst, M., Limtrakul, J., Wannakao, S., Aprea, E., Cappellin, L., Mark, T. D., Gasperi, F., and Biasioli, F.: Sulfides: Chemical ionization induced fragmentation studied with proton transfer reaction mass spectrometry and density functional calculations, J. Mass Spectrom., 48, 367-378, 2013.
Tani, A., Hayward, S., and Hewitta, C. N.: Measurement of monoterpenes and related compounds by proton transfer reaction-mass spectrometry (PTR-MS), Int. J. Mass Spectrom., 223, 561-578, 2003.
Williams, J., Poschl, U., Crutzen, P. J., Hansel, A., Holzinger, R., Warneke, C., Lindinger, W., and Lelieveld, J.: An atmospheric chemistry interpretation of mass scans obtained from a proton transfer mass spectrometer flown over the tropical rainforest of Surinam, J. Atmos. Chem., 38, 133-166, 2001.