supplemental figure 1 chlorophyll fluorescence (rel) 1 min pgr5 pgr5 + nem (0.5mm) supplemental...
TRANSCRIPT
Supplemental Figure 1
Chl
orop
hyll
fluor
esce
nce
(rel
)
1 min
pgr5
pgr5 + NEM (0.5mM)
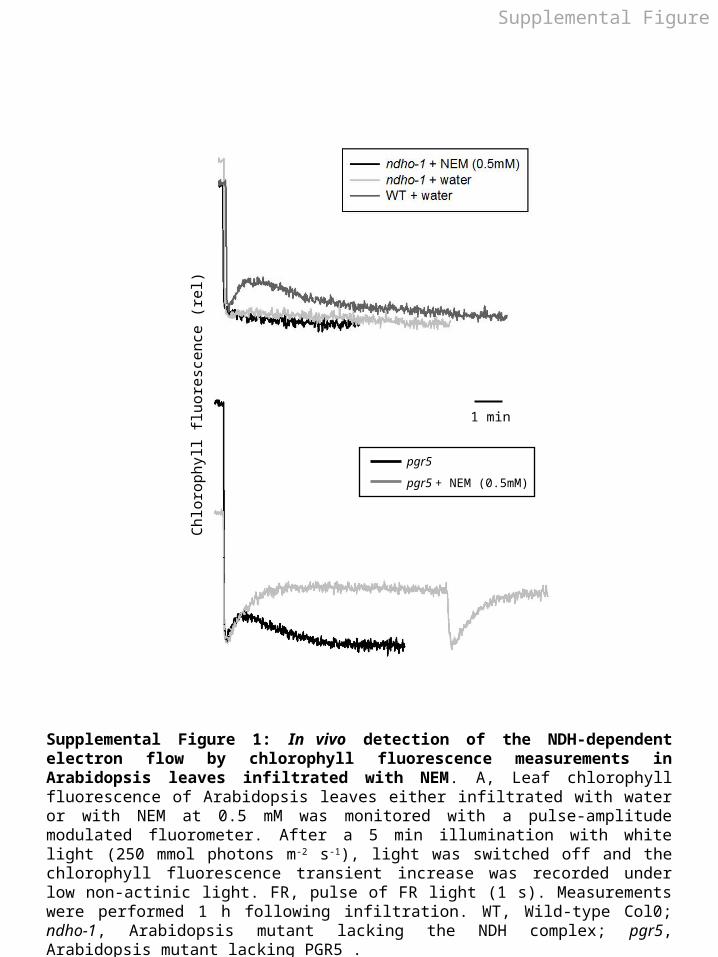
Supplemental Figure 1: In vivo detection of the NDH-dependent electron flow by chlorophyll fluorescence measurements in Arabidopsis leaves infiltrated with NEM. A, Leaf chlorophyll fluorescence of Arabidopsis leaves either infiltrated with water or with NEM at 0.5 mM was monitored with a pulse-amplitude modulated fluorometer. After a 5 min illumination with white light (250 mmol photons m -2 s-1), light was switched off and the chlorophyll fluorescence transient increase was recorded under low non-actinic light. FR, pulse of FR light (1 s). Measurements were performed 1 h following infiltration. WT, Wild-type Col0; ndho-1, Arabidopsis mutant lacking the NDH complex; pgr5, Arabidopsis mutant lacking PGR5 .
Supplemental Figure 2
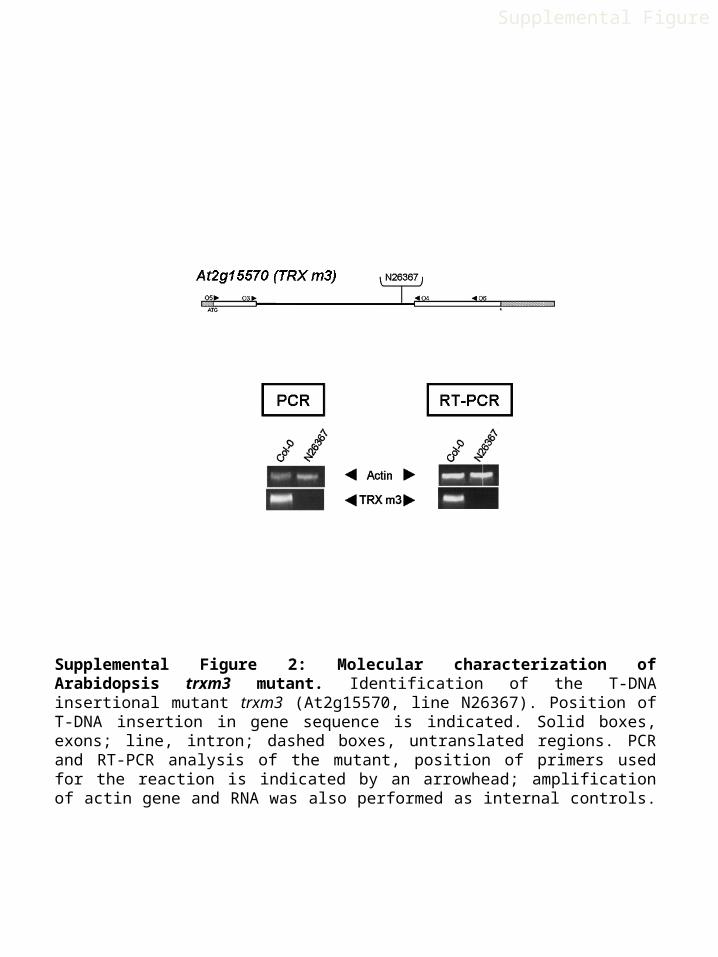
Supplemental Figure 2: Molecular characterization of Arabidopsis trxm3 mutant. Identification of the T-DNA insertional mutant trxm3 (At2g15570, line N26367). Position of T-DNA insertion in gene sequence is indicated. Solid boxes, exons; line, intron; dashed boxes, untranslated regions. PCR and RT-PCR analysis of the mutant, position of primers used for the reaction is indicated by an arrowhead; amplification of actin gene and RNA was also performed as internal controls.
RT-PCR
At3g15360 (TRX m4)
PCR
WT
WT
TRXm
4-2
TRXm
4-1
TRXm
4-2
TRXm
4-1
Actin
TRX m4
WT trxm4-1 trxm4-2
A
B
C
Supplemental Figure 3
trxm4-1
trxm4-2
(trxm4)
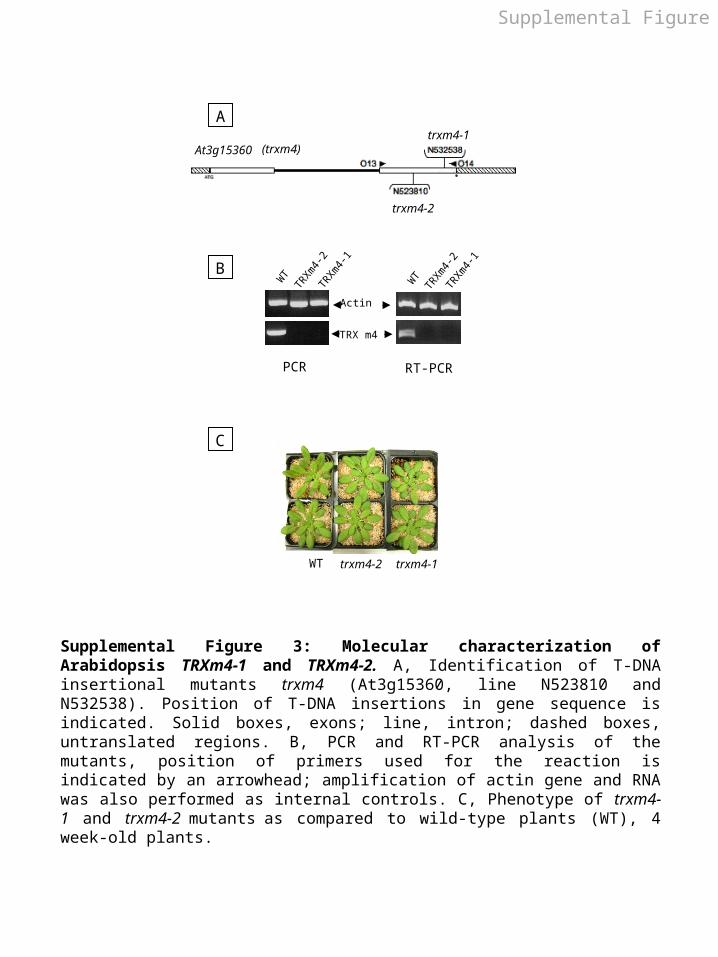
Supplemental Figure 3: Molecular characterization of Arabidopsis TRXm4-1 and TRXm4-2. A, Identification of T-DNA insertional mutants trxm4 (At3g15360, line N523810 and N532538). Position of T-DNA insertions in gene sequence is indicated. Solid boxes, exons; line, intron; dashed boxes, untranslated regions. B, PCR and RT-PCR analysis of the mutants, position of primers used for the reaction is indicated by an arrowhead; amplification of actin gene and RNA was also performed as internal controls. C, Phenotype of trxm4-1 and trxm4-2 mutants as compared to wild-type plants (WT), 4 week-old plants.

1 2 3
Time (min)
OD
(6
50
nm
)
TRXm4
TRX E coli
DTT
Supplemental Figure 4
Supplemental Figure 4: Purification and characterization of recombinant TRXm4. Inset, SDS-PAGE : Following purification of the recombinant His-tagged TRXm4 on a Ni-column, protein fractions were analysed by SDS-PAGE (15%, w/v) and Coomassie Blue staining. (1) Total bacterial protein lysate (2) Unbound protein fraction, (3) Purified TRXm4 eluted at 50 mM imidazole. Main figure, Measurement of disulphide oxidoreductase activity of recombinant TRXm4 produced in E. coli. The His-tagged TRXm4 (200 µM) was incubated in HEPES buffer (100 mM, pH 7) containing 6 mM DTT and insulin (10 mg mL-1). DTT-dependent insulin reduction of TRXm4 activity was recorded at 650 nm (M4-200). As a positive control, insulin reduction by thioredoxin from E. coli (TRX E coli) was assayed. DTT without TRX served as negative control (DTT).

Photon flux density (µmol photons m-2 s-1)
0 500 1000 1500 2000 2500 3000
NP
Q
0,0
0,5
1,0
1,5
2,0
2,5
3,0
WT TRXm4-1 TRXm4-2
Photon flux density (µmol photons m-2 s-1)
0 500 1000 1500 2000 2500 3000
P
SII
0,1
0,2
0,3
0,4
0,5
0,6
0,7
0,8
WT TRXm4-1 TRXm4-2
A
B
Supplemental Figure 5
C
Time (sec)
NP
Q
Supplemental Figure 5: Characterization of the photosynthetic activity of trxm4 mutants. A, Light intensity dependence of the quantum yield of PSII photochemistry in trxm4-1, trxm4-2 and the wild type (WT) leaves. Means ± SD (n=3). B, Light intensity dependence of nonphotochemical quenching (NPQ) of chlorophyll fluorescence in trxm4-1, trxm4-2 and the wild type (WT) leaves. Means ± SD (n=3). C, Dynamics of the transient NPQ determined in dark-adapted trxm4-1, ndho-1 and wild type (WT) leaves. Leaves were illuminated at 100 mmol photons m-2 s-1. Means ± SD (n=6).