supplemental information 2012/media/files/b/... · adjusted funds from operations (affo) 149 149...
TRANSCRIPT

Brookfield Infrastructure Partners L.P. NYSE: BIP TSX: BIP.UN
Supplemental Information
Quarter ended June 30
Q2 2
01
4

1
Brookfield Infrastructure Partners L.P.
CAUTIONARY STATEMENT REGARDING FORWARD-LOOKING STATEMENTS
This Supplemental Information contains forward-looking information within the meaning of Canadian provincial securities laws and “forward-looking statements” within the meaning of certain securities
laws including Section 27A of the U.S. Securities Act of 1933, as amended, Section 21E of the U.S. Securities Exchange Act of 1934, as amended, “safe harbor” provisions of the United States
Private Securities Litigation Reform Act of 1995 and in any applicable Canadian securities regulations. We may make such statements in this report, in other filings with Canadian regulators or the
SEC or in other communications. The words “continue”, “expect”, “target”, “believe”, “objective”, “anticipate”, “plan”, “estimate”, “growth”, “increase”, “return”, “expand”, derivatives thereof and other
expressions of similar import, or the negative variations thereof, and similar expressions of future or conditional verbs such as “will”, “may”, “should”, “could”, which are predictions of or indicate future
events, trends or prospects and which do not relate to historical matters, identify forward-looking statements. Forward-looking statements in this Supplemental Information include among others,
statements with respect to our assets tending to appreciate in value over time, growth in our assets and operations, increases in FFO per unit and resulting capital appreciation, returns on capital and
on equity, increasing demand for commodities and global movement of goods, expected capital expenditures, the impact of planned capital projects by customers of our businesses, the extent of our
corporate, general and administrative expenses, our ability to close acquisitions, our capacity to take advantage of opportunities in the marketplace, the future prospects of the assets that Brookfield
Infrastructure operates or will operate, ability to identify, acquire and integrate new acquisition opportunities, long-term target return on our assets, sustainability of distribution levels, distribution
growth and payout ratios, operating results and margins for our business and each operation, future prospects for the markets for our products, Brookfield Infrastructure’s plans for growth through
internal growth and capital investments, ability to achieve stated objectives, ability to drive operating efficiencies, return on capital expectations for the business, contract prices and regulated rates for
our operations, our expected future maintenance and capital expenditures, ability to deploy capital in accretive investments, impact on the business resulting from our view of future economic
conditions, our ability to maintain sufficient financial liquidity, our ability to draw down funds under our bank credit facilities, our ability to secure financing through the issuance of equity or debt,
expansions of existing operations, financing plan for operating companies, foreign currency management activities and other statements with respect to our beliefs, outlooks, plans, expectations and
intentions. Although we believe that Brookfield Infrastructure’s anticipated future results, performance or achievements expressed or implied by the forward-looking statements and information are
based upon reasonable assumptions and expectations, the reader should not place undue reliance on forward-looking statements and information because they involve known and unknown risks,
uncertainties and other factors which may cause the actual results, performance or achievements of Brookfield Infrastructure to differ materially from anticipated future results, performance or
achievements expressed or implied by such forward-looking statements and information.
Factors that could cause actual results to differ materially from those contemplated or implied by forward-looking statements include: general economic and financial conditions in the countries in
which we do business which may impact market demand, foreign currency risk, the high level of government regulation affecting our businesses, the outcome and timing of various regulatory, legal
and contractual issues, global credit and financial markets, the competitive business environment in the industries in which we operate, the competitive market for acquisitions and other growth
opportunities, availability of equity and debt financing, the completion of various large capital projects by customers of our businesses which themselves rely on access to capital and continued
favourable commodity prices, weakening of demand in the natural gas market, our ability to complete acquisitions and large capital expansion projects on time and within budget, ability to negotiate
favourable take-or-pay contractual terms, traffic volumes on our toll roads, our ability to obtain relevant regulatory approvals required to complete acquisitions, acts of God, weather events, or similar
events outside of our control, and other risks and factors detailed from time to time in documents filed by Brookfield Infrastructure with the securities regulators in Canada and the United States,
including Brookfield Infrastructure’s most recent Annual Report on Form 20-F under the heading “Risk Factors”.
We caution that the foregoing list of important factors that may affect future results is not exhaustive. When relying on our forward-looking statements to make decisions with respect to Brookfield
Infrastructure, investors and others should carefully consider the foregoing factors and other uncertainties and potential events. Except as required by law, Brookfield Infrastructure undertakes no
obligation to publicly update or revise any forward-looking statements or information, whether written or oral, that may be as a result of new information, future events or otherwise.
CAUTIONARY STATEMENT REGARDING USE OF NON-IFRS, ACCOUNTING MEASURES Although our financial results are determined in accordance with International Financial Reporting Standards (IFRS), the basis of presentation throughout much of this report differs from IFRS in that it
is organized by business segment and utilizes, funds from operations (FFO), adjusted funds from operations (AFFO), adjusted EBITDA and invested capital as important measures. This is reflective of
how we manage the business and, in our opinion, enables the reader to better understand our affairs. We provide a reconciliation to the most directly comparable IFRS measure on pages 25-33 of
this Supplemental Information. Readers are encouraged to consider both measures in assessing Brookfield Infrastructure's results.
BUSINESS ENVIRONMENT AND RISKS Brookfield Infrastructure's financial results are impacted by various factors, including the performance of each of our operations and various external factors influencing the specific platforms and
geographic locations in which we operate; macro-economic factors such as economic growth, changes in currency, inflation and interest rates; regulatory requirements and initiatives; and litigation
and claims that arise in the normal course of business. These and other factors are described in Brookfield Infrastructure’s most recent Annual Report on Form 20-F which is available on our website
at www.brookfieldinfrastructure.com and at www.sec.gov/edgar.shtml and www.sedar.com.

2
Brookfield Infrastructure Partners L.P.
US$ MILLIONS, EXCEPT PER UNIT INFORMATION,
UNAUDITED
Three months ended
June 30
Six months ended
June 30
2014 2013 2014 2013
Funds from operations (FFO) $ 180 $ 180 $ 366 $ 340
Per unit FFO1 0.86 0.88 1.74 1.67
Distributions 0.48 0.43 0.96 0.86
Payout ratio2 62% 55% 61% 56%
Growth of per unit FFO (2%) 47% 4% 42%
Adjusted funds from operations (AFFO) 149 149 312 283
Net income3 13 132 45 104
Net income per limited partner unit 0.01 0.60 0.11 0.43
AFFO yield4,5 13% 13% 13% 13%
US$ MILLIONS, UNAUDITED
As of
June 30 2014 Dec. 31 2013
Total assets $ 16,302 $ 15,682
Corporate borrowings 375 377
Partnership capital5 5,035 5,186
Q2 2014 HIGHLIGHTS
million of FFO
per unit
distribution
$180
KEY PERFORMANCE METRICS
KEY BALANCE SHEET METRICS
See “Reconciliation of Non-IFRS Measures" on page 25
1. Average units outstanding for three and six month period of 210.1 million (2013: 205.7 million and 203.3 million, respectively).
2. Payout ratio is defined as distributions paid (inclusive of GP incentive distributions) divided by FFO.
3. Includes net income attributable to non-controlling interests‒Redeemable Partnership Units held by Brookfield, general partner
and limited partners.
4. AFFO yield is defined as AFFO divided by time weighted average invested capital.
5. Includes partnership capital attributable to non-controlling interests‒Redeemable Partnership Units held by Brookfield, general
partner and limited partners.
• FFO of $180 million was flat as prior year
benefited from contribution from assets that were
sold as part of capital recycling initiative
‒ Year-to-date delivered 12% ‘same store’
annualized FFO per unit growth
• Benefited from increase in utilities rate
base, inflation indexation and higher
volumes predominantly in our transport
business
‒ Per unit FFO declined by 2% to $0.86
‒ AFFO yield of 13% was in-line with prior year
• Distribution of $0.48 per unit represents payout
ratio of 62%
• Net income of $13 million versus $132 million in
same period last year
‒ Prior year included positive impacts from gains
on certain asset sales and hedges
• Total assets marginally ahead of year end
primarily as a result of positive foreign exchange
movements, capital invested in growth projects
and new businesses, partially offset by
depreciation
PERFORMANCE HIGHLIGHTS
per unit FFO
$0.86 $0.48

3
Brookfield Infrastructure Partners L.P.
FINANCING AND LIQUIDITY
• Continued to make strides to strengthen balance sheet
and enhance liquidity
‒ Re-affirmed BIP’s BBB+ investment grade credit
rating with S&P
‒ Completed ~$600 million of debt financings at our
Chilean transmission system and Brazilian toll road
operations at attractive terms
o Modest maturity profile for next five years
‒ ~80% of FFO (generated in non-LATAM currencies)
hedged for next eight quarters
• Total liquidity of $2.5 billion
Q2 2014 HIGHLIGHTS (cont’d)
OPERATIONS
• Added ~$100 million to our utilities capital backlog and
commissioned $42 million into rate base
• Achieved record connection sales activity at our UK
regulated distribution business, with multi-product offerings
up over 40%
• Experienced highest level of capacity utilization (~95%) at
our Australian regulated terminal in the month of June
• Commenced integration efforts at North American west
coast port operations
• Commenced construction of $35 million quay upgrade at
our UK ports business to handle excess volumes
BUSINESS DEVELOPMENT
• Progressed closing conditions of ~$450 million of new
investments:
‒ South American infrastructure logistics business
expected to close in Q3’14
‒ Chicago and Seattle district energy systems
expected to close in August and in Q3’14,
respectively
‒ Gateway container terminal in NY/NJ expected to
close in H2’14
• Signed agreement to acquire natural gas storage business
in California expected to close by the end of Q1’15 (our
share ~$40 million)

4
Brookfield Infrastructure Partners L.P.
OUR BUSINESS
OUR MISSION
• To own and operate a globally diversified portfolio of high quality infrastructure assets that will generate sustainable and growing
dividends over the long term for our unitholders
PERFORMANCE TARGETS AND KEY MEASURES
• Target a 12% to 15% total annual return on invested capital measured over the long term
• Expect to generate returns from in-place cash flows plus growth through investments in upgrades and expansions of our asset base
• AFFO yield is a key performance metric which measures sustainable return on capital deployed
• Growth in FFO per unit is also a key performance metric as it is a proxy for our ability to increase distributions
BASIS OF PRESENTATION
• Our consolidated financial statements are prepared in accordance with International Financial Reporting Standards (IFRS) as issued
by the International Accounting Standards Board (IASB)
• For each operating platform, this Supplemental Information outlines Brookfield Infrastructure’s proportionate share of results in order
to demonstrate the impact of key value drivers of each operating platform on the partnership’s overall performance

5
Brookfield Infrastructure Partners L. P.
DISTRIBUTION PROFILE
• Objective is to pay a distribution that is sustainable on a long-term basis while retaining sufficient liquidity within operations to fund
recurring growth capital expenditures and general corporate requirements
• We believe that a payout of 60-70% of FFO is appropriate
• Targeting 5% to 9% annual distribution growth, in light of expected per unit FFO growth
• Distribution payout is reviewed with the Board of Directors in the first quarter of each year
• The Board of Directors declared a quarterly distribution in the amount of $0.48, payable on September 30, 2014 to unitholders of
record at close of business on August 29, 2014
Distribution has grown at a cumulative annual growth rate of over 10% since the spin-off
• Below is a breakdown of distribution history since the spin-off
US$, UNAUDITED 2008 2009 2010 2011 2012 2013 2014F
Annual Distribution $ 0.88* $ 1.06 $ 1.10 $ 1.32 $ 1.50 $ 1.72 $ 1.92
Growth — — 4% 20% 14% 15% 12%
* 2008 distribution was prorated from spin-off

6
Brookfield Infrastructure Partners L.P.
OUR OPERATIONS
• Own and operate a diversified portfolio of high-quality, long-life utility, transport and energy assets
• Generate stable cash flows with ~90% of adjusted EBITDA supported by regulated or long-term contracts
• Leverage Brookfield’s best in-class operating platforms to extract additional value from investments
Regulated or contractual businesses
which earn a return on their asset
base
• Regulated Terminal
• Electricity Transmission
• Regulated Distribution
• Australasia
• North & South America
• Europe
Provide transportation for freight,
bulk commodities and passengers,
for which we are paid an access fee
• Railroad
• Toll Roads
• Ports
• Australasia
• South America
• Europe & North America
Systems that provide energy
transmission, distribution and storage
services
• Energy Transmission,
Distribution & Storage
• District Energy
• North America
• Europe
• Australasia
Transport
Energy
Utilities
DESCRIPTION ASSET TYPE PRIMARY LOCATION

7
Brookfield Infrastructure Partners L.P.
SELECTED INCOME STATEMENT AND BALANCE SHEET INFORMATION
US$ MILLIONS, UNAUDITED
Three months ended
June 30
Six months ended
June 30
2014 2013 2014 2013
Net income by segment
Utilities $ 35 $ 70 $ 72 $ 65
Transport 17 31 50 30
Energy 1 6 10 15
Corporate and other (40) 25 (87) (6)
Net income $ 13 $ 132 $ 45 $ 104
Adjusted EBITDA by segment
Utilities $ 130 $ 138 $ 256 $ 271
Transport 148 119 292 226
Energy 33 35 77 73
Corporate and other (29) (8) (56) (18)
Adjusted EBITDA $ 282 $ 284 $ 569 $ 552
FFO by segment
Utilities $ 92 $ 96 $ 181 $ 188
Transport 94 83 189 150
Energy 16 18 42 40
Corporate and other (22) (17) (46) (38)
FFO $ 180 $ 180 $ 366 $ 340
STATEMENTS OF OPERATIONS
The following tables present selected income statement and balance sheet information by operating platform on a
proportionate basis:
US$ MILLIONS, UNAUDITED
As of
June 30 December 31
2014 2013
Total assets by segment
Utilities $ 4,940 $ 4,766
Transport 4,937 4,789
Energy 1,666 1,629
Corporate and other (150) (46)
Total assets $ 11,393 $ 11,138
Net debt by segment
Utilities $ 3,081 $ 2,838
Transport 2,382 2,333
Energy 945 927
Corporate and other (50) (146)
Net debt $ 6,358 $ 5,952
Partnership capital by segment
Utilities $ 1,859 $ 1,928
Transport 2,555 2,456
Energy 721 702
Corporate and other (100) 100
Partnership capital $ 5,035 $ 5,186
STATEMENTS OF FINANCIAL POSITION

OPERATING PLATFORMS

9
Brookfield Infrastructure Partners L.P.
UTILITIES OPERATIONS
PLATFORM OVERVIEW
• Businesses that generate long-term returns on
regulated or contractual asset base (rate base)
• Rate base increases with capital that we invest to
upgrade and/or expand our systems
• Virtually all of adjusted EBITDA supported by
regulated or contractual revenues
OBJECTIVES
• Invest capital to increase our rate base
• Earn an attractive return on rate base
• Provide safe and reliable service to our customers
OPERATIONS
• Regulated terminal – one of the world’s largest coal
export terminals in Australia, with 85 Mtpa of
capacity
• Electricity transmission – approximately 10,500 km
of transmission lines in North and South America
• Regulated distribution – approximately 2.1 million
electricity and natural gas connections
1. Return on rate base is adjusted EBITDA divided by time weighted average rate base.
2. Return on rate base excludes impact of connections revenue at our UK regulated distribution business.
The following table presents selected key performance metrics of our utilities platform:
• FFO of $92 million in Q2’14 compared to $83 million on a comparable basis and
$96 million in total in Q2’13
‒ Decrease primarily due to sale of Australasian regulated distribution operation
in Q4’13
o Excluding the impact of sale, FFO increased by $9 million as the business
benefited from higher connections activity at our UK regulated distribution
business, inflation indexation, a larger regulated asset base and lower
costs resulting from margin improvement programs at a number of
operations
US$ MILLIONS, UNAUDITED
Three months ended
June 30
Six months ended
June 30
2014 2013 2014 2013
Rate base $ 4,411 $ 4,580 $ 4,411 $ 4,580
Funds from operations (FFO) $ 92 $ 96 $ 181 $ 188
Maintenance capital (3) (8) (5) (14)
Adjusted funds from operations (AFFO) $ 89 $ 88 $ 176 $ 174
Return on rate base1,2 10% 11% 10% 11%

10
Brookfield Infrastructure Partners L.P.
UTILITIES OPERATIONS CONT’D
The following table presents our utilities platform’s proportionate share of
financial results:
FINANCIAL RESULTS
• Adjusted EBITDA and FFO were $130 million and $92
million, respectively, versus $138 million and $96 million,
respectively, in the prior year
‒ Regulated Distribution – Adjusted EBITDA and FFO
decreased versus prior year primarily due to sale of our
Australasian regulated distribution operation in Q4’13
o Excluding the impact of the sale, results were ahead
of prior year due primarily to improved performance at
our UK regulated distribution business that benefited
from a higher rate base, inflation indexation and
higher connections revenue
‒ Regulated Terminal – Adjusted EBITDA decreased
versus the prior year primarily due to the impact of
foreign exchange
o In natural currency, Adjusted EBITDA was ahead of
prior year, benefitting from additions to rate base
‒ Electricity Transmission – Adjusted EBITDA and FFO
increased versus prior year due to inflation indexation,
commissioning of projects into rate base and lower
operating costs, partially offset by impact of foreign
exchange
The following table presents our proportionate adjusted EBITDA and FFO for each business in this operating platform:
US$ MILLIONS, UNAUDITED
Three months ended
June 30
Six months ended
June 30
2014 2013 2014 2013
Revenue $ 170 $ 198 $ 331 $ 393
Connection revenue 17 14 32 25
Cost attributable to revenues (57) (74) (107) (147)
Adjusted EBITDA 130 138 256 271
Interest expense (40) (45) (79) (88)
Other income 2 3 4 5
Funds from operations (FFO) 92 96 181 188
Depreciation and amortization (40) (40) (79) (82)
Deferred taxes and other items (17) 14 (30) (41)
Net income $ 35 $ 70 $ 72 $ 65
Adjusted EBITDA FFO
Three months ended
June 30
Six months ended
June 30
Three months ended
June 30
Six months ended
June 30
US$ MILLIONS, UNAUDITED 2014 2013 2014 2013 2014 2013 2014 2013
Regulated Distribution $ 51 $ 60 $ 98 $ 113 $ 40 $ 46 $ 76 $ 86
Regulated Terminal 42 44 84 89 23 23 46 46
Electricity Transmission 37 34 74 69 29 27 59 56
Total $ 130 $ 138 $ 256 $ 271 $ 92 $ 96 $ 181 $ 188
11
Brookfield Infrastructure Partners L.P.
UTILITIES OPERATIONS CONT’D
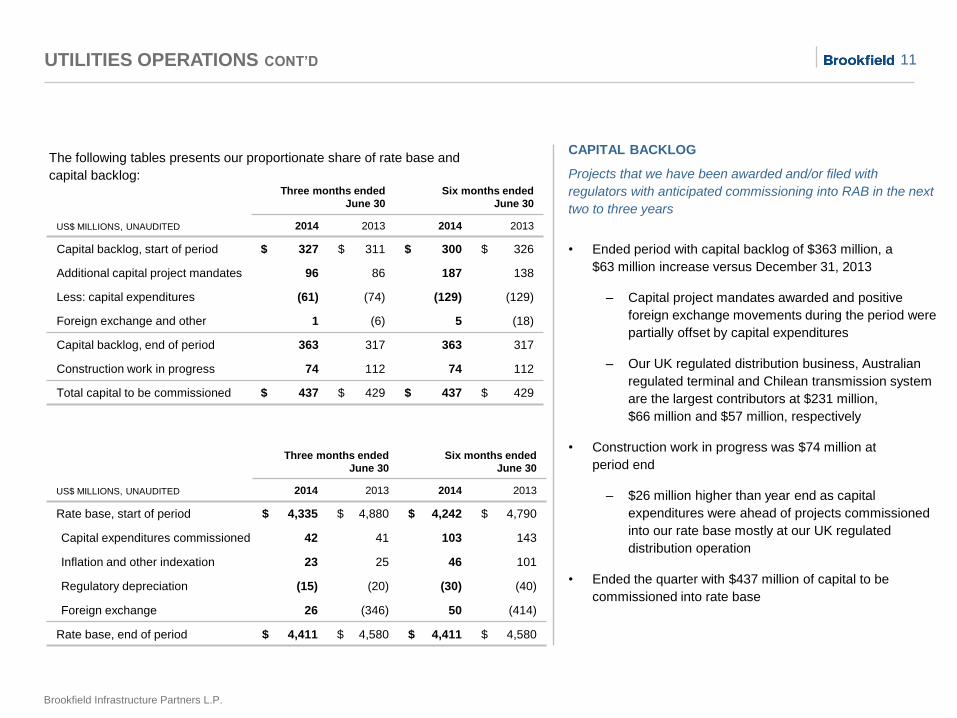
The following tables presents our proportionate share of rate base and
capital backlog:
CAPITAL BACKLOG
Projects that we have been awarded and/or filed with
regulators with anticipated commissioning into RAB in the next
two to three years
• Ended period with capital backlog of $363 million, a
$63 million increase versus December 31, 2013
‒ Capital project mandates awarded and positive
foreign exchange movements during the period were
partially offset by capital expenditures
‒ Our UK regulated distribution business, Australian
regulated terminal and Chilean transmission system
are the largest contributors at $231 million,
$66 million and $57 million, respectively
• Construction work in progress was $74 million at
period end
‒ $26 million higher than year end as capital
expenditures were ahead of projects commissioned
into our rate base mostly at our UK regulated
distribution operation
• Ended the quarter with $437 million of capital to be
commissioned into rate base
US$ MILLIONS, UNAUDITED
Three months ended
June 30
Six months ended
June 30
2014 2013 2014 2013
Capital backlog, start of period $ 327 $ 311 $ 300 $ 326
Additional capital project mandates 96 86 187 138
Less: capital expenditures (61) (74) (129) (129)
Foreign exchange and other 1 (6) 5 (18)
Capital backlog, end of period 363 317 363 317
Construction work in progress 74 112 74 112
Total capital to be commissioned $ 437 $ 429 $ 437 $ 429
US$ MILLIONS, UNAUDITED
Three months ended
June 30
Six months ended
June 30
2014 2013 2014 2013
Rate base, start of period $ 4,335 $ 4,880 $ 4,242 $ 4,790
Capital expenditures commissioned 42 41 103 143
Inflation and other indexation 23 25 46 101
Regulatory depreciation (15) (20) (30) (40)
Foreign exchange 26 (346) 50 (414)
Rate base, end of period $ 4,411 $ 4,580 $ 4,411 $ 4,580

12
Brookfield Infrastructure Partners L.P.
TRANSPORT OPERATIONS
PLATFORM OVERVIEW
• Networks that provide transportation for freight, bulk
commodities and passengers, for which we are paid an
access fee
• Railroad and toll road revenues are subject to regulatory
price ceilings, while ports are primarily unregulated
OBJECTIVES
• Increase throughput of existing assets
• Expand networks in a capital efficient manner to support
incremental customer demand
• Provide safe and reliable service for our customers
OPERATIONS
• Railroad – sole provider of rail service in Southwestern
Western Australia with approximately 5,100 kilometres of
track
• Toll Roads – Approximately 3,200 kilometres of
motorways in Brazil and Chile
• Ports – 30 terminals in North America, UK and across
Europe
1. Adjusted EBITDA margin is adjusted EBITDA divided by revenues.
The following table presents selected key performance metrics for our
transport platform:
• FFO of $94 million in Q2’14 compared to $83 million in Q2’13
‒ Primarily driven by contribution from both the additional investment in
our Brazilian toll road operation in Q3’13 and the acquisition of our North
American west coast port operations in Q1’14
‒ Also benefited from improved results at our UK port as economic
conditions continue to improve in the region and at our Australian
railroad where we benefited from higher volumes from a bumper grain
harvest
‒ Results were partially offset by interest income at our railroad associated
with a stamp tax duty refund that was received in the prior year
US$ MILLIONS, UNAUDITED
Three months ended
June 30
Six months ended
June 30
2014 2013 2014 2013
Growth capital expenditures $ 81 $ 34 $ 147 $ 82
Adjusted EBITDA margin1 48% 47% 49% 45%
Funds from operations (FFO) 94 83 189 150
Maintenance capital (18) (12) (36) (26)
Adjusted funds from operations (AFFO) $ 76 $ 71 $ 153 $ 124

13
Brookfield Infrastructure Partners L.P.
TRANSPORT OPERATIONS CONT’D
The following table presents our transport platform’s proportionate share
of financial results:
FINANCIAL RESULTS
• Adjusted EBITDA and FFO were $148 million and $94
million, respectively, versus $119 million and $83 million,
respectively, in the prior year
‒ Railroad – Adjusted EBITDA increased versus prior year
due to higher volumes from a bumper grain harvest
o FFO declined as improved EBITDA more than offset
by $6 million of interest income associated with a
stamp duty tax refund that was received in prior year
‒ Toll roads – Adjusted EBITDA and FFO increased versus
prior year primarily due to additional investment in our
Brazilian toll roads completed in Q3’13
o On a same store basis, toll revenues increased 5%
from prior year driven by tariff increases and higher
volumes on Chilean roads
‒ Ports – Adjusted EBITDA and FFO increased versus prior
year due to improved volumes as economic conditions in
the region continue to improve as well as contribution
from investment in our N.A. west coast port operations
o FFO also benefited from lower borrowing costs from
refinancing at our European operations at end of
Q2’13
The following table presents our proportionate adjusted EBITDA and FFO for each business in this operating platform:
US$ MILLIONS, UNAUDITED
Three months ended
June 30
Six months ended
June 30
2014 2013 2014 2013
Revenue $ 309 $ 252 $ 595 $ 504
Cost attributable to revenues (161) (133) (303) (278)
Adjusted EBITDA 148 119 292 226
Interest expense (45) (38) (87) (74)
Other (expense) income (9) 2 (16) (2)
Funds from operations (FFO) 94 83 189 150
Depreciation and amortization (59) (42) (120) (93)
Deferred taxes and other items (18) (10) (19) (27)
Net income $ 17 $ 31 $ 50 $ 30
Adjusted EBITDA FFO
Three months ended
June 30
Six months ended
June 30
Three months ended
June 30
Six months ended
June 30
US$ MILLIONS, UNAUDITED 2014 2013 2014 2013 2014 2013 2014 2013
Railroad $ 67 $ 66 $ 132 $ 123 $ 47 $ 52 $ 96 $ 94
Toll roads 60 35 120 67 33 20 67 36
Ports 21 18 40 36 14 11 26 20
Total $ 148 $ 119 $ 292 $ 226 $ 94 $ 83 $ 189 $ 150

14
Brookfield Infrastructure Partners L.P.
TRANSPORT OPERATIONS CONT’D
As of
US$ MILLIONS, UNAUDITED June 30, 2014 December 31, 2013
Growth capital backlog
Railroad $ 98 $ 108
Toll roads 341 245
Ports 20 20
Total growth capital to be commissioned $ 459 $ 373
CAPITAL BACKLOG
Enhancements to our networks over the next two to three years that will expand capacity to support additional volumes, leading to
cash flow growth over the long term
The following tables presents our proportionate share of growth capital backlog:
• Consists of the following types of projects:
‒ Railroad
o Upgrading the integrity of our network to support incremental volumes by allowing for longer and faster trains to go through
our systems
‒ Toll roads
o Increasing the capacity of our roads by increasing and widening lanes on certain routes to support growing traffic
‒ Ports
o Increasing capacity of our terminals by deepening the berths and enhancing and modernizing our existing infrastructure
15
Brookfield Infrastructure Partners L.P.
US$ MILLIONS, UNAUDITED
Three months ended
June 30
Six months ended
June 30
2014 2013 2014 2013
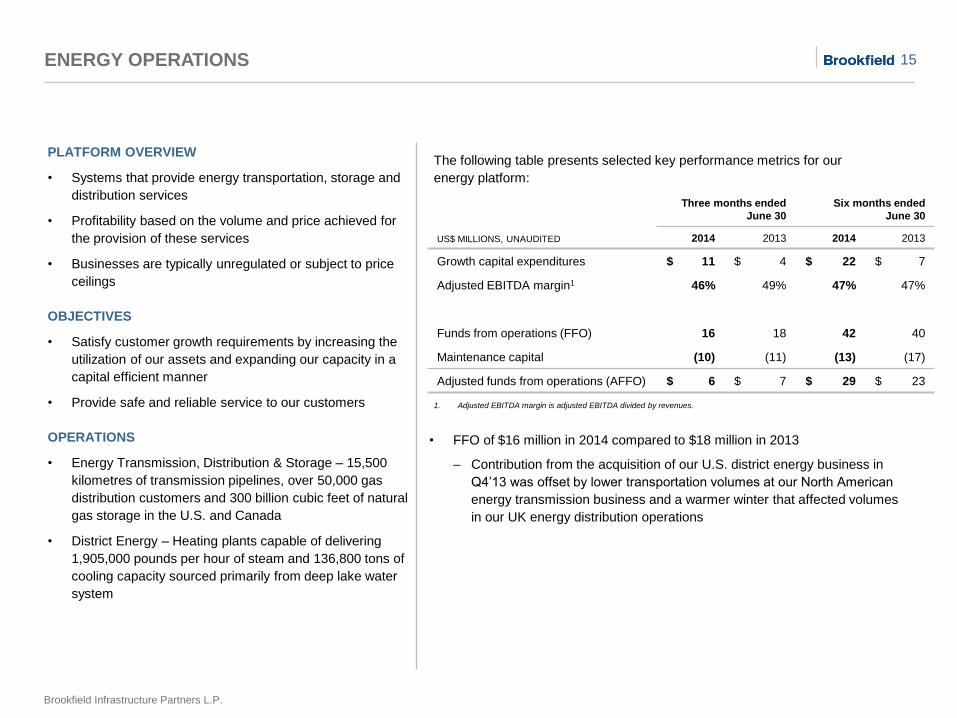
Growth capital expenditures $ 11 $ 4 $ 22 $ 7
Adjusted EBITDA margin1 46% 49% 47% 47%
Funds from operations (FFO) 16 18 42 40
Maintenance capital (10) (11) (13) (17)
Adjusted funds from operations (AFFO) $ 6 $ 7 $ 29 $ 23
ENERGY OPERATIONS
PLATFORM OVERVIEW
• Systems that provide energy transportation, storage and
distribution services
• Profitability based on the volume and price achieved for
the provision of these services
• Businesses are typically unregulated or subject to price
ceilings
OBJECTIVES
• Satisfy customer growth requirements by increasing the
utilization of our assets and expanding our capacity in a
capital efficient manner
• Provide safe and reliable service to our customers
OPERATIONS
• Energy Transmission, Distribution & Storage – 15,500
kilometres of transmission pipelines, over 50,000 gas
distribution customers and 300 billion cubic feet of natural
gas storage in the U.S. and Canada
• District Energy – Heating plants capable of delivering
1,905,000 pounds per hour of steam and 136,800 tons of
cooling capacity sourced primarily from deep lake water
system
1. Adjusted EBITDA margin is adjusted EBITDA divided by revenues.
The following table presents selected key performance metrics for our
energy platform:
• FFO of $16 million in 2014 compared to $18 million in 2013
‒ Contribution from the acquisition of our U.S. district energy business in
Q4’13 was offset by lower transportation volumes at our North American
energy transmission business and a warmer winter that affected volumes
in our UK energy distribution operations

16
Brookfield Infrastructure Partners L.P.
ENERGY OPERATIONS CONT’D
The following table presents our energy platform’s proportionate share of
financial results:
FINANCIAL RESULTS
• Adjusted EBITDA and FFO were $33 million and
$16 million, respectively, versus $35 million and
$18 million, respectively, in the prior year
‒ Energy Transmission, Distribution & Storage –
Adjusted EBITDA and FFO decreased versus
prior year as results were impacted by lower
transportation volumes at our North American
energy transmission business and mild
weather in the UK which negatively impacted
volumes at our UK distribution operations
‒ District Energy – Adjusted EBITDA and FFO
increased from the prior year as a result of the
acquisition of our U.S. district energy business
in Q4’13
The following table presents our proportionate adjusted EBITDA and FFO for each business in this operating platform:
US$ MILLIONS, UNAUDITED
Three months ended
June 30
Six months ended
June 30
2014 2013 2014 2013
Revenue $ 72 $ 72 $ 163 $ 155
Cost attributable to revenues (39) (37) (86) (82)
Adjusted EBITDA 33 35 77 73
Interest expense (17) (17) (35) (34)
Other income — — — 1
Funds from operations (FFO) 16 18 42 40
Depreciation and amortization (17) (17) (34) (34)
Deferred taxes and other items 2 5 2 9
Net income $ 1 $ 6 $ 10 $ 15
Adjusted EBITDA FFO
Three months ended
June 30
Six months ended
June 30
Three months ended
June 30
Six months ended
June 30
US$ MILLIONS, UNAUDITED 2014 2013 2014 2013 2014 2013 2014 2013
Energy Transmission, Distribution & Storage $ 30 $ 33 $ 71 $ 68 $ 14 $ 17 $ 38 $ 37
District Energy 3 2 6 5 2 1 4 3
Total $ 33 $ 35 $ 77 $ 73 $ 16 $ 18 $ 42 $ 40

17
Brookfield Infrastructure Partners L.P.
CORPORATE AND OTHER
The following table presents the components of corporate and other on a
proportionate basis: FINANCIAL RESULTS
• General and administrative costs were in-line with prior year
‒ Anticipate corporate and administrative costs of
$8 million to $10 million per year, excluding base
management fee
• We pay Brookfield an annual base management fee equal to
1.25% of our market value, plus recourse debt net of cash
‒ Base management fee increased versus the prior year
due to increase in market capitalization from our
higher unit trading price
• Corporate financing costs include interest expense and
standby fees on committed credit facility, less interest
earned on cash balances
‒ Corporate financing costs were flat as corporate
borrowings were consistent year over year
• Other income includes interest and distribution income, as
well as realized gains earned on corporate financial assets
US$ MILLIONS, UNAUDITED
Three months ended
June 30
Six months ended
June 30
2014 2013 2014 2013
Timber EBITDA $ — $ 18 $ — $ 36
General and administrative costs (2) (2) (4) (4)
Base management fee (27) (24) (52) (50)
Adjusted EBITDA (29) (8) (56) (18)
Other income 10 — 16 —
Financing costs
- Timber — (6) — (12)
- Corporate (3) (3) (6) (8)
Funds from operations (FFO) (22) (17) (46) (38)
Deferred taxes and other items (18) 42 (41) 32
Net (loss) income $ (40) $ 25 $ (87) $ (6)

18
Brookfield Infrastructure Partners L.P.
LIQUIDITY
Our total liquidity was ~$2.5 billion at June 30, 2014, and was comprised of the following:
• We maintain sufficient liquidity at all times to participate in attractive opportunities as they arise, withstand sudden adverse
changes in economic circumstances and maintain a relatively high payout of our FFO to unitholders
• Principal sources of liquidity are cash flows from operations, undrawn credit facilities and access to public and private capital
markets
• We may, from time to time, invest in financial assets comprised mainly of liquid equity and debt infrastructure securities in order
to earn attractive short-term returns and for strategic purposes
US$ MILLIONS, UNAUDITED
As of
June 30, 2014 December 31, 2013
Corporate cash and financial assets $ 425 $ 523
Committed corporate credit facility 1,400 1,400
Draws under corporate credit facility – –
Commitments under corporate credit facility (89) (99)
Proportionate cash retained in businesses 335 330
Proportionate availability under subsidiary credit facilities 437 428
Total liquidity $ 2,508 $ 2,582

19
Brookfield Infrastructure Partners L.P.
MATURITY PROFILE
On a proportionate basis as of June 30, 2014, scheduled principal repayments over the next five years are as follows:
We finance our assets principally at the operating company level with debt that generally has long-term maturities, few restrictive
covenants and no recourse to either Brookfield Infrastructure or our other operations.
US$ MILLIONS, UNAUDITED
Average
Term
(years) 2014 2015 2016 2017 2018 Beyond Total
Recourse borrowings
Net corporate borrowings 3 $ — $ — $ — $ 375 $ — $ — $ 375
Total recourse borrowings 3 — — — 375 — — 375
Utilities
Regulated Distribution 12 — — 37 16 — 960 1,013
Regulated Terminal 7 — 21 234 — — 979 1,234
Electricity Transmission 12 6 8 81 64 5 722 886
10 6 29 352 80 5 2,661 3,133
Transport
Railroad 9 — — 20 — — 1,093 1,113
Toll Roads 9 8 274 13 71 13 658 1,037
Ports 6 15 42 49 10 224 127 467
7 23 316 82 81 237 1,878 2,617
Energy
Energy Transmission, Distribution & Storage 7 17 1 — 498 — 388 904
District Energy 20 — — 22 — — 67 89
8 17 1 22 498 — 455 993
Total non-recourse borrowings 10 46 346 456 659 242 4,994 6,743
Total borrowings 10 $ 46 $ 346 $ 456 $ 1,034 $ 242 $ 4,994 $ 7,118
1% 5% 6% 15% 3% 70% 100%

20
Brookfield Infrastructure Partners L.P.
PROPORTIONATE NET DEBT
The following table presents proportionate net debt by operating platform:
US$ MILLIONS, UNAUDITED
As of
June 30, 2014 December 31, 2013
Non-recourse borrowings
Utilities $ 3,133 $ 2,899
Transport 2,617 2,542
Energy 993 987
Corporate & Other 375 377
Total borrowings $ 7,118 $ 6,805
Cash retained in businesses
Utilities $ 52 $ 61
Transport 235 209
Energy 48 60
Corporate & Other 425 523
Total cash retained $ 760 $ 853
Net debt
Utilities $ 3,081 $ 2,838
Transport 2,382 2,333
Energy 945 927
Corporate & Other (50) (146)
Total net debt $ 6,358 $ 5,952
• Average cash interest rates for our utilities, transport, energy and corporate platforms were 5.1%, 6.8%, 6.8% and 2.9%, respectively
• Weighted average cash interest rate is 5.9% for the overall business

21
Brookfield Infrastructure Partners L.P.
FOREIGN CURRENCY HEDGING STRATEGY
• As at June 30, 2014, hedges in place are equal to 70% of net equity in foreign currencies
• We have also implemented an FFO hedging strategy and have hedged approximately 80% of our expected FFO over the next
eight quarters that is generated in AUD, GBP, CAD and EUR
• For the three months ended June 30, 2014, 4%, 39% and 29% of our FFO was generated in USD, AUD and GBP, respectively
• Due to our FFO hedging program, 64%, 8% and 6% of our FFO was effectively generated in USD, AUD and GBP, respectively
To the extent that it is economic to do so, we hedge a portion of our equity investments and/or cash flows exposed to foreign
currencies. The following principles form the basis of our foreign currency hedging strategy:
• We leverage any natural hedges that may exist within our operations
• We utilize local currency debt financing to the extent possible
• We may utilize derivative contracts to the extent that natural hedges are insufficient
The following table presents our hedged position in foreign currencies as at June 30, 2014:
US$ MILLIONS, UNAUDITED
Net Investment Hedges
USD AUD GBP BRL CLP CAD EUR COP
Net equity Investment – US$ $ 876 $ 1,681 $ 959 $ 825 $ 293 $ 168 $ 163 $ 70
FX contracts – US$ 2,928 (1,542) (959) (114) — (168) (145) —
Net unhedged – US$ $ 3,804 $ 139 $ — $ 711 $ 293 $ — $ 18 $ 70
% of equity investment hedged N/A 92% 100% 14% —% 100% 89% —%

22
Brookfield Infrastructure Partners L.P.
CAPITAL REINVESTMENT
• Financing plan:
‒ We fund recurring growth capital expenditures with cash flow generated by operations, as well as debt financing that is sized
to maintain credit profile
‒ To fund large scale development projects and acquisitions, we will evaluate a number of capital sources including proceeds
from the sale of non-core assets as well as equity and debt financings
The following table highlights the sources and uses of cash during the quarter:
US$ MILLIONS, UNAUDITED
Three months ended June 30 Six months ended June 30
2014 2013 2014 2013
Funds from operations (FFO) $ 180 $ 180 $ 366 $ 340
Maintenance capital (31) (31) (54) (57)
Funds available for distribution (AFFO) 149 149 312 283
Distributions paid (112) (98) (224) (192)
Funds available for reinvestment 37 51 88 91
Growth capital expenditures (153) (112) (298) (218)
Asset level debt funding of growth capex 140 86 211 135
New investments, net of disposals — 200 (39) 183
Project level (repayments) draws (24) (24) (51) 266
Repayments on corporate credit facility — (324) — (546)
Proceeds from equity issuance — 331 — 331
Changes in working capital and other (35) (15) (4) (37)
Change in proportionate cash (35) 193 (93) 205
Opening, proportionate cash 795 222 853 210
Closing, proportionate cash $ 760 $ 415 $ 760 $ 415

23
Brookfield Infrastructure Partners L.P.
CAPITAL REINVESTMENT CONT’D
Three months ended June 30 Six months ended June 30
US$ MILLIONS, UNAUDITED 2014 2013 2014 2013
Growth capital expenditures by segment
Utilities $ 61 $ 74 $ 129 $ 129
Transport 81 34 147 82
Energy 11 4 22 7
Total $ 153 $ 112 $ 298 $ 218
The following tables present the components of growth and maintenance capital expenditures by operating platform:
• We estimate annual maintenance capital expenditures of $15-20 million, $80-90 million and $25-35 million for our Utilities,
Transport and Energy operations, respectively, for a total range between $120-145 million
Three months ended June 30 Six months ended June 30
US$ MILLIONS, UNAUDITED 2014 2013 2014 2013
Maintenance capital expenditures by segment
Utilities $ 3 $ 8 $ 5 $ 14
Transport 18 12 36 26
Energy 10 11 13 17
Total $ 31 $ 31 $ 54 $ 57

24
Brookfield Infrastructure Partners L.P.
PARTNERSHIP CAPITAL
MILLIONS OF PARTNERSHIP UNITS, UNAUDITED
As of
June 30, 2014 December 31, 2013
Redeemable partnership unit 58.7 58.7
Limited partnership unit 150.3 150.2
General partnership unit 1.1 1.1
Total partnership units 210.1 210.0
• The general partner may be entitled to incentive distribution rights, as follows:
‒ To the extent distributions on partnership units are greater than $0.305, the general partner is entitled to 15% of
incremental distributions above this threshold until distributions reach $0.33 per unit;
‒ To the extent distributions on partnership units are greater than $0.33, the general partner is entitled to 25% of
incremental distributions above this threshold
• Incentive distributions of $11 million were paid during the quarter versus $8 million in the prior year as a result of the
12% increase in our distribution on partnership units from 2013
The total number of partnership units outstanding was comprised of the following:

APPENDIX – RECONCILIATION OF NON-IFRS FINANCIAL MEASURES

26
Brookfield Infrastructure Partners L.P.
RECONCILIATION OF NON-IFRS MEASURES TO IFRS MEASURES
RECONCILIATION OF NET INCOME1 TO FUNDS FROM OPERATIONS
1. Includes net income attributable to non-controlling interest – Redeemable Partnership units held by Brookfield, general partner and limited partners.
US$ MILLIONS, UNAUDITED
Three months ended June 30 Six months ended June 30
2014 2013 2014 2013
Net income attributable to partnership1 $ 13 $ 132 $ 45 $ 104
Add back or deduct the following:
Depreciation and amortization 116 99 233 209
Deferred income taxes 2 57 1 34
Mark-to-market on hedging items 19 (75) 35 (30)
Valuation losses (gains) and other 30 (33) 52 23
FFO 180 180 366 340
Maintenance capital expenditures (31) (31) (54) (57)
AFFO $ 149 $ 149 $ 312 $ 283

27
Brookfield Infrastructure Partners L.P.
Brookfield Infrastructure’s Share
FOR THE THREE MONTHS ENDED JUNE 30, 2014
US$ MILLIONS, UNAUDITED Utilities Transport Energy Other
Brookfield
Infrastructure
Contribution
from
investments
in associates
Attributable
to non-
controlling
interest
As per IFRS
financials
Revenues $ 187 $ 309 $ 72 $ — $ 568 $ (228) $ 148 $ 488
Costs attributed to revenues (57) (161) (39) — (257) 117 (75) (215)
General and administrative costs — — — (29) (29) — — (29)
Adjusted EBITDA 130 148 33 (29) 282 (111) 73
Other income (expense) 2 (9) — 10 3 5 (2) 6
Interest expense (40) (45) (17) (3) (105) 41 (26) (90)
FFO 92 94 16 (22) 180 (65) 45
Depreciation and amortization (40) (59) (17) — (116) 49 (27) (94)
Deferred taxes (9) 3 3 1 (2) (8) (6) (16)
Mark-to-market on hedging items 2 (2) — (19) (19) (3) — (22)
Valuation (losses) gains and other (10) (19) (1) — (30) 26 17 13
Share of earnings from associates — — — — — 1 — 1
Net income attributable to non-
controlling interest — — — — — — (29) (29)
Net income (loss) attributable to partnership1 $ 35 $ 17 $ 1 $ (40) $ 13 $ — $ — $ 13
RECONCILIATION OF NON-IFRS MEASURES TO IFRS MEASURES CONT’D
RECONCILIATION OF PROPORTIONATE OPERATING RESULTS TO CONSOLIDATED OPERATING RESULTS
1. Includes net income (loss) attributable to non-controlling interest – Redeemable Partnership units held by Brookfield, general partner and limited partners.

28
Brookfield Infrastructure Partners L.P.
RECONCILIATION OF NON-IFRS MEASURES TO IFRS MEASURES CONT’D
RECONCILIATION OF PROPORTIONATE OPERATING RESULTS TO CONSOLIDATED OPERATING RESULTS
1. Includes net income attributable to non-controlling interest – Redeemable Partnership units held by Brookfield, general partner and limited partners.
Brookfield Infrastructure’s Share
FOR THE THREE MONTHS ENDED JUNE 30, 2013
US$ MILLIONS, UNAUDITED Utilities Transport Energy Other
Brookfield
Infrastructure
Contribution
from
investments
in associates
Attributable
to non-
controlling
interest
Discontinued
Operations
As per IFRS
financials
Revenues $ 212 $ 252 $ 72 $ 38 $ 574 $ (210) $ 136 $ (38) $ 462
Costs attributed to revenues (74) (133) (37) (20) (264) 111 (69) 20 (202)
General and administrative costs — — — (26) (26) — — — (26)
Adjusted EBITDA 138 119 35 (8) 284 (99) 67 (18)
Other income (expense) 3 2 — — 5 2 (5) — 2
Interest expense (45) (38) (17) (9) (109) 37 (24) 6 (90)
FFO 96 83 18 (17) 180 (60) 38 (12)
Depreciation and amortization (40) (42) (17) — (99) 39 (23) — (83)
Deferred taxes (15) (11) 3 (34) (57) 1 — 25 (31)
Mark-to-market on hedging items 37 (1) 3 36 75 — 18 — 93
Valuation (losses) gains and other (8) 2 (1) 40 33 2 (6) (22) 7
Share of earnings from associates — — — — — 18 — — 18
Income from discontinued
operations, net of tax — — — — — — — 35 35
Net income attributable to non-
controlling interest — — — — — — (27) (26) (53)
Net income attributable to partnership1 $ 70 $ 31 $ 6 $ 25 $ 132 $ — $ — $ — $ 132

29
Brookfield Infrastructure Partners L.P.
Brookfield Infrastructure’s Share
FOR THE SIX MONTHS ENDED JUNE 30, 2014
US$ MILLIONS, UNAUDITED Utilities Transport Energy Other
Brookfield
Infrastructure
Contribution
from
investments
in associates
Attributable to
non-
controlling
interest
As per IFRS
financials
Revenues $ 363 $ 595 $ 163 $ — $ 1,121 $ (451) $ 298 $ 968
Costs attributed to revenues (107) (303) (86) — (496) 222 (153) (427)
General and administrative costs — — — (56) (56) — — (56)
Adjusted EBITDA 256 292 77 (56) 569 (229) 145
Other income (expense) 4 (16) — 16 4 8 (3) 9
Interest expense (79) (87) (35) (6) (207) 81 (51) (177)
FFO 181 189 42 (46) 366 (140) 91
Depreciation and amortization (79) (120) (34) — (233) 100 (52) (185)
Deferred taxes (15) 10 (1) 5 (1) (14) (7) (22)
Mark-to-market on hedging items 4 3 — (42) (35) (3) — (38)
Valuation (losses) gains and other (19) (32) 3 (4) (52) 44 9 1
Share of earnings from associates — — — — — 13 — 13
Net income attributable to non-
controlling interest — — — — — — (41) (41)
Net income (loss) attributable to partnership1 $ 72 $ 50 $ 10 $ (87) $ 45 $ — $ — $ 45
RECONCILIATION OF NON-IFRS MEASURES TO IFRS MEASURES CONT’D
RECONCILIATION OF PROPORTIONATE OPERATING RESULTS TO CONSOLIDATED OPERATING RESULTS
1. Includes net income (loss) attributable to non-controlling interest – Redeemable Partnership units held by Brookfield, general partner and limited partners

30
Brookfield Infrastructure Partners L.P.
RECONCILIATION OF NON-IFRS MEASURES TO IFRS MEASURES CONT’D
RECONCILIATION OF PROPORTIONATE OPERATING RESULTS TO CONSOLIDATED OPERATING RESULTS
1. Includes net income (loss) attributable to non-controlling interest – Redeemable Partnership units held by Brookfield, general partner and limited partners
Brookfield Infrastructure’s Share
FOR THE SIX MONTHS ENDED JUNE 30, 2013
US$ MILLIONS, UNAUDITED Utilities Transport Energy Other
Brookfield
Infrastructure
Contribution
from
investments
in associates
Attributable
to non-
controlling
interest
Discontinued
Operations
As per IFRS
financials
Revenues $ 418 $ 504 $ 155 $ 76 $ 1,153 $ (428) $ 276 $ (76) $ 925
Costs attributed to revenues (147) (278) (82) (40) (547) 227 (144) 40 (424)
General and administrative costs — — — (54) (54) — — — (54)
Adjusted EBITDA 271 226 73 (18) 552 (201) 132 (36)
Other income (expense) 5 (2) 1 — 4 4 (7) — 1
Interest expense (88) (74) (34) (20) (216) 76 (49) 12 (177)
FFO 188 150 40 (38) 340 (121) 76 (24)
Depreciation and amortization (82) (93) (34) — (209) 88 (48) — (169)
Deferred taxes (14) 7 9 (36) (34) (4) 7 25 (6)
Mark-to-market on hedging items (6) — 3 33 30 (6) 7 — 31
Valuation (losses) gains and other (21) (34) (3) 35 (23) 8 (3) (16) (34)
Share of earnings from associates — — — — — 35 — — 35
Income from discontinued
operations, net of tax — — — — — — — 56 56
Net income attributable to non-
controlling interest — — — — — — (39) (41) (80)
Net income (loss) attributable to
partnership1 $ 65 $ 30 $ 15 $ (6) $ 104 $ — $ — $ — $ 104

31
Brookfield Infrastructure Partners L.P.
RECONCILIATION OF NON-IFRS MEASURES TO IFRS MEASURES CONT’D
1. Cumulative differences are comprised of total cumulative maintenance capital expenditures, non-cash statement of operating results items and other adjustments since capital was invested.
US$ MILLIONS, UNAUDITED Total
Partnership capital $ 5,035
Cumulative differences1 666
Maintenance capital expenditures (54)
Non-cash statement of operating results items 321
Accumulated other comprehensive income and other (1,203)
Invested capital $ 4,765
Weighted average invested capital
‒ three months ended June 30, 2014 $ 4,747
‒ six months ended June 30, 2014 $ 4,721
RECONCILIATION OF PARTNERSHIP CAPITAL TO INVESTED CAPITAL – AS AT JUNE 30, 2014
RECONCILIATION OF PARTNERSHIP CAPITAL TO INVESTED CAPITAL – AS AT JUNE 30, 2013
US$ MILLIONS, UNAUDITED Total
Partnership capital $ 5,055
Cumulative differences1 56
Maintenance capital expenditures (57)
Non-cash statement of operating results items 236
Accumulated other comprehensive income and other (691)
Invested capital $ 4,599
Weighted average invested capital
‒ three months ended June 30, 2013 $ 4,408
‒ six months ended June 30, 2013 $ 4,387

32
Brookfield Infrastructure Partners L.P.
RECONCILIATION OF NON-IFRS MEASURES TO IFRS MEASURES CONT’D
Total Attributable to Brookfield Infrastructure
US$ MILLIONS, UNAUDITED Utilities Transport Energy Other
Brookfield
Infrastructure
Contribution
from
investment
in
associates
Attributable
to non-
controlling
interest
Working
capital
adjustment
As per IFRS
financials 1
Total assets $4,940 $4,937 $1,666 $(150) $11,393 $(2,080) $4,250 $2,739 $16,302
1. The above tables provide each segment’s assets in the format that management organizes its segments to make operating decisions and assess performance. Each segment is presented on a proportionate basis, taking into account
Brookfield Infrastructure’s ownership in operations using consolidation and the equity method whereby the Partnership either controls or exercises significant influence over the investment respectively. The above table reconciles Brookfield
Infrastructure’s proportionate assets to total assets presented on the Partnership’s consolidated statements of financial pos ition by removing net liabilities contained within investments in associates, reflecting the assets attributable to non-
controlling interests, and adjusting for working capital assets which are netted against working capital liabilities.
RECONCILIATION OF PROPORTIONATE ASSETS TO CONSOLIDATED ASSETS – AS AT JUNE 30, 2014
RECONCILIATION OF PROPORTIONATE ASSETS TO CONSOLIDATED ASSETS – AS AT DECEMBER 31, 2013
Total Attributable to Brookfield Infrastructure
US$ MILLIONS, UNAUDITED Utilities Transport Energy
Corporate
& Other
Brookfield
Infrastructure
Contribution
from
investment
in
associates
Attributable
to non-
controlling
interest
Working
capital
adjustment
As per IFRS
financials 1
Total assets $4,766 $4,789 $1,629 $(46) $11,138 $(2,156) $3,899 $2,801 $15,682

33
Brookfield Infrastructure Partners L.P.
US$ MILLIONS, UNAUDITED
As of
June 30,
2014
December 31,
2013
Consolidated debt $ 6,440 $ 6,167
Less: borrowings attributable to non-controlling interest (1,769) (1,675)
Premium on debt and cross currency swaps 38 (67)
Add: proportionate share of borrowings of investment in associates
Utilities 703 716
Transport 934 885
Energy 772 779
Proportionate debt $ 7,118 $ 6,805
RECONCILIATION OF NON-IFRS MEASURES TO IFRS MEASURES CONT’D
RECONCILIATION OF CONSOLIDATED DEBT TO PROPORTIONATE DEBT

34
Brookfield Infrastructure Partners L.P.
USE OF NON-IFRS MEASURES
• Funds from operations (FFO), adjusted funds from operations (AFFO), adjusted EBITDA, invested capital and their per
share equivalents, where applicable, are non-IFRS measures which do not have any standard meaning prescribed by IFRS and
therefore may not be comparable to similar measures presented by other companies
‒ FFO, AFFO and invested capital are reconciled to Net Income and Partnership capital, respectively, the closest measures
determined under IFRS on pages 26 and 31, respectively
• FFO is defined as net income excluding the impact of depreciation and amortization, deferred income taxes, breakage and
transaction costs, non-cash valuation gains or losses, and other items
‒ Brookfield Infrastructure uses FFO to assess its operating results
• Adjusted EBITDA is defined as FFO excluding the impact of interest expense, and other income or expenses
‒ Brookfield Infrastructure uses Adjusted EBITDA as a measure of operating performance
• AFFO is a measure of our sustainable cash flow and is calculated as FFO less maintenance capital expenditures
‒ In order to assess our performance as stewards of capital, we also focus on AFFO yield, which is a proxy for our returns on
invested capital
• Invested capital is meant to track the initial investment that we make in a business plus all cash flow that we re-invest in the
business