supplementary data -...
TRANSCRIPT

SUPPLEMENTARY DATA
©2018 American Diabetes Association. Published online at http://care.diabetesjournals.org/lookup/suppl/doi:10.2337/dc18-0343/-/DC1
1
Supplement to
Sotagliflozin in Combination with Optimized Insulin Therapy in Adults with Type 1
Diabetes: The North American inTandem1 Study
John B. Buse1, Satish K. Garg2, Julio Rosenstock3, Timothy S. Bailey4, Phillip Banks5, Bruce W.
Bode6, Thomas Danne7, Jake A. Kushner8, Wendy S. Lane9, Pablo Lapuerta5, Darren K.
McGuire10, Anne L. Peters11, John Reed12, Sangeeta Sawhney5, and Paul Strumph5
SUPPLEMENTARY DATA
©2018 American Diabetes Association. Published online at http://care.diabetesjournals.org/lookup/suppl/doi:10.2337/dc18-0343/-/DC1
2
Principal Investigators List
Andrew Ahmann, Oregon Health & Science University, Portland, OR, USA; Buki Ajala, LMC
Diabetes and Endocrinology, Calgary, Alberta, Canada; Laura Akright, Northeast Endocrinology
Associates, PA, Schertz, TX, USA; Amer Al-Karadsheh, The Endocrine Center Research
Consultants, Houston, TX, USA; Hani Alasaad, LMC Diabetes and Endocrinology, Barrie,
Ontario, Canada; Stephen Aronoff, Research Institute of Dallas, , Dallas, TX, USA; Ronnie
Aronson, LMC Diabetes and Endocrinology, Toronto, Ontario, Canada; Timothy Bailey, AMCR
Institute, Inc., Escondido, CA, USA; Arti Bhan, Henry Ford Hospital, Detroit, MI, USA; Bruce
Bode, Atlanta Diabetes Associates, Atlanta, GA, USA; John Buse, UNC Health Care System,
Chapel Hill, NC, USA; Tira Chaica Brom, Texas Diabetes and Endocrinology, Austin, TX,
USA; Mark Christiansen, Diablo Clinical Research, Walnut Creek, CA, USA; Elena
Christofides, Endocrinology Associates, Inc, Columbus, OH, USA; Jay Cohen, The Endocrine
Clinic, PC, Memphis, TN, USA; Thomas Elliott, Vancouver General Hospital, Vancouver, BC,
Canada; Norman Fishman, Diabetes Endocrinology Specialists, Inc., Chesterfield, MO, USA;
David Fitz-Patrick, East-West Medical Research Institute, Honolulu, HI, USA; Juan Pablo, Frias,
National Research Institute, Los Angeles, CA, USA; Satish Garg, Barbara Davis Center,
University of Colorado Denver, Aurora, CO; USA; W. Timothy Garvey, University of Alabama
at Birmingham, Birmingham, AL, USA; Linda Gaudiani, Marin Endocrine Care and Research,
Inc., Greenbrae, CA, USA; Gregg Gerety, AMC Division of Community Endocrinology,
Albany, NY, USA; Ronald Goldenberg, LMC Diabetes and Endocrinology, Thornhill, Ontario,
Canada; Carl Griffin, Lynn Health Science Institute (LHSI), Oklahoma City, OK, USA; Yehuda
Handelsman, Metabolic Institute of America, Tarzana, CA, USA; Priscilla Hollander, Baylor
Endocrine Center, Dallas, TX, USA; Barry Horowitz, Metabolic Research Institute, Inc., West
SUPPLEMENTARY DATA
©2018 American Diabetes Association. Published online at http://care.diabetesjournals.org/lookup/suppl/doi:10.2337/dc18-0343/-/DC1
3
Palm Beach, FL, USA; Irene Hramiak, St. Joseph's Health Care, London, Ontario, Canada;
David Huffman, University Diabetes & Endocrine Consultants, Chattanooga, TN, USA; Michael
Jardula, Desert Oasis Healthcare Medical Group, Palm Springs, CA, USA; Erin Keely, Ottawa
Hospital, Riverside Campus, Ottawa, Ontario, Canada; Leslie Klaff, Rainier Clinical Research
Center, Renton, WA, USA; David Klonoff, Mills-Peninsula Health Services, San Mateo, CA,
USA; Wendy Lane, Mountain Diabetes and Endocrine Center, Asheville, NC, USA; James
Larocque, Virginia Endocrinology Research, Chesapeake, VA, USA; Philip Levin, Model
Clinical Research, , Baltimore, MD, USA; Carol Levy, Icahn School of Medicine at Mount
Sinai, New York, NY, USA; William Litchfield, Desert Endocrinology, Henderson, NV, USA;
Kathryn Lucas, Diabetes & Endocrinology Consultants, Morehead City, NC, USA; Ivy-Joan
Madu, Diabetes Associates Medical Group, Orange, CA, USA; Hiralal Maheshwari, Midwest
Endocrinology, Crystal Lake, IL, USA; Ronald Mayfield, Mountainview Clinical Research,
Greer, SC, USA; Janet McGill, Washington University School of Medicine in St. Louis, St.
Louis, MO, USA; Wendell Miers, Kentucky Diabetes Endocrinology Center, Lexington, KY,
USA; Frank Mikell, Springfield Diabetes and Endocrine Center, Springfield, IL, USA; Samer
Nakhle, Palm Medical Group, Las Vegas, NV, USA; Ola Odugbesan, Physicians Research
Associates, LLC, Lawrenceville, GA, USA; Rakesh Patel, Endocrine and Psychiatry Center,
Houston, TX, USA; Athena Philis-Tsimikas, Scripp Whittier Diabetes Institute, La Jolla, CA,
USA; Antonio Pinero-Pilona, Suncoast Clinical Research, New Port Richey, FL, USA; David
Podlecki, IMMUNOe International Research Centers, Longmont, CO, USA; Zubin Punthakee,
McMaster University, Hamilton, Ontario, Canada; Remi Rabasa-Lhoret, Institut de Recherches
Cliniques de Montréal (IRCM), Montreal, Quebec, Canada; Thomas Ransom, Nova Scotia
Health Authority, Halifax, Nova Scotia, Canada; John Reed, Endocrine Research Solutions, Inc.,
SUPPLEMENTARY DATA
©2018 American Diabetes Association. Published online at http://care.diabetesjournals.org/lookup/suppl/doi:10.2337/dc18-0343/-/DC1
4
Roswell, GA, USA; Michael Reeves, Private Practice, Chattanooga, TN, USA; Marc Rendell,
Creighton University Medical Center, Omaha, NE, USA; Thomas Repas, Regional Health
Clinical Research, Rapid City, SD, USA; Paul Rosenblit, Diabetes Lipid Management and
Research Center, Huntington Beach, CA, USA; Julio Rosenstock, Dallas Diabetes and Endocrine
Center, Dallas, TX, USA; Katarzyna Sadurska, Eastern Maine Medical Center, Bangor, ME,
USA; Senan Sultan, East Coast Institute for Research, Fleming Island, FL, USA; David Sutton,
Northeast Florida Endocrine & Diabetes Associates, Jacksonville, FL, USA; James Thrasher,
Medical Investigations, Inc., Little Rock, AR, USA; Elena Toschi, Joslin Diabetes Center,
Boston, MA, USA; Subbulaxmi Trikudanathan, University of Washington Medical Center,
Seattle, WA, USA; Shyjauddin Valika, Associates in Endocrinology, Elgin, IL, USA; Joanna
Van, Diabetes Research Center, Tustin, CA, USA; Arnold Vera, Peninsula Research Inc.,
Ormond Beach , FL, USA; Khurram Wadud, East Coast Institute for Research, Jacksonville, FL,
USA; Michelle Welch, Diabetes and Metabolism Specialists, San Antonio, TX, USA; Vincent
Woo, Diabetes Research Group, Winnipeg, Manitoba, Canada; Alan Wynne, Cotton-O’Neil
Clinical Research Center, Topeka, KS, USA; Zeina Yared, LMC Diabetes and Endocrinology,
Ville Saint-Laurent, Quebec, Canada

SUPPLEMENTARY DATA
©2018 American Diabetes Association. Published online at http://care.diabetesjournals.org/lookup/suppl/doi:10.2337/dc18-0343/-/DC1
5
Inclusion and Exclusion Criteria
Inclusion Criteria
To participate in the trial, patients had to meet all of the following criteria:
• Men or nonpregnant women age ≥18 to ≤ 75 years of age with a diagnosis of type 1
diabetes (T1D) made at least 1 year prior to informed consent
• Treatment with insulin or insulin analog(s) delivered via continuous subcutaneous insulin
infusion (CSII) or multiple daily injections (MDI) with no change in insulin delivery
(CSII to MDI or vice-versa) within 3 months of screening
• A1C 7.0% to 11.0%, inclusive, at screening
• Willing and able to perform SMBG and complete the study diary as required per protocol
• For women of childbearing potential, use of an adequate method of contraception to
avoid pregnancy for the duration of the study through 30 days after the last dose of study
drug
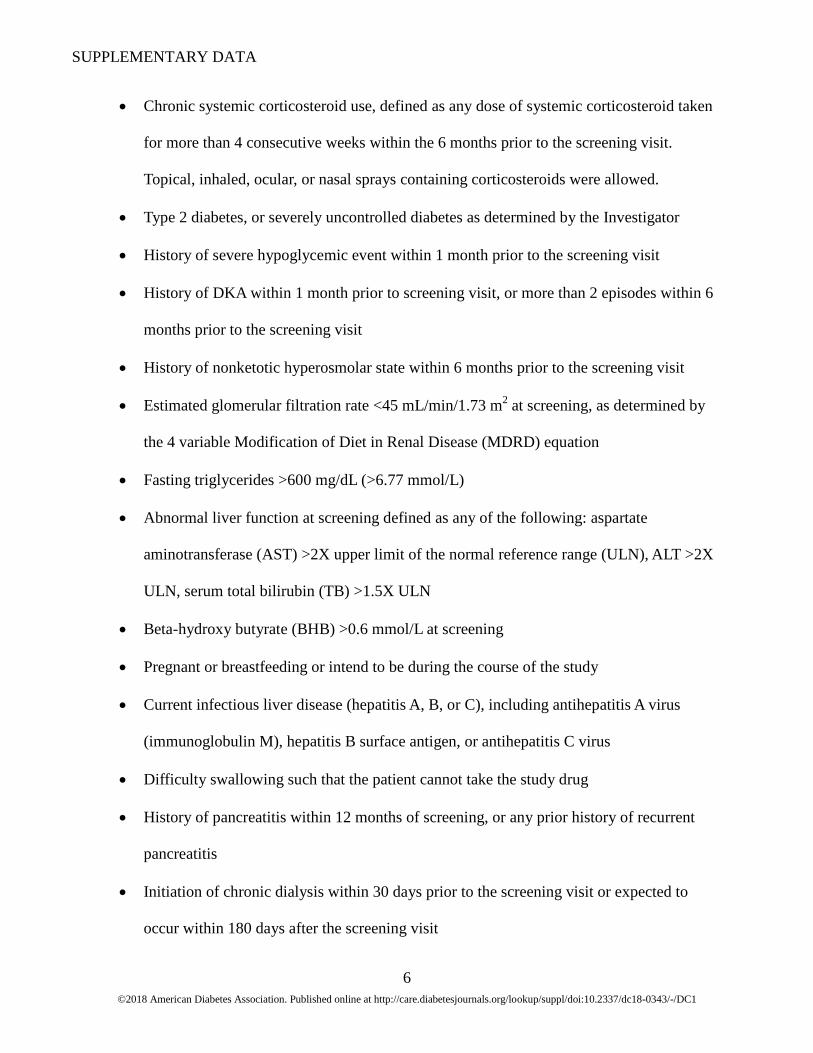
Exclusion Criteria
Patients meeting any of the following criteria were excluded from the study:
• Use of antidiabetic agent other than insulin at the time of screening (any medication other
than insulin or insulin analog used for treatment of T1D must be washed out for at least 8
weeks prior to the screening visit)
• Any prior exposure to sotagliflozin
• Use of any sodium glucose cotransporter (SGLT) inhibitors within 8 weeks prior to
screening
SUPPLEMENTARY DATA
©2018 American Diabetes Association. Published online at http://care.diabetesjournals.org/lookup/suppl/doi:10.2337/dc18-0343/-/DC1
6
• Chronic systemic corticosteroid use, defined as any dose of systemic corticosteroid taken
for more than 4 consecutive weeks within the 6 months prior to the screening visit.
Topical, inhaled, ocular, or nasal sprays containing corticosteroids were allowed.
• Type 2 diabetes, or severely uncontrolled diabetes as determined by the Investigator
• History of severe hypoglycemic event within 1 month prior to the screening visit
• History of DKA within 1 month prior to screening visit, or more than 2 episodes within 6
months prior to the screening visit
• History of nonketotic hyperosmolar state within 6 months prior to the screening visit
• Estimated glomerular filtration rate <45 mL/min/1.73 m2 at screening, as determined by
the 4 variable Modification of Diet in Renal Disease (MDRD) equation
• Fasting triglycerides >600 mg/dL (>6.77 mmol/L)
• Abnormal liver function at screening defined as any of the following: aspartate
aminotransferase (AST) >2X upper limit of the normal reference range (ULN), ALT >2X
ULN, serum total bilirubin (TB) >1.5X ULN
• Beta-hydroxy butyrate (BHB) >0.6 mmol/L at screening
• Pregnant or breastfeeding or intend to be during the course of the study
• Current infectious liver disease (hepatitis A, B, or C), including antihepatitis A virus
(immunoglobulin M), hepatitis B surface antigen, or antihepatitis C virus
• Difficulty swallowing such that the patient cannot take the study drug
• History of pancreatitis within 12 months of screening, or any prior history of recurrent
pancreatitis
• Initiation of chronic dialysis within 30 days prior to the screening visit or expected to
occur within 180 days after the screening visit
SUPPLEMENTARY DATA
©2018 American Diabetes Association. Published online at http://care.diabetesjournals.org/lookup/suppl/doi:10.2337/dc18-0343/-/DC1
7
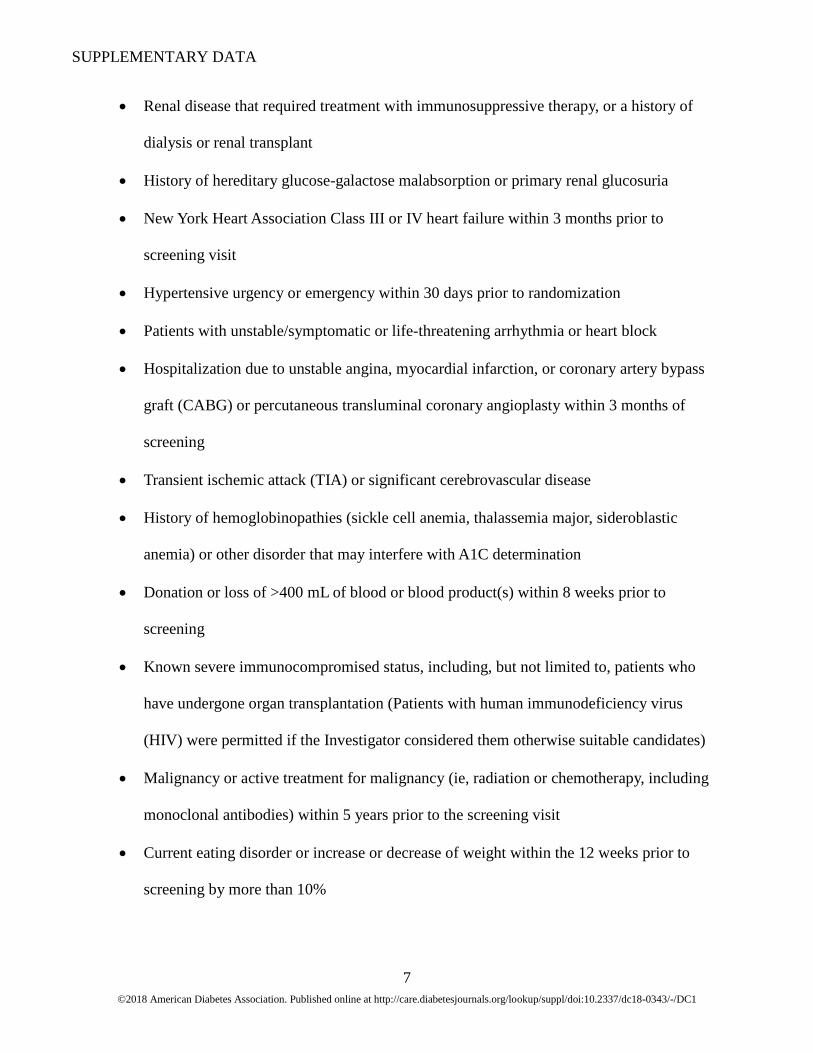
• Renal disease that required treatment with immunosuppressive therapy, or a history of
dialysis or renal transplant
• History of hereditary glucose-galactose malabsorption or primary renal glucosuria
• New York Heart Association Class III or IV heart failure within 3 months prior to
screening visit
• Hypertensive urgency or emergency within 30 days prior to randomization
• Patients with unstable/symptomatic or life-threatening arrhythmia or heart block
• Hospitalization due to unstable angina, myocardial infarction, or coronary artery bypass
graft (CABG) or percutaneous transluminal coronary angioplasty within 3 months of
screening
• Transient ischemic attack (TIA) or significant cerebrovascular disease
• History of hemoglobinopathies (sickle cell anemia, thalassemia major, sideroblastic
anemia) or other disorder that may interfere with A1C determination
• Donation or loss of >400 mL of blood or blood product(s) within 8 weeks prior to
screening
• Known severe immunocompromised status, including, but not limited to, patients who
have undergone organ transplantation (Patients with human immunodeficiency virus
(HIV) were permitted if the Investigator considered them otherwise suitable candidates)
• Malignancy or active treatment for malignancy (ie, radiation or chemotherapy, including
monoclonal antibodies) within 5 years prior to the screening visit
• Current eating disorder or increase or decrease of weight within the 12 weeks prior to
screening by more than 10%
SUPPLEMENTARY DATA
©2018 American Diabetes Association. Published online at http://care.diabetesjournals.org/lookup/suppl/doi:10.2337/dc18-0343/-/DC1
8
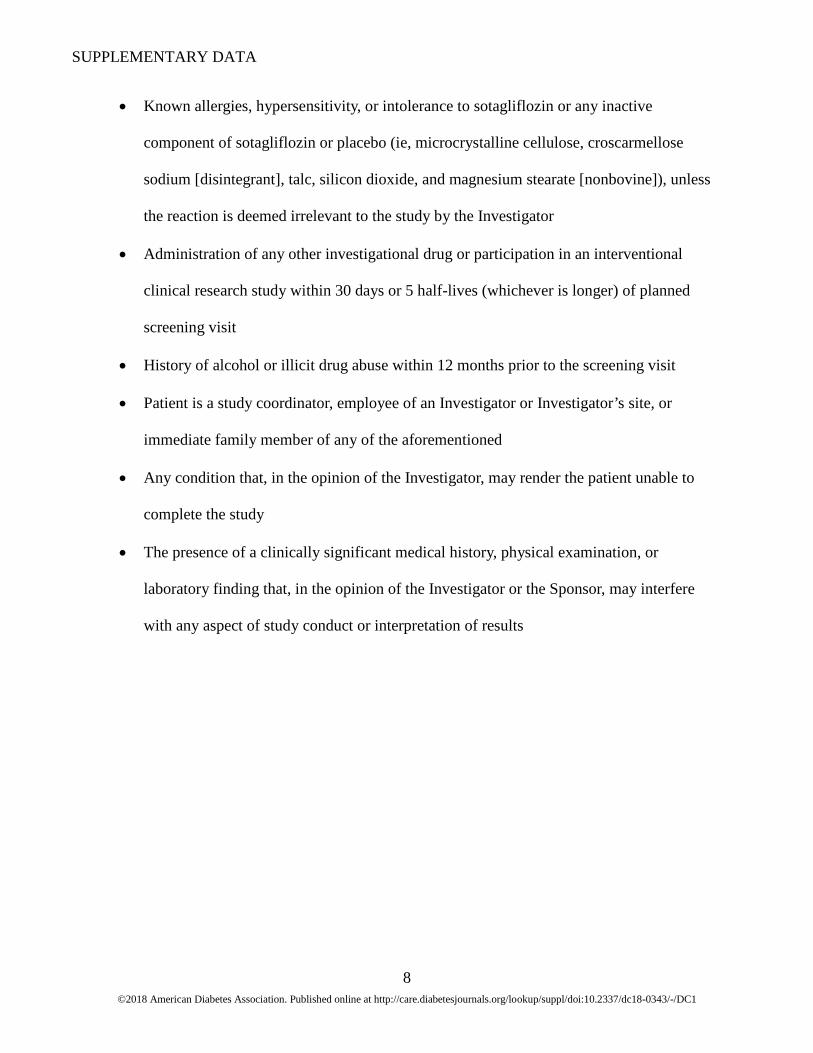
• Known allergies, hypersensitivity, or intolerance to sotagliflozin or any inactive
component of sotagliflozin or placebo (ie, microcrystalline cellulose, croscarmellose
sodium [disintegrant], talc, silicon dioxide, and magnesium stearate [nonbovine]), unless
the reaction is deemed irrelevant to the study by the Investigator
• Administration of any other investigational drug or participation in an interventional
clinical research study within 30 days or 5 half-lives (whichever is longer) of planned
screening visit
• History of alcohol or illicit drug abuse within 12 months prior to the screening visit
• Patient is a study coordinator, employee of an Investigator or Investigator’s site, or
immediate family member of any of the aforementioned
• Any condition that, in the opinion of the Investigator, may render the patient unable to
complete the study
• The presence of a clinically significant medical history, physical examination, or
laboratory finding that, in the opinion of the Investigator or the Sponsor, may interfere
with any aspect of study conduct or interpretation of results
SUPPLEMENTARY DATA
©2018 American Diabetes Association. Published online at http://care.diabetesjournals.org/lookup/suppl/doi:10.2337/dc18-0343/-/DC1
9
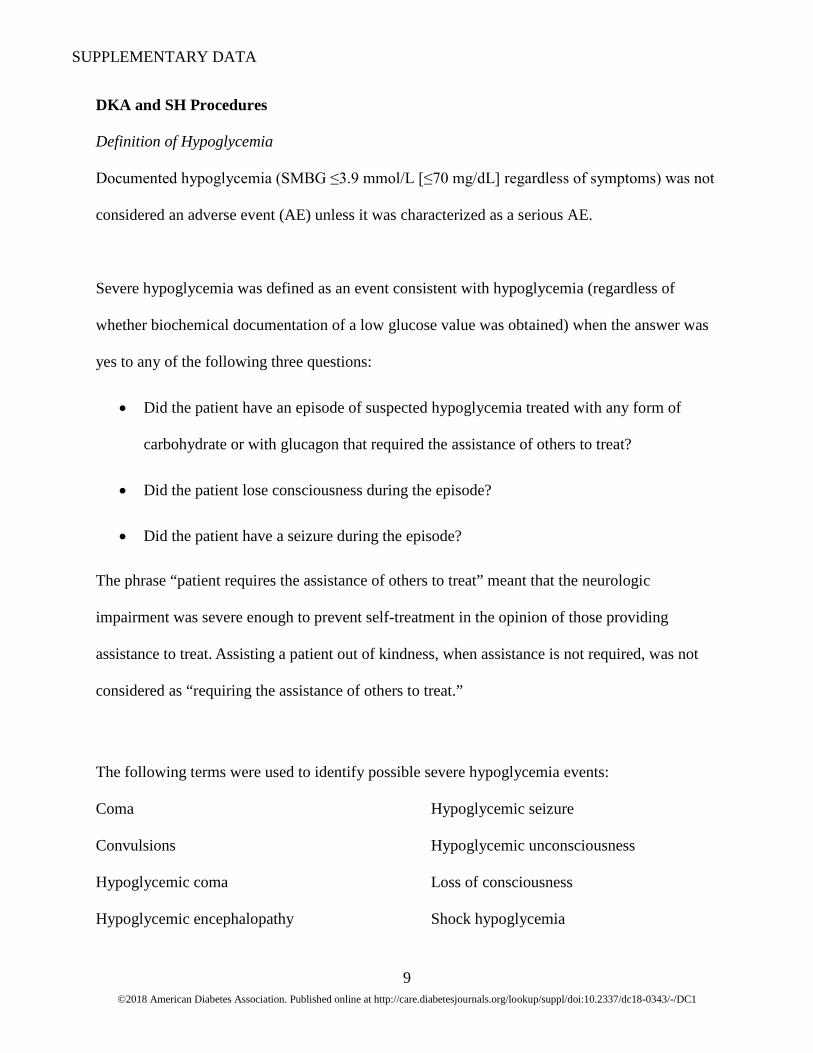
DKA and SH Procedures
Definition of Hypoglycemia
Documented hypoglycemia (SMBG ≤3.9 mmol/L [≤70 mg/dL] regardless of symptoms) was not
considered an adverse event (AE) unless it was characterized as a serious AE.
Severe hypoglycemia was defined as an event consistent with hypoglycemia (regardless of
whether biochemical documentation of a low glucose value was obtained) when the answer was
yes to any of the following three questions:
• Did the patient have an episode of suspected hypoglycemia treated with any form of
carbohydrate or with glucagon that required the assistance of others to treat?
• Did the patient lose consciousness during the episode?
• Did the patient have a seizure during the episode?
The phrase “patient requires the assistance of others to treat” meant that the neurologic
impairment was severe enough to prevent self-treatment in the opinion of those providing
assistance to treat. Assisting a patient out of kindness, when assistance is not required, was not
considered as “requiring the assistance of others to treat.”
The following terms were used to identify possible severe hypoglycemia events:
Coma
Convulsions
Hypoglycemic coma
Hypoglycemic encephalopathy
Hypoglycemic seizure
Hypoglycemic unconsciousness
Loss of consciousness
Shock hypoglycemia

SUPPLEMENTARY DATA
©2018 American Diabetes Association. Published online at http://care.diabetesjournals.org/lookup/suppl/doi:10.2337/dc18-0343/-/DC1
10
Note: only those hypoglycemic cases which met criteria for severe hypoglycemia as defined in
the protocol or those reported as a serious AE were submitted to the clinical endpoint committee
for adjudication.
Definition of Diabetic Ketoacidosis
DKA was diagnosed based on evidence of anion-gap metabolic acidosis related to excessive
ketone production without a satisfactory alternative cause for anion-gap acidosis, as outlined in
Kitabchi et al 2009, which was also provided to all investigators.1 However, final diagnosis of
metabolic acidosis, including diabetic ketoacidosis, was made by the adjudication committee. All
possible DKA events were adjudicated and were classified as “Yes, with certainty”; “Yes,
probably”; “No, unlikely”; “No, with certainty”; “Unclassifiable”; or “Insufficient data,” and
events meeting either “Yes” criterion (with certainty or probably) were assessed as positively
adjudicated.
SUPPLEMENTARY DATA
©2018 American Diabetes Association. Published online at http://care.diabetesjournals.org/lookup/suppl/doi:10.2337/dc18-0343/-/DC1
11
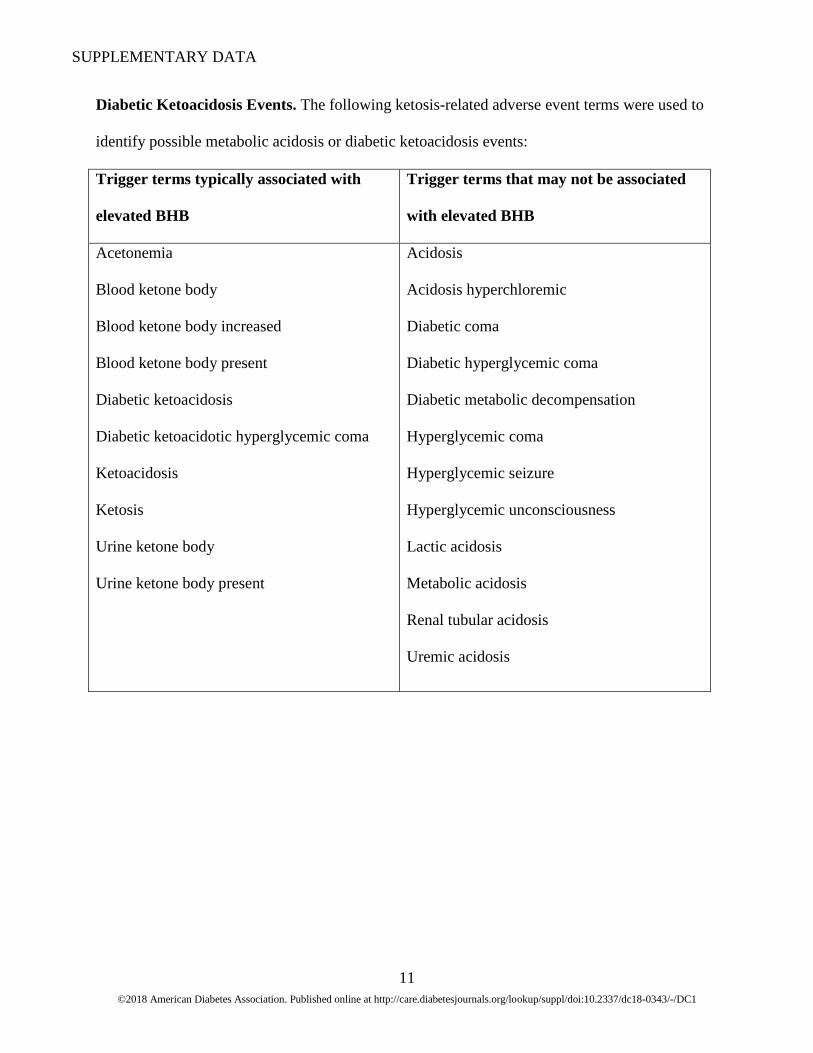
Diabetic Ketoacidosis Events. The following ketosis-related adverse event terms were used to
identify possible metabolic acidosis or diabetic ketoacidosis events:
Trigger terms typically associated with
elevated BHB
Trigger terms that may not be associated
with elevated BHB
Acetonemia
Blood ketone body
Blood ketone body increased
Blood ketone body present
Diabetic ketoacidosis
Diabetic ketoacidotic hyperglycemic coma
Ketoacidosis
Ketosis
Urine ketone body
Urine ketone body present
Acidosis
Acidosis hyperchloremic
Diabetic coma
Diabetic hyperglycemic coma
Diabetic metabolic decompensation
Hyperglycemic coma
Hyperglycemic seizure
Hyperglycemic unconsciousness
Lactic acidosis
Metabolic acidosis
Renal tubular acidosis
Uremic acidosis
SUPPLEMENTARY DATA
©2018 American Diabetes Association. Published online at http://care.diabetesjournals.org/lookup/suppl/doi:10.2337/dc18-0343/-/DC1
12
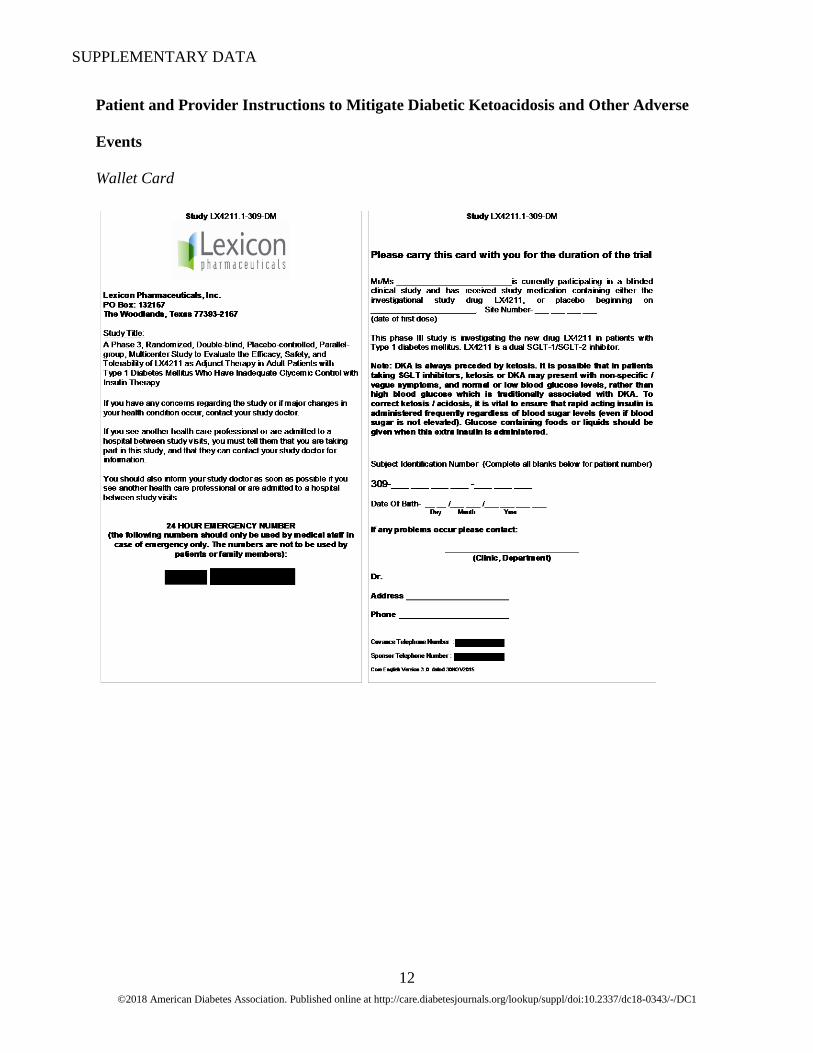
Patient and Provider Instructions to Mitigate Diabetic Ketoacidosis and Other Adverse
Events
Wallet Card
SUPPLEMENTARY DATA
©2018 American Diabetes Association. Published online at http://care.diabetesjournals.org/lookup/suppl/doi:10.2337/dc18-0343/-/DC1
13
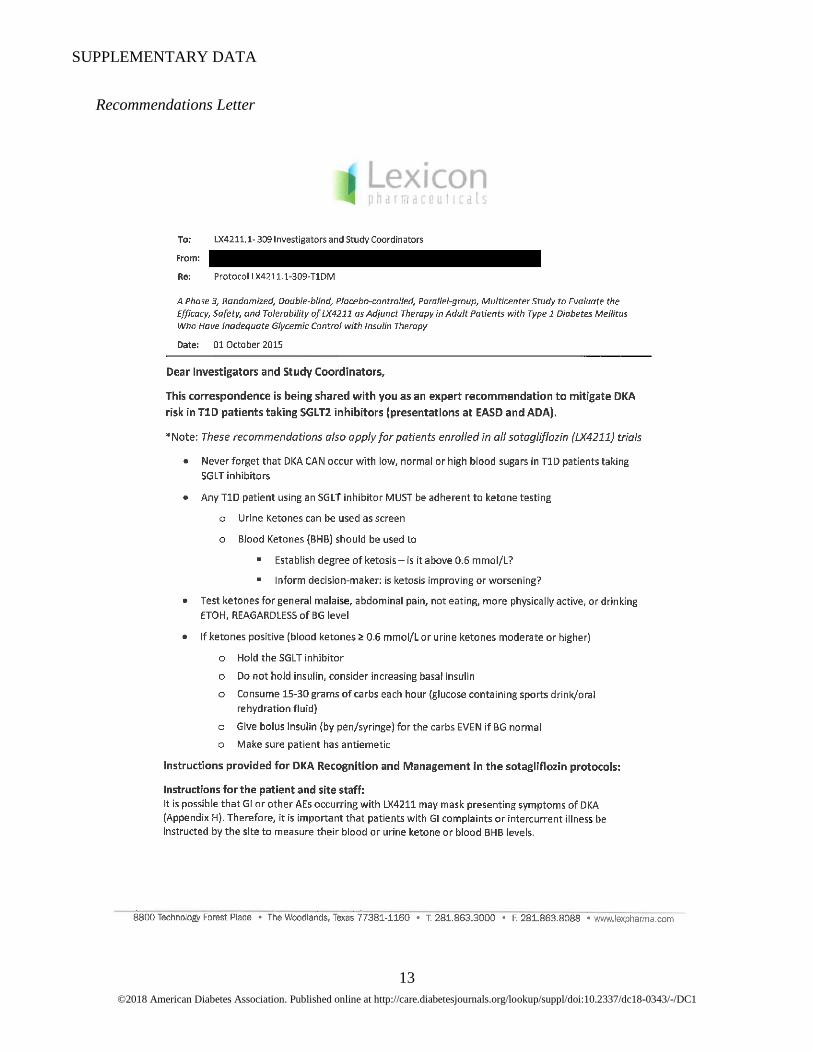
Recommendations Letter

SUPPLEMENTARY DATA
©2018 American Diabetes Association. Published online at http://care.diabetesjournals.org/lookup/suppl/doi:10.2337/dc18-0343/-/DC1
14
SUPPLEMENTARY DATA
©2018 American Diabetes Association. Published online at http://care.diabetesjournals.org/lookup/suppl/doi:10.2337/dc18-0343/-/DC1
15
Protocol Instructions for the Patient and Site Staff
At every clinic visit blood BHB (central laboratory and point-of-care) testing will be conducted.
At visits where UA is performed, the evaluation will include urine ketone determination by
dipstick.
It is possible that GI or other AEs occurring with sotagliflozin may mask presenting symptoms of
diabetic ketoacidosis. These symptoms include but are not limited to: inability to maintain oral
intake, generalized weakness, excessive thirst, abdominal pain, nausea, vomiting, rapid weight
loss, fever, frequent urination, fruity-scented breath, confusion, acute illness and/or consistently
elevated blood glucose. Therefore, it is important that patients with GI complaints or intercurrent
illness be instructed by the site to measure their blood or urine ketone or blood BHB levels.
(Note: In some patients alcohol may be a possible trigger for ketosis).
If ketosis is present (moderate or higher for urine ketones or blood BHB level is >0.6 mmol/L),
then the patient will be asked to contact the Investigative site immediately. In this situation, the
investigator should consider instructing the patient to take rapid acting insulin by syringe (not
insulin pump) as well as eat carbohydrates in order to reverse the ketosis. After rechecking the
ketones, the investigator should consider instructing the patient to take additional doses of rapid
acting insulin every 2 hours until elevated ketones are normalized. Because the amount of insulin
needed to lower ketones will also lower blood glucose, it is necessary for the patient to increase
carbohydrate intake. Typically this would be 15-30 grams of carbohydrate each hour provided by
a glucose containing sports drink or oral rehydration fluid. The site will evaluate if an assessment
for metabolic acidosis is appropriate. If laboratory testing confirms presence of metabolic

SUPPLEMENTARY DATA
©2018 American Diabetes Association. Published online at http://care.diabetesjournals.org/lookup/suppl/doi:10.2337/dc18-0343/-/DC1
16
acidosis, then the “Possible diabetic ketoacidosis” eCRF will be completed. If nausea and
vomiting are present and the patient is unable to keep liquids down the patient should be
evaluated in an Emergency Room.
If a patient is scheduled for a procedure or surgery that requires withholding oral intake (NPO), it
is recommended that study drug is held from the day prior to procedure or surgery and resumed
the day after procedure or surgery is complete and patient is tolerating adequate oral intake.
An independent adjudication committee composed of experts in T1D will adjudicate cases of
diabetic ketoacidosis (including all cases of metabolic acidosis) in a blinded fashion.
Patient Communication Card Text
The following list may help you to recognize Diabetic Ketoacidosis (DKA).
• Inability to maintain oral intake
• Generalized weakness
• Abdominal (belly) pain
• Increased weight loss
• Fever
• Frequent urination, including at night
• Fruity-scented breath
• Confusion
• Acute illness
SUPPLEMENTARY DATA
©2018 American Diabetes Association. Published online at http://care.diabetesjournals.org/lookup/suppl/doi:10.2337/dc18-0343/-/DC1
17
• Consistently elevated blood glucose
• Feeling very thirsty or drinking a lot
• Nausea or vomiting
• Having trouble thinking clearly or feeling tired
It is possible to have DKA even if your blood glucose is not elevated. Regardless of your blood
glucose level, if you have any of these symptoms on the list, then measure your blood or urine
ketone or blood BHB level. If the urine ketones are high (your study doctor may instruct you that
this is a level of “moderate” or more than “moderate”) or blood BHB level is above 0.6 mmol/L,
then contact your study site immediately for assistance with managing your diabetes.”
In some patients alcohol use may lead to production of ketones by your body.
If you are scheduled for a procedure or surgery that requires you to not take any food or liquids,
please contact your study doctor for instructions on continuing study drug. In such cases your
study doctor may advise you NOT to take your study drug from the day prior to the procedure or
surgery until after the procedure or surgery is complete, and you are taking food and liquids as
you normally do.
SUPPLEMENTARY DATA
©2018 American Diabetes Association. Published online at http://care.diabetesjournals.org/lookup/suppl/doi:10.2337/dc18-0343/-/DC1
18
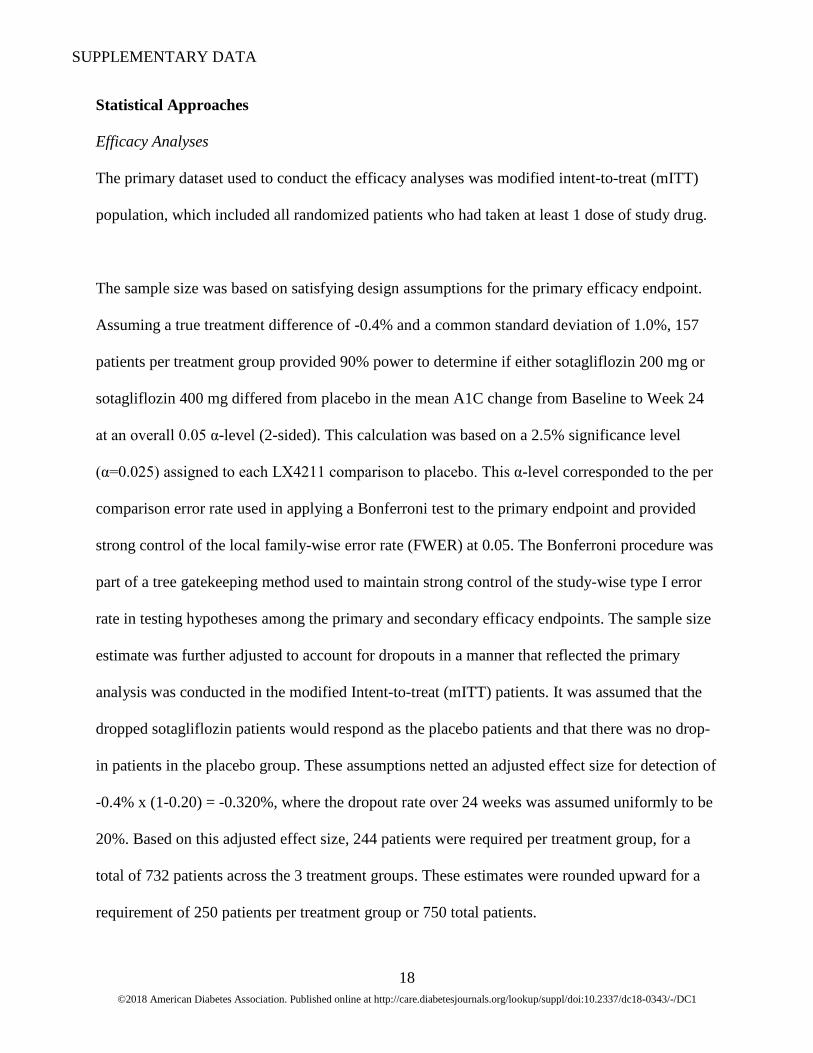
Statistical Approaches
Efficacy Analyses
The primary dataset used to conduct the efficacy analyses was modified intent-to-treat (mITT)
population, which included all randomized patients who had taken at least 1 dose of study drug.
The sample size was based on satisfying design assumptions for the primary efficacy endpoint.
Assuming a true treatment difference of -0.4% and a common standard deviation of 1.0%, 157
patients per treatment group provided 90% power to determine if either sotagliflozin 200 mg or
sotagliflozin 400 mg differed from placebo in the mean A1C change from Baseline to Week 24
at an overall 0.05 α-level (2-sided). This calculation was based on a 2.5% significance level
(α=0.025) assigned to each LX4211 comparison to placebo. This α-level corresponded to the per
comparison error rate used in applying a Bonferroni test to the primary endpoint and provided
strong control of the local family-wise error rate (FWER) at 0.05. The Bonferroni procedure was
part of a tree gatekeeping method used to maintain strong control of the study-wise type I error
rate in testing hypotheses among the primary and secondary efficacy endpoints. The sample size
estimate was further adjusted to account for dropouts in a manner that reflected the primary
analysis was conducted in the modified Intent-to-treat (mITT) patients. It was assumed that the
dropped sotagliflozin patients would respond as the placebo patients and that there was no drop-
in patients in the placebo group. These assumptions netted an adjusted effect size for detection of
-0.4% x (1-0.20) = -0.320%, where the dropout rate over 24 weeks was assumed uniformly to be
20%. Based on this adjusted effect size, 244 patients were required per treatment group, for a
total of 732 patients across the 3 treatment groups. These estimates were rounded upward for a
requirement of 250 patients per treatment group or 750 total patients.
SUPPLEMENTARY DATA
©2018 American Diabetes Association. Published online at http://care.diabetesjournals.org/lookup/suppl/doi:10.2337/dc18-0343/-/DC1
19
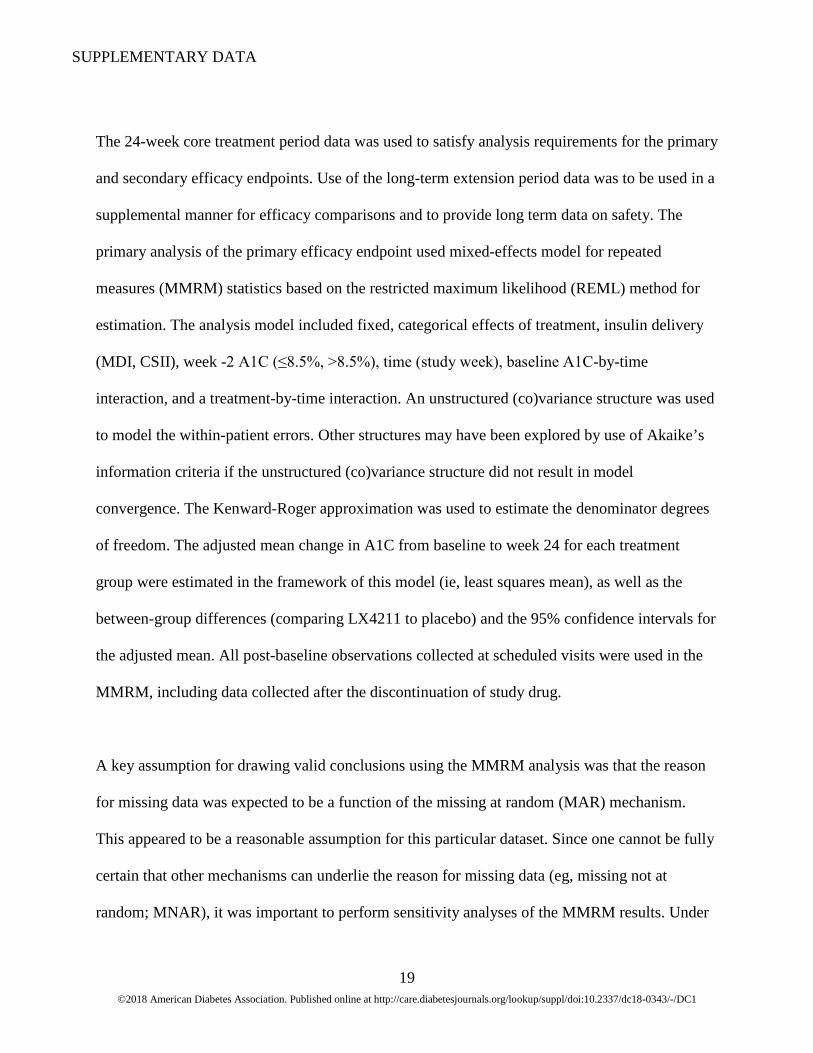
The 24-week core treatment period data was used to satisfy analysis requirements for the primary
and secondary efficacy endpoints. Use of the long-term extension period data was to be used in a
supplemental manner for efficacy comparisons and to provide long term data on safety. The
primary analysis of the primary efficacy endpoint used mixed-effects model for repeated
measures (MMRM) statistics based on the restricted maximum likelihood (REML) method for
estimation. The analysis model included fixed, categorical effects of treatment, insulin delivery
(MDI, CSII), week -2 A1C (≤8.5%, >8.5%), time (study week), baseline A1C-by-time
interaction, and a treatment-by-time interaction. An unstructured (co)variance structure was used
to model the within-patient errors. Other structures may have been explored by use of Akaike’s
information criteria if the unstructured (co)variance structure did not result in model
convergence. The Kenward-Roger approximation was used to estimate the denominator degrees
of freedom. The adjusted mean change in A1C from baseline to week 24 for each treatment
group were estimated in the framework of this model (ie, least squares mean), as well as the
between-group differences (comparing LX4211 to placebo) and the 95% confidence intervals for
the adjusted mean. All post-baseline observations collected at scheduled visits were used in the
MMRM, including data collected after the discontinuation of study drug.
A key assumption for drawing valid conclusions using the MMRM analysis was that the reason
for missing data was expected to be a function of the missing at random (MAR) mechanism.
This appeared to be a reasonable assumption for this particular dataset. Since one cannot be fully
certain that other mechanisms can underlie the reason for missing data (eg, missing not at
random; MNAR), it was important to perform sensitivity analyses of the MMRM results. Under
SUPPLEMENTARY DATA
©2018 American Diabetes Association. Published online at http://care.diabetesjournals.org/lookup/suppl/doi:10.2337/dc18-0343/-/DC1
20
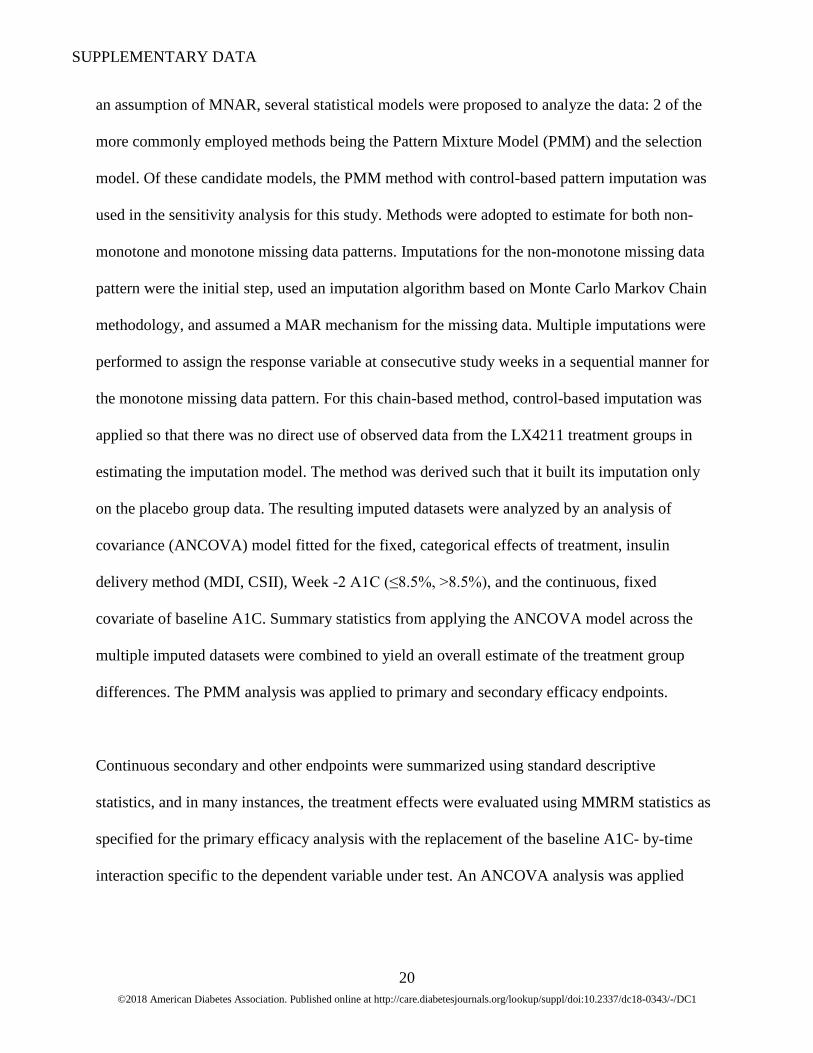
an assumption of MNAR, several statistical models were proposed to analyze the data: 2 of the
more commonly employed methods being the Pattern Mixture Model (PMM) and the selection
model. Of these candidate models, the PMM method with control-based pattern imputation was
used in the sensitivity analysis for this study. Methods were adopted to estimate for both non-
monotone and monotone missing data patterns. Imputations for the non-monotone missing data
pattern were the initial step, used an imputation algorithm based on Monte Carlo Markov Chain
methodology, and assumed a MAR mechanism for the missing data. Multiple imputations were
performed to assign the response variable at consecutive study weeks in a sequential manner for
the monotone missing data pattern. For this chain-based method, control-based imputation was
applied so that there was no direct use of observed data from the LX4211 treatment groups in
estimating the imputation model. The method was derived such that it built its imputation only
on the placebo group data. The resulting imputed datasets were analyzed by an analysis of
covariance (ANCOVA) model fitted for the fixed, categorical effects of treatment, insulin
delivery method (MDI, CSII), Week -2 A1C (≤8.5%, >8.5%), and the continuous, fixed
covariate of baseline A1C. Summary statistics from applying the ANCOVA model across the
multiple imputed datasets were combined to yield an overall estimate of the treatment group
differences. The PMM analysis was applied to primary and secondary efficacy endpoints.
Continuous secondary and other endpoints were summarized using standard descriptive
statistics, and in many instances, the treatment effects were evaluated using MMRM statistics as
specified for the primary efficacy analysis with the replacement of the baseline A1C- by-time
interaction specific to the dependent variable under test. An ANCOVA analysis was applied
SUPPLEMENTARY DATA
©2018 American Diabetes Association. Published online at http://care.diabetesjournals.org/lookup/suppl/doi:10.2337/dc18-0343/-/DC1
21
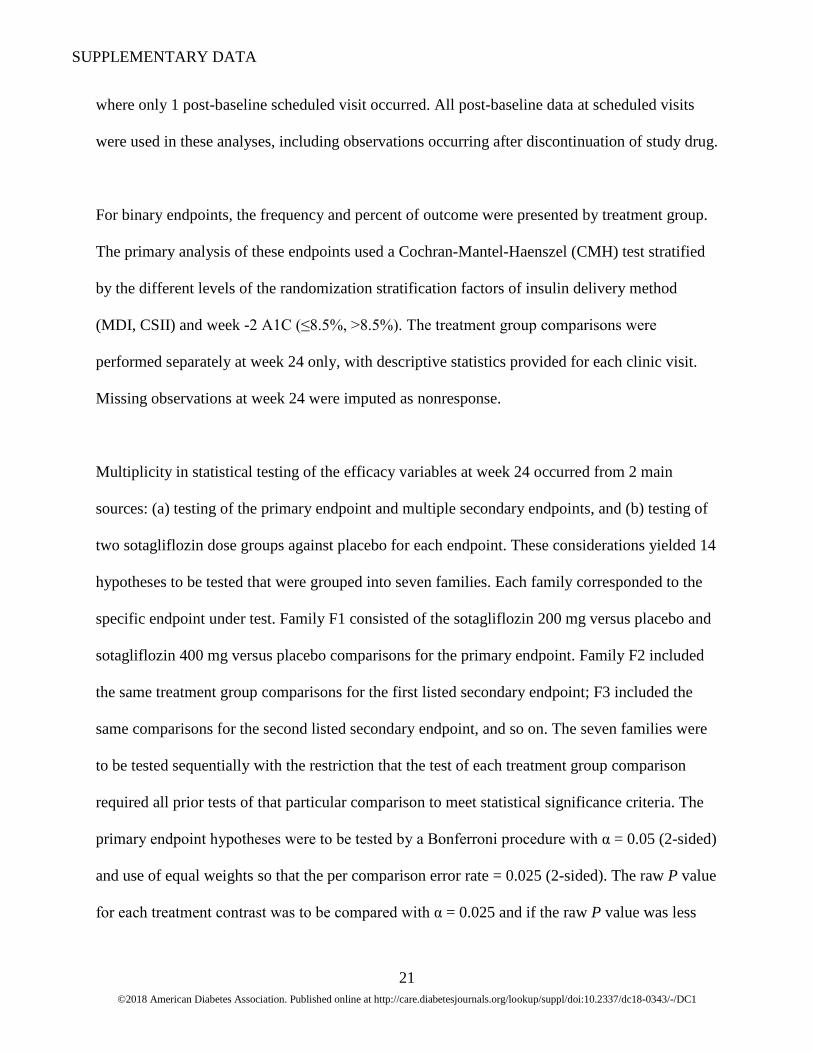
where only 1 post-baseline scheduled visit occurred. All post-baseline data at scheduled visits
were used in these analyses, including observations occurring after discontinuation of study drug.
For binary endpoints, the frequency and percent of outcome were presented by treatment group.
The primary analysis of these endpoints used a Cochran-Mantel-Haenszel (CMH) test stratified
by the different levels of the randomization stratification factors of insulin delivery method
(MDI, CSII) and week -2 A1C (≤8.5%, >8.5%). The treatment group comparisons were
performed separately at week 24 only, with descriptive statistics provided for each clinic visit.
Missing observations at week 24 were imputed as nonresponse.
Multiplicity in statistical testing of the efficacy variables at week 24 occurred from 2 main
sources: (a) testing of the primary endpoint and multiple secondary endpoints, and (b) testing of
two sotagliflozin dose groups against placebo for each endpoint. These considerations yielded 14
hypotheses to be tested that were grouped into seven families. Each family corresponded to the
specific endpoint under test. Family F1 consisted of the sotagliflozin 200 mg versus placebo and
sotagliflozin 400 mg versus placebo comparisons for the primary endpoint. Family F2 included
the same treatment group comparisons for the first listed secondary endpoint; F3 included the
same comparisons for the second listed secondary endpoint, and so on. The seven families were
to be tested sequentially with the restriction that the test of each treatment group comparison
required all prior tests of that particular comparison to meet statistical significance criteria. The
primary endpoint hypotheses were to be tested by a Bonferroni procedure with α = 0.05 (2-sided)
and use of equal weights so that the per comparison error rate = 0.025 (2-sided). The raw P value
for each treatment contrast was to be compared with α = 0.025 and if the raw P value was less

SUPPLEMENTARY DATA
©2018 American Diabetes Association. Published online at http://care.diabetesjournals.org/lookup/suppl/doi:10.2337/dc18-0343/-/DC1
22
than or equal to 0.025, the comparison was to be declared statistically significant and testing for
that contrast could proceed to the next listed endpoint. Consistent with testing the primary
endpoint, the family-wise error rate (FWER) within each secondary endpoint family was 0.05 (2-
sided), and with hypothesis weights of 0.5 assigned to each contrast within each testable family,
the per comparison α-level = 0.025 (2-sided). Assessment of the testable hypotheses for the
secondary endpoints was to be made in the same manner that was applied to the primary
endpoint. Formal testing of a particular treatment comparison was to stop at that endpoint for
which a raw P value exceeded 0.025. Progression in testing across the hypothesis families was to
be carried out, in essence, using a tree gatekeeping test procedure so that the study-wise error
rate across all primary and secondary hypotheses tested was to be strongly controlled at α = 0.05.
This procedure was not applied to the week 52 comparisons.
Subgroup Analyses
Subgroup analyses of the primary efficacy variable were to be performed for different categories
of Baseline characteristics and the randomization stratification factors. Analysis of treatment
effects for each subgroup was to use a MMRM model that included fixed, categorical effects of
treatment, insulin delivery (MDI, CSII; excluded if it was a subgroup variable), week -2 A1C
(≤8.5%, >8.5%; excluded if it was a subgroup variable), time (study week), baseline A1C-by-
time interaction, and a treatment-by-time interaction.
In addition, change from baseline in SBP (mm Hg) at week 12 was to be summarized and
analyzed using MMRM model fitted for the fixed, categorical effects of treatment, insulin
delivery (MDI, CSII), Week -2 A1C (≤8.5%, >8.5%), time (study week), baseline SBP-by-time
interaction, and a treatment-by-time interaction for the following subgroups:

SUPPLEMENTARY DATA
©2018 American Diabetes Association. Published online at http://care.diabetesjournals.org/lookup/suppl/doi:10.2337/dc18-0343/-/DC1
23
• Baseline SBP <130 mm Hg
• Baseline SBP ≥130 mm Hg
All subgroup analyses were to be exploratory.
Safety Analyses
Safety analysis primarily involved examination of descriptive statistics and individual patient
listings for any effects of study treatment on clinical tolerability and safety. Summaries were
prepared by treatment group and, as needed, by clinic visit. These summaries were based on the
safety population and other subpopulations as needed. All safety data (adverse events [AEs],
events of special interest, laboratory test results, vital signs, electrocardiogram (ECG) results,
and physical examinations) were provided in listings.
Vital signs, physical examination findings, laboratory results, and ECGs were summarized
descriptively at each study visit. Actual and change from baseline data were calculated and
summarized. In addition, shift table analyses were presented for the laboratory data.
Because of the importance of hypoglycemia in this patient population, various measures of this
variable were analyzed. Change from baseline in hypoglycemic events calculated as a daily
average over the week prior to the visit was to be analyzed as a continuous variable as described
previously. Since events data also served as a measure of safety, additional analyses were
conducted. The first analysis of hypoglycemic events was conducted using CMH tests stratified
by the randomization factors at each study visit. These tests provided inferential and descriptive
summaries of the relative risk estimate for each of the four hypoglycemic event definitions: ≤3.8
SUPPLEMENTARY DATA
©2018 American Diabetes Association. Published online at http://care.diabetesjournals.org/lookup/suppl/doi:10.2337/dc18-0343/-/DC1
24
mmol/L (≤70 mg/dL) by SMBG, <3.9 mmol/L (<70 mg/dL) by CGM, ≤3.0 mmol/L
(≤55 mg/dL) by SMBG, and <3.0 mmol/L (<55 mg/dL) by CGM. The patient incidence of these
hypoglycemic events was counted over the week prior to the scheduled study visit used in the
analysis. The second analysis of these data examined the relative risk for each of the
hypoglycemic event definitions over the entire core treatment period by use of a generalized
linear model (GLM). The GLM included fixed, categorical effects of treatment, randomization
strata of insulin delivery method (MDI, CSII), randomization strata of Week -2 A1C (≤8.5%,
>8.5%), and an offset term for the log of the treatment duration during the core treatment period
(first 24 weeks). The event rates were modeled as a negative binomial process. Similarly, event
rates during the overall treatment period were to be modeled using the GLM model, with log of
the total treatment duration as the offset term.
Adverse Events
All AEs were coded and listed by body system and preferred term based on Medical Dictionary
for Regulatory Activities (MedDRA). Summaries using descriptive statistics were provided for
treatment-emergent AEs, drug-related AEs, and AEs by intensity. Treatment-emergent AEs
(TEAEs) were those events not present at baseline, but occurring after the start of study
treatment, or if existing at baseline, increasing in intensity after the initiation of study drug.
When multiple occurrences of the same event were reported for the same patient, summaries
made by intensity selected the event with the highest intensity. In a similar manner, summaries
prepared by drug relationship selected the event with the greatest degree of relationship when a
patient reports multiple occurrences of the same event. Summaries of TEAEs were presented for
the 24-week core treatment period, the 28-week long term extension period, and the overall
SUPPLEMENTARY DATA
©2018 American Diabetes Association. Published online at http://care.diabetesjournals.org/lookup/suppl/doi:10.2337/dc18-0343/-/DC1
25
treatment period by treatment group for the safety population. TEAE displays were to include the
overall incidence (by system organ class and preferred term), events by maximum intensity,
events by relationship to study drug, events leading to discontinuation of study drug, events of
special interest, and serious adverse events.
On-study deaths were reported for deaths occurring during the active phase of the treatment
period and 30 days after stopping study drug. Also, deaths occurring outside the 30-day window,
but secondary to an AE reported within the 30-day post-treatment period, were reported. Listings
were provided for deaths, SAEs, and discontinuations due to AEs.
SUPPLEMENTARY DATA
©2018 American Diabetes Association. Published online at http://care.diabetesjournals.org/lookup/suppl/doi:10.2337/dc18-0343/-/DC1
26
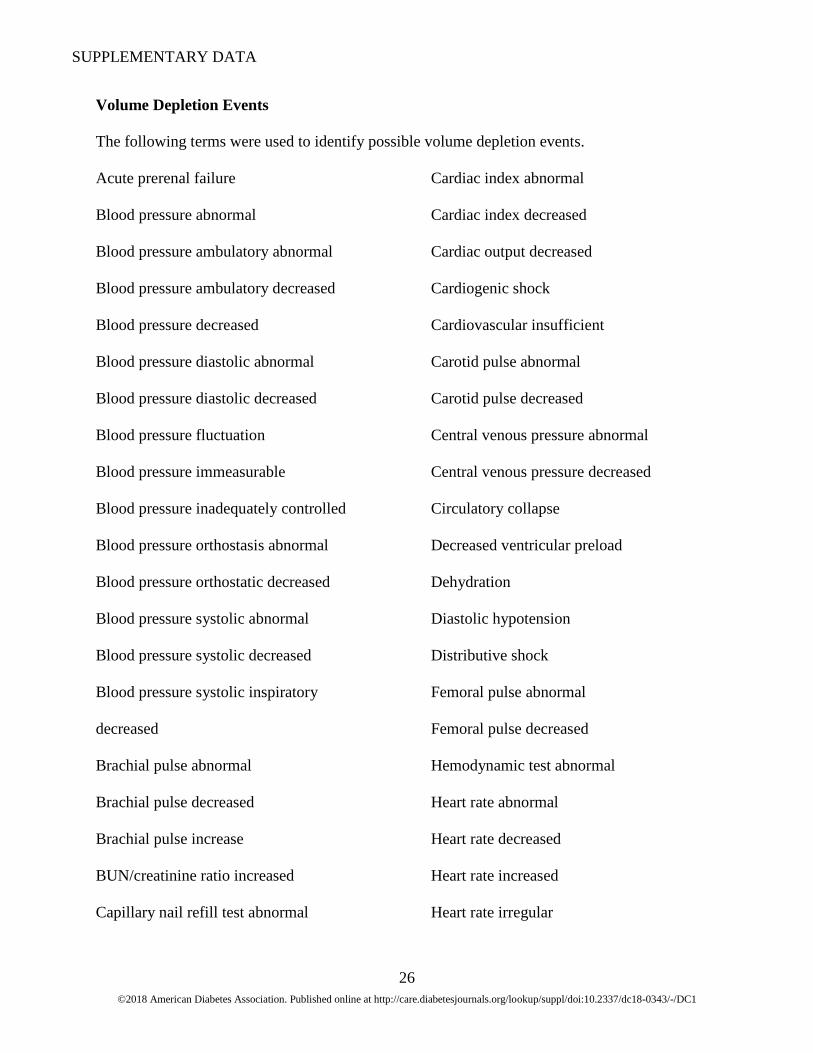
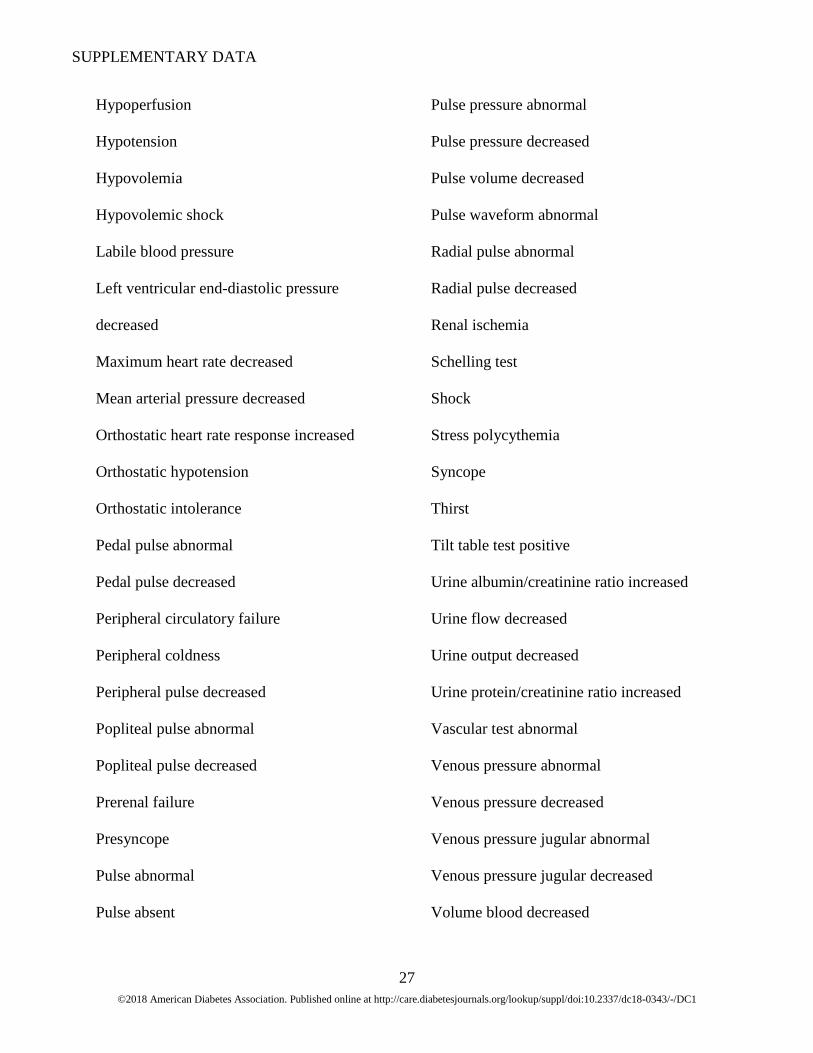
Volume Depletion Events
The following terms were used to identify possible volume depletion events.
Acute prerenal failure
Blood pressure abnormal
Blood pressure ambulatory abnormal
Blood pressure ambulatory decreased
Blood pressure decreased
Blood pressure diastolic abnormal
Blood pressure diastolic decreased
Blood pressure fluctuation
Blood pressure immeasurable
Blood pressure inadequately controlled
Blood pressure orthostasis abnormal
Blood pressure orthostatic decreased
Blood pressure systolic abnormal
Blood pressure systolic decreased
Blood pressure systolic inspiratory
decreased
Brachial pulse abnormal
Brachial pulse decreased
Brachial pulse increase
BUN/creatinine ratio increased
Capillary nail refill test abnormal
Cardiac index abnormal
Cardiac index decreased
Cardiac output decreased
Cardiogenic shock
Cardiovascular insufficient
Carotid pulse abnormal
Carotid pulse decreased
Central venous pressure abnormal
Central venous pressure decreased
Circulatory collapse
Decreased ventricular preload
Dehydration
Diastolic hypotension
Distributive shock
Femoral pulse abnormal
Femoral pulse decreased
Hemodynamic test abnormal
Heart rate abnormal
Heart rate decreased
Heart rate increased
Heart rate irregular
SUPPLEMENTARY DATA
©2018 American Diabetes Association. Published online at http://care.diabetesjournals.org/lookup/suppl/doi:10.2337/dc18-0343/-/DC1
27
Hypoperfusion
Hypotension
Hypovolemia
Hypovolemic shock
Labile blood pressure
Left ventricular end-diastolic pressure
decreased
Maximum heart rate decreased
Mean arterial pressure decreased
Orthostatic heart rate response increased
Orthostatic hypotension
Orthostatic intolerance
Pedal pulse abnormal
Pedal pulse decreased
Peripheral circulatory failure
Peripheral coldness
Peripheral pulse decreased
Popliteal pulse abnormal
Popliteal pulse decreased
Prerenal failure
Presyncope
Pulse abnormal
Pulse absent
Pulse pressure abnormal
Pulse pressure decreased
Pulse volume decreased
Pulse waveform abnormal
Radial pulse abnormal
Radial pulse decreased
Renal ischemia
Schelling test
Shock
Stress polycythemia
Syncope
Thirst
Tilt table test positive
Urine albumin/creatinine ratio increased
Urine flow decreased
Urine output decreased
Urine protein/creatinine ratio increased
Vascular test abnormal
Venous pressure abnormal
Venous pressure decreased
Venous pressure jugular abnormal
Venous pressure jugular decreased
Volume blood decreased
SUPPLEMENTARY DATA
©2018 American Diabetes Association. Published online at http://care.diabetesjournals.org/lookup/suppl/doi:10.2337/dc18-0343/-/DC1
28
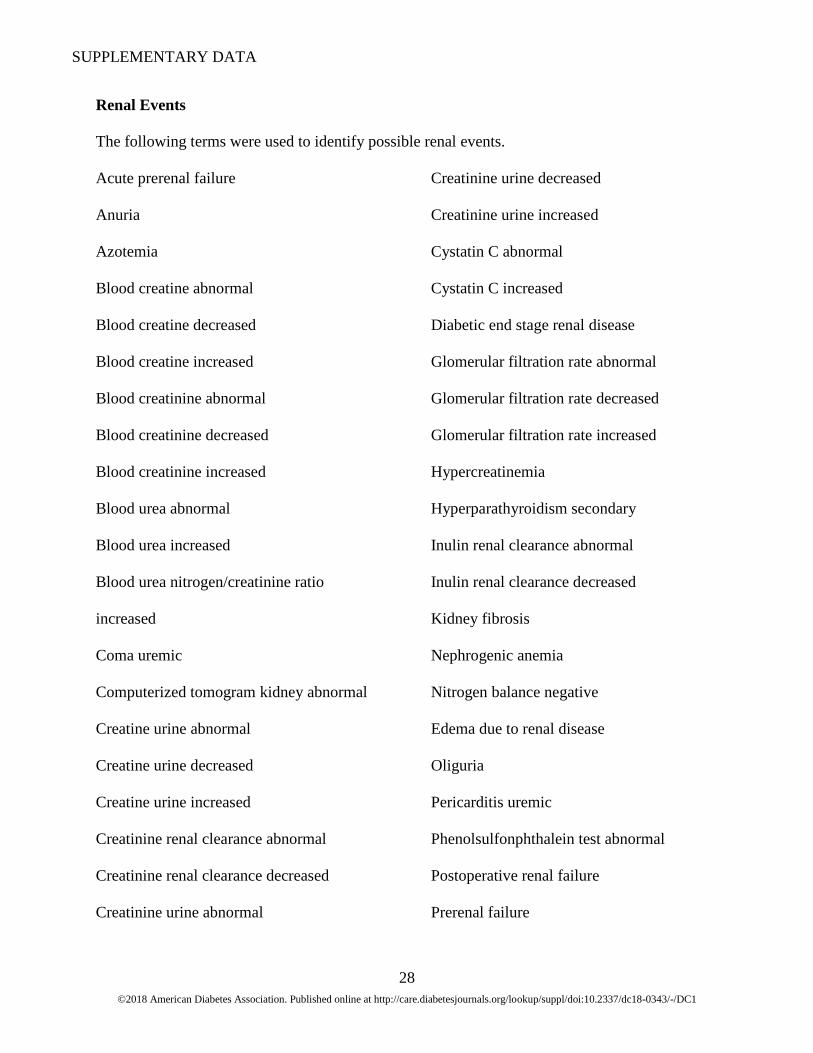
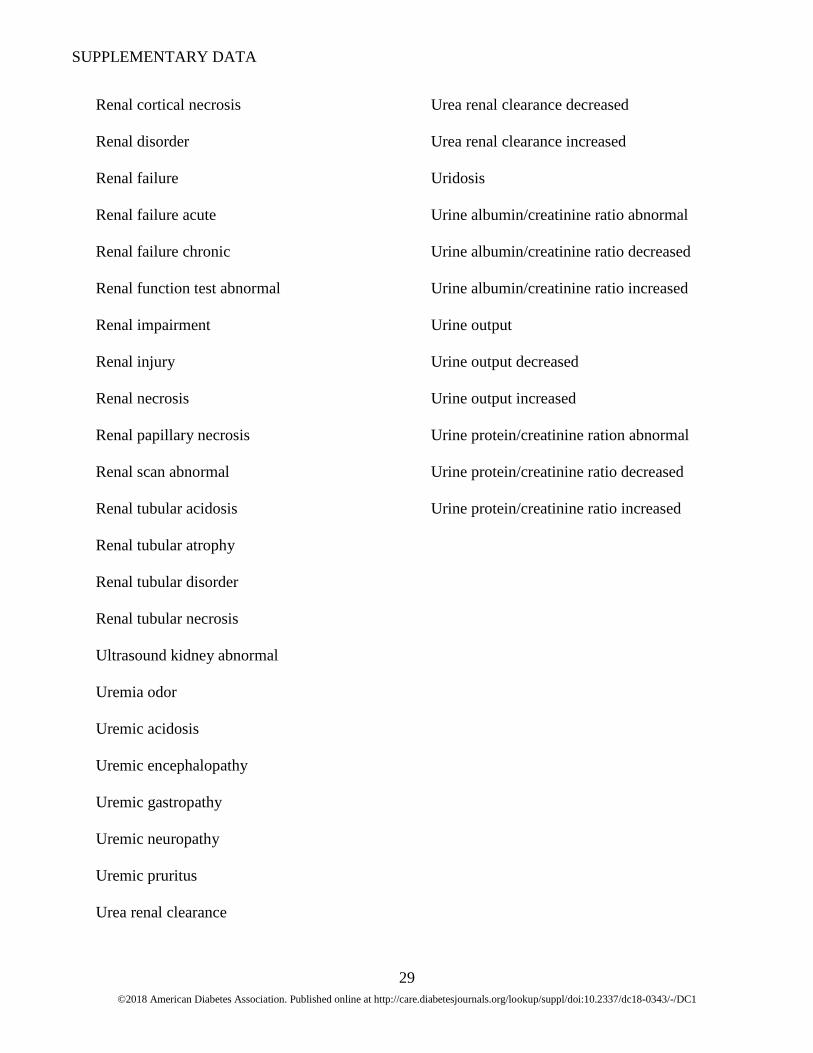
Renal Events
The following terms were used to identify possible renal events.
Acute prerenal failure
Anuria
Azotemia
Blood creatine abnormal
Blood creatine decreased
Blood creatine increased
Blood creatinine abnormal
Blood creatinine decreased
Blood creatinine increased
Blood urea abnormal
Blood urea increased
Blood urea nitrogen/creatinine ratio
increased
Coma uremic
Computerized tomogram kidney abnormal
Creatine urine abnormal
Creatine urine decreased
Creatine urine increased
Creatinine renal clearance abnormal
Creatinine renal clearance decreased
Creatinine urine abnormal
Creatinine urine decreased
Creatinine urine increased
Cystatin C abnormal
Cystatin C increased
Diabetic end stage renal disease
Glomerular filtration rate abnormal
Glomerular filtration rate decreased
Glomerular filtration rate increased
Hypercreatinemia
Hyperparathyroidism secondary
Inulin renal clearance abnormal
Inulin renal clearance decreased
Kidney fibrosis
Nephrogenic anemia
Nitrogen balance negative
Edema due to renal disease
Oliguria
Pericarditis uremic
Phenolsulfonphthalein test abnormal
Postoperative renal failure
Prerenal failure
SUPPLEMENTARY DATA
©2018 American Diabetes Association. Published online at http://care.diabetesjournals.org/lookup/suppl/doi:10.2337/dc18-0343/-/DC1
29
Renal cortical necrosis
Renal disorder
Renal failure
Renal failure acute
Renal failure chronic
Renal function test abnormal
Renal impairment
Renal injury
Renal necrosis
Renal papillary necrosis
Renal scan abnormal
Renal tubular acidosis
Renal tubular atrophy
Renal tubular disorder
Renal tubular necrosis
Ultrasound kidney abnormal
Uremia odor
Uremic acidosis
Uremic encephalopathy
Uremic gastropathy
Uremic neuropathy
Uremic pruritus
Urea renal clearance
Urea renal clearance decreased
Urea renal clearance increased
Uridosis
Urine albumin/creatinine ratio abnormal
Urine albumin/creatinine ratio decreased
Urine albumin/creatinine ratio increased
Urine output
Urine output decreased
Urine output increased
Urine protein/creatinine ration abnormal
Urine protein/creatinine ratio decreased
Urine protein/creatinine ratio increased
SUPPLEMENTARY DATA
©2018 American Diabetes Association. Published online at http://care.diabetesjournals.org/lookup/suppl/doi:10.2337/dc18-0343/-/DC1
30
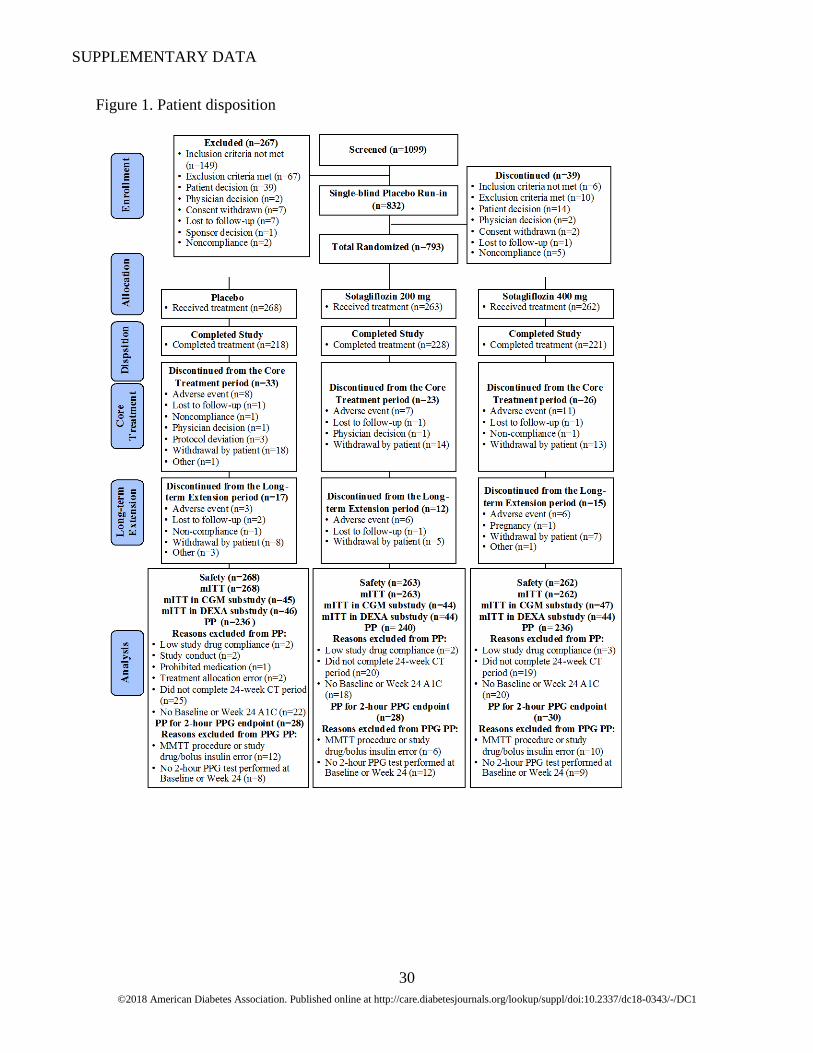
Figure 1. Patient disposition
SUPPLEMENTARY DATA
©2018 American Diabetes Association. Published online at http://care.diabetesjournals.org/lookup/suppl/doi:10.2337/dc18-0343/-/DC1
31
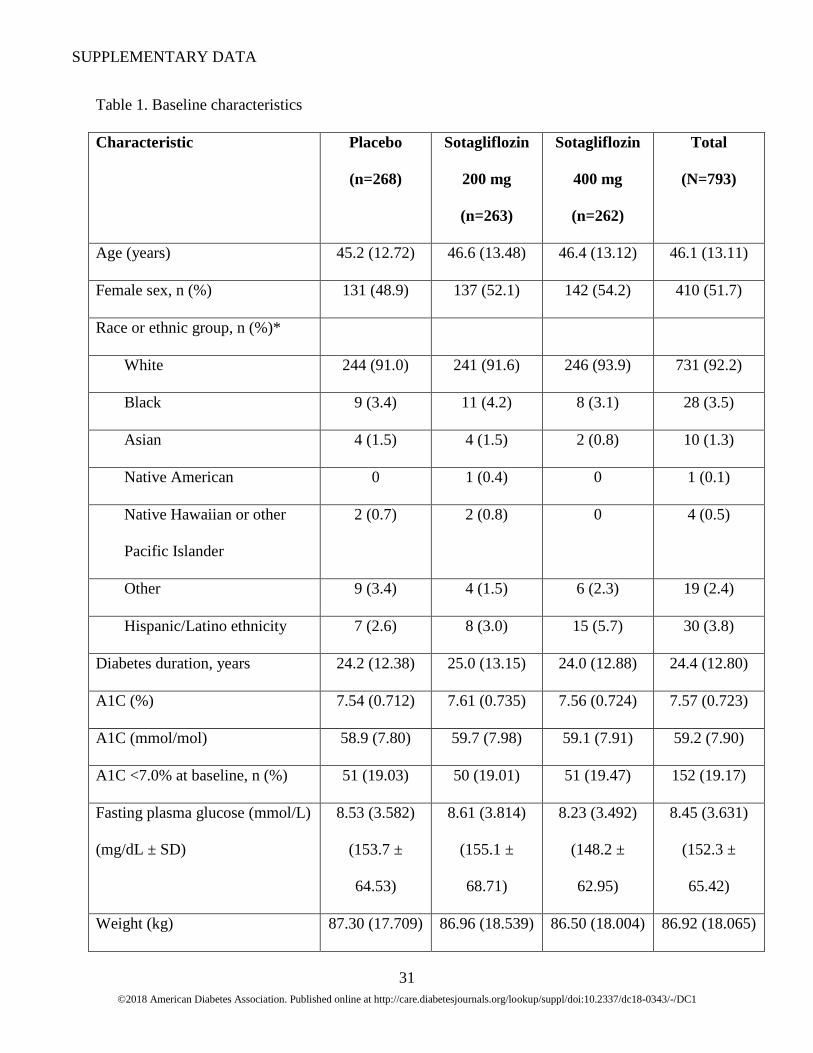
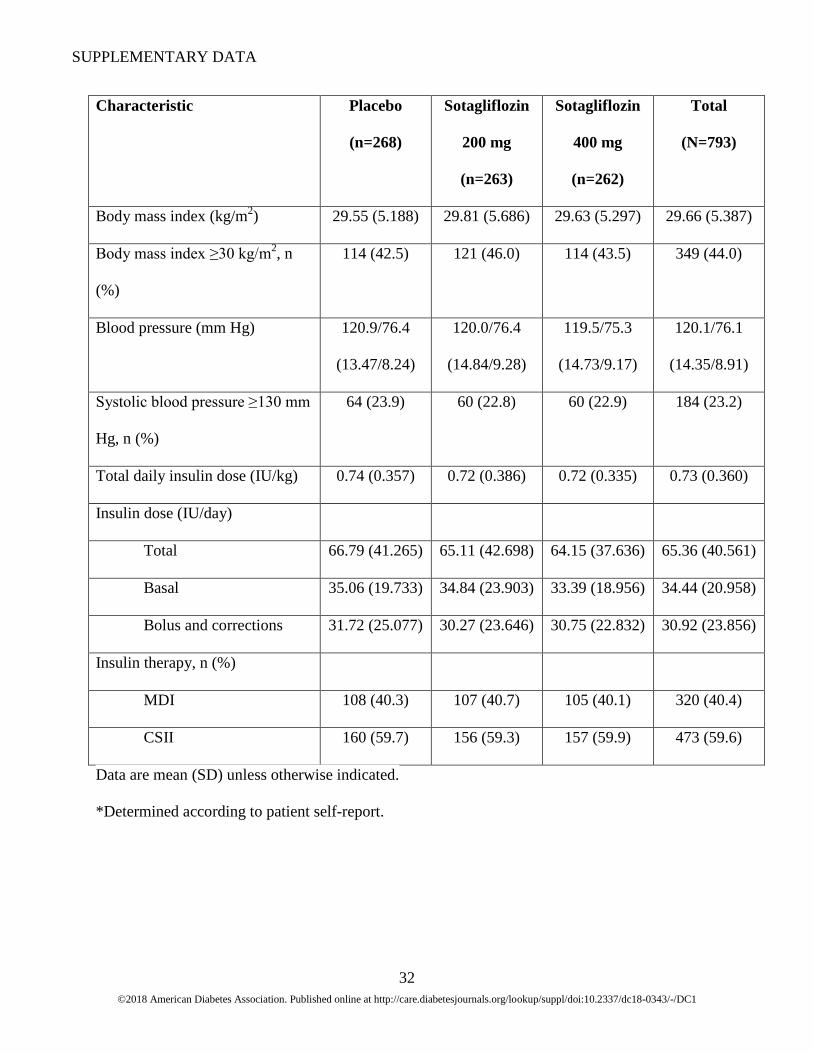
Table 1. Baseline characteristics
Characteristic Placebo
(n=268)
Sotagliflozin
200 mg
(n=263)
Sotagliflozin
400 mg
(n=262)
Total
(N=793)
Age (years) 45.2 (12.72) 46.6 (13.48) 46.4 (13.12) 46.1 (13.11)
Female sex, n (%) 131 (48.9) 137 (52.1) 142 (54.2) 410 (51.7)
Race or ethnic group, n (%)*
White 244 (91.0) 241 (91.6) 246 (93.9) 731 (92.2)
Black 9 (3.4) 11 (4.2) 8 (3.1) 28 (3.5)
Asian 4 (1.5) 4 (1.5) 2 (0.8) 10 (1.3)
Native American 0 1 (0.4) 0 1 (0.1)
Native Hawaiian or other
Pacific Islander
2 (0.7) 2 (0.8) 0 4 (0.5)
Other 9 (3.4) 4 (1.5) 6 (2.3) 19 (2.4)
Hispanic/Latino ethnicity 7 (2.6) 8 (3.0) 15 (5.7) 30 (3.8)
Diabetes duration, years 24.2 (12.38) 25.0 (13.15) 24.0 (12.88) 24.4 (12.80)
A1C (%) 7.54 (0.712) 7.61 (0.735) 7.56 (0.724) 7.57 (0.723)
A1C (mmol/mol) 58.9 (7.80) 59.7 (7.98) 59.1 (7.91) 59.2 (7.90)
A1C <7.0% at baseline, n (%) 51 (19.03) 50 (19.01) 51 (19.47) 152 (19.17)
Fasting plasma glucose (mmol/L)
(mg/dL ± SD)
8.53 (3.582)
(153.7 ±
64.53)
8.61 (3.814)
(155.1 ±
68.71)
8.23 (3.492)
(148.2 ±
62.95)
8.45 (3.631)
(152.3 ±
65.42)
Weight (kg) 87.30 (17.709) 86.96 (18.539) 86.50 (18.004) 86.92 (18.065)
SUPPLEMENTARY DATA
©2018 American Diabetes Association. Published online at http://care.diabetesjournals.org/lookup/suppl/doi:10.2337/dc18-0343/-/DC1
32
Characteristic Placebo
(n=268)
Sotagliflozin
200 mg
(n=263)
Sotagliflozin
400 mg
(n=262)
Total
(N=793)
Body mass index (kg/m2) 29.55 (5.188) 29.81 (5.686) 29.63 (5.297) 29.66 (5.387)
Body mass index ≥30 kg/m2, n
(%)
114 (42.5) 121 (46.0) 114 (43.5) 349 (44.0)
Blood pressure (mm Hg) 120.9/76.4
(13.47/8.24)
120.0/76.4
(14.84/9.28)
119.5/75.3
(14.73/9.17)
120.1/76.1
(14.35/8.91)
Systolic blood pressure ≥130 mm
Hg, n (%)
64 (23.9) 60 (22.8) 60 (22.9) 184 (23.2)
Total daily insulin dose (IU/kg) 0.74 (0.357) 0.72 (0.386) 0.72 (0.335) 0.73 (0.360)
Insulin dose (IU/day)
Total 66.79 (41.265) 65.11 (42.698) 64.15 (37.636) 65.36 (40.561)
Basal 35.06 (19.733) 34.84 (23.903) 33.39 (18.956) 34.44 (20.958)
Bolus and corrections 31.72 (25.077) 30.27 (23.646) 30.75 (22.832) 30.92 (23.856)
Insulin therapy, n (%)
MDI 108 (40.3) 107 (40.7) 105 (40.1) 320 (40.4)
CSII 160 (59.7) 156 (59.3) 157 (59.9) 473 (59.6)
Data are mean (SD) unless otherwise indicated.
*Determined according to patient self-report.
33
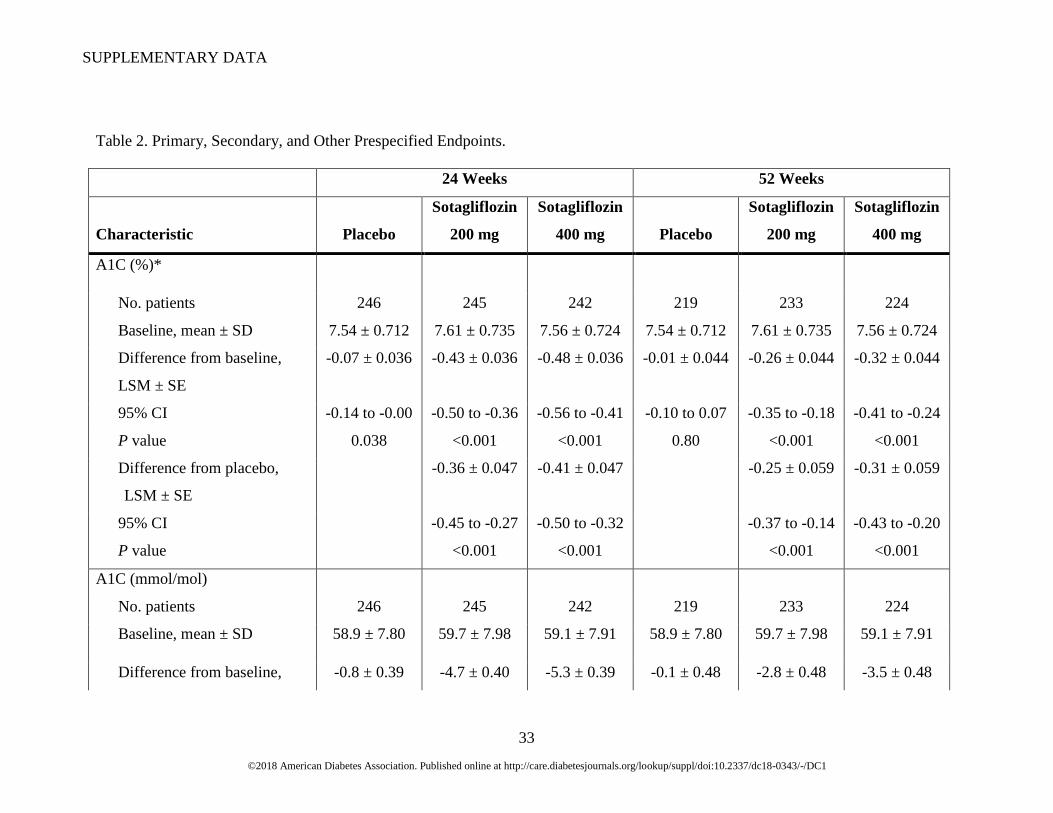
Table 2. Primary, Secondary, and Other Prespecified Endpoints.
24 Weeks 52 Weeks
Characteristic Placebo
Sotagliflozin
200 mg
Sotagliflozin
400 mg Placebo
Sotagliflozin
200 mg
Sotagliflozin
400 mg
A1C (%)*
No. patients 246 245 242 219 233 224
Baseline, mean ± SD 7.54 ± 0.712 7.61 ± 0.735 7.56 ± 0.724 7.54 ± 0.712 7.61 ± 0.735 7.56 ± 0.724
Difference from baseline,
LSM ± SE
-0.07 ± 0.036 -0.43 ± 0.036 -0.48 ± 0.036 -0.01 ± 0.044 -0.26 ± 0.044 -0.32 ± 0.044
95% CI -0.14 to -0.00 -0.50 to -0.36 -0.56 to -0.41 -0.10 to 0.07 -0.35 to -0.18 -0.41 to -0.24
P value 0.038 <0.001 <0.001 0.80 <0.001 <0.001
Difference from placebo,
LSM ± SE
-0.36 ± 0.047 -0.41 ± 0.047 -0.25 ± 0.059 -0.31 ± 0.059
95% CI -0.45 to -0.27 -0.50 to -0.32 -0.37 to -0.14 -0.43 to -0.20
P value <0.001 <0.001 <0.001 <0.001
A1C (mmol/mol)
No. patients 246 245 242 219 233 224
Baseline, mean ± SD 58.9 ± 7.80 59.7 ± 7.98 59.1 ± 7.91 58.9 ± 7.80 59.7 ± 7.98 59.1 ± 7.91
Difference from baseline, -0.8 ± 0.39 -4.7 ± 0.40 -5.3 ± 0.39 -0.1 ± 0.48 -2.8 ± 0.48 -3.5 ± 0.48
SUPPLEMENTARY DATA
©2018 American Diabetes Association. Published online at http://care.diabetesjournals.org/lookup/suppl/doi:10.2337/dc18-0343/-/DC1

SUPPLEMENTARY DATA
©2018 American Diabetes Association. Published online at http://care.diabetesjournals.org/lookup/suppl/doi:10.2337/dc18-0343/-/DC1
34
24 Weeks 52 Weeks
Characteristic Placebo
Sotagliflozin
200 mg
Sotagliflozin
400 mg Placebo
Sotagliflozin
200 mg
Sotagliflozin
400 mg
LSM ± SE
95% CI -1.5 to -0.0 -5.5 to -3.9 -6.1 to -4.5 -1.0 to 0.8 -3.8 to -1.9 -4.5 to -2.6
P value 0.046 <0.001 <0.001 0.82 <0.001 <0.001
Difference from placebo,
LSM ± SE
-3.9 ± 0.51 -4.5 ± 0.51 -2.7 ± 0.64 -3.4 ± 0.64
95% CI -4.9 to -2.9 -5.5 to -3.5 -4.0 to -1.5 -4.7 to -2.2
P value <0.001 <0.001 <0.001 <0.001
FPG (mmol/L)†
No. patients 245 245 242 219 231 224
Baseline, mean ± SD 8.53 ± 3.582 8.61 ± 3.814 8.23 ± 3.492 8.53 ± 3.582 8.61 ± 3.814 8.23 ± 3.492
Difference from baseline,
LSM ± SE
0.21 ± 0.191 -0.34 ± 0.192 -0.78 ± 0.193 0.50 ± 0.227 -0.18 ± 0.222 -0.58 ± 0.225
95% CI -0.17 to 0.59 -0.72 to 0.04 -1.16 to -0.40 0.05 to 0.94 -0.62 to 0.26 -1.02 to -0.13
P value 0.27 0.08 <0.001 0.028 0.42 0.011
Difference from placebo,
LSM ± SE
-0.55 ± 0.259 -0.99 ± 0.260 -0.68 ± 0.308 -1.08 ± 0.311
95% CI -1.06 to -0.04 -1.50 to -0.48 -1.28 to -0.08 -1.69 to -0.47
P value 0.034 <0.001 0.028 <0.001
SUPPLEMENTARY DATA
©2018 American Diabetes Association. Published online at http://care.diabetesjournals.org/lookup/suppl/doi:10.2337/dc18-0343/-/DC1
35
24 Weeks 52 Weeks
Characteristic Placebo
Sotagliflozin
200 mg
Sotagliflozin
400 mg Placebo
Sotagliflozin
200 mg
Sotagliflozin
400 mg
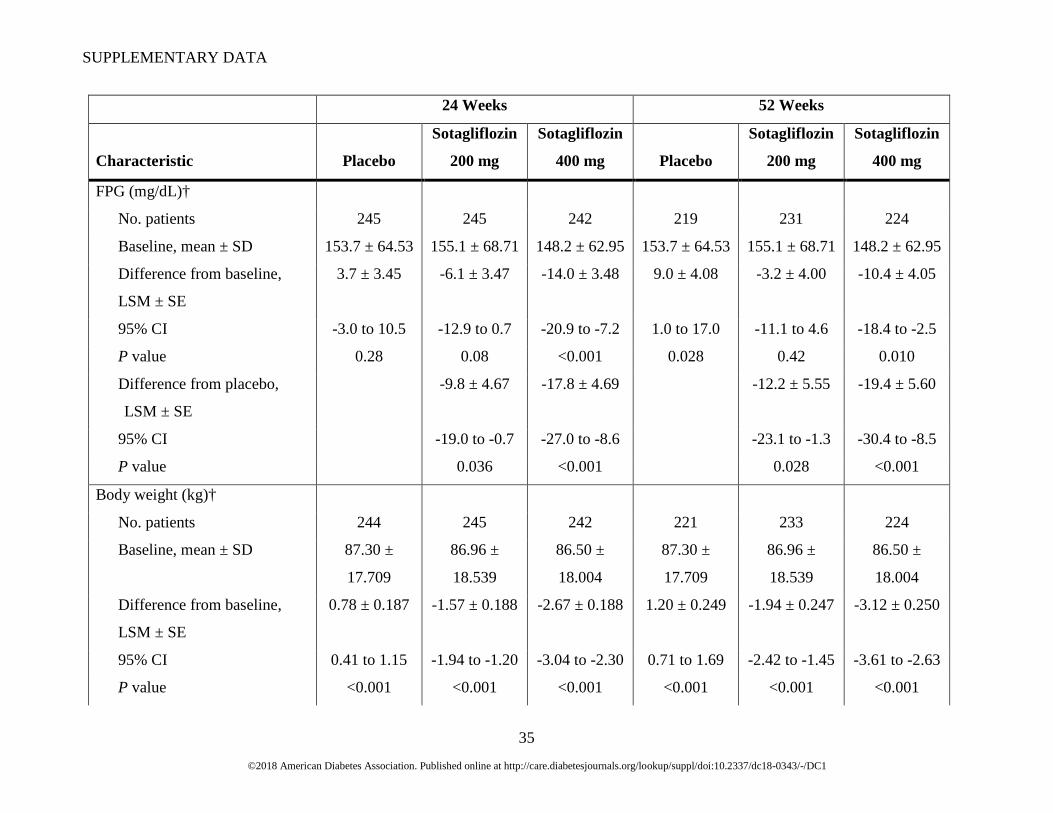
FPG (mg/dL)†
No. patients 245 245 242 219 231 224
Baseline, mean ± SD 153.7 ± 64.53 155.1 ± 68.71 148.2 ± 62.95 153.7 ± 64.53 155.1 ± 68.71 148.2 ± 62.95
Difference from baseline,
LSM ± SE
3.7 ± 3.45 -6.1 ± 3.47 -14.0 ± 3.48 9.0 ± 4.08 -3.2 ± 4.00 -10.4 ± 4.05
95% CI -3.0 to 10.5 -12.9 to 0.7 -20.9 to -7.2 1.0 to 17.0 -11.1 to 4.6 -18.4 to -2.5
P value 0.28 0.08 <0.001 0.028 0.42 0.010
Difference from placebo,
LSM ± SE
-9.8 ± 4.67 -17.8 ± 4.69 -12.2 ± 5.55 -19.4 ± 5.60
95% CI -19.0 to -0.7 -27.0 to -8.6 -23.1 to -1.3 -30.4 to -8.5
P value 0.036 <0.001 0.028 <0.001
Body weight (kg)†
No. patients 244 245 242 221 233 224
Baseline, mean ± SD 87.30 ±
17.709
86.96 ±
18.539
86.50 ±
18.004
87.30 ±
17.709
86.96 ±
18.539
86.50 ±
18.004
Difference from baseline,
LSM ± SE
0.78 ± 0.187 -1.57 ± 0.188 -2.67 ± 0.188 1.20 ± 0.249 -1.94 ± 0.247 -3.12 ± 0.250
95% CI 0.41 to 1.15 -1.94 to -1.20 -3.04 to -2.30 0.71 to 1.69 -2.42 to -1.45 -3.61 to -2.63
P value <0.001 <0.001 <0.001 <0.001 <0.001 <0.001
SUPPLEMENTARY DATA
©2018 American Diabetes Association. Published online at http://care.diabetesjournals.org/lookup/suppl/doi:10.2337/dc18-0343/-/DC1
36
24 Weeks 52 Weeks
Characteristic Placebo
Sotagliflozin
200 mg
Sotagliflozin
400 mg Placebo
Sotagliflozin
200 mg
Sotagliflozin
400 mg
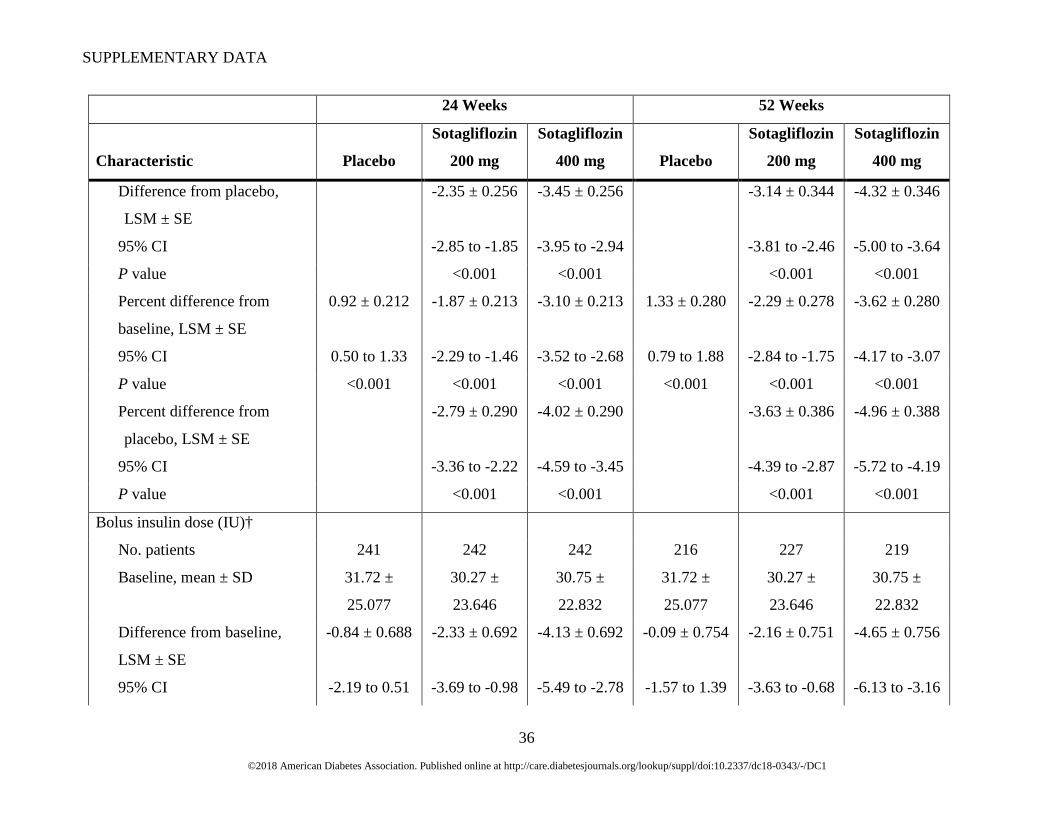
Difference from placebo,
LSM ± SE
-2.35 ± 0.256 -3.45 ± 0.256 -3.14 ± 0.344 -4.32 ± 0.346
95% CI -2.85 to -1.85 -3.95 to -2.94 -3.81 to -2.46 -5.00 to -3.64
P value <0.001 <0.001 <0.001 <0.001
Percent difference from
baseline, LSM ± SE
0.92 ± 0.212 -1.87 ± 0.213 -3.10 ± 0.213 1.33 ± 0.280 -2.29 ± 0.278 -3.62 ± 0.280
95% CI 0.50 to 1.33 -2.29 to -1.46 -3.52 to -2.68 0.79 to 1.88 -2.84 to -1.75 -4.17 to -3.07
P value <0.001 <0.001 <0.001 <0.001 <0.001 <0.001
Percent difference from
placebo, LSM ± SE
-2.79 ± 0.290 -4.02 ± 0.290 -3.63 ± 0.386 -4.96 ± 0.388
95% CI -3.36 to -2.22 -4.59 to -3.45 -4.39 to -2.87 -5.72 to -4.19
P value <0.001 <0.001 <0.001 <0.001
Bolus insulin dose (IU)†
No. patients 241 242 242 216 227 219
Baseline, mean ± SD 31.72 ±
25.077
30.27 ±
23.646
30.75 ±
22.832
31.72 ±
25.077
30.27 ±
23.646
30.75 ±
22.832
Difference from baseline,
LSM ± SE
-0.84 ± 0.688 -2.33 ± 0.692 -4.13 ± 0.692 -0.09 ± 0.754 -2.16 ± 0.751 -4.65 ± 0.756
95% CI -2.19 to 0.51 -3.69 to -0.98 -5.49 to -2.78 -1.57 to 1.39 -3.63 to -0.68 -6.13 to -3.16
SUPPLEMENTARY DATA
©2018 American Diabetes Association. Published online at http://care.diabetesjournals.org/lookup/suppl/doi:10.2337/dc18-0343/-/DC1
37
24 Weeks 52 Weeks
Characteristic Placebo
Sotagliflozin
200 mg
Sotagliflozin
400 mg Placebo
Sotagliflozin
200 mg
Sotagliflozin
400 mg
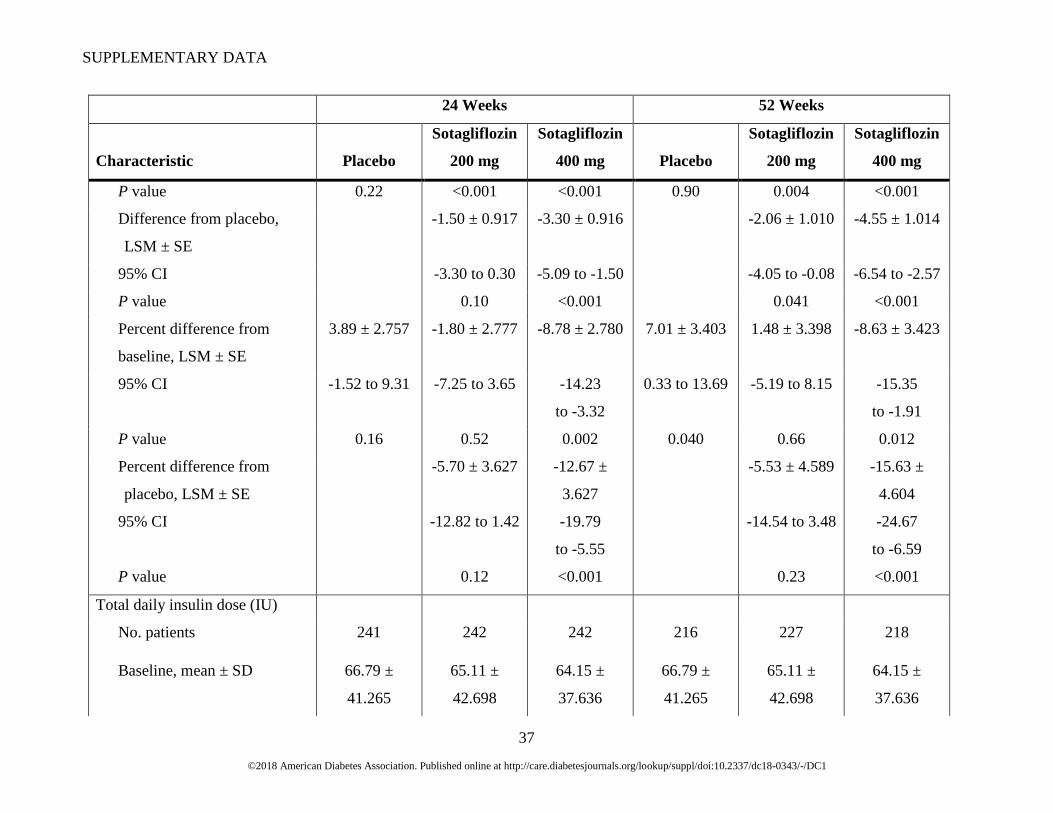
P value 0.22 <0.001 <0.001 0.90 0.004 <0.001
Difference from placebo,
LSM ± SE
-1.50 ± 0.917 -3.30 ± 0.916 -2.06 ± 1.010 -4.55 ± 1.014
95% CI -3.30 to 0.30 -5.09 to -1.50 -4.05 to -0.08 -6.54 to -2.57
P value 0.10 <0.001 0.041 <0.001
Percent difference from
baseline, LSM ± SE
3.89 ± 2.757 -1.80 ± 2.777 -8.78 ± 2.780 7.01 ± 3.403 1.48 ± 3.398 -8.63 ± 3.423
95% CI -1.52 to 9.31 -7.25 to 3.65 -14.23
to -3.32
0.33 to 13.69 -5.19 to 8.15 -15.35
to -1.91
P value 0.16 0.52 0.002 0.040 0.66 0.012
Percent difference from
placebo, LSM ± SE
-5.70 ± 3.627 -12.67 ±
3.627
-5.53 ± 4.589 -15.63 ±
4.604
95% CI -12.82 to 1.42 -19.79
to -5.55
-14.54 to 3.48 -24.67
to -6.59
P value 0.12 <0.001 0.23 <0.001
Total daily insulin dose (IU)
No. patients 241 242 242 216 227 218
Baseline, mean ± SD 66.79 ±
41.265
65.11 ±
42.698
64.15 ±
37.636
66.79 ±
41.265
65.11 ±
42.698
64.15 ±
37.636
SUPPLEMENTARY DATA
©2018 American Diabetes Association. Published online at http://care.diabetesjournals.org/lookup/suppl/doi:10.2337/dc18-0343/-/DC1
38
24 Weeks 52 Weeks
Characteristic Placebo
Sotagliflozin
200 mg
Sotagliflozin
400 mg Placebo
Sotagliflozin
200 mg
Sotagliflozin
400 mg
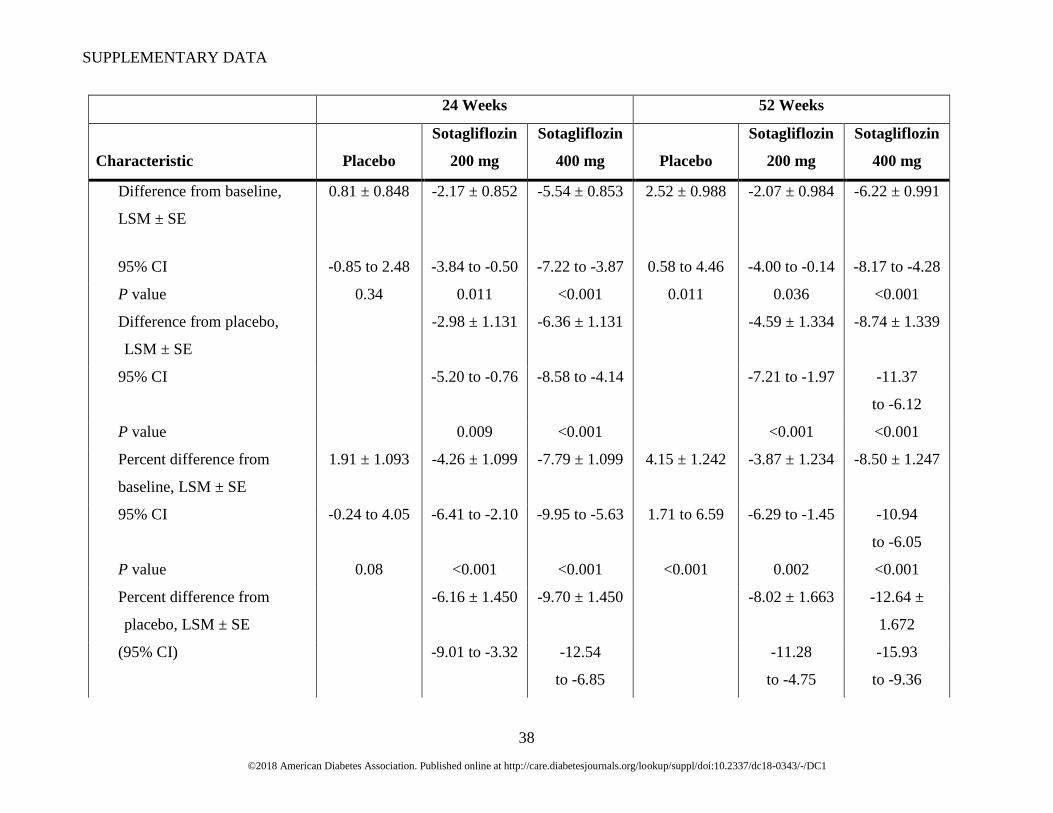
Difference from baseline,
LSM ± SE
0.81 ± 0.848 -2.17 ± 0.852 -5.54 ± 0.853 2.52 ± 0.988 -2.07 ± 0.984 -6.22 ± 0.991
95% CI -0.85 to 2.48 -3.84 to -0.50 -7.22 to -3.87 0.58 to 4.46 -4.00 to -0.14 -8.17 to -4.28
P value 0.34 0.011 <0.001 0.011 0.036 <0.001
Difference from placebo,
LSM ± SE
-2.98 ± 1.131 -6.36 ± 1.131 -4.59 ± 1.334 -8.74 ± 1.339
95% CI -5.20 to -0.76 -8.58 to -4.14 -7.21 to -1.97 -11.37
to -6.12
P value 0.009 <0.001 <0.001 <0.001
Percent difference from
baseline, LSM ± SE
1.91 ± 1.093 -4.26 ± 1.099 -7.79 ± 1.099 4.15 ± 1.242 -3.87 ± 1.234 -8.50 ± 1.247
95% CI -0.24 to 4.05 -6.41 to -2.10 -9.95 to -5.63 1.71 to 6.59 -6.29 to -1.45 -10.94
to -6.05
P value 0.08 <0.001 <0.001 <0.001 0.002 <0.001
Percent difference from
placebo, LSM ± SE
-6.16 ± 1.450 -9.70 ± 1.450 -8.02 ± 1.663 -12.64 ±
1.672
(95% CI) -9.01 to -3.32 -12.54
to -6.85
-11.28
to -4.75
-15.93
to -9.36
SUPPLEMENTARY DATA
©2018 American Diabetes Association. Published online at http://care.diabetesjournals.org/lookup/suppl/doi:10.2337/dc18-0343/-/DC1
39
24 Weeks 52 Weeks
Characteristic Placebo
Sotagliflozin
200 mg
Sotagliflozin
400 mg Placebo
Sotagliflozin
200 mg
Sotagliflozin
400 mg
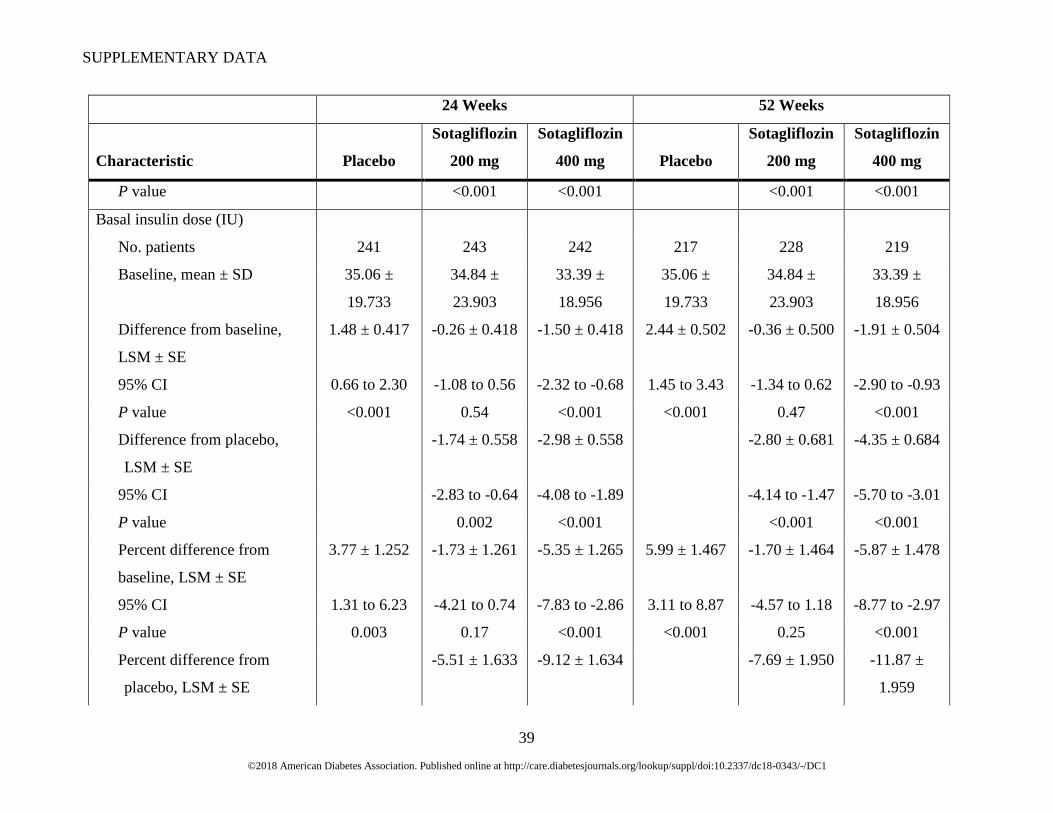
P value <0.001 <0.001 <0.001 <0.001
Basal insulin dose (IU)
No. patients 241 243 242 217 228 219
Baseline, mean ± SD 35.06 ±
19.733
34.84 ±
23.903
33.39 ±
18.956
35.06 ±
19.733
34.84 ±
23.903
33.39 ±
18.956
Difference from baseline,
LSM ± SE
1.48 ± 0.417 -0.26 ± 0.418 -1.50 ± 0.418 2.44 ± 0.502 -0.36 ± 0.500 -1.91 ± 0.504
95% CI 0.66 to 2.30 -1.08 to 0.56 -2.32 to -0.68 1.45 to 3.43 -1.34 to 0.62 -2.90 to -0.93
P value <0.001 0.54 <0.001 <0.001 0.47 <0.001
Difference from placebo,
LSM ± SE
-1.74 ± 0.558 -2.98 ± 0.558 -2.80 ± 0.681 -4.35 ± 0.684
95% CI -2.83 to -0.64 -4.08 to -1.89 -4.14 to -1.47 -5.70 to -3.01
P value 0.002 <0.001 <0.001 <0.001
Percent difference from
baseline, LSM ± SE
3.77 ± 1.252 -1.73 ± 1.261 -5.35 ± 1.265 5.99 ± 1.467 -1.70 ± 1.464 -5.87 ± 1.478
95% CI 1.31 to 6.23 -4.21 to 0.74 -7.83 to -2.86 3.11 to 8.87 -4.57 to 1.18 -8.77 to -2.97
P value 0.003 0.17 <0.001 <0.001 0.25 <0.001
Percent difference from
placebo, LSM ± SE
-5.51 ± 1.633 -9.12 ± 1.634 -7.69 ± 1.950 -11.87 ±
1.959

SUPPLEMENTARY DATA
©2018 American Diabetes Association. Published online at http://care.diabetesjournals.org/lookup/suppl/doi:10.2337/dc18-0343/-/DC1
40
24 Weeks 52 Weeks
Characteristic Placebo
Sotagliflozin
200 mg
Sotagliflozin
400 mg Placebo
Sotagliflozin
200 mg
Sotagliflozin
400 mg
95% CI -8.71 to -2.30 -12.32
to -5.91
-11.52
to -3.86
-15.71
to -8.02
P value <0.001 <0.001 <0.001 <0.001
SBP, mITT population (mm Hg)
No. patients (week 12, week
52)
251 247 253 221 233 224
Baseline, mean ± SD 120.9 ± 13.47 120.0 ± 14.84 119.5 ± 14.73 120.9 ± 13.47 120.0 ± 14.84 119.5 ± 14.73
Difference from baseline
(week 12, week 52), LSM ±
SE
1.0 ± 0.66 -2.5 ± 0.67 -3.2 ± 0.66 1.7 ± 0.74 -1.1 ± 0.73 -2.7 ± 0.74
95% CI -0.3 to 2.3 -3.8 to -1.2 -4.5 to -1.9 0.3 to 3.1 -2.5 to 0.3 -4.2 to -1.3
P value 0.14 <0.001 <0.001 0.021 0.14 <0.001
Difference from placebo,
LSM ± SE
-3.5 ± 0.88 -4.2 ± 0.88 -2.8 ± 0.99 -4.4 ± 0.99
95% CI -5.2 to -1.8 -5.9 to -2.4 -4.7 to -0.9 -6.4 to -2.5
P value <0.001 <0.001 0.005 <0.001
DBP, mITT population (mm Hg)
No. patients (week 12, week
52)
251 247 253 221 233 224
SUPPLEMENTARY DATA
©2018 American Diabetes Association. Published online at http://care.diabetesjournals.org/lookup/suppl/doi:10.2337/dc18-0343/-/DC1
41
24 Weeks 52 Weeks
Characteristic Placebo
Sotagliflozin
200 mg
Sotagliflozin
400 mg Placebo
Sotagliflozin
200 mg
Sotagliflozin
400 mg
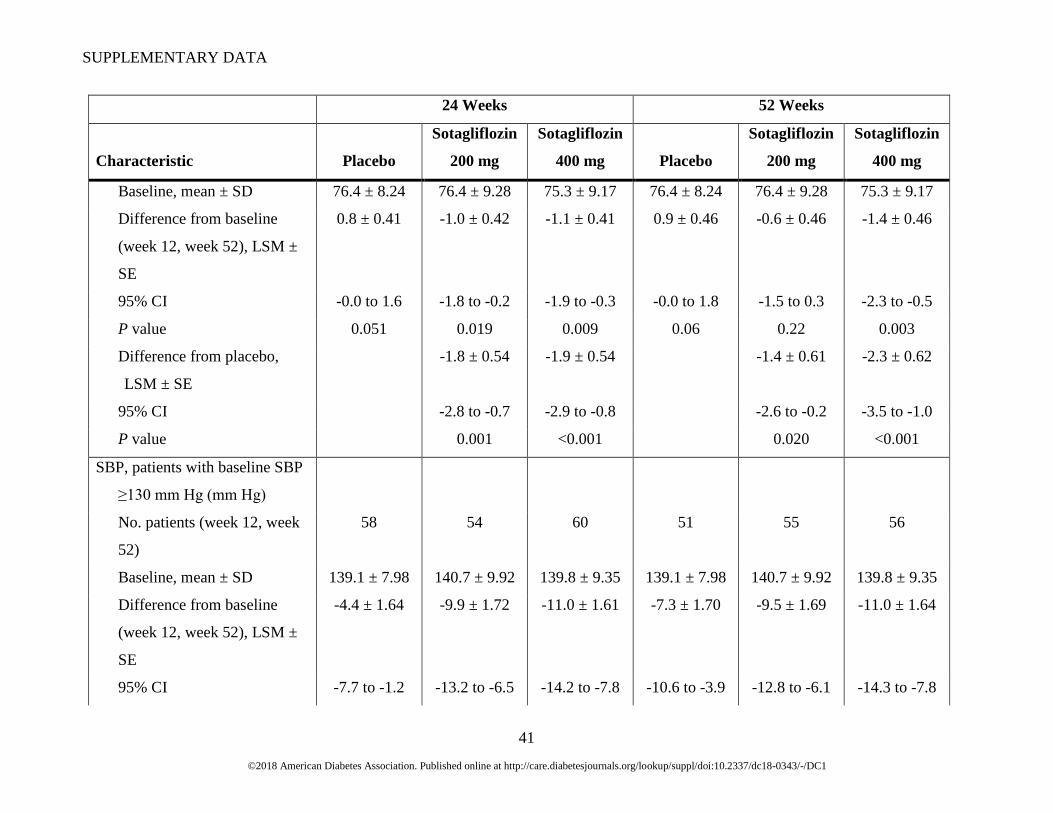
Baseline, mean ± SD 76.4 ± 8.24 76.4 ± 9.28 75.3 ± 9.17 76.4 ± 8.24 76.4 ± 9.28 75.3 ± 9.17
Difference from baseline
(week 12, week 52), LSM ±
SE
0.8 ± 0.41 -1.0 ± 0.42 -1.1 ± 0.41 0.9 ± 0.46 -0.6 ± 0.46 -1.4 ± 0.46
95% CI -0.0 to 1.6 -1.8 to -0.2 -1.9 to -0.3 -0.0 to 1.8 -1.5 to 0.3 -2.3 to -0.5
P value 0.051 0.019 0.009 0.06 0.22 0.003
Difference from placebo,
LSM ± SE
-1.8 ± 0.54 -1.9 ± 0.54 -1.4 ± 0.61 -2.3 ± 0.62
95% CI -2.8 to -0.7 -2.9 to -0.8 -2.6 to -0.2 -3.5 to -1.0
P value 0.001 <0.001 0.020 <0.001
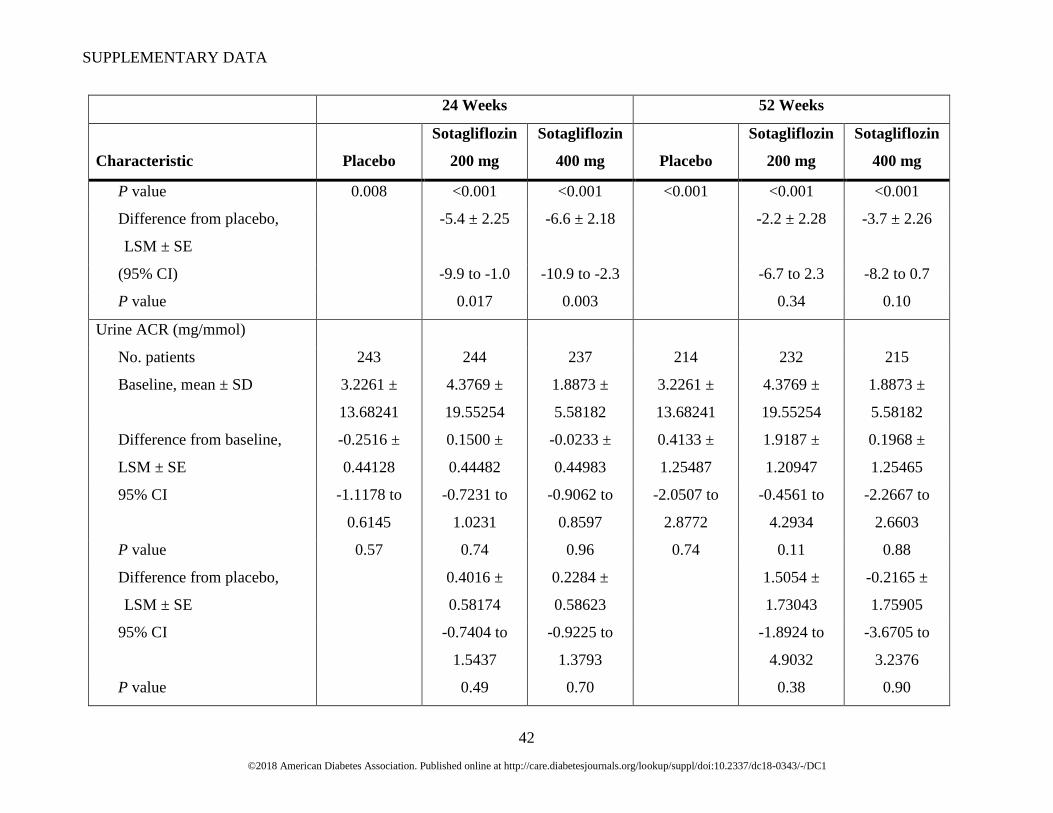
SBP, patients with baseline SBP
≥130 mm Hg (mm Hg)
No. patients (week 12, week
52)
58 54 60 51 55 56
Baseline, mean ± SD 139.1 ± 7.98 140.7 ± 9.92 139.8 ± 9.35 139.1 ± 7.98 140.7 ± 9.92 139.8 ± 9.35
Difference from baseline
(week 12, week 52), LSM ±
SE
-4.4 ± 1.64 -9.9 ± 1.72 -11.0 ± 1.61 -7.3 ± 1.70 -9.5 ± 1.69 -11.0 ± 1.64
95% CI -7.7 to -1.2 -13.2 to -6.5 -14.2 to -7.8 -10.6 to -3.9 -12.8 to -6.1 -14.3 to -7.8
SUPPLEMENTARY DATA
©2018 American Diabetes Association. Published online at http://care.diabetesjournals.org/lookup/suppl/doi:10.2337/dc18-0343/-/DC1
42
24 Weeks 52 Weeks
Characteristic Placebo
Sotagliflozin
200 mg
Sotagliflozin
400 mg Placebo
Sotagliflozin
200 mg
Sotagliflozin
400 mg
P value 0.008 <0.001 <0.001 <0.001 <0.001 <0.001
Difference from placebo,
LSM ± SE
-5.4 ± 2.25 -6.6 ± 2.18 -2.2 ± 2.28 -3.7 ± 2.26
(95% CI) -9.9 to -1.0 -10.9 to -2.3 -6.7 to 2.3 -8.2 to 0.7
P value 0.017 0.003 0.34 0.10
Urine ACR (mg/mmol)
No. patients 243 244 237 214 232 215
Baseline, mean ± SD 3.2261 ±
13.68241
4.3769 ±
19.55254
1.8873 ±
5.58182
3.2261 ±
13.68241
4.3769 ±
19.55254
1.8873 ±
5.58182
Difference from baseline,
LSM ± SE
-0.2516 ±
0.44128
0.1500 ±
0.44482
-0.0233 ±
0.44983
0.4133 ±
1.25487
1.9187 ±
1.20947
0.1968 ±
1.25465
95% CI -1.1178 to
0.6145
-0.7231 to
1.0231
-0.9062 to
0.8597
-2.0507 to
2.8772
-0.4561 to
4.2934
-2.2667 to
2.6603
P value 0.57 0.74 0.96 0.74 0.11 0.88
Difference from placebo,
LSM ± SE
0.4016 ±
0.58174
0.2284 ±
0.58623
1.5054 ±
1.73043
-0.2165 ±
1.75905
95% CI -0.7404 to
1.5437
-0.9225 to
1.3793
-1.8924 to
4.9032
-3.6705 to
3.2376
P value 0.49 0.70 0.38 0.90

SUPPLEMENTARY DATA
©2018 American Diabetes Association. Published online at http://care.diabetesjournals.org/lookup/suppl/doi:10.2337/dc18-0343/-/DC1
43
24 Weeks 52 Weeks
Characteristic Placebo
Sotagliflozin
200 mg
Sotagliflozin
400 mg Placebo
Sotagliflozin
200 mg
Sotagliflozin
400 mg
eGFR (mL/min/1.73 m2)
No. patients 244 243 239 217 233 223
Baseline, mean ± SD 87.58 ±
18.465
87.04 ±
20.182
86.58 ±
18.933
87.58 ±
18.465
87.04 ±
20.182
86.58 ±
18.933
Difference from baseline,‡
LSM ± SD
-0.20 ± 0.684 -2.18 ± 0.690 -2.35 ± 0.694 -1.06 ± 0.722 -2.46 ± 0.713 -2.16 ± 0.722
95% CI -1.54 to 1.14 -3.53 to -0.82 -3.71 to -0.99 -2.48 to 0.36 -3.86 to -1.06 -3.58 to -0.74
P value 0.77 0.002 <0.001 0.14 <0.001 0.003
Difference from placebo,
LSM ± SD
-1.98 ± 0.904 -2.15 ± 0.906 -1.40 ± 0.951 -1.10 ± 0.957
95% CI -3.75 to -0.20 -3.93 to -0.37 -3.27 to 0.46 -2.98 to 0.78
P value 0.029 0.018 0.14 0.25
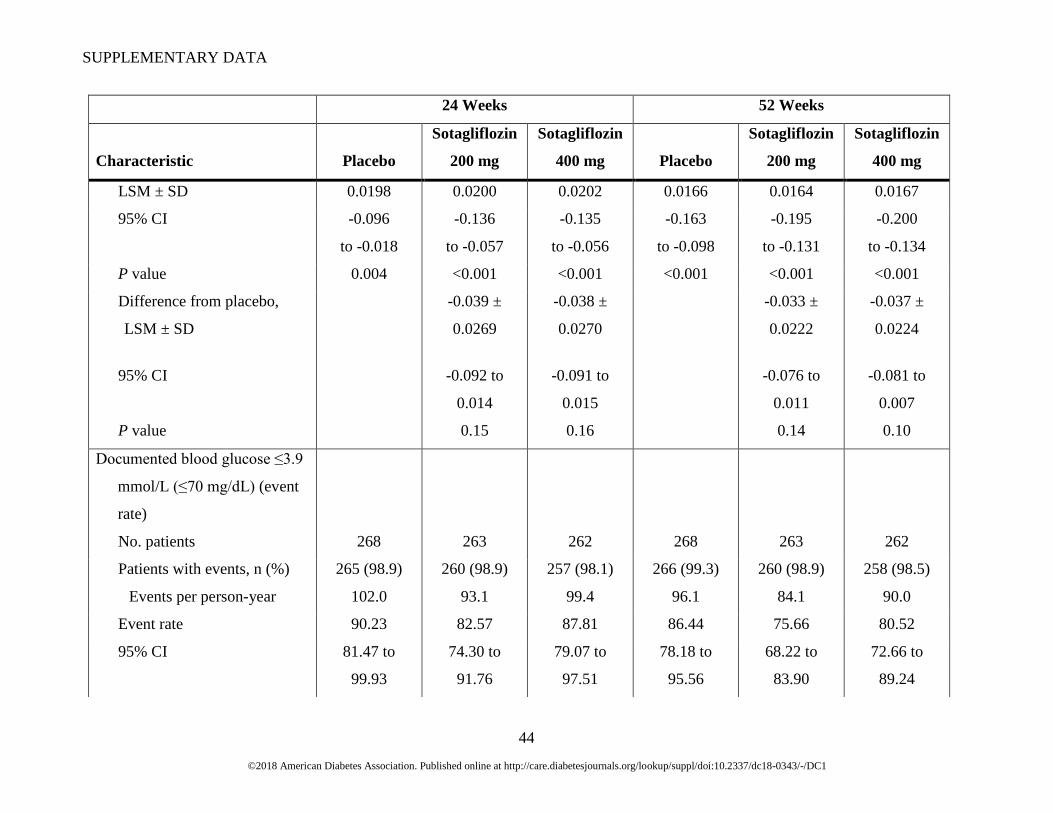
Documented blood glucose ≤3.9
mmol/L (≤70 mg/dL)
(events/patient/day)
No. patients 249 244 239 238 245 237
Baseline, mean ± SD 0.339 ±
0.3489
0.341 ±
0.3407
0.334
± 0.3368
0.339 ±
0.3489
0.341 ±
0.3407
0.334
± 0.3368
Difference from baseline, -0.057 ± -0.096 ± -0.095 ± -0.130 ± -0.163 ± -0.167 ±
SUPPLEMENTARY DATA
©2018 American Diabetes Association. Published online at http://care.diabetesjournals.org/lookup/suppl/doi:10.2337/dc18-0343/-/DC1
44
24 Weeks 52 Weeks
Characteristic Placebo
Sotagliflozin
200 mg
Sotagliflozin
400 mg Placebo
Sotagliflozin
200 mg
Sotagliflozin
400 mg
LSM ± SD 0.0198 0.0200 0.0202 0.0166 0.0164 0.0167
95% CI -0.096
to -0.018
-0.136
to -0.057
-0.135
to -0.056
-0.163
to -0.098
-0.195
to -0.131
-0.200
to -0.134
P value 0.004 <0.001 <0.001 <0.001 <0.001 <0.001
Difference from placebo,
LSM ± SD
-0.039 ±
0.0269
-0.038 ±
0.0270
-0.033 ±
0.0222
-0.037 ±
0.0224
95% CI -0.092 to
0.014
-0.091 to
0.015
-0.076 to
0.011
-0.081 to
0.007
P value 0.15 0.16 0.14 0.10
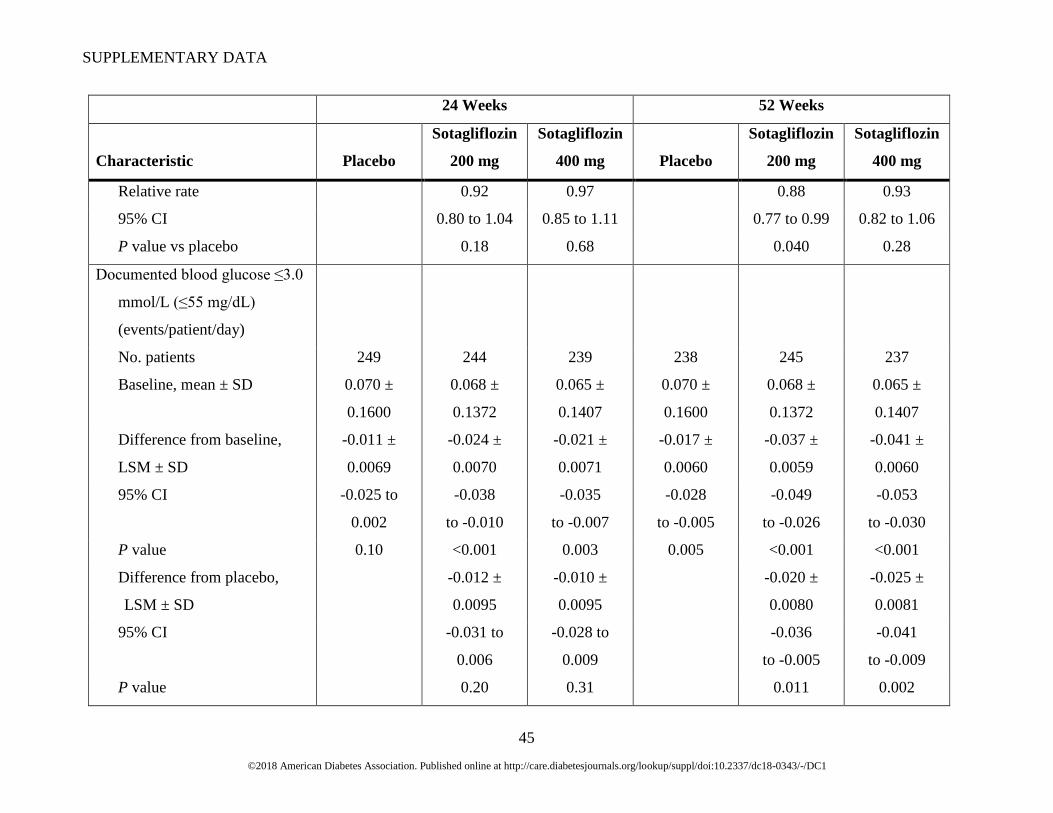
Documented blood glucose ≤3.9
mmol/L (≤70 mg/dL) (event
rate)
No. patients 268 263 262 268 263 262
Patients with events, n (%) 265 (98.9) 260 (98.9) 257 (98.1) 266 (99.3) 260 (98.9) 258 (98.5)
Events per person-year 102.0 93.1 99.4 96.1 84.1 90.0
Event rate 90.23 82.57 87.81 86.44 75.66 80.52
95% CI 81.47 to
99.93
74.30 to
91.76
79.07 to
97.51
78.18 to
95.56
68.22 to
83.90
72.66 to
89.24
SUPPLEMENTARY DATA
©2018 American Diabetes Association. Published online at http://care.diabetesjournals.org/lookup/suppl/doi:10.2337/dc18-0343/-/DC1
45
24 Weeks 52 Weeks
Characteristic Placebo
Sotagliflozin
200 mg
Sotagliflozin
400 mg Placebo
Sotagliflozin
200 mg
Sotagliflozin
400 mg
Relative rate 0.92 0.97 0.88 0.93
95% CI 0.80 to 1.04 0.85 to 1.11 0.77 to 0.99 0.82 to 1.06
P value vs placebo 0.18 0.68 0.040 0.28
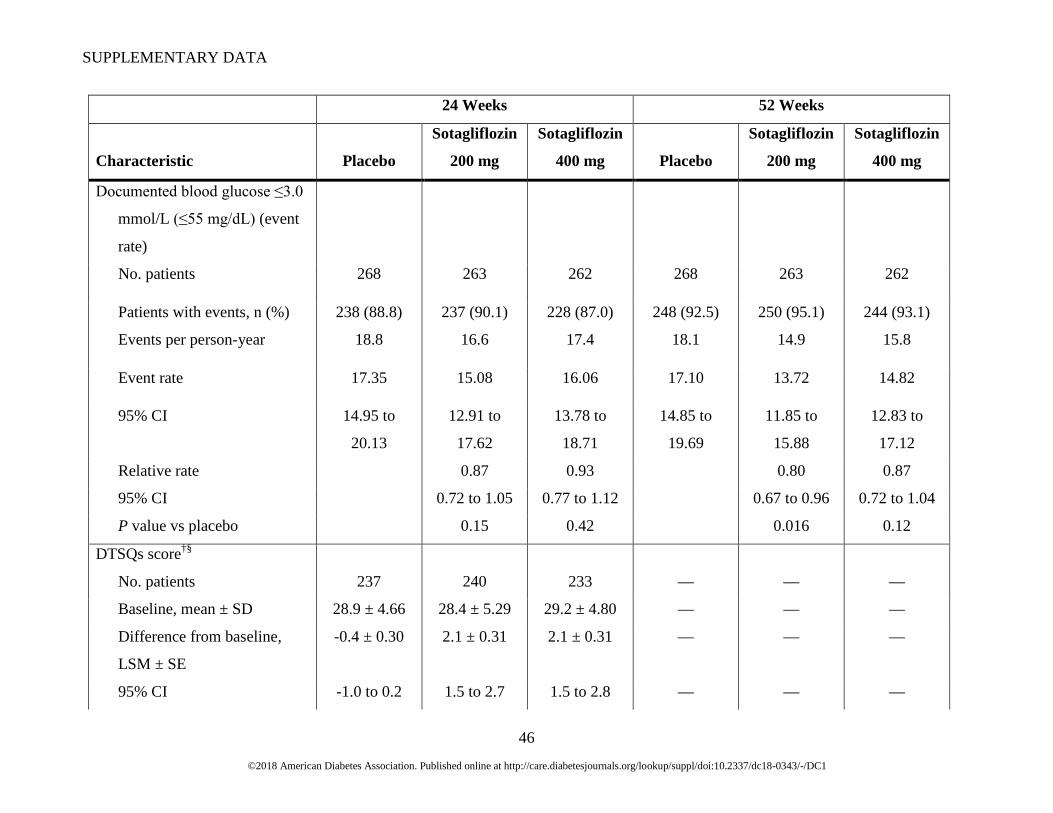
Documented blood glucose ≤3.0
mmol/L (≤55 mg/dL)
(events/patient/day)
No. patients 249 244 239 238 245 237
Baseline, mean ± SD 0.070 ±
0.1600
0.068 ±
0.1372
0.065 ±
0.1407
0.070 ±
0.1600
0.068 ±
0.1372
0.065 ±
0.1407
Difference from baseline,
LSM ± SD
-0.011 ±
0.0069
-0.024 ±
0.0070
-0.021 ±
0.0071
-0.017 ±
0.0060
-0.037 ±
0.0059
-0.041 ±
0.0060
95% CI -0.025 to
0.002
-0.038
to -0.010
-0.035
to -0.007
-0.028
to -0.005
-0.049
to -0.026
-0.053
to -0.030
P value 0.10 <0.001 0.003 0.005 <0.001 <0.001
Difference from placebo,
LSM ± SD
-0.012 ±
0.0095
-0.010 ±
0.0095
-0.020 ±
0.0080
-0.025 ±
0.0081
95% CI -0.031 to
0.006
-0.028 to
0.009
-0.036
to -0.005
-0.041
to -0.009
P value 0.20 0.31 0.011 0.002
SUPPLEMENTARY DATA
©2018 American Diabetes Association. Published online at http://care.diabetesjournals.org/lookup/suppl/doi:10.2337/dc18-0343/-/DC1
46
24 Weeks 52 Weeks
Characteristic Placebo
Sotagliflozin
200 mg
Sotagliflozin
400 mg Placebo
Sotagliflozin
200 mg
Sotagliflozin
400 mg
Documented blood glucose ≤3.0
mmol/L (≤55 mg/dL) (event
rate)
No. patients 268 263 262 268 263 262
Patients with events, n (%) 238 (88.8) 237 (90.1) 228 (87.0) 248 (92.5) 250 (95.1) 244 (93.1)
Events per person-year 18.8 16.6 17.4 18.1 14.9 15.8
Event rate 17.35 15.08 16.06 17.10 13.72 14.82
95% CI 14.95 to
20.13
12.91 to
17.62
13.78 to
18.71
14.85 to
19.69
11.85 to
15.88
12.83 to
17.12
Relative rate 0.87 0.93 0.80 0.87
95% CI 0.72 to 1.05 0.77 to 1.12 0.67 to 0.96 0.72 to 1.04
P value vs placebo 0.15 0.42 0.016 0.12
DTSQs score†§
No. patients 237 240 233 — — —
Baseline, mean ± SD 28.9 ± 4.66 28.4 ± 5.29 29.2 ± 4.80 — — —
Difference from baseline,
LSM ± SE
-0.4 ± 0.30 2.1 ± 0.31 2.1 ± 0.31 — — —
95% CI -1.0 to 0.2 1.5 to 2.7 1.5 to 2.8 — — —
SUPPLEMENTARY DATA
©2018 American Diabetes Association. Published online at http://care.diabetesjournals.org/lookup/suppl/doi:10.2337/dc18-0343/-/DC1
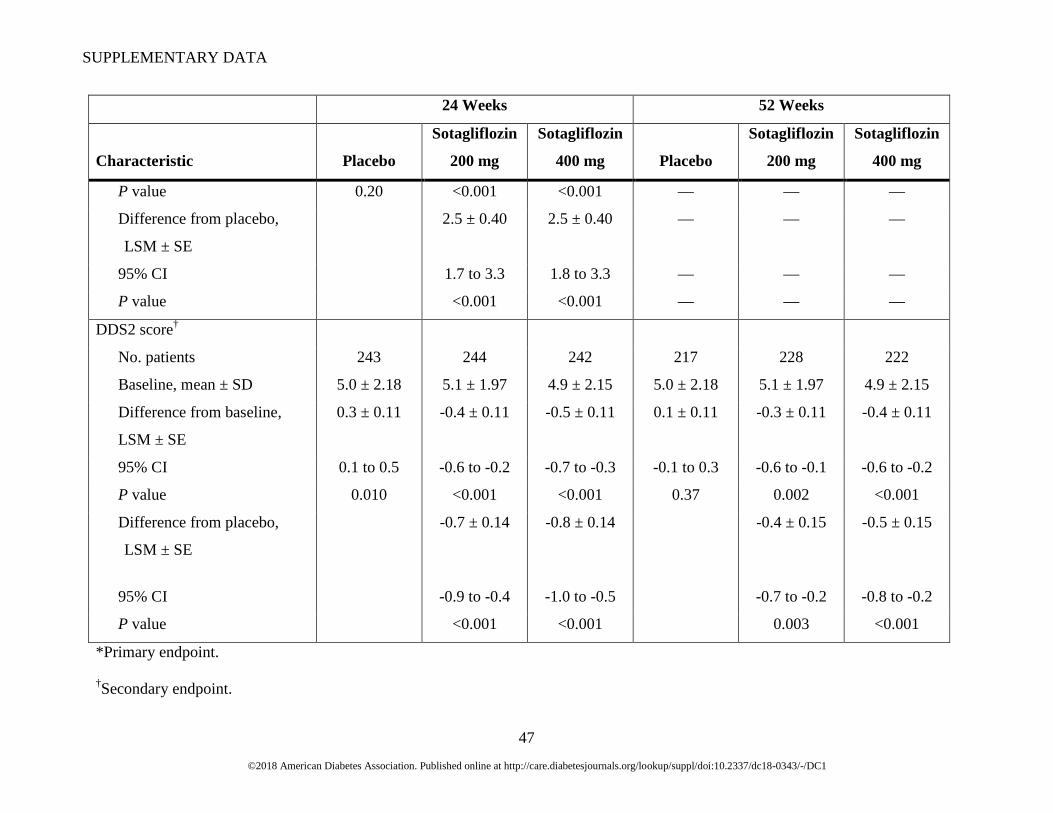
47
24 Weeks 52 Weeks
Characteristic Placebo
Sotagliflozin
200 mg
Sotagliflozin
400 mg Placebo
Sotagliflozin
200 mg
Sotagliflozin
400 mg
P value 0.20 <0.001 <0.001 — — —
Difference from placebo,
LSM ± SE
2.5 ± 0.40 2.5 ± 0.40 — — —
95% CI 1.7 to 3.3 1.8 to 3.3 — — —
P value <0.001 <0.001 — — —
DDS2 score†
No. patients 243 244 242 217 228 222
Baseline, mean ± SD 5.0 ± 2.18 5.1 ± 1.97 4.9 ± 2.15 5.0 ± 2.18 5.1 ± 1.97 4.9 ± 2.15
Difference from baseline,
LSM ± SE
0.3 ± 0.11 -0.4 ± 0.11 -0.5 ± 0.11 0.1 ± 0.11 -0.3 ± 0.11 -0.4 ± 0.11
95% CI 0.1 to 0.5 -0.6 to -0.2 -0.7 to -0.3 -0.1 to 0.3 -0.6 to -0.1 -0.6 to -0.2
P value 0.010 <0.001 <0.001 0.37 0.002 <0.001
Difference from placebo,
LSM ± SE
-0.7 ± 0.14 -0.8 ± 0.14 -0.4 ± 0.15 -0.5 ± 0.15
95% CI -0.9 to -0.4 -1.0 to -0.5 -0.7 to -0.2 -0.8 to -0.2
P value <0.001 <0.001 0.003 <0.001
*Primary endpoint.
†Secondary endpoint.
SUPPLEMENTARY DATA
©2018 American Diabetes Association. Published online at http://care.diabetesjournals.org/lookup/suppl/doi:10.2337/dc18-0343/-/DC1
48
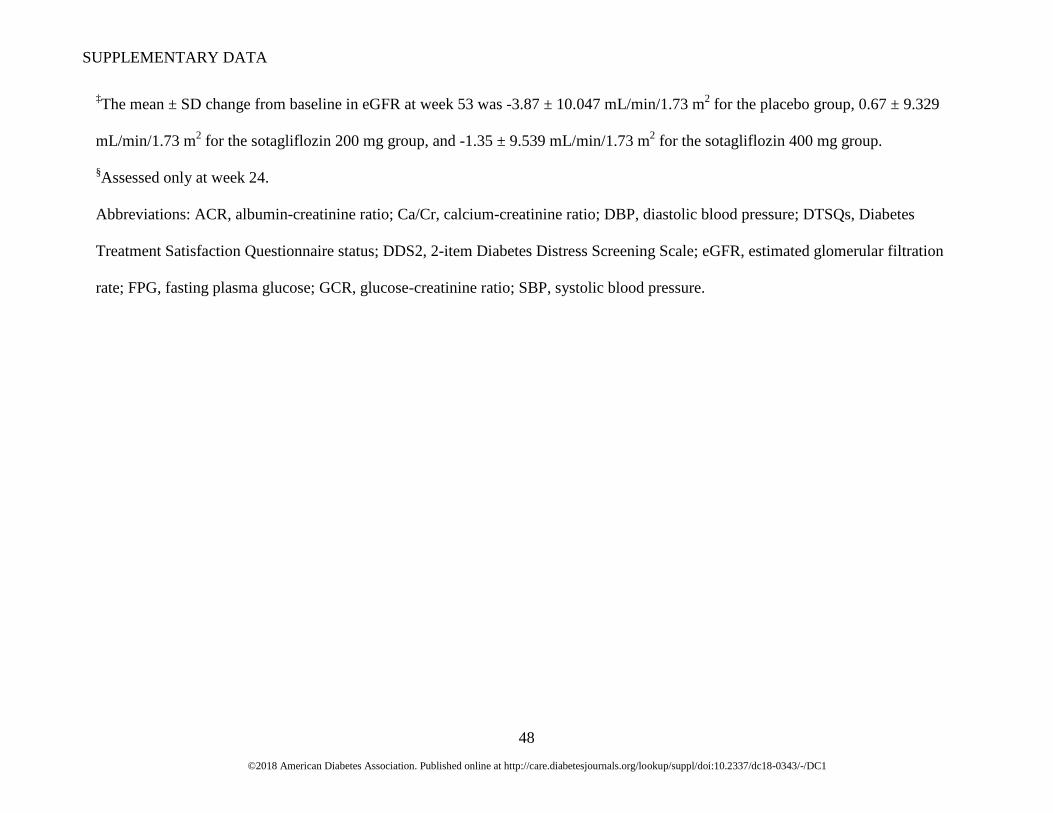
‡The mean ± SD change from baseline in eGFR at week 53 was -3.87 ± 10.047 mL/min/1.73 m2 for the placebo group, 0.67 ± 9.329
mL/min/1.73 m2 for the sotagliflozin 200 mg group, and -1.35 ± 9.539 mL/min/1.73 m2 for the sotagliflozin 400 mg group.
§Assessed only at week 24.
Abbreviations: ACR, albumin-creatinine ratio; Ca/Cr, calcium-creatinine ratio; DBP, diastolic blood pressure; DTSQs, Diabetes
Treatment Satisfaction Questionnaire status; DDS2, 2-item Diabetes Distress Screening Scale; eGFR, estimated glomerular filtration
rate; FPG, fasting plasma glucose; GCR, glucose-creatinine ratio; SBP, systolic blood pressure.
SUPPLEMENTARY DATA
©2018 American Diabetes Association. Published online at http://care.diabetesjournals.org/lookup/suppl/doi:10.2337/dc18-0343/-/DC1
49
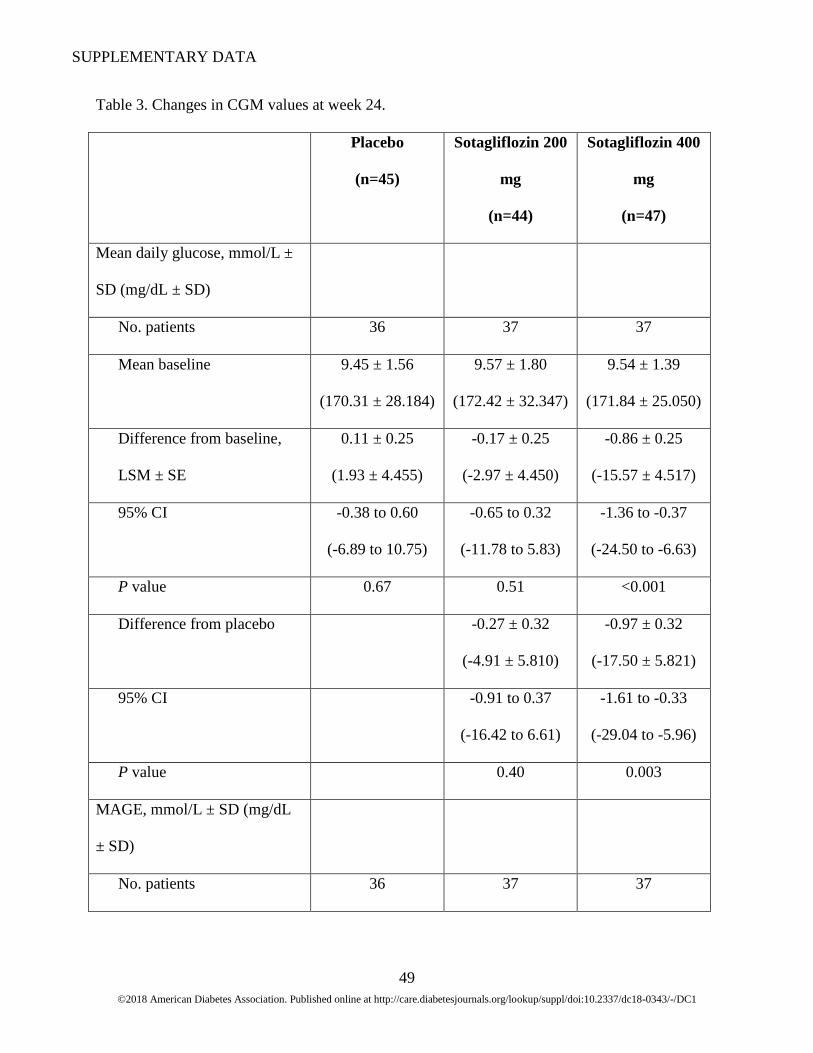
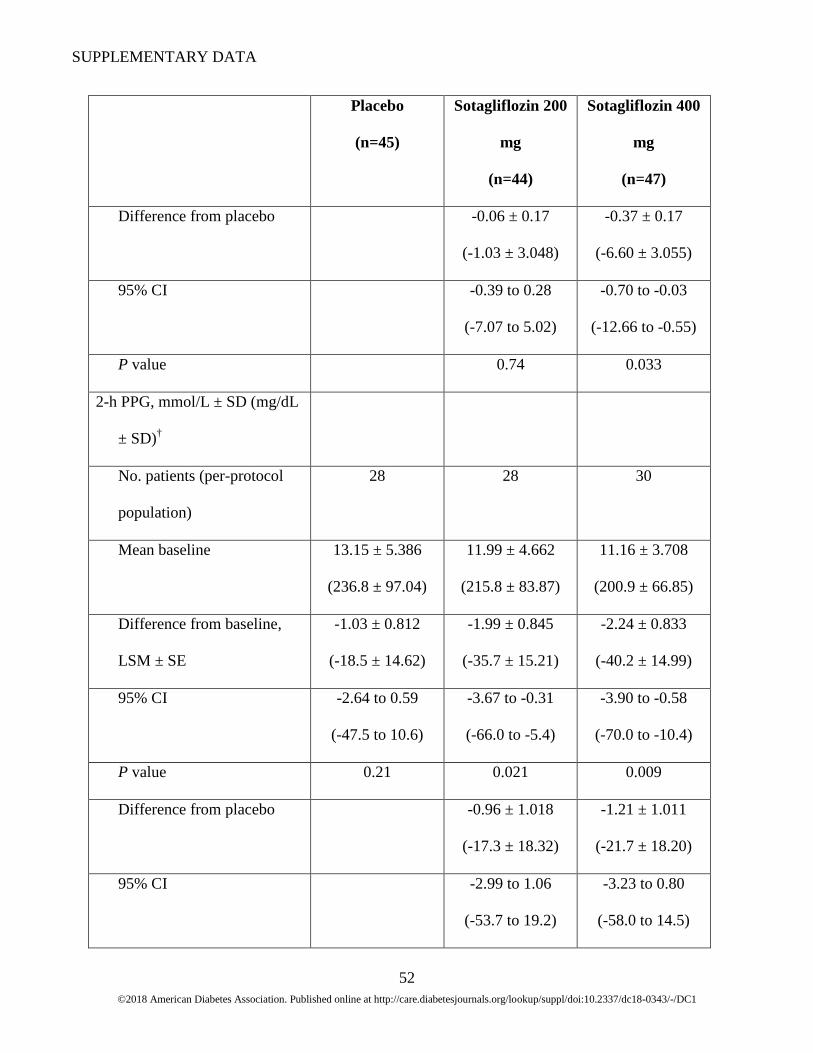
Table 3. Changes in CGM values at week 24.
Placebo
(n=45)
Sotagliflozin 200
mg
(n=44)
Sotagliflozin 400
mg
(n=47)
Mean daily glucose, mmol/L ±
SD (mg/dL ± SD)
No. patients 36 37 37
Mean baseline 9.45 ± 1.56
(170.31 ± 28.184)
9.57 ± 1.80
(172.42 ± 32.347)
9.54 ± 1.39
(171.84 ± 25.050)
Difference from baseline,
LSM ± SE
0.11 ± 0.25
(1.93 ± 4.455)
-0.17 ± 0.25
(-2.97 ± 4.450)
-0.86 ± 0.25
(-15.57 ± 4.517)
95% CI -0.38 to 0.60
(-6.89 to 10.75)
-0.65 to 0.32
(-11.78 to 5.83)
-1.36 to -0.37
(-24.50 to -6.63)
P value 0.67 0.51 <0.001
Difference from placebo -0.27 ± 0.32
(-4.91 ± 5.810)
-0.97 ± 0.32
(-17.50 ± 5.821)
95% CI -0.91 to 0.37
(-16.42 to 6.61)
-1.61 to -0.33
(-29.04 to -5.96)
P value 0.40 0.003
MAGE, mmol/L ± SD (mg/dL
± SD)
No. patients 36 37 37
SUPPLEMENTARY DATA
©2018 American Diabetes Association. Published online at http://care.diabetesjournals.org/lookup/suppl/doi:10.2337/dc18-0343/-/DC1
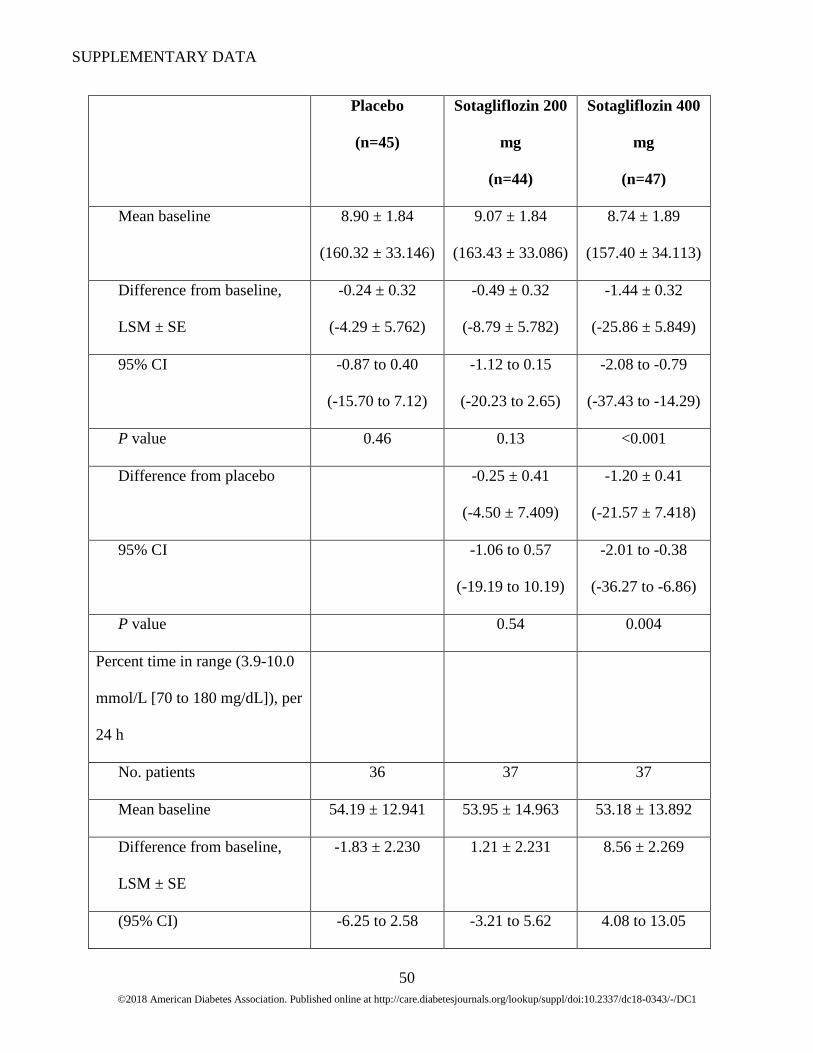
50
Placebo
(n=45)
Sotagliflozin 200
mg
(n=44)
Sotagliflozin 400
mg
(n=47)
Mean baseline 8.90 ± 1.84
(160.32 ± 33.146)
9.07 ± 1.84
(163.43 ± 33.086)
8.74 ± 1.89
(157.40 ± 34.113)
Difference from baseline,
LSM ± SE
-0.24 ± 0.32
(-4.29 ± 5.762)
-0.49 ± 0.32
(-8.79 ± 5.782)
-1.44 ± 0.32
(-25.86 ± 5.849)
95% CI -0.87 to 0.40
(-15.70 to 7.12)
-1.12 to 0.15
(-20.23 to 2.65)
-2.08 to -0.79
(-37.43 to -14.29)
P value 0.46 0.13 <0.001
Difference from placebo -0.25 ± 0.41
(-4.50 ± 7.409)
-1.20 ± 0.41
(-21.57 ± 7.418)
95% CI -1.06 to 0.57
(-19.19 to 10.19)
-2.01 to -0.38
(-36.27 to -6.86)
P value 0.54 0.004
Percent time in range (3.9-10.0
mmol/L [70 to 180 mg/dL]), per
24 h
No. patients 36 37 37
Mean baseline 54.19 ± 12.941 53.95 ± 14.963 53.18 ± 13.892
Difference from baseline,
LSM ± SE
-1.83 ± 2.230 1.21 ± 2.231 8.56 ± 2.269
(95% CI) -6.25 to 2.58 -3.21 to 5.62 4.08 to 13.05

SUPPLEMENTARY DATA
©2018 American Diabetes Association. Published online at http://care.diabetesjournals.org/lookup/suppl/doi:10.2337/dc18-0343/-/DC1
51
Placebo
(n=45)
Sotagliflozin 200
mg
(n=44)
Sotagliflozin 400
mg
(n=47)
Hours per day
corresponding to percent
time per day ± SE
-0.44 ± 0.54 0.29 ± 0.54 2.05 ± 0.54
P value 0.41 0.59 <0.001
Difference from placebo 3.04 ± 2.882 10.40 ± 2.885
(95% CI) -2.67 to 8.75 4.68 to 16.12
Hours per day
corresponding to percent
time per day ± SE
0.73 ± 0.69 2.50 ± 0.69
P value 0.29 <0.001
Standard deviation, mmol/L ±
SD (mg/dL ± SD)
No. patients 36 37 37
Mean baseline 3.51 ± 0.72
(63.28 ± 12.905)
3.58 ± 0.71
(64.55 ± 12.814)
3.43 ± 0.72
(61.87 ± 13.032)
Difference from baseline,
LSM ± SE
-0.08 ± 0.13
(-1.37 ± 2.359)
-0.13 ± 0.13
(-2.39 ± 2.360)
-0.44 ± 0.13
(-7.97 ± 2.387)
95% CI -0.33 to 0.18
(-6.04 to 3.30)
-0.39 to 0.13
(-7.06 to 2.28)
-0.70 to -0.18
(-12.69 to -3.24)
P value 0.56 0.31 0.001
SUPPLEMENTARY DATA
©2018 American Diabetes Association. Published online at http://care.diabetesjournals.org/lookup/suppl/doi:10.2337/dc18-0343/-/DC1
52
Placebo
(n=45)
Sotagliflozin 200
mg
(n=44)
Sotagliflozin 400
mg
(n=47)
Difference from placebo -0.06 ± 0.17
(-1.03 ± 3.048)
-0.37 ± 0.17
(-6.60 ± 3.055)
95% CI -0.39 to 0.28
(-7.07 to 5.02)
-0.70 to -0.03
(-12.66 to -0.55)
P value 0.74 0.033
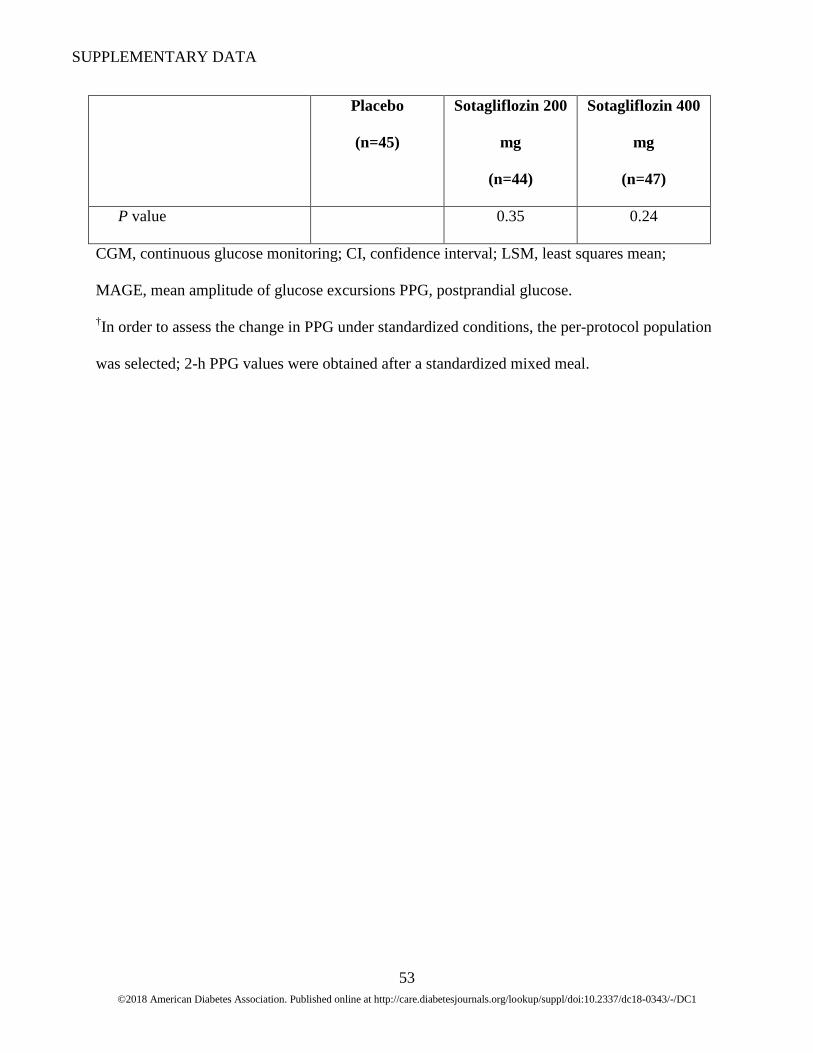
2-h PPG, mmol/L ± SD (mg/dL
± SD)†
No. patients (per-protocol
population)
28 28 30
Mean baseline 13.15 ± 5.386
(236.8 ± 97.04)
11.99 ± 4.662
(215.8 ± 83.87)
11.16 ± 3.708
(200.9 ± 66.85)
Difference from baseline,
LSM ± SE
-1.03 ± 0.812
(-18.5 ± 14.62)
-1.99 ± 0.845
(-35.7 ± 15.21)
-2.24 ± 0.833
(-40.2 ± 14.99)
95% CI -2.64 to 0.59
(-47.5 to 10.6)
-3.67 to -0.31
(-66.0 to -5.4)
-3.90 to -0.58
(-70.0 to -10.4)
P value 0.21 0.021 0.009
Difference from placebo -0.96 ± 1.018
(-17.3 ± 18.32)
-1.21 ± 1.011
(-21.7 ± 18.20)
95% CI -2.99 to 1.06
(-53.7 to 19.2)
-3.23 to 0.80
(-58.0 to 14.5)
SUPPLEMENTARY DATA
©2018 American Diabetes Association. Published online at http://care.diabetesjournals.org/lookup/suppl/doi:10.2337/dc18-0343/-/DC1
53
Placebo
(n=45)
Sotagliflozin 200
mg
(n=44)
Sotagliflozin 400
mg
(n=47)
P value 0.35 0.24
CGM, continuous glucose monitoring; CI, confidence interval; LSM, least squares mean;
MAGE, mean amplitude of glucose excursions PPG, postprandial glucose.
†In order to assess the change in PPG under standardized conditions, the per-protocol population
was selected; 2-h PPG values were obtained after a standardized mixed meal.

SUPPLEMENTARY DATA
©2018 American Diabetes Association. Published online at http://care.diabetesjournals.org/lookup/suppl/doi:10.2337/dc18-0343/-/DC1
54
Figure 2. LSM percent (A) and absolute (B) change from baseline in insulin dose at 24 and 52
weeks. Baseline values are IU/day.
SUPPLEMENTARY DATA
©2018 American Diabetes Association. Published online at http://care.diabetesjournals.org/lookup/suppl/doi:10.2337/dc18-0343/-/DC1
55
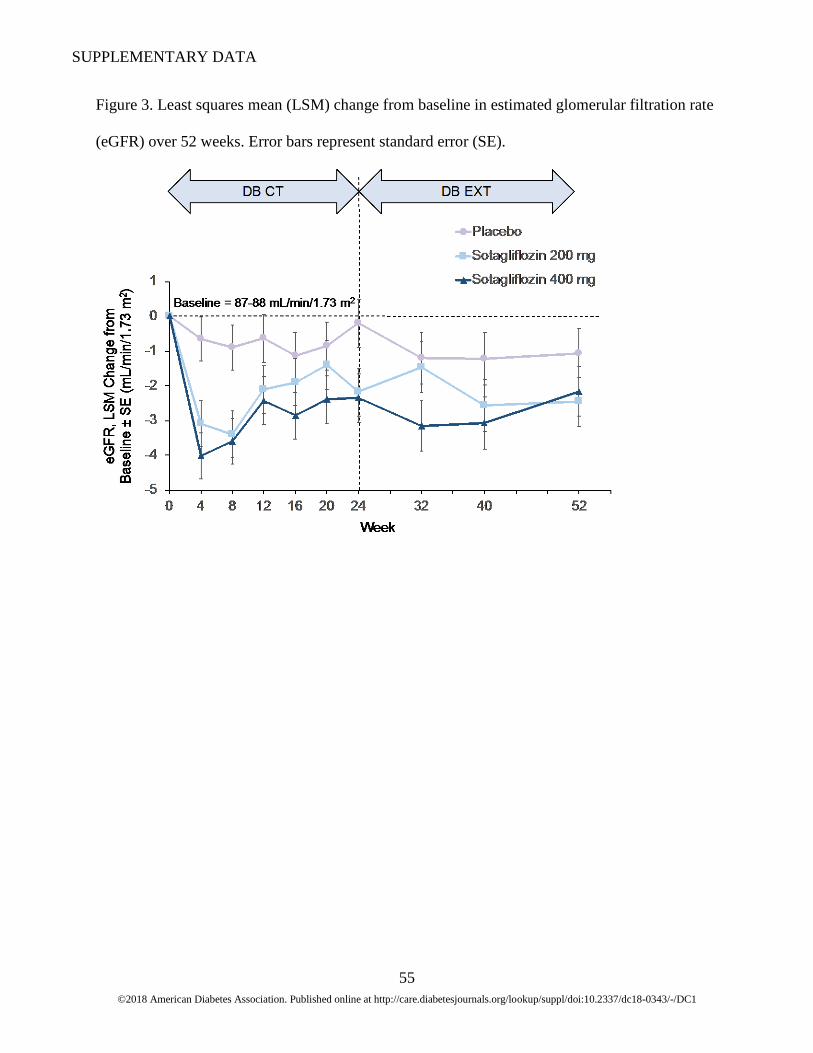
Figure 3. Least squares mean (LSM) change from baseline in estimated glomerular filtration rate
(eGFR) over 52 weeks. Error bars represent standard error (SE).
SUPPLEMENTARY DATA
©2018 American Diabetes Association. Published online at http://care.diabetesjournals.org/lookup/suppl/doi:10.2337/dc18-0343/-/DC1
56
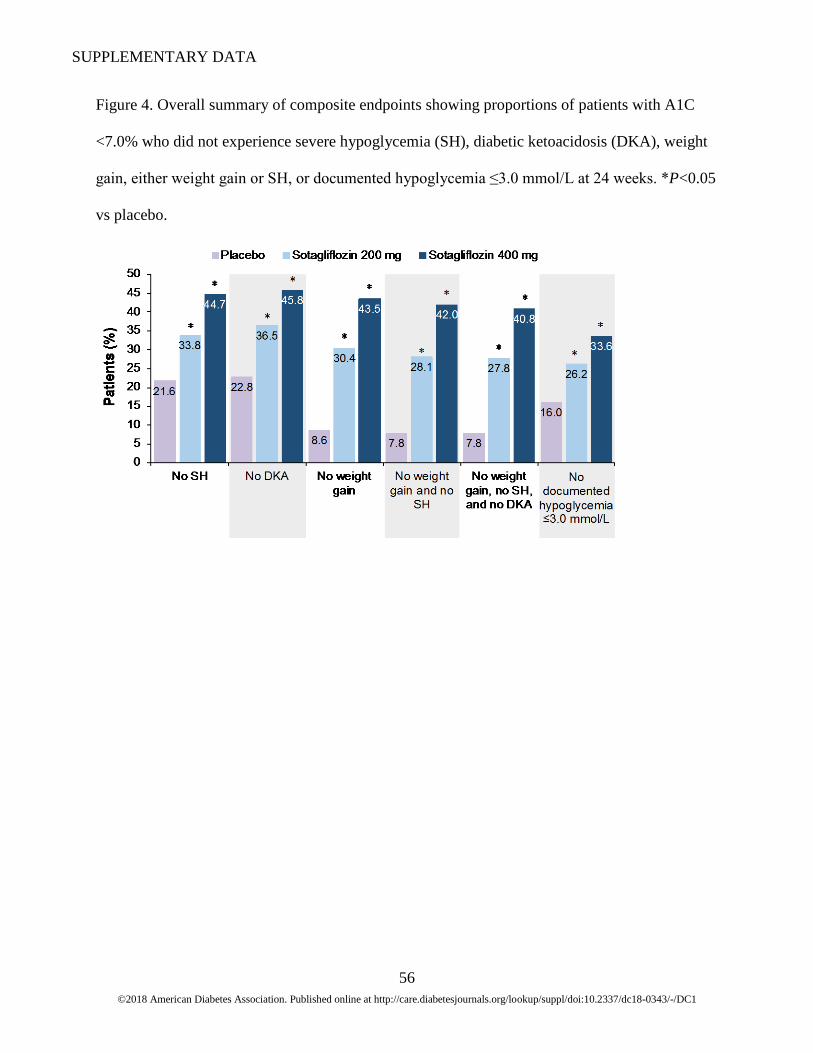
Figure 4. Overall summary of composite endpoints showing proportions of patients with A1C
<7.0% who did not experience severe hypoglycemia (SH), diabetic ketoacidosis (DKA), weight
gain, either weight gain or SH, or documented hypoglycemia ≤3.0 mmol/L at 24 weeks. *P<0.05
vs placebo.

SUPPLEMENTARY DATA
©2018 American Diabetes Association. Published online at http://care.diabetesjournals.org/lookup/suppl/doi:10.2337/dc18-0343/-/DC1
57
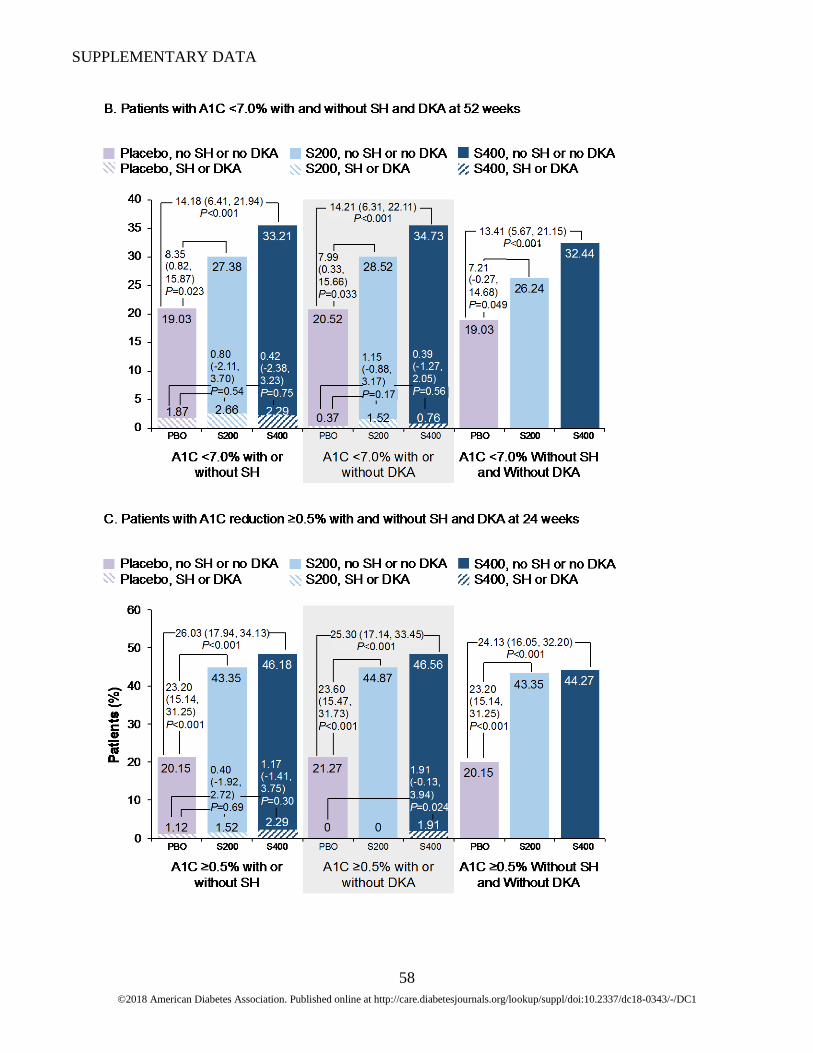
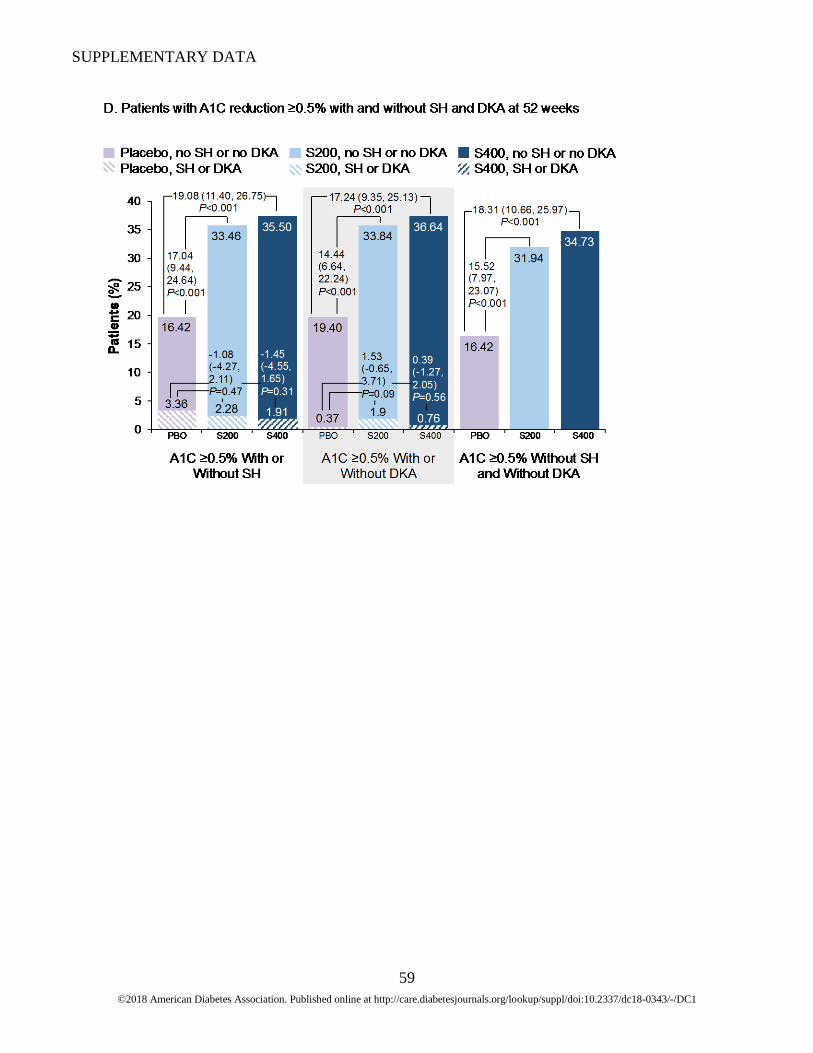
Figure 5. Proportions of patients with A1C <7.0%, severe hypoglycemia (SH), and/or diabetic
ketoacidosis (DKA) at 24 weeks (A) and 52 weeks (B) and proportions of patients with a change
in A1C ≥0.5%, severe hypoglycemia (SH), and/or diabetic ketoacidosis (DKA) at 24 weeks (C)
and 52 weeks (D). Solid bars, A1C <7.0% (A, B) or ≥0.5% (C, D) without SH, without DKA, or
without both SH and DKA; hatched bars, A1C <7.0% (A, B) or ≥0.5% (C, D) with SH or with
DKA. Least squares mean (LSM) differences between treatment groups are shown as
percentages (95% confidence intervals). PBO, placebo. S400, sotagliflozin 400 mg; S200,
sotagliflozin 200 mg.
SUPPLEMENTARY DATA
©2018 American Diabetes Association. Published online at http://care.diabetesjournals.org/lookup/suppl/doi:10.2337/dc18-0343/-/DC1
58
SUPPLEMENTARY DATA
©2018 American Diabetes Association. Published online at http://care.diabetesjournals.org/lookup/suppl/doi:10.2337/dc18-0343/-/DC1
59
SUPPLEMENTARY DATA
©2018 American Diabetes Association. Published online at http://care.diabetesjournals.org/lookup/suppl/doi:10.2337/dc18-0343/-/DC1
60
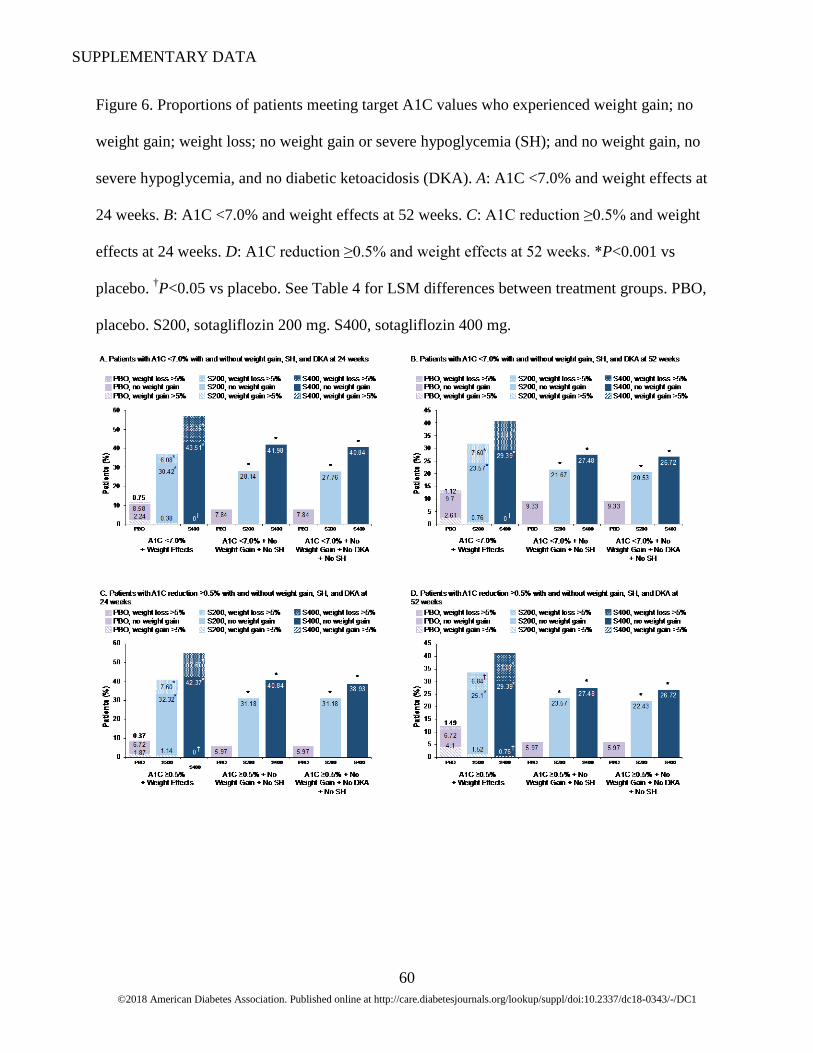
Figure 6. Proportions of patients meeting target A1C values who experienced weight gain; no
weight gain; weight loss; no weight gain or severe hypoglycemia (SH); and no weight gain, no
severe hypoglycemia, and no diabetic ketoacidosis (DKA). A: A1C <7.0% and weight effects at
24 weeks. B: A1C <7.0% and weight effects at 52 weeks. C: A1C reduction ≥0.5% and weight
effects at 24 weeks. D: A1C reduction ≥0.5% and weight effects at 52 weeks. *P<0.001 vs
placebo. †P<0.05 vs placebo. See Table 4 for LSM differences between treatment groups. PBO,
placebo. S200, sotagliflozin 200 mg. S400, sotagliflozin 400 mg.
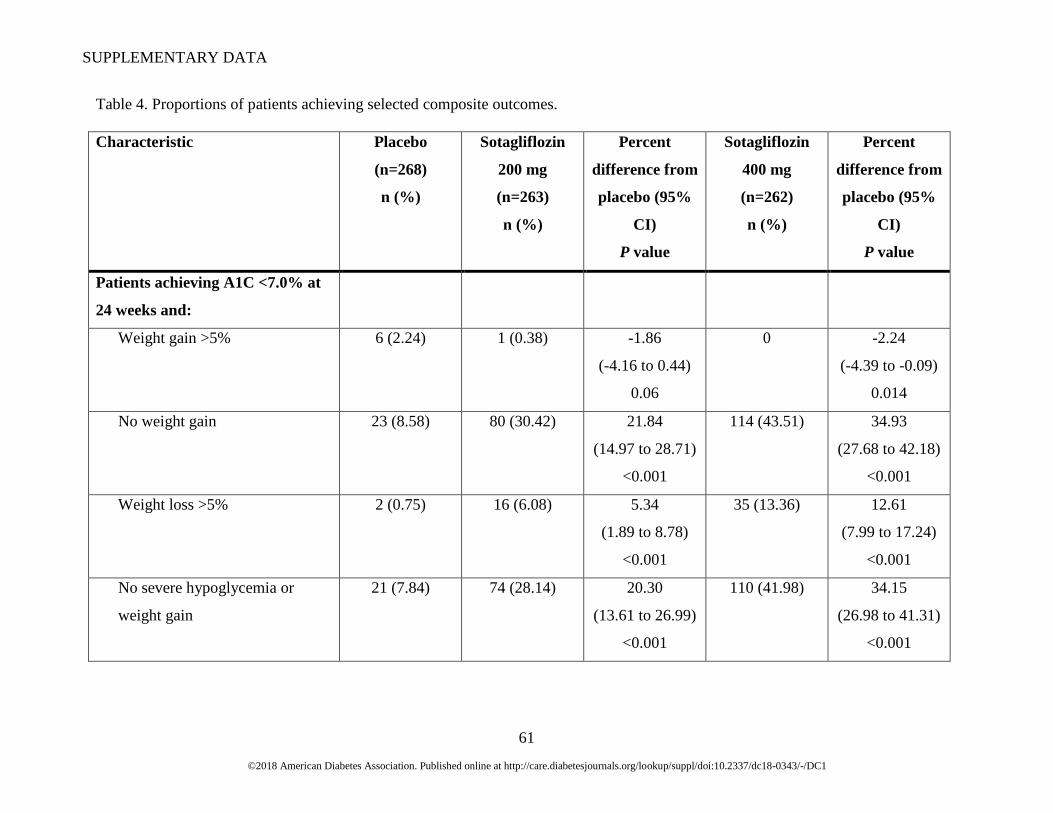
SUPPLEMENTARY DATA
©2018 American Diabetes Association. Published online at http://care.diabetesjournals.org/lookup/suppl/doi:10.2337/dc18-0343/-/DC1
61
Table 4. Proportions of patients achieving selected composite outcomes.
Characteristic Placebo
(n=268)
n (%)
Sotagliflozin
200 mg
(n=263)
n (%)
Percent
difference from
placebo (95%
CI)
P value
Sotagliflozin
400 mg
(n=262)
n (%)
Percent
difference from
placebo (95%
CI)
P value
Patients achieving A1C <7.0% at
24 weeks and:
Weight gain >5% 6 (2.24) 1 (0.38) -1.86
(-4.16 to 0.44)
0.06
0 -2.24
(-4.39 to -0.09)
0.014
No weight gain 23 (8.58) 80 (30.42) 21.84
(14.97 to 28.71)
<0.001
114 (43.51) 34.93
(27.68 to 42.18)
<0.001
Weight loss >5% 2 (0.75) 16 (6.08) 5.34
(1.89 to 8.78)
<0.001
35 (13.36) 12.61
(7.99 to 17.24)
<0.001
No severe hypoglycemia or
weight gain
21 (7.84) 74 (28.14) 20.30
(13.61 to 26.99)
<0.001
110 (41.98) 34.15
(26.98 to 41.31)
<0.001

SUPPLEMENTARY DATA
©2018 American Diabetes Association. Published online at http://care.diabetesjournals.org/lookup/suppl/doi:10.2337/dc18-0343/-/DC1
62
Characteristic Placebo
(n=268)
n (%)
Sotagliflozin
200 mg
(n=263)
n (%)
Percent
difference from
placebo (95%
CI)
P value
Sotagliflozin
400 mg
(n=262)
n (%)
Percent
difference from
placebo (95%
CI)
P value
No severe hypoglycemia, DKA,
or weight gain
21 (7.84) 73 (27.76) 19.92
(13.25 to 26.59)
<0.001
107 (40.84) 33.00
(25.86 to 40.15)
<0.001
Patients achieving A1C reduction
≥0.5% at 24 weeks and:
Weight gain >5% 5 (1.87) 3 (1.14) -0.72
(-3.17 to 1.72),
0.50
0 -1.87
(-3.86 to 0.13)
0.027
No weight gain 18 (6.72) 85 (32.32) 25.60
(18.83 to 32.38)
<0.001
111 (42.37) 35.65
(28.58 to 42.72)
<0.001
Weight loss >5% 1 (0.37) 20 (7.60) 7.23
(3.57 to 10.89)
<0.001
33 (12.60) 12.22
(7.76 to 16.68)
<0.001
No severe hypoglycemia or
weight gain
16 (5.97) 82 (31.18) 25.21
(18.56 to 31.86)
<0.001
107 (40.84) 34.87
(27.90 to 41.84)
<0.001
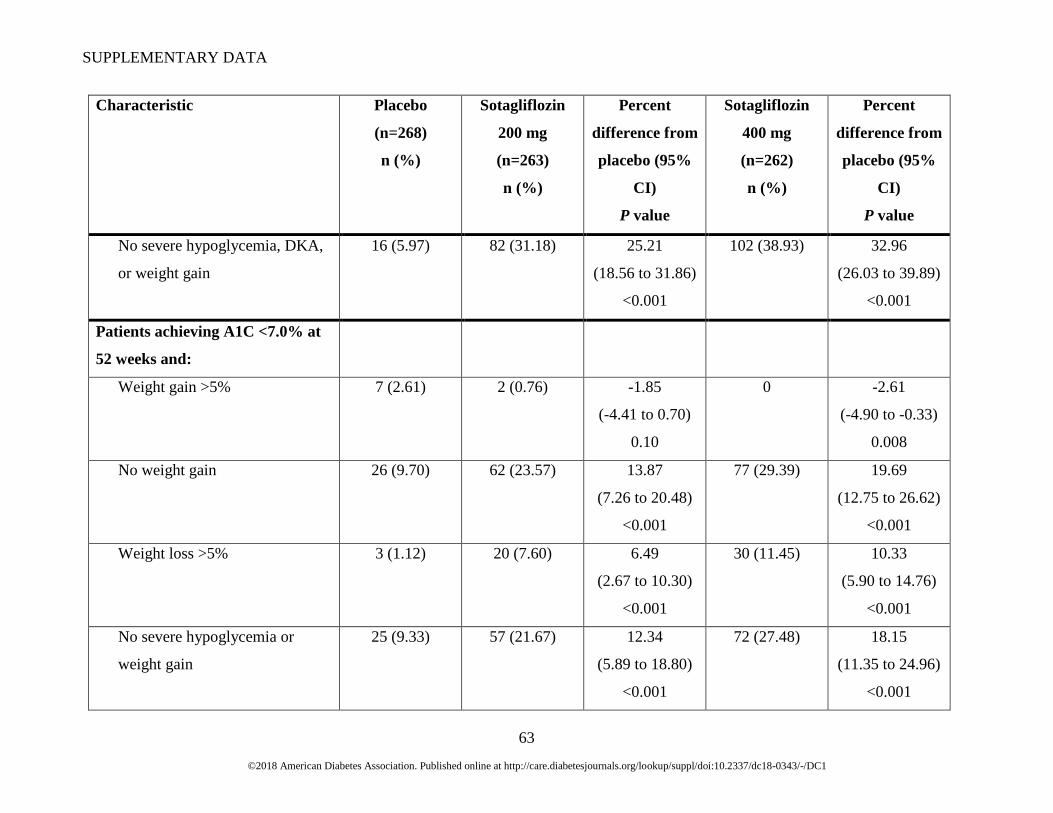
SUPPLEMENTARY DATA
©2018 American Diabetes Association. Published online at http://care.diabetesjournals.org/lookup/suppl/doi:10.2337/dc18-0343/-/DC1
63
Characteristic Placebo
(n=268)
n (%)
Sotagliflozin
200 mg
(n=263)
n (%)
Percent
difference from
placebo (95%
CI)
P value
Sotagliflozin
400 mg
(n=262)
n (%)
Percent
difference from
placebo (95%
CI)
P value
No severe hypoglycemia, DKA,
or weight gain
16 (5.97) 82 (31.18) 25.21
(18.56 to 31.86)
<0.001
102 (38.93) 32.96
(26.03 to 39.89)
<0.001
Patients achieving A1C <7.0% at
52 weeks and:
Weight gain >5% 7 (2.61) 2 (0.76) -1.85
(-4.41 to 0.70)
0.10
0 -2.61
(-4.90 to -0.33)
0.008
No weight gain 26 (9.70) 62 (23.57) 13.87
(7.26 to 20.48)
<0.001
77 (29.39) 19.69
(12.75 to 26.62)
<0.001
Weight loss >5% 3 (1.12) 20 (7.60) 6.49
(2.67 to 10.30)
<0.001
30 (11.45) 10.33
(5.90 to 14.76)
<0.001
No severe hypoglycemia or
weight gain
25 (9.33) 57 (21.67) 12.34
(5.89 to 18.80)
<0.001
72 (27.48) 18.15
(11.35 to 24.96)
<0.001
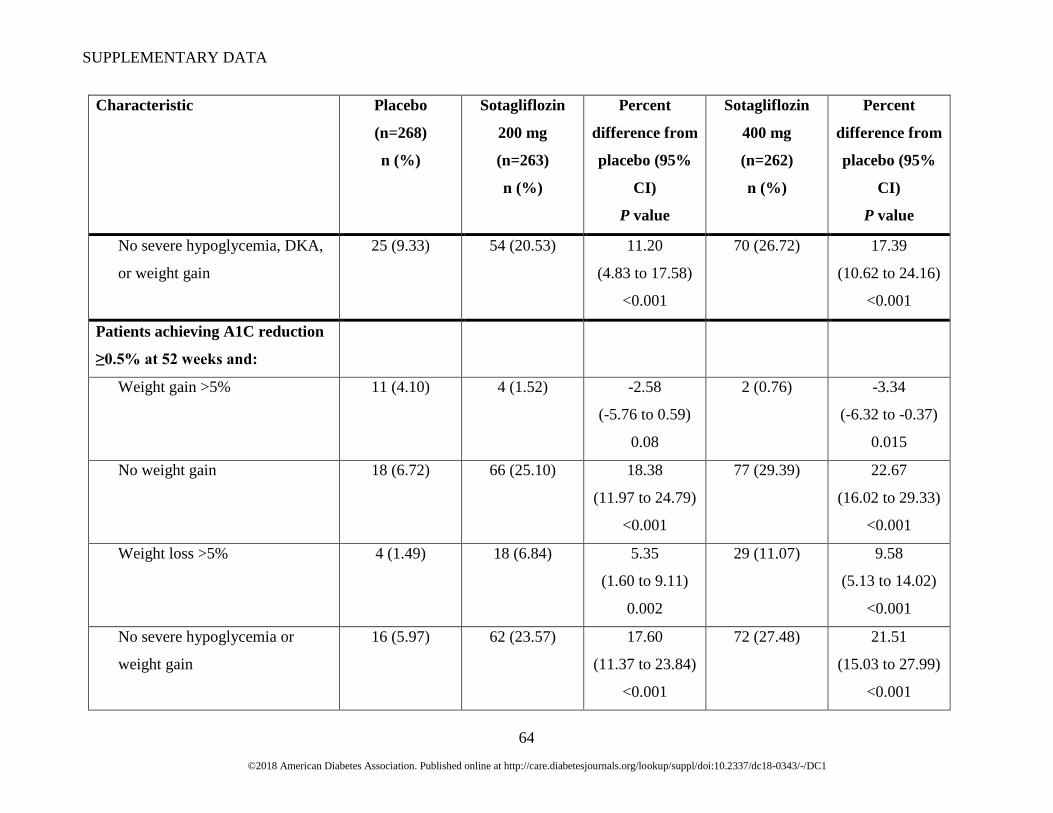
SUPPLEMENTARY DATA
©2018 American Diabetes Association. Published online at http://care.diabetesjournals.org/lookup/suppl/doi:10.2337/dc18-0343/-/DC1
64
Characteristic Placebo
(n=268)
n (%)
Sotagliflozin
200 mg
(n=263)
n (%)
Percent
difference from
placebo (95%
CI)
P value
Sotagliflozin
400 mg
(n=262)
n (%)
Percent
difference from
placebo (95%
CI)
P value
No severe hypoglycemia, DKA,
or weight gain
25 (9.33) 54 (20.53) 11.20
(4.83 to 17.58)
<0.001
70 (26.72) 17.39
(10.62 to 24.16)
<0.001
Patients achieving A1C reduction
≥0.5% at 52 weeks and:
Weight gain >5% 11 (4.10) 4 (1.52) -2.58
(-5.76 to 0.59)
0.08
2 (0.76) -3.34
(-6.32 to -0.37)
0.015
No weight gain 18 (6.72) 66 (25.10) 18.38
(11.97 to 24.79)
<0.001
77 (29.39) 22.67
(16.02 to 29.33)
<0.001
Weight loss >5% 4 (1.49) 18 (6.84) 5.35
(1.60 to 9.11)
0.002
29 (11.07) 9.58
(5.13 to 14.02)
<0.001
No severe hypoglycemia or
weight gain
16 (5.97) 62 (23.57) 17.60
(11.37 to 23.84)
<0.001
72 (27.48) 21.51
(15.03 to 27.99)
<0.001
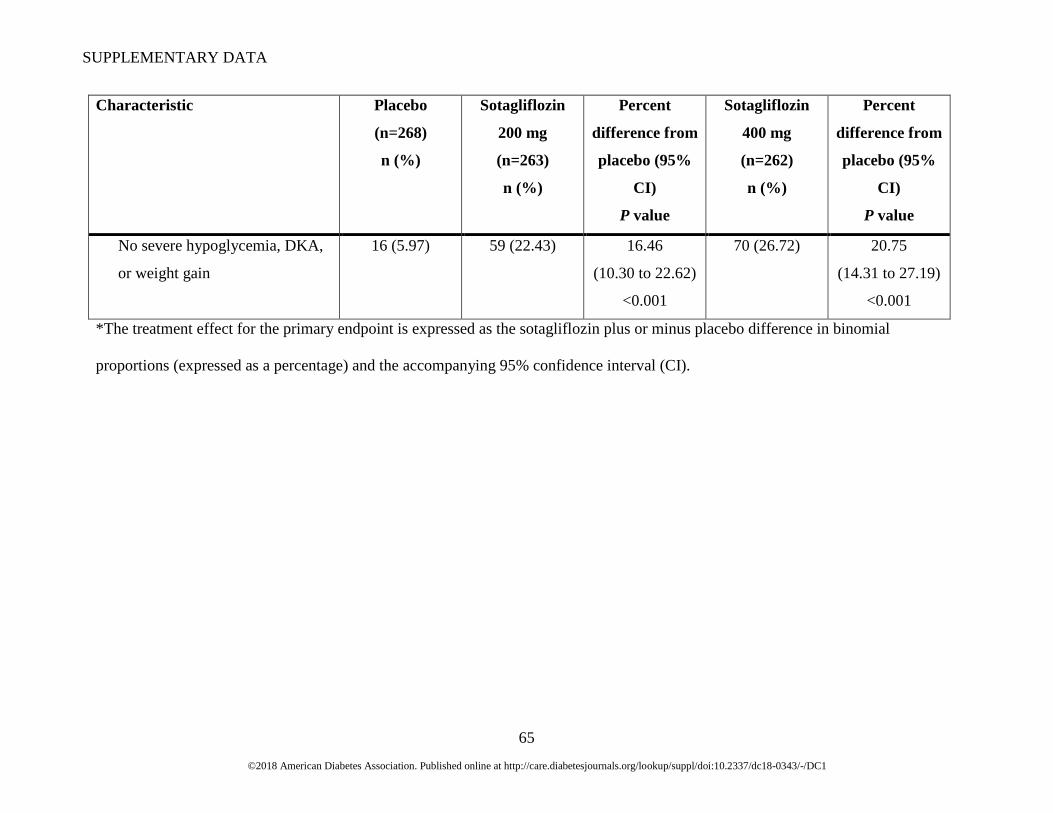
SUPPLEMENTARY DATA
©2018 American Diabetes Association. Published online at http://care.diabetesjournals.org/lookup/suppl/doi:10.2337/dc18-0343/-/DC1
65
Characteristic Placebo
(n=268)
n (%)
Sotagliflozin
200 mg
(n=263)
n (%)
Percent
difference from
placebo (95%
CI)
P value
Sotagliflozin
400 mg
(n=262)
n (%)
Percent
difference from
placebo (95%
CI)
P value
No severe hypoglycemia, DKA,
or weight gain
16 (5.97) 59 (22.43) 16.46
(10.30 to 22.62)
<0.001
70 (26.72) 20.75
(14.31 to 27.19)
<0.001
*The treatment effect for the primary endpoint is expressed as the sotagliflozin plus or minus placebo difference in binomial
proportions (expressed as a percentage) and the accompanying 95% confidence interval (CI).
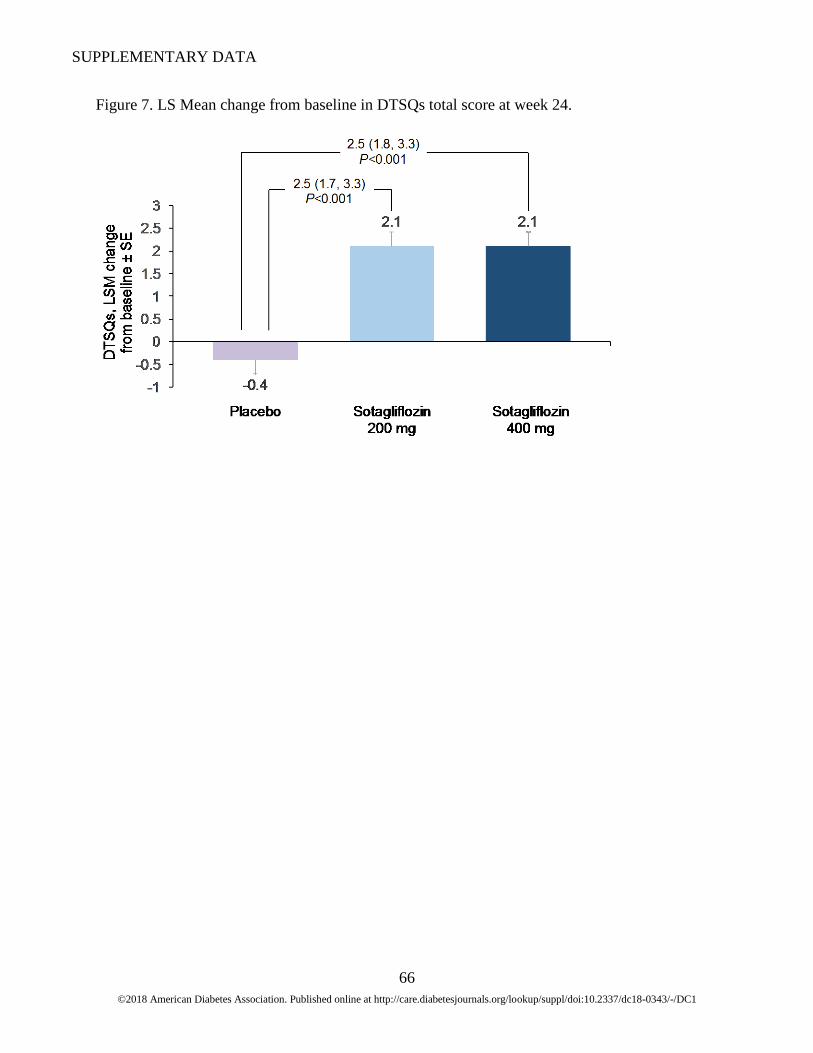
SUPPLEMENTARY DATA
©2018 American Diabetes Association. Published online at http://care.diabetesjournals.org/lookup/suppl/doi:10.2337/dc18-0343/-/DC1
66
Figure 7. LS Mean change from baseline in DTSQs total score at week 24.

SUPPLEMENTARY DATA
©2018 American Diabetes Association. Published online at http://care.diabetesjournals.org/lookup/suppl/doi:10.2337/dc18-0343/-/DC1
67
Figure 8. Mean change from baseline in DDS2 total score by study visit.
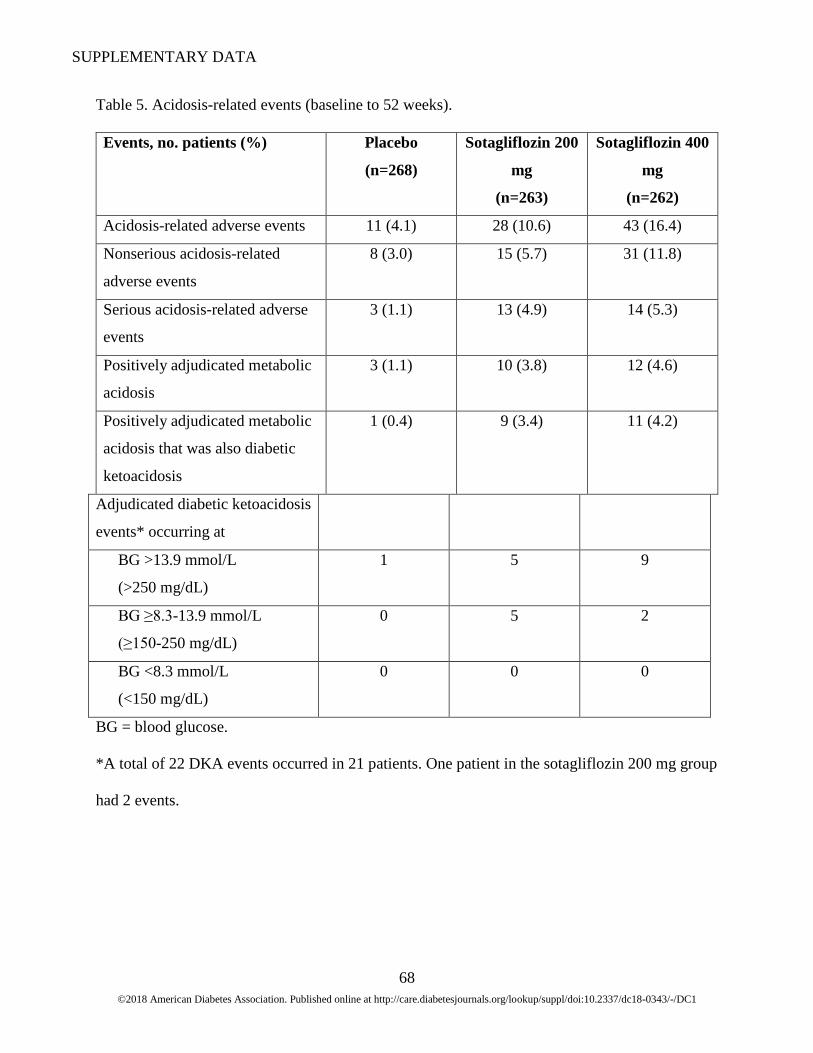
SUPPLEMENTARY DATA
©2018 American Diabetes Association. Published online at http://care.diabetesjournals.org/lookup/suppl/doi:10.2337/dc18-0343/-/DC1
68
Table 5. Acidosis-related events (baseline to 52 weeks).
Events, no. patients (%) Placebo
(n=268)
Sotagliflozin 200
mg
(n=263)
Sotagliflozin 400
mg
(n=262)
Acidosis-related adverse events 11 (4.1) 28 (10.6) 43 (16.4)
Nonserious acidosis-related
adverse events
8 (3.0) 15 (5.7) 31 (11.8)
Serious acidosis-related adverse
events
3 (1.1) 13 (4.9) 14 (5.3)
Positively adjudicated metabolic
acidosis
3 (1.1) 10 (3.8) 12 (4.6)
Positively adjudicated metabolic
acidosis that was also diabetic
ketoacidosis
1 (0.4) 9 (3.4) 11 (4.2)
Adjudicated diabetic ketoacidosis
events* occurring at
BG >13.9 mmol/L
(>250 mg/dL)
1 5 9
BG ≥8.3-13.9 mmol/L
(≥150-250 mg/dL)
0 5 2
BG <8.3 mmol/L
(<150 mg/dL)
0 0 0
BG = blood glucose.
*A total of 22 DKA events occurred in 21 patients. One patient in the sotagliflozin 200 mg group
had 2 events.
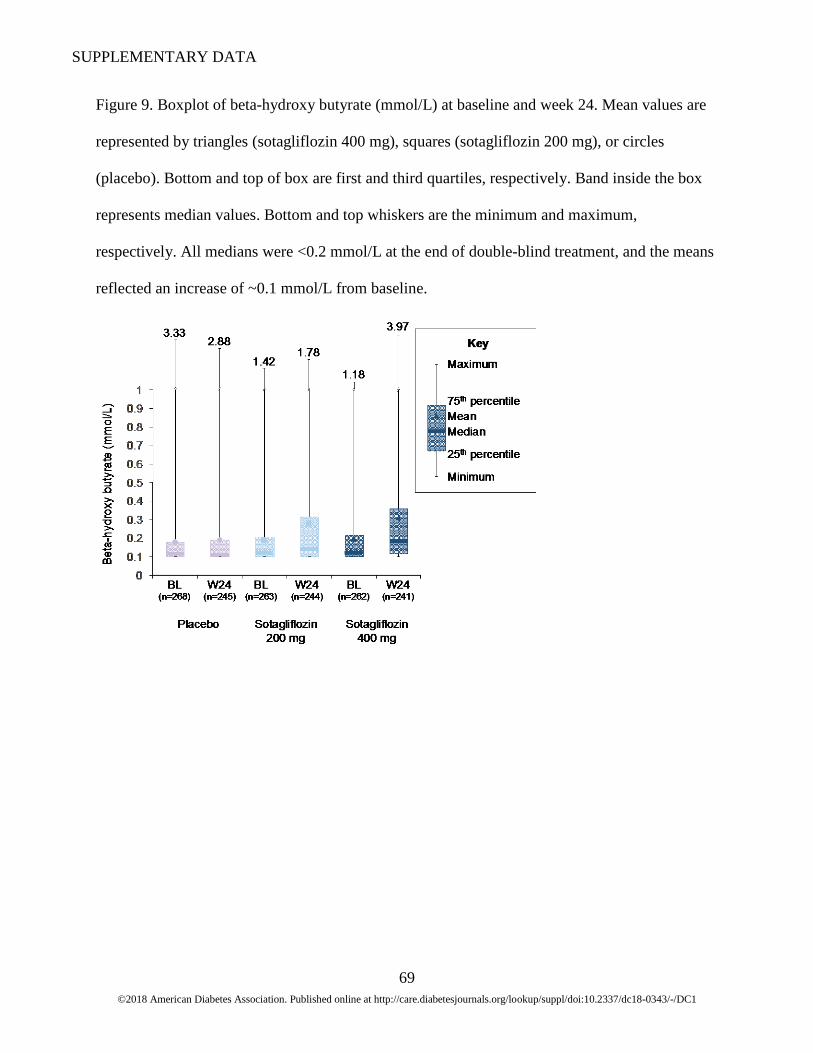
SUPPLEMENTARY DATA
©2018 American Diabetes Association. Published online at http://care.diabetesjournals.org/lookup/suppl/doi:10.2337/dc18-0343/-/DC1
69
Figure 9. Boxplot of beta-hydroxy butyrate (mmol/L) at baseline and week 24. Mean values are
represented by triangles (sotagliflozin 400 mg), squares (sotagliflozin 200 mg), or circles
(placebo). Bottom and top of box are first and third quartiles, respectively. Band inside the box
represents median values. Bottom and top whiskers are the minimum and maximum,
respectively. All medians were <0.2 mmol/L at the end of double-blind treatment, and the means
reflected an increase of ~0.1 mmol/L from baseline.