supplementary figures - media.nature.com · the control mice (dc-wt), a mixture of bone marrow...
TRANSCRIPT
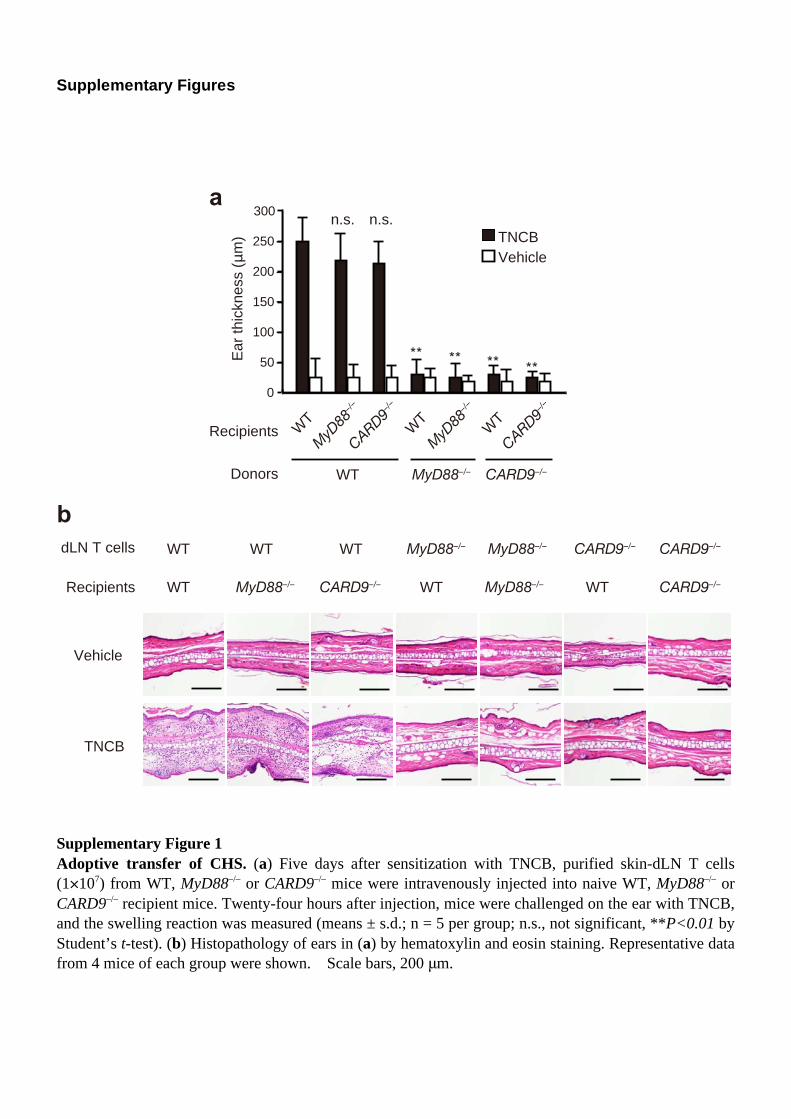
Supplementary Figures Supplementary Figure 1 Adoptive transfer of CHS. (a) Five days after sensitization with TNCB, purified skin-dLN T cells (1×10⁷) from WT, MyD88–/– or CARD9–/– mice were intravenously injected into naive WT, MyD88–/– or CARD9–/– recipient mice. Twenty-four hours after injection, mice were challenged on the ear with TNCB, and the swelling reaction was measured (means ± s.d.; n = 5 per group; n.s., not significant, **P<0.01 by Student’s t-test). (b) Histopathology of ears in (a) by hematoxylin and eosin staining. Representative data from 4 mice of each group were shown. Scale bars, 200 μm.
dLN T cells
Recipients
WT
MyD88–/– CARD9–/–
TNCB
Vehicle
WT
WT
WT
WT
MyD88–/– MyD88–/–
MyD88–/– WT
CARD9–/– CARD9–/–
CARD9–/–
** ** ** **0
50
100
150
200
250
300
WTMyD88–/–
CARD9–/–
WTMyD88–/–
CARD9–/–
WT
Ear t
hick
ness
(ѥm
)
a
b
Donors
Recipients
n.s.n.s.
WT MyD88–/– CARD9–/–
TNCBVehicle
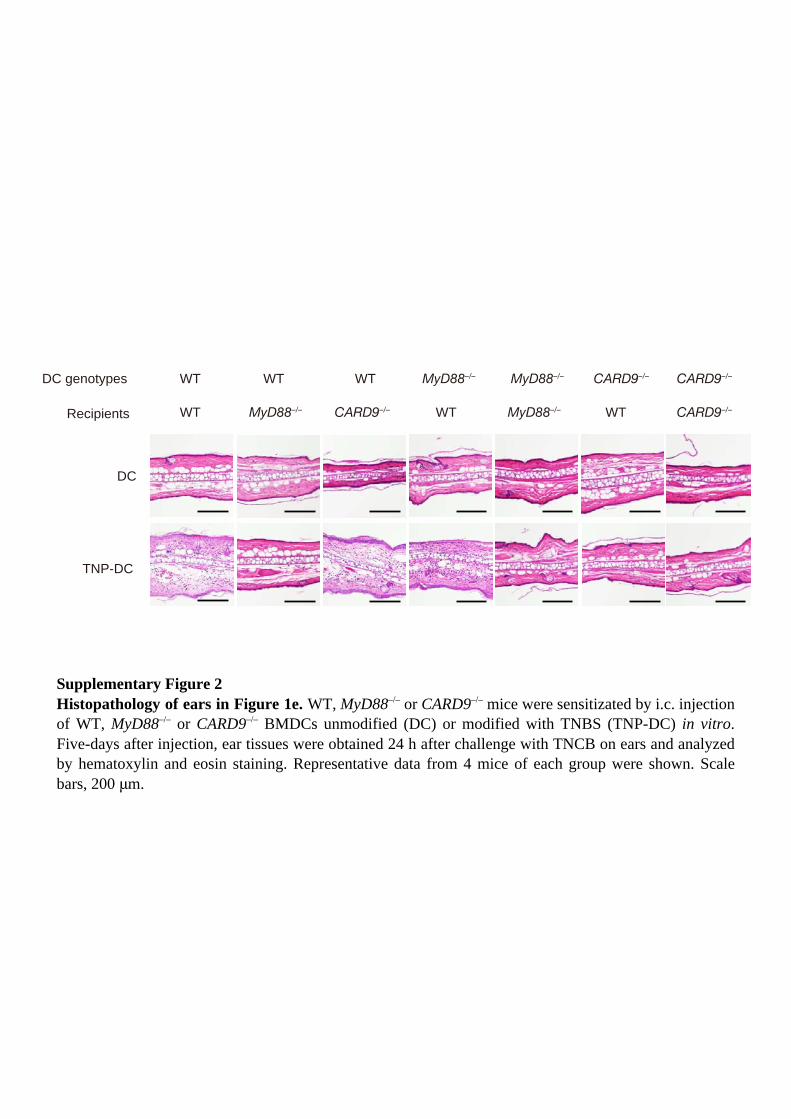
Supplementary Figure 2 Histopathology of ears in Figure 1e. WT, MyD88–/– or CARD9–/– mice were sensitizated by i.c. injection of WT, MyD88–/– or CARD9–/– BMDCs unmodified (DC) or modified with TNBS (TNP-DC) in vitro. Five-days after injection, ear tissues were obtained 24 h after challenge with TNCB on ears and analyzed by hematoxylin and eosin staining. Representative data from 4 mice of each group were shown. Scale bars, 200 μm.
DC genotypes
Recipients
WT
MyD88–/– CARD9–/–
TNP-DC
DC
WT
WT
WT
WT
MyD88–/– MyD88–/–
MyD88–/– WT
CARD9–/– CARD9–/–
CARD9–/–
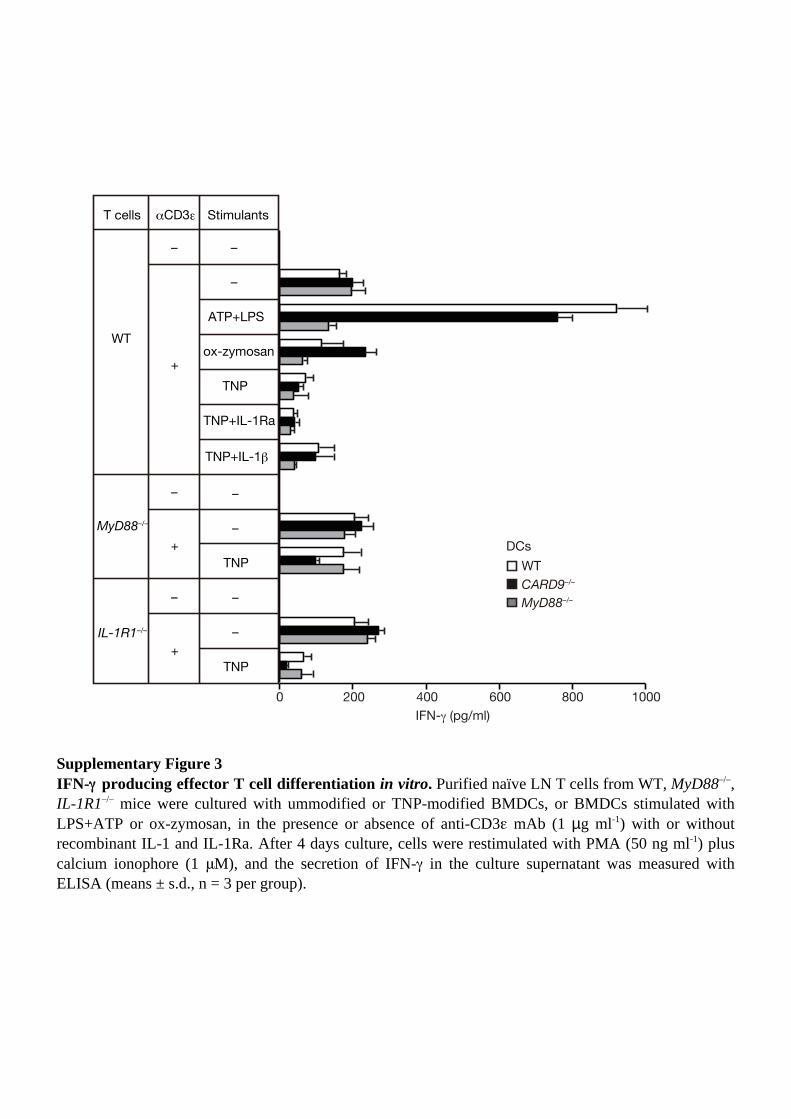
Supplementary Figure 3 IFN-γ producing effector T cell differentiation in vitro. Purified naïve LN T cells from WT, MyD88–/–, IL-1R1–/– mice were cultured with ummodified or TNP-modified BMDCs, or BMDCs stimulated with LPS+ATP or ox-zymosan, in the presence or absence of anti-CD3ε mAb (1 µg ml-1) with or without recombinant IL-1 and IL-1Ra. After 4 days culture, cells were restimulated with PMA (50 ng ml-1) plus calcium ionophore (1 μM), and the secretion of IFN-γ in the culture supernatant was measured with ELISA (means ± s.d., n = 3 per group).
Stimulants
–
–
ATP+LPS
ox-zymosan
TNP
TNP+IL-1Ra
TNP+IL-1`
–
–
TNP
–
–
TNP
_CD3¡T cells
WT
MyD88–/–
IL-1R1–/–
–
+
–
+
–
+
DCsWT
MyD88–/–CARD9–/–
0 200 400 600 800 1000IFN-a (pg/ml)
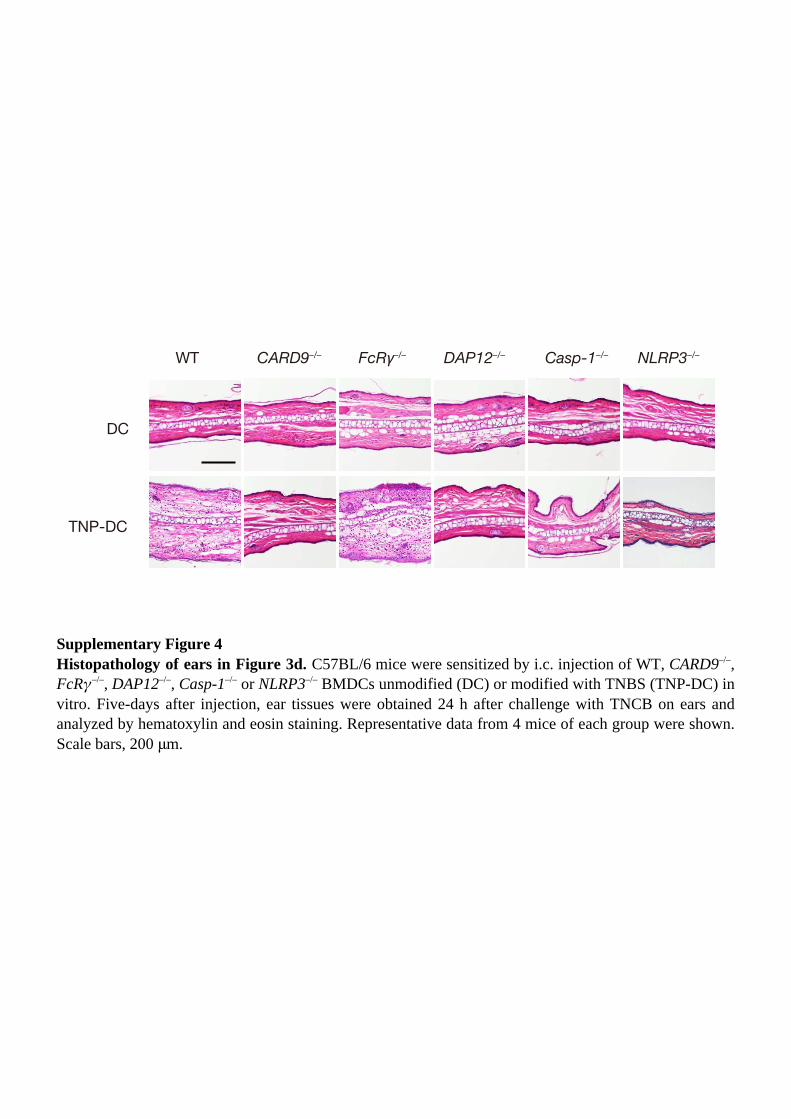
Supplementary Figure 4 Histopathology of ears in Figure 3d. C57BL/6 mice were sensitized by i.c. injection of WT, CARD9–/–, FcRγ–/–, DAP12–/–, Casp-1–/– or NLRP3–/– BMDCs unmodified (DC) or modified with TNBS (TNP-DC) in vitro. Five-days after injection, ear tissues were obtained 24 h after challenge with TNCB on ears and analyzed by hematoxylin and eosin staining. Representative data from 4 mice of each group were shown. Scale bars, 200 μm.
TNP-DC
DC
DAP12–/–CARD9–/–WT FcRʺ–/– Casp-1–/– NLRP3–/–
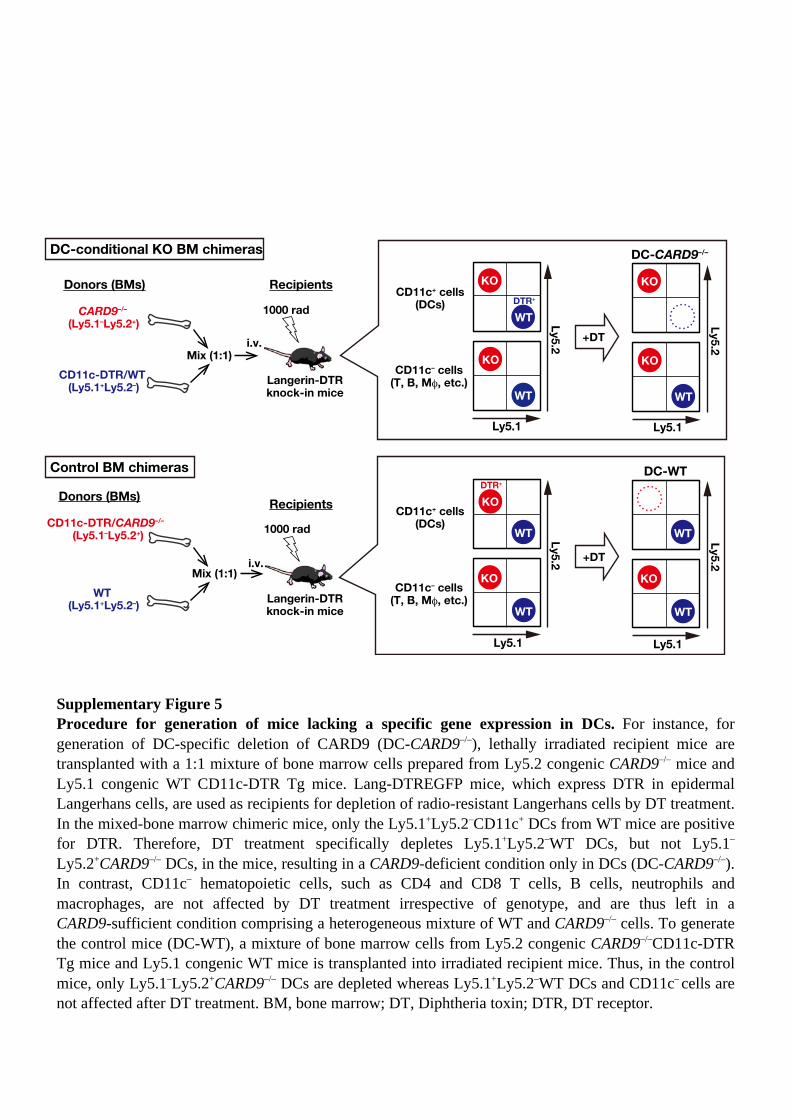
Supplementary Figure 5 Procedure for generation of mice lacking a specific gene expression in DCs. For instance, for generation of DC-specific deletion of CARD9 (DC-CARD9–/–), lethally irradiated recipient mice are transplanted with a 1:1 mixture of bone marrow cells prepared from Ly5.2 congenic CARD9–/– mice and Ly5.1 congenic WT CD11c-DTR Tg mice. Lang-DTREGFP mice, which express DTR in epidermal Langerhans cells, are used as recipients for depletion of radio-resistant Langerhans cells by DT treatment. In the mixed-bone marrow chimeric mice, only the Ly5.1+Ly5.2–CD11c+ DCs from WT mice are positive for DTR. Therefore, DT treatment specifically depletes Ly5.1+Ly5.2–WT DCs, but not Ly5.1–
Ly5.2+CARD9–/– DCs, in the mice, resulting in a CARD9-deficient condition only in DCs (DC-CARD9–/–). In contrast, CD11c– hematopoietic cells, such as CD4 and CD8 T cells, B cells, neutrophils and macrophages, are not affected by DT treatment irrespective of genotype, and are thus left in a CARD9-sufficient condition comprising a heterogeneous mixture of WT and CARD9–/– cells. To generate the control mice (DC-WT), a mixture of bone marrow cells from Ly5.2 congenic CARD9–/–CD11c-DTR Tg mice and Ly5.1 congenic WT mice is transplanted into irradiated recipient mice. Thus, in the control mice, only Ly5.1–Ly5.2+CARD9–/– DCs are depleted whereas Ly5.1+Ly5.2–WT DCs and CD11c– cells are not affected after DT treatment. BM, bone marrow; DT, Diphtheria toxin; DTR, DT receptor.
Donors (BMs) Recipients
CARD9–/–
(Ly5.1–Ly5.2+)
CD11c-DTR/WT
(Ly5.1+Ly5.2–)
Mix (1:1)
i.v.
1000 rad
Langerin-DTR
knock-in mice
Donors (BMs)Recipients
CD11c-DTR/CARD9–/– (Ly5.1–Ly5.2+)
WT
(Ly5.1+Ly5.2–)
Mix (1:1)i.v.
1000 rad
Langerin-DTR
knock-in mice
CD11c+ cells
(DCs)
CD11c– cells
(T, B, Mq, etc.)
CD11c+ cells
(DCs)
CD11c– cells
(T, B, Mq, etc.)
Ly5.1
Ly5
.2
DTR+
Ly5.1
Ly5
.2
Ly5.1
Ly5
.2
Ly5.1
Ly5
.2
KO
KO
WT
WT
KO
KO
WT
WT
KO
KO
WT
KO
WT
WT
DTR+
+DT
+DT
DC-conditional KO BM chimeras
Control BM chimeras
DC-CARD9–/–
DC-WT
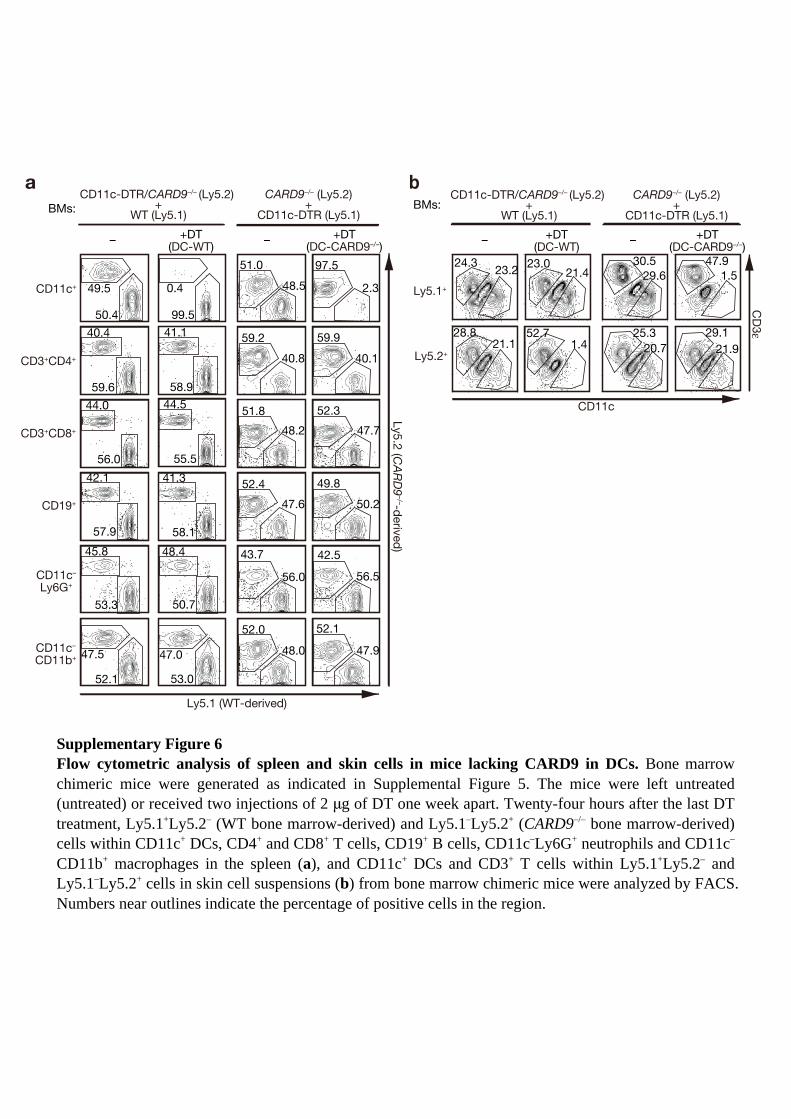
Supplementary Figure 6 Flow cytometric analysis of spleen and skin cells in mice lacking CARD9 in DCs. Bone marrow chimeric mice were generated as indicated in Supplemental Figure 5. The mice were left untreated (untreated) or received two injections of 2 μg of DT one week apart. Twenty-four hours after the last DT treatment, Ly5.1+Ly5.2– (WT bone marrow-derived) and Ly5.1–Ly5.2+ (CARD9–/– bone marrow-derived) cells within CD11c+ DCs, CD4+ and CD8+ T cells, CD19+ B cells, CD11c–Ly6G+ neutrophils and CD11c–
CD11b+ macrophages in the spleen (a), and CD11c+ DCs and CD3+ T cells within Ly5.1+Ly5.2– and Ly5.1–Ly5.2+ cells in skin cell suspensions (b) from bone marrow chimeric mice were analyzed by FACS. Numbers near outlines indicate the percentage of positive cells in the region.
CD11c+
CD3+CD4+
CD3+CD8+
CD19+
CD11c–
Ly6G+
CD11c–
CD11b+
Ly5.1 (WT-derived)
Ly5.2 (CARD9–/–-derived)
40.4
59.6
41.1
58.9
59.240.8
59.940.1
44.0
56.0
44.5
55.5
51.848.2
52.347.7
42.1
57.9
41.3
58.1
52.447.6
49.850.2
45.8
53.3
48.4
50.7
43.756.0
42.556.5
47.5
52.1
47.0
53.0
52.048.0
52.147.9
49.5
50.4
0.4
99.5
51.048.5
97.52.3
–– +DT(DC-CARD9–/–)
+DT(DC-WT)
CD11c
CD3ε
Ly5.1+
Ly5.2+
24.3 23.2 23.021.4
30.529.6
47.91.5
28.821.1
52.71.4
25.320.7
29.121.9
CD11c-DTR/CARD9–/– (Ly5.2) +
WT (Ly5.1)CD11c-DTR/CARD9–/– (Ly5.2)
+WT (Ly5.1)
CARD9–/– (Ly5.2)+
CD11c-DTR (Ly5.1)CARD9–/– (Ly5.2)
+CD11c-DTR (Ly5.1)
–– +DT(DC-CARD9–/–)
+DT(DC-WT)
BMs:BMs:
ba
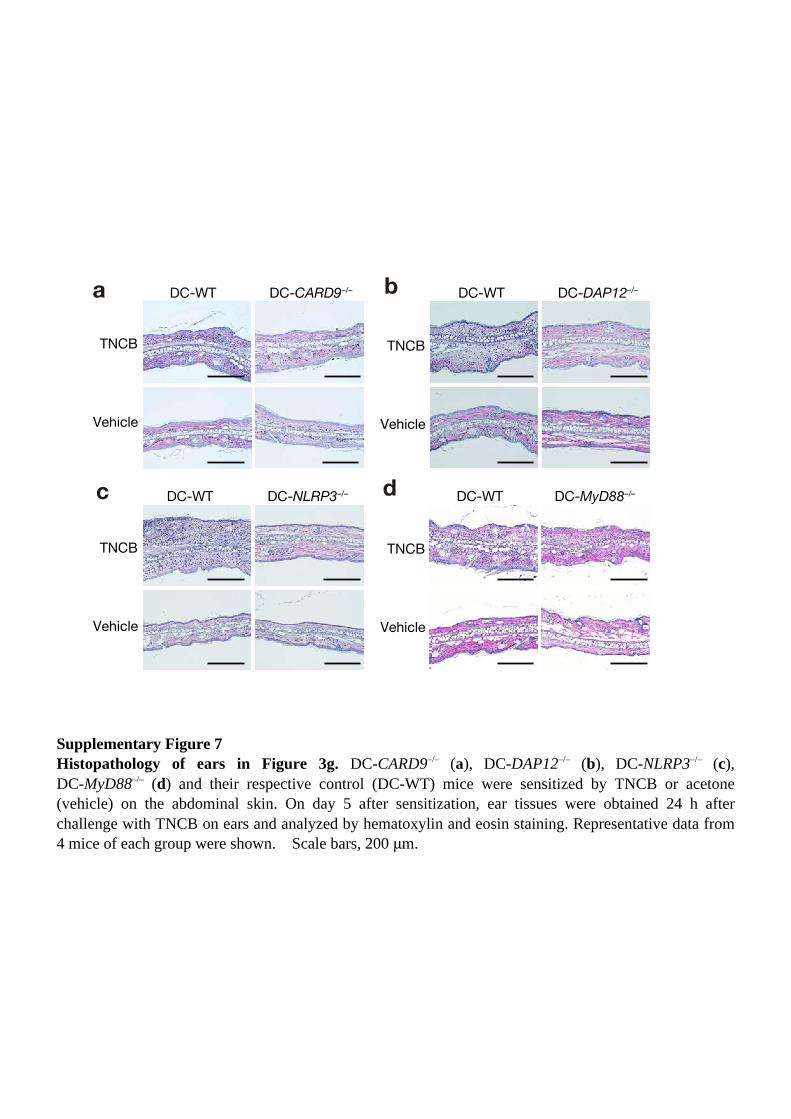
Supplementary Figure 7 Histopathology of ears in Figure 3g. DC-CARD9–/– (a), DC-DAP12–/– (b), DC-NLRP3–/– (c), DC-MyD88–/– (d) and their respective control (DC-WT) mice were sensitized by TNCB or acetone (vehicle) on the abdominal skin. On day 5 after sensitization, ear tissues were obtained 24 h after challenge with TNCB on ears and analyzed by hematoxylin and eosin staining. Representative data from 4 mice of each group were shown. Scale bars, 200 μm.
DC-WT DC-CARD9–/–
DC-MyD88–/–DC-NLRP3–/–
DC-DAP12–/–
DC-WT
Vehicle
TNCB
Vehicle
TNCB
Vehicle
TNCB
Vehicle
TNCB
DC-WT
DC-WTa b
c d
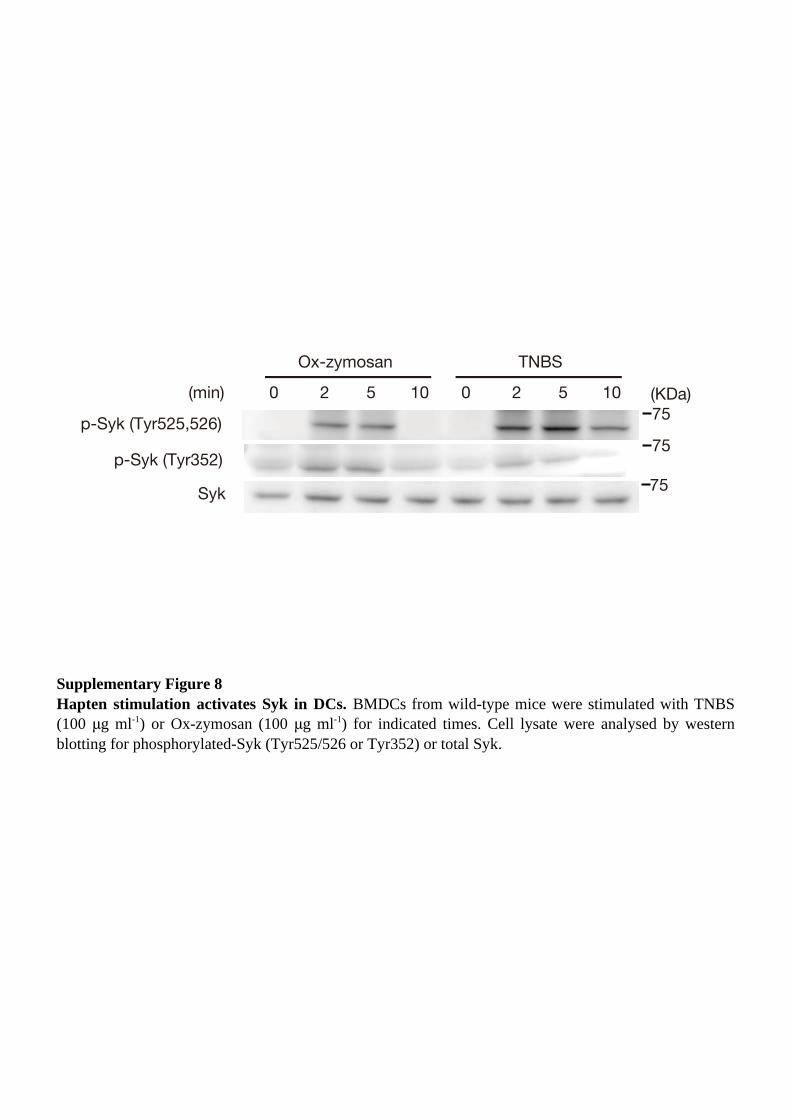
Supplementary Figure 8 Hapten stimulation activates Syk in DCs. BMDCs from wild-type mice were stimulated with TNBS (100 μg ml-1) or Ox-zymosan (100 μg ml-1) for indicated times. Cell lysate were analysed by western blotting for phosphorylated-Syk (Tyr525/526 or Tyr352) or total Syk.
0 2 5 10 0 2 5 10
p-Syk (Tyr525,526)
p-Syk (Tyr352)
Syk
Ox-zymosan TNBS
(min) (KDa)
75
75
75
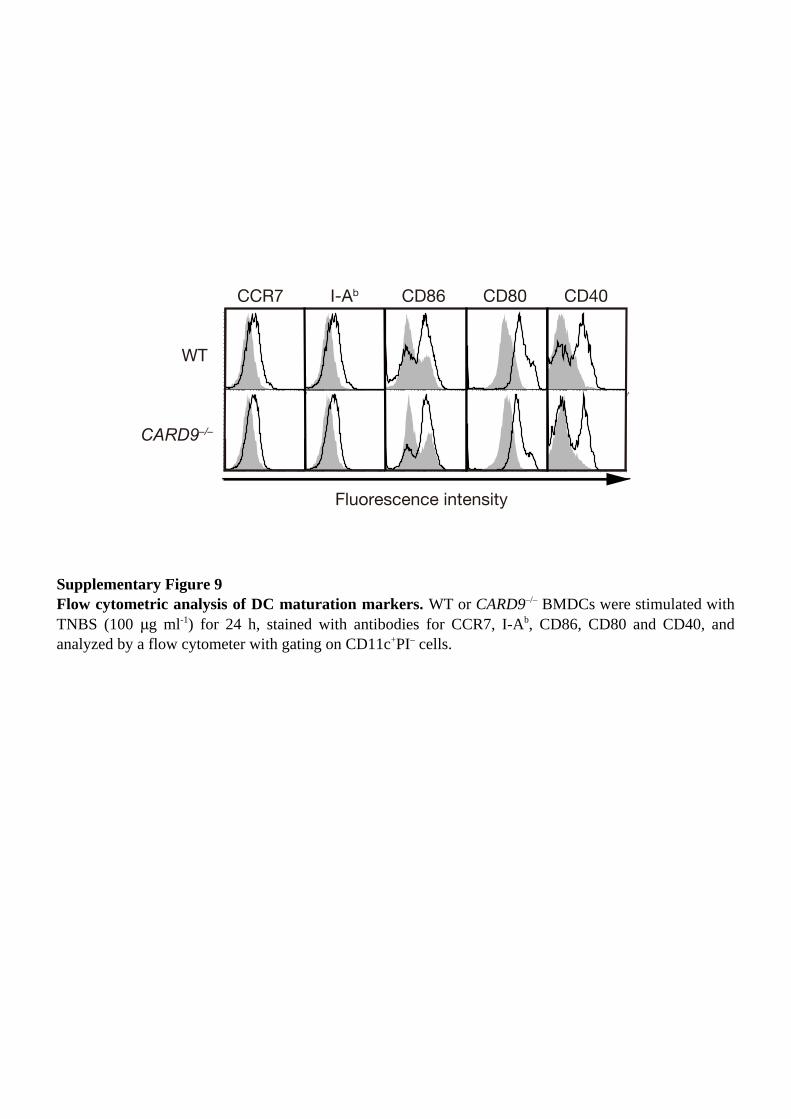
Supplementary Figure 9 Flow cytometric analysis of DC maturation markers. WT or CARD9–/– BMDCs were stimulated with TNBS (100 μg ml-1) for 24 h, stained with antibodies for CCR7, I-Ab, CD86, CD80 and CD40, and analyzed by a flow cytometer with gating on CD11c+PI– cells.
Fluorescence intensity
CCR7
100
101
102
103
104
FL4-H: APC
0
20
40
60
80
100
% o
f M
ax
100
101
102
103
104
FL4-H: APC
0
20
40
60
80
100
% o
f M
ax
100
101
102
103
104
0
20
40
60
80
100
% o
f M
ax
100
101
102
103
104
FL4-H: APC
0
20
40
60
80
100
% o
f M
ax
100
101
102
103
104
0
20
40
60
80
100
% o
f M
ax
100
101
102
103
104
FL4-H: APC
0
20
40
60
80
100
% o
f M
ax
100
101
102
103
104
0
20
40
60
80
100
% o
f M
ax
100
101
102
103
104
0
20
40
60
80
100
% o
f M
ax
100
101
102
103
104
FL4-H: APC
0
20
40
60
80
100
100
101
102
103
104
0
20
40
60
80
100
CD86 CD80 CD40I-Ab
WT
CARD9–/–
b�
75�100�150�
50�
37�
75�100�150�
50�
37�
75�100�150�
50�
37�
WT� CARD9–/–�
–� LPS�Ox-z
ymos
an�
TNBS�–� LP
S�Ox-z
ymos
an�
TNBS�
c-Rel�
p65�
Lamin B�
(KDa)�
a�
75�100�150�
50�
25�
37�
75�100�150�
50�
25�
37�
75�100�150�
50�
25�
37�
75�100�150�
50�
25�
37�
p-Syk (Y525/526)�
p-Syk (Y352)�
Syk�
α-tubulin�
WT� DAP12–/–� FcRγ–/–�CD11c-Cre+!
Sykflox/flox�
0 2 5 10 0 2 5 10 0 2 5 10 0 2 5 10�(min)�(KDa)�
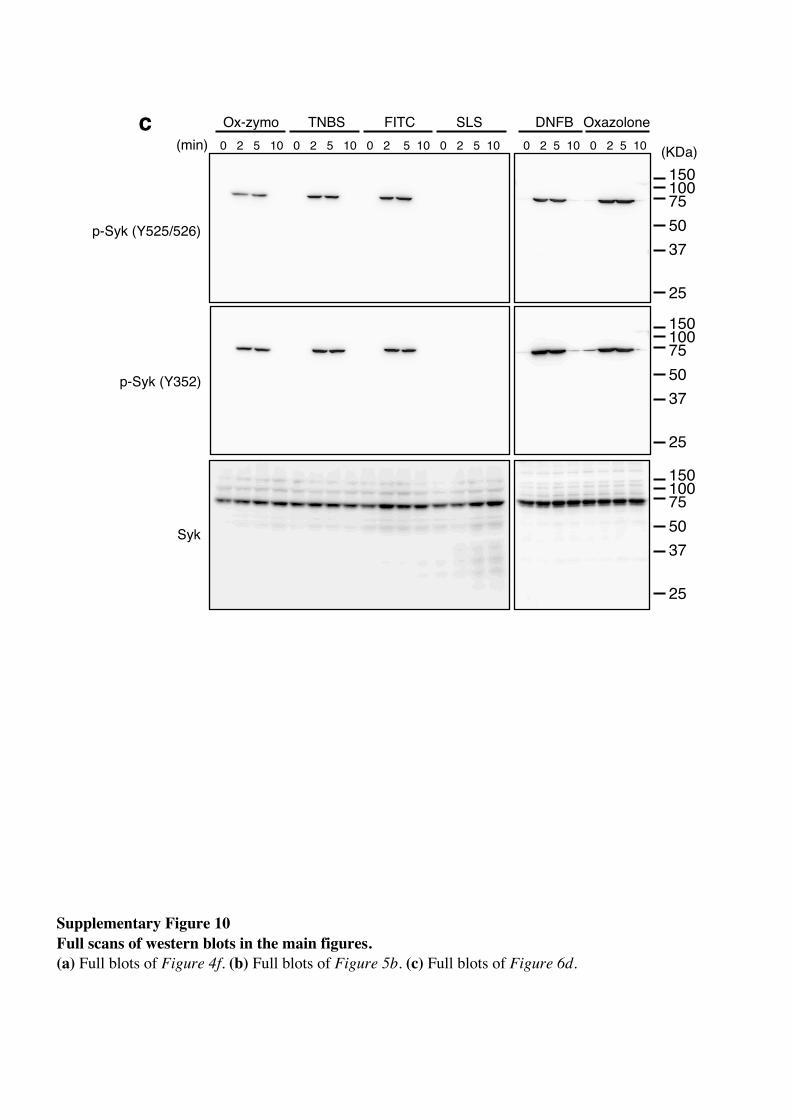
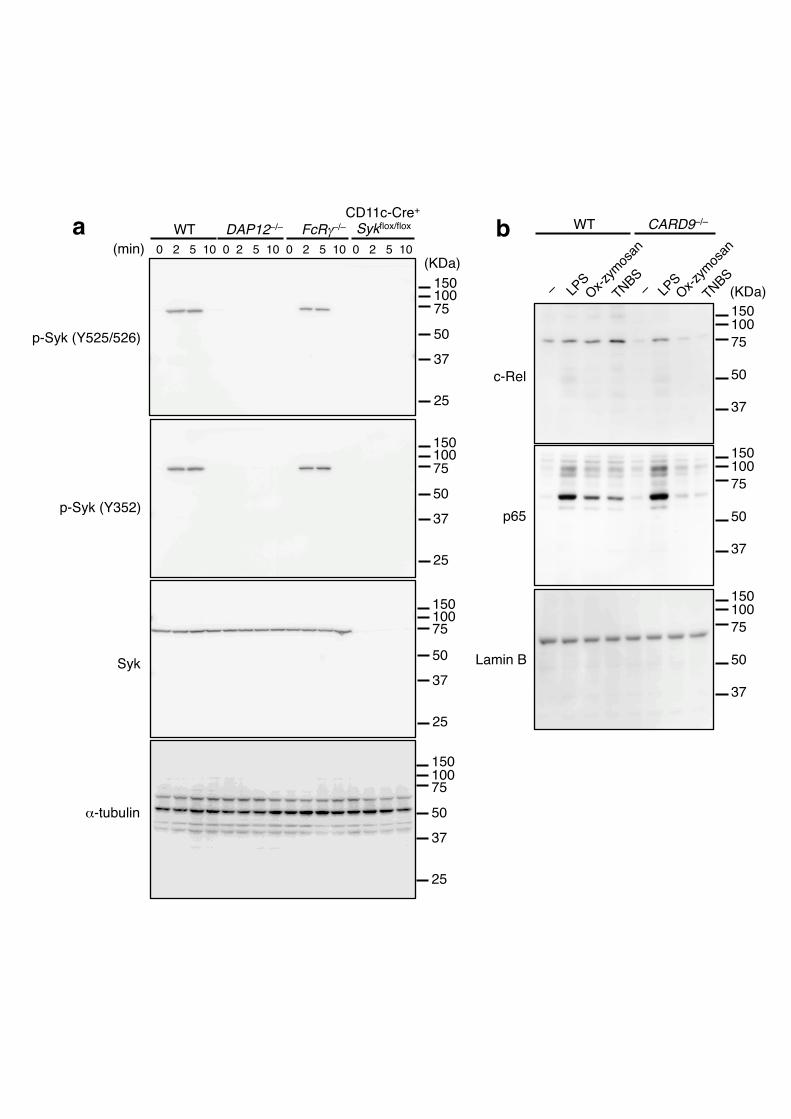
Supplementary Figure 10 Full scans of western blots in the main figures. (a) Full blots of Figure 4f. (b) Full blots of Figure 5b. (c) Full blots of Figure 6d.
c�
75�100�150�
50�
25�
37�
75�100�150�
50�
25�
37�
75�100�150�
50�
25�
37�
p-Syk (Y525/526)�
p-Syk (Y352)�
Syk�
Ox-zymo�0 2 5 10 0 2 5 10 0 2 5 10 0 2 5 10 0 2 5 10 0 2 5 10�(min)�
TNBS� FITC� SLS� DNFB�Oxazolone�
(KDa)�