supplementary information for - media.nature.com · dbv29-f aaa ttt cat atg acc ggc ggc acc gga gcg...
TRANSCRIPT

1
Supplementary Information
Interception of teicoplanin oxidation intermediates yields new antimicrobial
scaffolds
Yu-Chen Liu1,2,5
, Yi-Shan Li1, Syue-Yi Lyu
1,4, Li-Jen Hsu
1, Yu-Hou Chen
1,3, Yu-Ting
Huang1, Hsiu-Chien Chan
1, Chuen-Jiuan Huang
1, Gan-Hong Chen
1, Chia-Cheng
Chou6, Ming-Daw Tsai
1,3,5 & Tsung-Lin Li
1,7*
1Genomics Research Center, Academia Sinica, Taipei 115, Taiwan.
2Chemical Biology and Molecular Biophysics Program, Taiwan International
Graduate Program, Institute of Biochemistry, Academia Sinica, Taipei 115, Taiwan. 3Institute of Biological Chemistry, Academia Sinica, Taipei 115, Taiwan.
4Department of Microbiology and Immunology, National Yang-Ming University,
Taipei 112, Taiwan. 5Institute of Biochemical Science, National Taiwan University, Taipei 115, Taiwan.
6National Synchrotron Radiation Research Center, Hsinchu 300, Taiwan.
7Biotechnology Center, National Chung Hsing Univerisity, Taichung 402, Taiwan.
* To whom correspondence should be sent. E-mail: [email protected]
This PDF file includes:
Supplementary Methods
Supplementary Results
(Supplementary Figures 1-19, Supplementary Tables 1-4)
Supplementary References
Nature Chemical Biology: doi:10.1038/nchembio.556

2
Supplementary Methods
Cloning and protein purification. Protein expression, purification and confirmation
of purity were performed as described previously1-4
. The dbv29 gene was amplified
from genomic DNA by PCR using the first two primers shown in the Primer list
below. The products were each ligated according to the manufacturers' instruction
(Novagene) into the pET-28a(+) expression vector which provides an N-terminal
His6-tagged protein. E. coli cells were grown at 37°C in 1 L of LB medium until an
A600 of about 0.7 was reached. Protein expression was induced with 0.2 mM IPTG at
16°C, and, after 12 h, the cells were harvested by centrifugation, resuspended in 10
mM imidazole-HCl buffer, pH 7.8 (binding buffer), and ruptured using a
microfluidizer. The cell-free extract prepared by centrifugation was applied to an
Ni2+
-NTA resin column, which was then washed successively with binding buffer and
wash buffer before eluting the target protein with 200 mM imidazole-HCl. Gel
filtration was performed using an Ä kta FPLC system equipped with an S-200
Superdex column (Amersham Bioscience) under isocratic conditions (20 mM Tris,
pH 7.6, 100 mM KCl). The buffer was exchanged for 50 mM HEPES buffer, pH 7.2
using Millipore centrifugal filters. Protein concentrations were estimated using the
Bradford assay. The purified protein was confirmed by SDS-PAGE, Western blotting,
and electrospray mass spectrometry (ESI-MS).
Primer list (primers used in this study)
Mutants Primer
Dbv29-f AAA TTT CAT ATG ACC GGC GGC ACC GGA GCG
Dbv29-r GGG CCC CTC GAG TCA GGG CCG GAT CGA CAA CGC
Dbv29-C26A-f CCG GAG CTG CGG GGC GAG CGC GCC TTA CCG CCG GCC GGC CCG
GTC Dbv29-C26A-r GAC CGG GCC GGC CGG CGG TAA GGC GCG CTC GCC CCG CAG CTC
CGG Dbv29-C92A-f GCC GTC CGC AGC GGT GGG CAC GCT TTC GAG GAC TTC GTC GAC
AAC Dbv29-C92A-r GTT GTC GAC GAA GTC CTC GAA AGC GTG CCC ACC GCT GCG GAC
GGC Dbv29-C151A-f GTG ACC ATA CCG GGT GGG GTC GCC GGC GGG GTC GGC GTC GGC
GGA Dbv29-C151A-r TCC GCC GAC GCC GAC CCC GCC GGC GAC CCC ACC CGG TAT GGT
CAC Dbv29-C161A-f GTC GGC GTC GGC GGA CAC ATC GCC GGA GGC GGG TAC GGC CCG
CTG Dbv29-C161A-r CAG CGG GCC GTA CCC GCC TCC GGC GAT GTG TCC GCC GAC GCC
GTC Dbv29-H91A-f GTC CGC AGC GGT GGG GCC TGT TTC GAG GAC TTC
Dbv29-H91A-r GAA GTC CTC GAA ACA GGC CCC ACC GCT GCG GAC
Dbv29-I401A-f GGC GCC GTC TGG CTG GCC GGC TAC GGC GGG AAG
Nature Chemical Biology: doi:10.1038/nchembio.556

3
Dbv29-I401A-r CTT CCC GCC GTA GCC GGC CAG CCA GAC GGC GCC
Dbv29-I401W-f GGC GCC GTC TGG CTG TGG GGC TAC GGC GGG AAG
Dbv29-I401W-r CTT CCC GCC GTA GCC CCA CAG CCA GAC GGC GCC
Dbv29-N44A-f GAC CCG CGC TAC CTC GCC CTG AAG CTG CGT GGC
Dbv29-N44A-r GCC ACG CAG CTT CAG GGC GAG GTA GCG CGG GTC
Dbv29-R41A-f AACCTT CCCCGG GGAACC GGAACC CCCCGG GGCCTT TTAACC CCTTCC AAAACC CCTTGG AAAAGG
Dbv29-R41A-r CCTTTT CCAAGG GGTTTT GGAAGG GGTTAA AAGGCC CCGGGG GGTTCC GGTTCC CCGGGG AAGGTT
Dbv29-R360E-f CCG GGG CGA GGA GGC GAA GGC CCG GCG TCG AAG
Dbv29-R360E-r CTT CGA CGC CGG GCC TTC GCC TCC TCG CCC CGG
Dbv29-R360L-f CCG GGG CGA GGA GGC CTG GGC CCG GCG TCG AAG
Dbv29-R360L-r CTT CGA CGC CGG GCC CAG GCC TCC TCG CCC CGG
Dbv29-S364K-f GGC AGG GGC CCG GCG AAA AAG ACG AAA GCC GGC
Dbv29-S364K-r GCC GGC TTT CGT CTT TTT CGC CGG GCC CCT GCC
Dbv29-S364R-f GGC AGG GGC CCG GCG AGG AAG ACG AAA GCC GGC
Dbv29-S364R-r GCC GGC TTT CGT CTT CCT CGC CGG GCC CCT GCC
Dbv29-T366A-f GGC CCG GCG TCG AAG GCC AAA GCC GGC TAC CTG
Dbv29-T366A-r CAG GTA GCC GGC TTT GGC CTT CGA CGC CGG GCC
Dbv29-T366E-f GGC CCG GCG TCG AAG GAA AAA GCC GGC TAC CTG
Dbv29-T366E-r CAG GTA GCC GGC TTT TTC CTT CGA CGC CGG GCC
Dbv29-T366L-f GGC CCG GCG TCG AAG CTG AAA GCC GGC TAC CTG
Dbv29-T366L-r CAG GTA GCC GGC TTT CAG CTT CGA CGC CGG GCC
Dbv29-W399A-f GAC TAC GGC GCC GTC GCC CTG ATC GGC TAC GGC
Dbv29-W399A-r GCC GTA GCC GAT CAG GGC GAC GGC GCC GTA GTC
Dbv29-W399F-f GAC TAC GGC GCC GTC TTC CTG ATC GGC TAC GGC
Dbv29-W399F-r GCC GTA GCC GAT CAG GAA GAC GGC GCC GTA GTC
Dbv29-Y135F-f ACG CTC TCA GAG GTG TTC GAA AAG CTC TAC CTG
Dbv29-Y135F-r CAG GTA GAG CTT TTC GAA CAC CTC TGA GAG CGT
Dbv29-Y165F-f TGC GGA GGC GGG TTC GGC CCG CTG TCA
Dbv29-Y165F-r TGA CAG CGG GCC GAA CCC GCC TCC GCA
Dbv29-Y165W-f ATC TGC GGA GGC GGG TGG GGC CCG CTG TCA CGG
Dbv29-Y165W-r CCG TGA CAG CGG GCC CCA CCC GCC TCC GCA GAT
Dbv29-Y370F-f ACG AAA GCC GGC TTC CTG CGC AAG CGG CTG
Dbv29-Y370F-r CAG CCG CTT GCG CAG GAA GCC GGC TTT CGT
Nature Chemical Biology: doi:10.1038/nchembio.556

4
Dbv29-Y403F-f GTC TGG CTG ATC GGC TTC GGC GGG AAG GTG AAC
Dbv29-Y403F-r GTT CAC CTT CCC GCC GAA GCC GAT CAG CCA GAC
Dbv29-Y428F-f ATA CTC AAG GTG AAC TTC ATC ACC GGT TGG GCG
Dbv29-Y428F-r CGC CCA ACC GGT GAT GAA GTT CAC CTT GAG TAT
Dbv29-Y453F-f CTC TAT GCC GAT GTG TTC GCC GAG ACC GGC GGG
Dbv29-Y453F-r CCC GCC GGT CTC GGC GAA CAC ATC GGC ATA GAG
Dbv29-Y470F-f GTC AGC GAT GGG GCG TTC ATC AAT TAC CCC GAC
Dbv29-Y470F-r GTC GGG GTA ATT GAT GAACGC CCC ATC GCT GAC
Dbv29-Y473F-f GGG GCG TAC ATC AAT TTC CCC GAC AGC GAC CTC
Dbv29-Y473F-r GAG GTC GCT GTC GGG GAA ATT GAT GTA CGC CCC
Dbv29-Y473E-f GGG GCG TAC ATC AAT GAA CCC GAC AGC GAC CTC
Dbv29-Y473E-r GAG GTC GCT GTC GGG TTC ATT GAT GTA CGC CCC
Synthetic conditions for new analogs. Teicoplanin (a mixture of five analogs) was
purchased from AAPIN Chemicals Ltd (UK). The mixture was subjected to HPLC
purification to obtain C10-Tecicoplanin with purity >95%. 5-Azide pentylamine (99%)
was obtained from Chung-Yi Wu (Academia Sinica) as a gift. All other chemicals
were obtained from Sigma/Aldrich Chemical Co. (St. Louis, MO, USA) without
further purification unless otherwise stated. Teicoplanin analogs (2-6) were
enzymatically synthesized as described previously1-4
. In brief, compound 2 was
prepared by adding Dbv21 or Orf2* (10 g) into a typical buffer solution (50 mM
HEPES, pH 7.2, 100 mM NaCl, 1 mM DTT) containing Tei (1, 1 mM) for 5 h at 37C;
compounds 3-6 were prepared by adding Dbv8 (10 g) into the same buffer solution
but containing compound 2 and butanoyl-, hexanoyl-, octanoyl-, or decanoyl-CoA for
compounds 3-6, respectively, at 25C overnight. For the final reaction, Teicoplanin
analogs (9, 10, 11, 25 and 32, which showed relatively higher yields from initial tests)
were enzymatically synthesized using the optimized conditions described below.
Enzyme stability (and, indirectly, the extent of exposure of the aldehyde for
functionalization) was tested in an array of organic solvents (MeCN, MeOH, EtOH,
DHF, DMF, DCM, DMSO etc.); DMSO turned out to be the most appropriate solvent
as Dbv29 is highly stable in up to 90% DMSO. 50% DMSO, however, is included in
the current protocol as it gives relatively higher yields. Other conditions, such as the
amounts of alkylamine and reductant5, were also optimized one at a time against the
fixed concentration of Tei (0.5 mM) for a better yield (below). In general, 10-fold of
alkylamine and the reducing agent versus Tei was determined to be most appropriate
for the current protocol, which is summarized as follows: Tei (0.5 mM), alkylamine (5
mM; carbon number >6), and Na(CN)BH3 (5 mM) in 50% DMSO buffer solution at
Nature Chemical Biology: doi:10.1038/nchembio.556

5
37C overnight incubation.
0
200
400
600
800
1000
0 5 10 15 20
mA
U
octylamine (mM)
(10x Tei)
Fixed NaCNBH3 (5 mM) and Tei (0.5 mM)
0
200
400
600
800
0 5 10 15 20
mA
U
NaCNBH3 (mM)
Fixed octylamine (5 mM) and Tei (0.5 mM)
(10x Tei)
0
500
1000
1500
2000
0 5 10 15 20 25 30
mA
U
benzylamine (mM)
0
500
1000
1500
2000
0 5 10 15 20 25 30
mA
U
NaCNBH3 (mM)
Fixed NaCNBH3 (5 mM) and Tei (0.5 mM)
Fixed benzylamine (5 mM) and Tei (0.5 mM)
(10x Tei)
(10x Tei)
A 10-fold ratio of alkylamine (5 mM) and NaCNBH3 (5 mM) to Tei (0.5 mM) proved sufficiently
optimized for the octylamine-Tei derivative (left) and the benzylamine-Tei derivative (right), although
higher the concentrations of either reagent provided marginally higher yields.
Compound characterization. All compounds were characterized by MS and HPLC,
which can be found in Supplementary Figure 11. For select compounds, NMR
analyses were performed on a Bruker Avance 600 spectrometer equipped with
CryoProbe™, with tetramethylsilane (TMS) as an internal standard. Compounds were
dissolved in deuterated dimethyl sulfoxide (DMSO-d6) if not otherwise stated, and
spectra were recorded at room temperature. NMR peaks are listed below; original
spectra can be found in Supplementary Figures 12-18.
Teicoplanin (1). HRMS ES(+): 950.7935 [M+H+Na]2+
, calc. for C88H97Cl2N9O33Na
950.7771 [M+H+Na]2+
(Supplementary Figure 19). 1H-NMR (600 MHz, DMSO-d6)
(Supplementary Figure 12): 8.43 (s, 1H), 7.75 (m, 1H), 7.50 (m, 1H), 7.34 (m, 2H),
7.21 (m, 1H), 7.13 (d, J 8.3, 1H), 7.05 (d, J 8.3, 1H), 6.91 (m, 2H), 6.84 (m, 1H), 6.77
(m, 1H), 6.68 (m, 2H), 6.43 (s, 1H), 6.23 (s, 1H), 5.70 (s, 1H), 5.55 (m, 1H), 5.46 (m,
2H), 5.36 (m, 1H), 5.28 (d, J 8.4, 1H), 5.21 (s, 1H), 4.50 (m, 2H), 4.20 (s, 1H), 4.05
(m, 1H), 3.90 (m, 2H), 3.70 (m, 8H), 3.52 (m, 2H), 3.41 (m, 4H), 3.07 (m, 1H), 2.17
(m, 2H), 2.00 (s, 2H), 1.55 (m, 2H), 1.42 (m, 1H), 1.15 (m, 8H), 0.77 (m, 6H). 13
C
NMR (600 MHz, Methanol-d4): 178.10, 177.90, 175.13, 172.17, 171.86, 171.25,
Nature Chemical Biology: doi:10.1038/nchembio.556

6
171.09, 170.93, 168.65, 160.77, 159.51, 158.05, 155.81, 155.04, 153.78, 153.09,
151.99, 150.99, 150.14, 145.25, 139.74, 139.39, 136.62, 136.51, 134.74, 134.58,
132.87, 130.94, 129.79, 129.05, 128.70, 127.89, 127.41, 126.50, 125.72, 125.16,
123.02, 121.55, 121.00, 119.42, 118.53, 110.98, 110.34, 109.31, 107.11, 105.82,
104.25, 102.97, 101.25, 97.82, 78.92, 77.48, 77.37, 74.81, 74.24, 71.66, 71.50, 71.06,
67.41, 63.63, 62.09, 61.71, 60.60, 58.78, 57.53, 57.27, 56.66, 55.33, 49.71, 49.58,
49.44, 49.30, 49.15, 49.01, 48.87, 48.72, 46.83, 39.80, 37.59, 37.10, 30.21, 30.09,
28.74, 27.98, 26.55, 23.40, 23.21, 23.18. An expanded version of HSQC and HMBC
spectra of the reference compound is shown in Supplementary Figure 12.
Compound 2. HRMS ES+: 828.7479 [M+2H]
2+, calc. for C80H83N9O26Cl2 828.7491
[M+2H]2+
(Supplementary Figure 19). 1H-NMR (600 MHz, DMSO-d6)
(Supplementary Figure 13): 9.66 (m, 2H), 9.32 (m, 1H), 8.70 (m, 1H), 7.91 (m, 2H),
7.77 (m, 2H), 7.60 (m, 1H), 7.31 (m, 1H), 7.15 (m, 6H), 6.97 (m, 2H), 6.71 (m, 4H),
6.45 (m, 3H), 6.31 (m, 1H), 5.26 (m, 6H), 5.08 (m, 4H), 4.91 (m, 1H), 4.64 (m, 1H),
4.38 (m, 7H), 3.78 (m, 4H), 3.04 (m, 5H), 2.87 (m, 4H), 1.89 (m, 3H), 1.26 (m, 1H),
1.15 (m, 1H). 13
C NMR (600 MHz, DMSO-d6): 169.81, 169.78, 169.63, 169.25,
169.23, 168.90, 168.37, 167.73, 167.21, 158.80, 158.63, 158.60, 157.97, 157.77,
157.36, 157.24, 155.53, 155.39, 152.84, 151.95, 151.76, 151.38, 150.10, 149.89,
149.02, 148.12, 143.42, 135.48, 127.23, 127.19, 126.20, 125.07, 124.85, 120.88,
120.84, 120.22, 120.05, 118.38, 116.38, 106.06, 98.80, 97.46, 96.58, 78.10, 77.90,
77.01, 76.92, 75.71, 73.77, 73.62, 72.99, 72.90, 72.53, 70.71, 70.64, 70.00, 69.90,
69.81, 66.00, 65.94, 63.10, 61.23, 61.17, 60.98, 60.85, 60.76, 59.32, 57.66, 57.42,
56.89, 56.30, 56.10, 55.99, 54.74, 45.57, 23.24, 23.14. An expanded version of HSQC,
HMBC and 1H COSY spectra of the reference compound is shown in Supplementary
Figure 13.
Compound 9. HRMS ES (+): 957.7779 [M+H+Na]2+
, calc. for C88H96Cl2N9O34Na
957.7667 [M+H+Na]2+
(Supplementary Figure 19). 1H-NMR (600 MHz, DMSO-d6)
(Supplementary Figure 14): 8.45 (s, 1H), 7.72 (s, 1H), 7.51 (m, 1H), 7.33 (m, 2H),
7.21 (m, 2H), 7.07 (m, 2H), 6.93 (m, 3H), 6.84 (d, J 8.4, 1H), 6.77 (m, 2H), 6.62 (m,
3H), 6.42 (s, 1H), 6.19 (s, 1H), 5.71 (s, 1H), 5.55 (s, 1H), 5.46 (m, 4H), 5.30 (s, 1H),
5.18 (s, 2H), 4.47 (m, 4H), 4.20 (s, 1H), 4.09 (m, 1H), 3.91 (m, 1H), 3.70 (m, 10H),
3.51 (m, 2H), 3.41 (m, 3H), 3.11 (m, 1H), 2.22 (m, 2H), 2.03 (m, 3H), 1.55 (m, 2H),
1.41 (m, 1H), 1.27 (m, 3H), 1.14 (m, 5H), 1.04 (m, 2H), 0.87 (m, 1H), 0.77 (m, 6H). 13
C NMR (600 MHz, Methanol-d4): 220.76, 220.02, 217.63, 217.32, 177.88, 175.22,
172.20, 171.82, 171.09, 171.03, 170.87, 168.72, 160.82, 159.48, 158.02, 155.77,
155.02, 153.32, 152.92, 152.30, 150.97, 150.47, 145.43, 139.82, 139.36, 139.20,
Nature Chemical Biology: doi:10.1038/nchembio.556
7
136.50, 136.34, 134.49, 134.21, 132.80, 130.84, 129.83, 129.06, 128.88, 127.90,
126.55, 125.76, 125.03, 124.47, 123.01, 121.54, 121.26, 119.51, 118.51, 116.20,
111.08, 110.31, 109.87, 107.17, 105.77, 103.38, 102.95, 101.17, 97.80, 78.83, 77.35,
74.85, 74.22, 73.75, 71.62, 71.51, 71.10, 67.41, 63.59, 61.73, 58.79, 57.68, 57.59,
57.32, 57.13, 56.80, 56.56, 55.29, 39.81, 37.59, 37.03, 30.27, 30.15, 30.10, 29.99,
28.77, 28.05, 26.67, 23.42, 23.21, 23.18, 23.10. An expanded version of HSQC and
HMBC spectra of the reference compound is shown in Supplementary Figure 14.
Compound 10. HRMS ES (+):1009.3786 [M+2H]2+
, calc. for C98H120O32N10Cl2
1009.37235 [M+2H]2+
(Supplementary Figure 19). 1H NMR (600 MHz, DMSO-d6):
7.71 (m, 1H), 7.16 (m, 3H), 5.32 (m, 1H), 4.90 (m, 1H), 4.26 (m, 1H), 4.13 (m, 1H),
3.67 (m, 1H), 3.57 (m, 1H), 3.43 (m, 1H), 3.33 (m, 3H), 3.06 (m, 3H), 2.88 (m, 1H),
2.52 (m, 4H), 2.01 (m, 2H), 1.88 (m, 1H), 1.26 (m, 23H), 0.82 (m, 9H). 13
C NMR
(600 MHz, DMSO-d6): 174.35, 158.08, 157.87, 157.67, 157.47, 131.73, 131.66,
130.13, 130.06, 129.69, 128.71, 120.37, 118.38, 116.38, 114.56, 96.92, 92.25, 76.87,
76.78, 74.85, 73.79, 73.10, 72.52, 72.39, 72.00, 70.69, 70.60, 70.31, 69.80, 67.44,
63.10, 61.23, 61.05, 60.96, 56.06, 38.10, 35.14, 31.31, 31.25, 30.93, 30.01, 29.82,
29.15, 29.12, 29.06, 28.91, 28.86, 28.75, 28.72, 28.61, 28.59, 28.40, 27.41, 26.72,
26.63, 26.59, 25.14, 25.07, 22.59, 22.44, 22.13, 18.59, 14.00, 13.95. An expanded
version of HSQC and HMBC spectra of the reference compound is shown in
Supplementary Figure 15.
Compound 25. HRMS ES(+): 984.3033 [M+2H]2+
, calc. for C95H104O32N10Cl2
984.3098 [M+2H]2+
(Supplementary Figure 19). 1H-NMR (600 MHz, DMSO-d6)
(Supplementary Figure 16): 9.67 (m, 2H), 8.61 (m, 1H), 8.40 (m, 1H), 7.93 (m, 2H),
7.77 (m, 2H), 7.18 (m, 14H), 6.71 (m, 3H), 6.48 (m, 2H), 6.23 (m, 1H), 5.24 (m, 7H),
4.96 (m, 1H), 4.62 (m, 1H), 4.39 (m, 5H), 4.08 (m, 1H), 3.70 (m, 2H), 3.00 (m, 4H),
2.14 (m, 1H), 1.99 (m, 1H), 1.86 (m, 3H), 1.48 (m, 2H), 1.37 (m, 1H), 1.15 (m, 12H),
0.84 (d, J 6.5, 6H). 13
C NMR (600 MHz, DMSO-d6): 172.87, 172.79, 172.41, 172.36,
169.94, 169.81, 169.39, 169.24, 168.88, 168.76, 168.35, 167.28, 158.54, 158.41,
158.21, 158.00, 157.80, 157.67, 157.48, 157.41, 155.59, 148.27, 135.73, 135.62,
134.68, 131.88, 131.82, 130.21, 130.09, 129.96, 129.88, 129.20, 129.12, 128.86,
128.80, 128.38, 125.02, 120.79, 120.74, 120.20, 118.28, 116.29, 114.62, 109.20,
98.91, 96.62, 76.95, 76.83, 73.80, 73.73, 72.85, 72.80, 72.71, 72.56, 72.44, 72.20,
70.76, 70.68, 70.09, 69.81, 66.02, 63.13, 61.30, 61.20, 61.08, 60.76, 56.58, 56.38,
56.19, 55.77, 54.57, 51.74, 51.00, 50.16, 35.98, 31.37, 29.23, 29.10, 29.02, 28.97,
28.92, 28.87, 28.80, 27.47, 27.40, 26.76, 26.71, 26.67, 25.11, 24.97, 23.25, 23.17,
22.65, 22.18,14.09. An expanded version of HSQC, HMBC and 1H COSY spectra of
Nature Chemical Biology: doi:10.1038/nchembio.556

8
the compound 25 is shown in Supplementary Figure 16. For selected 1H NMR
assignment see Supplementary Figure 18 and Supplementary Table 4.
Compound 32 (de-r4-Tei). HRMS ES(-): 780.1677 [M-2H]-2
, calc. for
C72H68O28N8Cl2 780.1760 [M-2H]-2
(Supplementary Figure 19). 1H-NMR (600
MHz, DMSO-d6) (Supplementary Figure 17): 9.68 (m, 2H), 9.27 (m, 1H), 8.65 (m,
1H), 8.53 (s, 1H), 8.42 (s, 1H), 7.92 (m, 2H), 7.80 (m, 1H), 7.26 (m, 3H), 7.18 (m,
2H), 7.10 (m, 4H), 6.97 (m, 1H), 6.75 (m, 3H), 6.46 (m, 2H), 6.23 (m, 1H), 5.27 (m,
2H), 5.13 (m, 2H), 4.42 (m, 2H), 4.34 (m, 1H), 4.28 (d, J 11.5, 1H), 4.12 (m, 1H),
3.06 (m, 2H), 2.95 (m, 1H), 1.88 (m, 2H), 1.26 (m, 1H). 13
C NMR (600 MHz,
DMSO-d6): 172.79, 172.72, 169.87, 169.63, 169.32, 168.59, 168.44, 167.36, 167.27,
167.19, 158.76, 158.67, 158.56, 158.49, 158.29, 158.08, 157.87, 157.46, 157.38,
155.52, 155.09, 150.27, 150.23, 149.06, 148.56, 148.49, 147.63, 143.51, 135.58,
134.67, 134.41, 128.26, 128.19, 127.13, 126.20, 125.66, 125.25, 123.43, 120.71,
120.19, 120.08, 118.29, 116.30, 105.66, 99.26, 99.13, 97.52, 96.65, 76.91, 76.81,
73.80, 73.66, 73.00, 72.55, 70.59, 70.00, 69.92, 69.81, 65.99, 65.92, 63.11, 61.13,
60.75, 59.25, 56.12, 56.07, 55.86, 55.79, 55.17, 54.59, 23.21, 23.12. An expanded
version of HSQC, HMBC and 1H COSY spectra of the reference compound is shown
in Supplementary Figure 17.
Antibiotic assays. MIC assays were performed as described previously1.
In vivo study.6-8
ICR female mice were purchased from the National Laboratory
Animal Breeding and Research Center, Taipei, Taiwan. Mice with average body
weight of 27 to 30 g were subjected to infection via intravenous (i.v.) injection with
1.3 × 10⁵ cfu/mouse of E. faecalis (ATCC 51559) at day 0. For treatment study, mice
were randomized into four groups at the start of the experiment and administered 10
mg/kg of either vancomycin, teicoplanin, benzylamine-teicoplanin (25) or saline
(control) by i.v. twice a day for three days (from day 1 to day 3, a total of 6 doses).
Mice were subjected to anesthesia; whole blood was then sampled from orbital sinus
on day 1, day 2, and day 3. The whole blood underwent serial dilutions with PBS,
which were plated on Brain Heart infusion agar (BHI agar; Difico, Detroit, MI, USA)
for enumeration of cfu (colony formation unit). The graphs and statistical analyses
were performed using SigmaPlot® and SigmaStat
®. Differences were considered
significant if the P value was < 0.05.
Nature Chemical Biology: doi:10.1038/nchembio.556

9
Supplementary Results
Supplementary table 1. Data collection and refinement statistics.
Dbv29 Dbv29/Teicoplanin
Data collection
Space group P6122 P21
Cell dimensions
a, b, c (Å ) 66.09, 66.09, 790.46 64.75, 152.23, 109.77
() 90.00, 90.00, 120.00 90.00, 91.03, 90.00
Resolution (Å ) 30.00-3.21 (3.32-3.21) * 30.00-2.30 (2.38-2.30)
Rmerge 8.3 (16.0) 8.8 (63.0)
I / I 24.8 (17.0) 22.5 (2.5)
Completeness (%) 95.7 (92.0) 98.9 (96.7)
Redundancy 9.7 (9.8) 7.3 (6.4)
Refinement
Resolution (Å ) 3.21 2.30
No. reflections 16838 88256
Rwork / Rfree 0.237/0.291 0.197/0.252
No. atoms
Protein 7710 15420
Ligand/ion 106 345
Water 69 830
B-factors
Protein 29.2 38.3
Ligand/ion 24.3 47.7
Water 9.0 38.4
R.m.s. deviations
Bond lengths (Å ) 0.005 0.015
Bond angles () 0.837 1.679
The number of crystals is indicated in parentheses for the following data sets: Dbv29 (2) and
Dbv29/Teicoplanin (1). *Values in parentheses are for highest-resolution shell.
Nature Chemical Biology: doi:10.1038/nchembio.556

10
91
151
473
165
Nature Chemical Biology: doi:10.1038/nchembio.556

11
Supplementary figure 1. Multiple sequence alignments for Dbv29 and homologues.
Residues that covalently link to FAD are highly conserved; H91 and C151 of Dbv29
are marked on the top of sequences. Residues corresponding to Tyr-473 are conserved
in Dbv29, AknOx (Tyr-450) and GOOX (Tyr-429). Notes: 1) In GOOX9, Tyr-429
initiates the catalytic activity by proton abstracton that is also facilitated by Asp-355.
In AknOx10
, this second residue is Tyr-144 that may coordinate with Tyr-450. In
BBE11
, the proton abstraction step is carried out by Glu-417). 2) Accession codes for
Dbv29 (Q7WZ62; Nonomuraea sp. ATCC39727), AknOx (Q0PCD7;
Streptomyces galilaeus), GOOX (Q6PW77; Acremonium strictum) and BBE (P30986;
Eschscholzia califomica) are designated by the UniProtKB databank
(http://www.uniprot.org/). 3) Identical residues are colored in red, similar residues are
colored in yellow.
Nature Chemical Biology: doi:10.1038/nchembio.556

12
F-domain S-domain
Subdomain 1 Subdomain 2
B1
B2
B3B4
B5B6
B7
B8B9
B10B11
B12
B13
B14 B15B16
H1
H2 H3
H4
H5
H6H7
H8
H9
H10
H11
H12H13
H14
H15
H16
H17
H18
H19
H20
33
35
41
47
60
64
66
81
83
87
103
108 113
117122
126
130
143
155
163
168
173
174
177
178
188192
200
206
213
223
230
238
242
248
257
258
262
263
281
286
289
290
299 308
317
321
335
346
350
363
371
376
388
395
403
404
410
423
432
434
437
438
453454
457
475
480
489
496
498
510
a
Nature Chemical Biology: doi:10.1038/nchembio.556
13
b
B1B2B3
B4
B5B6
B7 B8B9
B10
B11
B12
B13
B14
B15B16
H1
H2
H3
H4
H5H6
H7
H8
H9
H10
H11
H12
H13
H14
H15
H16
H17
H18
H19
H20
Nature Chemical Biology: doi:10.1038/nchembio.556
14
c
FAD
C151
H91
Nature Chemical Biology: doi:10.1038/nchembio.556
15
d
Nature Chemical Biology: doi:10.1038/nchembio.556

16
e
Nature Chemical Biology: doi:10.1038/nchembio.556

17
399401
165
473
f
Nature Chemical Biology: doi:10.1038/nchembio.556
18
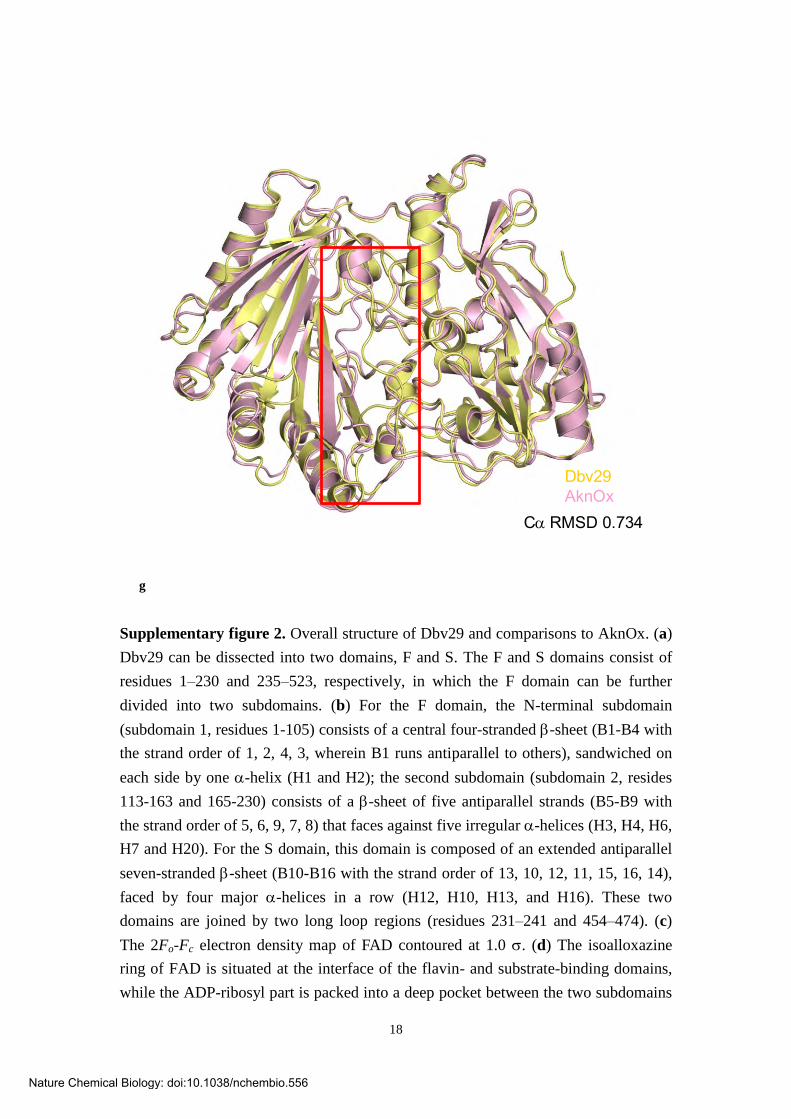
g
Dbv29AknOx
C RMSD 0.734
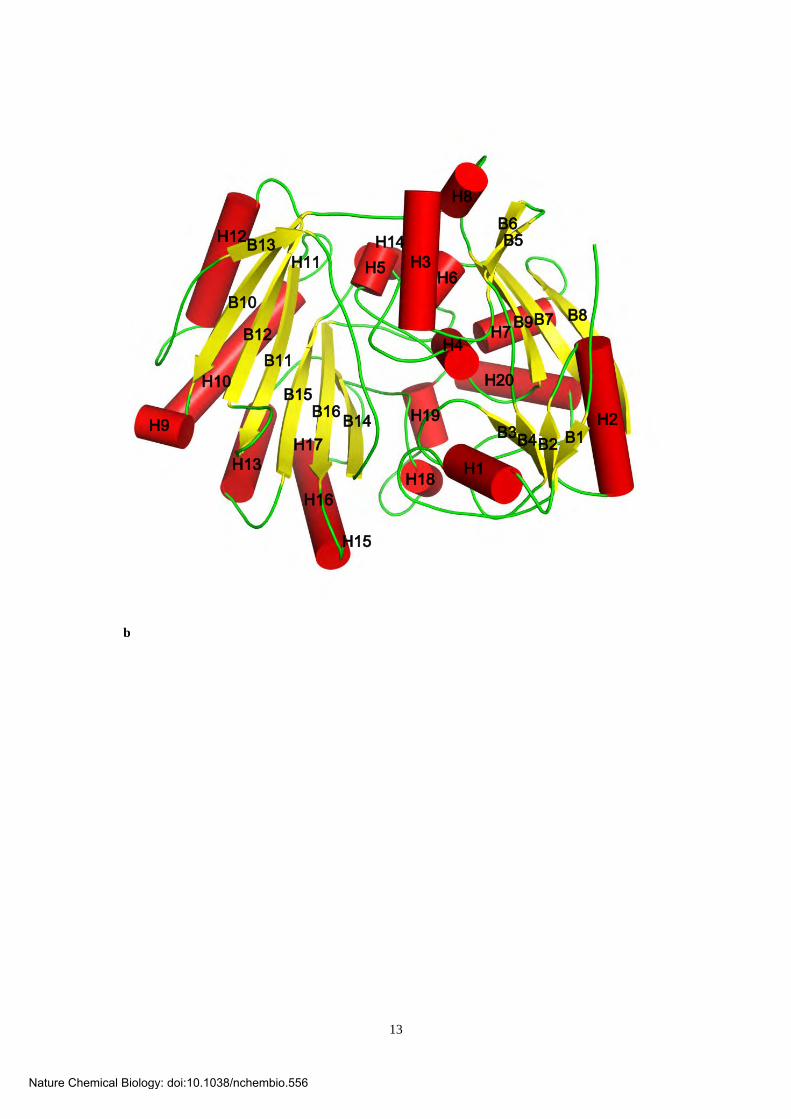
Supplementary figure 2. Overall structure of Dbv29 and comparisons to AknOx. (a)
Dbv29 can be dissected into two domains, F and S. The F and S domains consist of
residues 1–230 and 235–523, respectively, in which the F domain can be further
divided into two subdomains. (b) For the F domain, the N-terminal subdomain
(subdomain 1, residues 1-105) consists of a central four-stranded -sheet (B1-B4 with
the strand order of 1, 2, 4, 3, wherein B1 runs antiparallel to others), sandwiched on
each side by one -helix (H1 and H2); the second subdomain (subdomain 2, resides
113-163 and 165-230) consists of a -sheet of five antiparallel strands (B5-B9 with
the strand order of 5, 6, 9, 7, 8) that faces against five irregular -helices (H3, H4, H6,
H7 and H20). For the S domain, this domain is composed of an extended antiparallel
seven-stranded -sheet (B10-B16 with the strand order of 13, 10, 12, 11, 15, 16, 14),
faced by four major -helices in a row (H12, H10, H13, and H16). These two
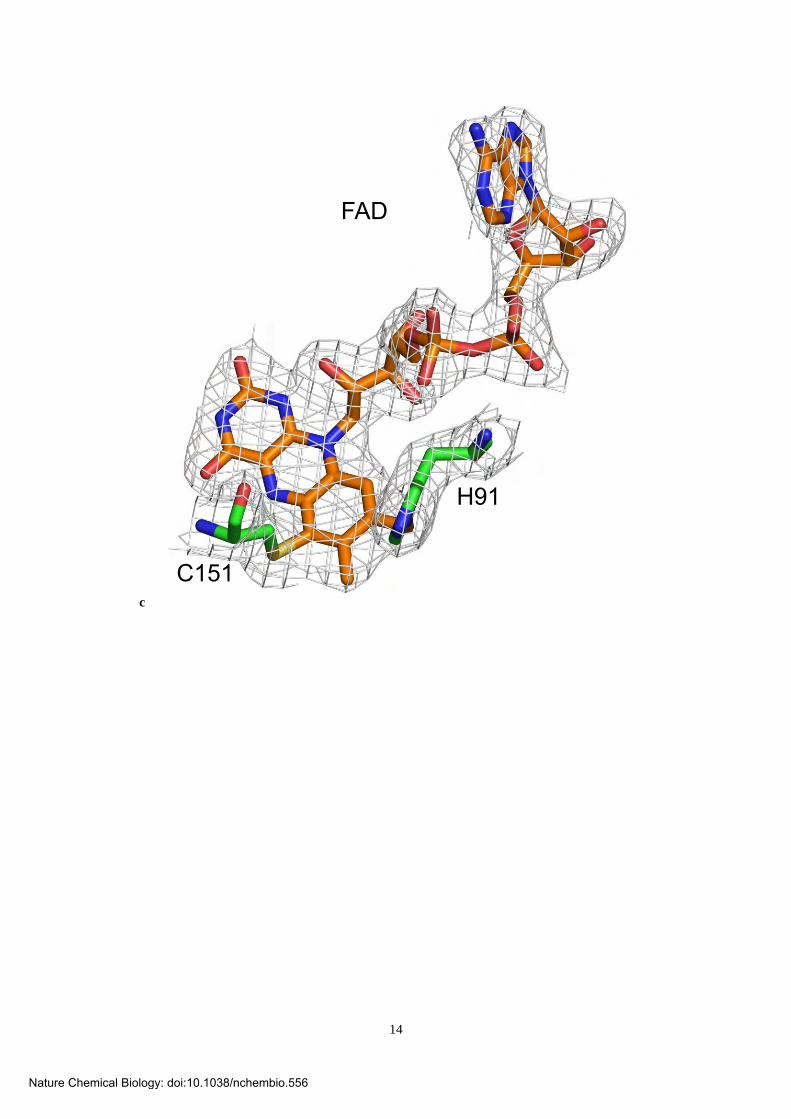
domains are joined by two long loop regions (residues 231–241 and 454–474). (c)
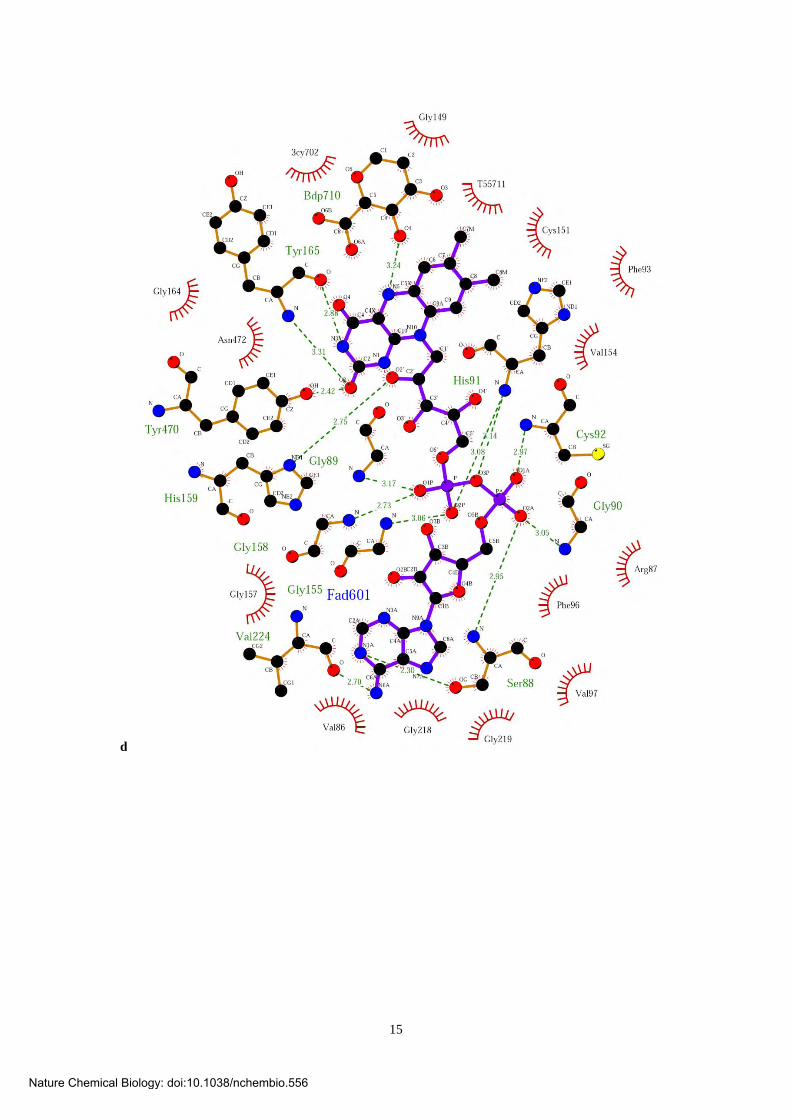
The 2Fo-Fc electron density map of FAD contoured at 1.0 . (d) The isoalloxazine
ring of FAD is situated at the interface of the flavin- and substrate-binding domains,
while the ADP-ribosyl part is packed into a deep pocket between the two subdomains
Nature Chemical Biology: doi:10.1038/nchembio.556

19
of the F-domain. (e) The lipid cavity mainly is formed by residues Phe-93, Ser-364,
Tyr-395, Trp-399 and Ile-429. (f) The residues for FAD binding are highly conserved
(framed in blue), while the residues for substrate binding account for the major
variations between the proteins (framed in black). The tyrosine pair (Y165/Y473) is
conserved in both Dbv29 and AknOx, while AknOx also need a second general base
pair (W399 and I401). (g) Dbv29 and AknOx were superimposed with the rmsd of
0.734 Å for 480 Cα, which suggests both tertiary structures are similar but with
variations in the substrate-binding domain framed in red.
Nature Chemical Biology: doi:10.1038/nchembio.556

20
Dimeric form
a
Nature Chemical Biology: doi:10.1038/nchembio.556

21
Monomeric form
b
Nature Chemical Biology: doi:10.1038/nchembio.556
22
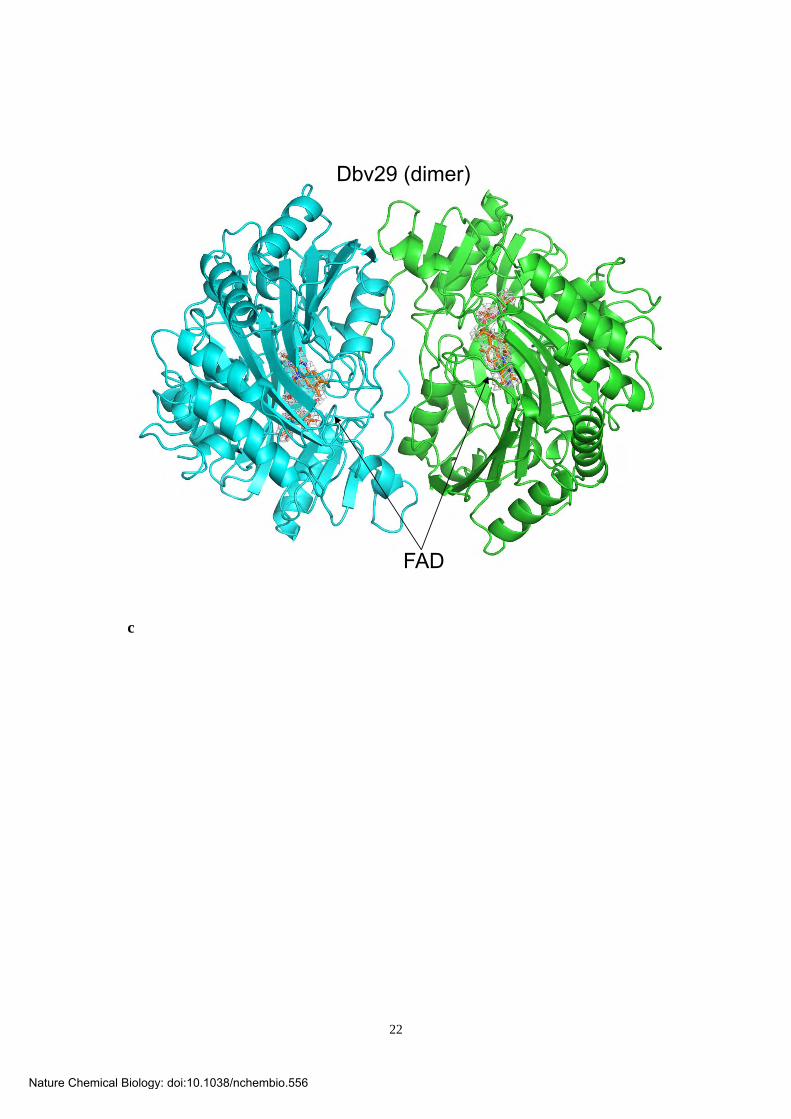
c
Dbv29 (dimer)
FAD
Nature Chemical Biology: doi:10.1038/nchembio.556

23
d
FAD
diol-Tei (8)
Tei-bound Dbv29 (monomer)
Nature Chemical Biology: doi:10.1038/nchembio.556

24
e
nativecomplex
Ca RMSD 0.291
Nature Chemical Biology: doi:10.1038/nchembio.556

25
f
3.02 Å
3.72 Å
R41Y139
L140
2.82 Å
3.81 Å
3.11 Å
2.80 Å
N44
R349
L351
Supplementary figure 3. Interfaces for and structural analysis of dimeric and
monomeric Dbv29. Analyses of native (a) and ligand-bound (b) structures of Dbv29
with PISA12
showed that the interfaces for the native and complex structures are 1350
and 300 Å , respectively. These results agree with that the native and complex
structures are dimeric and monomeric, respectively. The analysis statistics for each
protein is demonstrated on bottom panel. (c) The dimer of Dbv29 in a P6122 space
group (two polypeptide chains in an asymmetric unit); FAD cofactors are represented
as stick models. (d) Monomer of Dbv29 in complex with a water-coordinated-diol
intermediate (also see Fig. 2c) in a P21 space group (an asymmetric unit consists of
Nature Chemical Biology: doi:10.1038/nchembio.556

26
four polypeptide chains in which there are no typical protein-protein interactions with
one another); the FAD cofactors and the Tei intermediate are represented as stick
models in orange and blue, respectively. (e) Superposition of the ligand-free and
ligand-bound structures. Substrate-free and -bound structures were superimposed with
the rmsd of 0.291 Å for 498 Cα, which suggests binding of ligand does not induce
substantial conformational changes. (f) Residues Arg41 (forming two hydrogen bonds)
and Asn44 (four hydrogen bonds) were identified as potentially significant residues in
the dimer interface, and were investigated further by site-directed mutagenesis
(Supplementary Table 2) and AUC analysis (Supplementary figure 7 m, n).
(Protein interfaces, surfaces and assemblies were analyzed using the PISA server at
the European Bioinformatics Institute
(http://www.ebi.ac.uk/msd-srv/prot_int/pistart.html)).
Nature Chemical Biology: doi:10.1038/nchembio.556

27
a
Nature Chemical Biology: doi:10.1038/nchembio.556

28
b
diol-Tei (8)
Nature Chemical Biology: doi:10.1038/nchembio.556

29
c
Y395W399
M304
G305
E306
Q294
Q314
Q348
W350
L351
S353P355
R357
Nature Chemical Biology: doi:10.1038/nchembio.556

30
d
R357
M304
G356P355
S353
L351
Q348
W350
L168
Q314
P167
W292
Q294
Y165Y473
W399
F93
S364
Y395
G149
V150
C151
Nature Chemical Biology: doi:10.1038/nchembio.556

31
e
Y165
Y473
F93
T366
S364I429
Y395
W399
I401
FAD
Nature Chemical Biology: doi:10.1038/nchembio.556

32
f
Y135
Y165
Y473
Y470
Y403
Y370
g
Y403
Y370
4.15 Å
h
Y428
Y453
2.82 Å
i
R360
T366
Supplementary figure 4. Substrate binding site. (a) Residues that line the
ligand-binding site are located in different loops highlighted in orange (residues
148-152, 165-168, 300-308, 350-362, and 470-473). (b) The 2Fo-Fc electron density
map of the diol intermediate contoured at 1.0 . (c,d) Surface (c) and ball-and-stick (d)
illustrations of hydrophobic interactions (residues and surface are colored according
to their hydrophobicity; blue: positive charge; red: negative charge; white: neutral)
and hydrogen bonds (yellow dashed line) with the heptapeptide backbone, indicating
the major interacting forces between the aglycone and substrate-binding-site residues.
(e) View of the lipid tunnel in Dbv29, in which the N-acyl moiety of the aminosugar
at r4 is inserted into a hydrophobic cavity that is mainly composed of residues Phe93,
Ser364, Thr366, Tyr395, Trp399 and Ile429 (electrostatic surface potentials of
negative potential (78 KT) and positive potential (78 KT) are colored in red and blue,
respectively; neutral surface potential regions are displayed in white). In particular,
Trp399 is nearby the reducing end of the sugar, and, together with Ile401, stands
above the shoulder of the r4 sugar head and poises the head facing the isoalloxazine
ring. Ile401 stands on the other side of the sugar head, nearby the C6 carbon. Thr366,
Nature Chemical Biology: doi:10.1038/nchembio.556

33
situated opposite Trp399 at the entry of the lipid cavity, may help the lipid chain
insert into the lipid cavity (panel d). Ser364, which lines the bottom of the cavity, may
force the lipid to fold in a spiral manner. (f-h) Tyrosine residues near the active site
that could play a role in enzyme structure or function. (f) Tyr135, Tyr370, Tyr403 and
Tyr470 are shown in addition to the previously identified Tyr165 and Tyr473. (g,h).
Close up view of two tyrosine pairs, Tyr403/Tyr370 (4.1 Å ) (g) and Tyr428/Tyr453
(2.8 Å ) (h), that are positioned within approximate hydrogen-bond distances of each
other. (i) Close up view of two additional residues (Arg360 and Thr366) postulated to
play a role in Dbv29 function. Thr366 gates the lipid cavity along with bulky and
charged Arg360 that sits on the same long loop. Specific residues in proximity to the
ligand, as shown in panels c-i, were subject to mutagenesis to explore these
interactions further (see Supplementary Table 2).
Nature Chemical Biology: doi:10.1038/nchembio.556

34
Supplementary Table 2. Relative enzymatic activities of Dbv29 mutants
Mutants Expression Flavinylation/
FAD binding
Relative
activitya
Rationale Outcome Source of result
C26A + + 1.11 Putative point of active
site general base
Role disproven Ref. 2
C92A + + 0.95 Putative point of active
site general base
Role disproven Ref. 2
C151A + + 0.23
Putative point of active
site general base/
Putative point of
covalent attachment
Role disproven/
Role proven
Ref. 2
C161A + + 0.84 Putative point of active
site general base
Role disproven Ref. 2
H91A + + 0.11 Putative point of
covalent attachment
Role proven Ref. 2
I401A + + 0.09 Potential
ligand-binding residue
Role proven This work
I401W + + 0.02 Potential
ligand-binding residue
Role proven This work
N44A + + 0.87 Potential interface
interacting residue
Role proven This work
R41A + + 0.72 Potential interface
interacting residue
Role proven This work
R360E + + 0.76 Putative point affecting
FAD attachment
Role disproven This work
R360L + + 0.23 Putative point affecting
FAD attachment
Role disproven This work
S364K + + 0.04
Potential
ligand-binding residue/
Putative point affecting
FAD attachment
Role proven/
Role disproven
This work
S364R + + 0.08
Potential
ligand-binding residue/
Putative point affecting
FAD attachment
Role proven/
Role disproven
This work
T366A + + 0.11
Potential
ligand-binding residue/
Putative point affecting
FAD attachment
Role proven/
Role disproven
This work
T366E + + 0.05
Potential
ligand-binding residue/
Putative point affecting
FAD attachment
Role proven/
Role disproven
This work
T366L + + 0.13
Potential
ligand-binding residue/
Putative point affecting
FAD attachment
Role proven/
Role disproven
This work
W399A + + - Potential
ligand-binding residue
Role proven This work
W399F + + 0.16 Potential
ligand-binding residue
Role proven This work
Y135F - - - Putative point affecting
FAD attachment
Not conclusive This work
Y165F + + 0.70 Putative point of active
site general base
Role proven Ref. 2
Y165W + + 0.03 Putative point of active
site general base
Role proven This work
Nature Chemical Biology: doi:10.1038/nchembio.556

35
Y370F + + 0.10 Putative point affecting
FAD attachment
Role disproven This work
Y403F + + 0.65 Putative point affecting
FAD attachment
Role disproven This work
Y428F + + 1.00 Putative point affecting
FAD attachment
Role disproven This work
Y453F + + 0.82 Putative point affecting
FAD attachment
Role disproven This work
Y470F + + 0.21 Putative point affecting
FAD attachment
Role disproven This work
Y473F + + 0.23 Putative point of active
site general base
Role proven Ref. 2
Y473E + + - Putative point of active
site general base
Role proven This work
H91A/C151A + + 0.05 Putative point of
covalent attachment
Role proven Ref. 2
R41A/N44A + + 0.59 Potential interface
interacting residue
Role proven This work
R360E/T366E + + 0.03 Putative point affecting
FAD attachment
Role disproven This work
R360L/T366A + + 0.03 Putative point affecting
FAD attachment
Role disproven This work
R360L/T366E + + 0.01 Putative point affecting
FAD attachment
Role disproven This work
Y165F/Y473F + - - Putative point of active
site general base
Role proven Ref. 2
Y428F/Y453F + + 1.08 Putative point affecting
FAD attachment
Role disproven This work
Y370F/Y403F + + 0.05 Putative point affecting
FAD attachment
Role disproven This work
a. The products of mutants were analyzed by HPLC; peak areas were integrated and
averaged for 3 triplicate points in 1.5 hours; the reaction rates were calculated using
linear regression equation; relative activities were determined by dividing individual
reaction rate with that of WT; the relative activity of WT is 1.0.
Nature Chemical Biology: doi:10.1038/nchembio.556

36
a
b 14 16 18 20 22 min
3 16
919162 i
ii
iii
iv
v
vi
vii
viii
ix
x
9*
1*6*
Nature Chemical Biology: doi:10.1038/nchembio.556

37
c
kcat (s-1
) Km (M-1
) kcat/ Km (s-1M
-1)
C2-pseudo-Tei 5.66 15 0.38
C10-pseudo-Tei 4.7 1.3 3.62
Model: OneSitesChi^2/DoF = 1.634E7N 1.05 0.0128 SitesK 9.42E5 2.24E5 M-1DH -7.476E4 1492 cal/molDS -219 cal/mol/deg
0.0 0.5 1.0 1.5 2.0
-80.00
-70.00
-60.00
-50.00
-40.00
-30.00
-20.00
-10.00
0.00
-2.50
-2.00
-1.50
-1.00
-0.50
0.00
0.50-10 0 10 20 30 40 50 60 70 80
Time (min)
µcal/
sec
Molar Ratio
KCal/
Mole
of I
njecta
ntca
l/se
c
d
Supplementary figure 5. Substrate preferences, kinetics, and thermodynamics for
Dbv21, Dbv29, and Orf2* (a Dbv21 ortholog in Tei (1) producing strain3,13,14
). (a)
The reactions catalyzed by each protein. Compounds 9, 16, and 19 are products of
Dbv29 when compounds 1, 3, and 6 serves as substrates, respectively. (b) HPLC
traces for enzymatic reactions of Dbv21 and/or Dbv29 in given conditions (described
below; note that compounds 1/6 and 9/19 have the same retention time).
i) LC trace of C4-Tei (3) that was enzymatically synthesized by Dbv8.
ii) LC trace of the reaction catalyzed by Dbv29 in the presence of C4-Tei (3).
iii) LC trace of the reaction catalyzed by Dbv21 in the presence of 3.
iv) LC trace of C10-Tei (6) that was enzymatically synthesized by Dbv8.
v) LC trace of the reaction catalyzed by Dbv29 in the presence of C10-Tei (6).
vi) LC trace of the reaction catalyzed by Dbv21 in the presence of C10-Tei (6).
vii) LC trace of the reaction catalyzed by both Dbv21 and 29 in the presence C10-Tei
(6); the ratio of products 19 to 2 is about 10, indicating Dbv29 is more efficient than
Nature Chemical Biology: doi:10.1038/nchembio.556

38
Dbv21 when both are included in the same reaction.
viii) LC trace of the reaction catalyzed by Dbv29 in the presence of substrates C4-Tei
(3) and C10-Tei (6); the ratio of products 19 to 16 is about 10.
ix) LC trace for compound 1 in a solution with no acid* added.
x) LC trace for compound 9 and compound 1 in a solution with no acid.
Comparing traces ii and v, we see that Dbv29 favors a substrate with a longer acyl
side chain (6, C10) to that with a shorter chain (3, C4) by 10-fold. Similarly, comparing
traces iii and vi, and the data in panel c, we conclude that Dbv21 also favors longer
acyl substrates. The data in traces ix and x explore the role of glycosylation in
increasing compound solubility. In acidic conditions (which will protonate carboxylic
acid), Tei (1) elutes later than when no acid is added (20.7 min vs. 20.4 min). The
solubility of oxo-Tei (9) changes more drastically in the absence of acid, eluting at
21.2 minutes with acid (after Tei) and 16.8 minutes with no acid (before Tei). (c)
Kinetic data of Orf2* against short (C2) and long (C10) lipid chain substrates. The
results show C10 is about 10-fold higher than C2 in terms of enzyme specificity
(kcat/Km), in which kcat is about the same for both while C10 has higher substrate
affinity. Thus Orf2* also prefers a longer chain. (d) ITC thermogram for Dbv29 and
Teicoplanin. Each exothermic heat pulse corresponds to injection of 2 l of Tei (1 mM)
into the protein solution (0.22 mM); integrated heat areas constituted a differential
binding curve that was fit to a standard single-site binding model (Origin 7.0,
MicroCal iTC200) to give the stoichiometry of binding15
, N = 1.05, binding affinity,
KA = 9.42 × 10⁵
M-1
(KD = 1 M) and enthalpy of binding, DH = -75 kcal mol-1
.
Nature Chemical Biology: doi:10.1038/nchembio.556

39
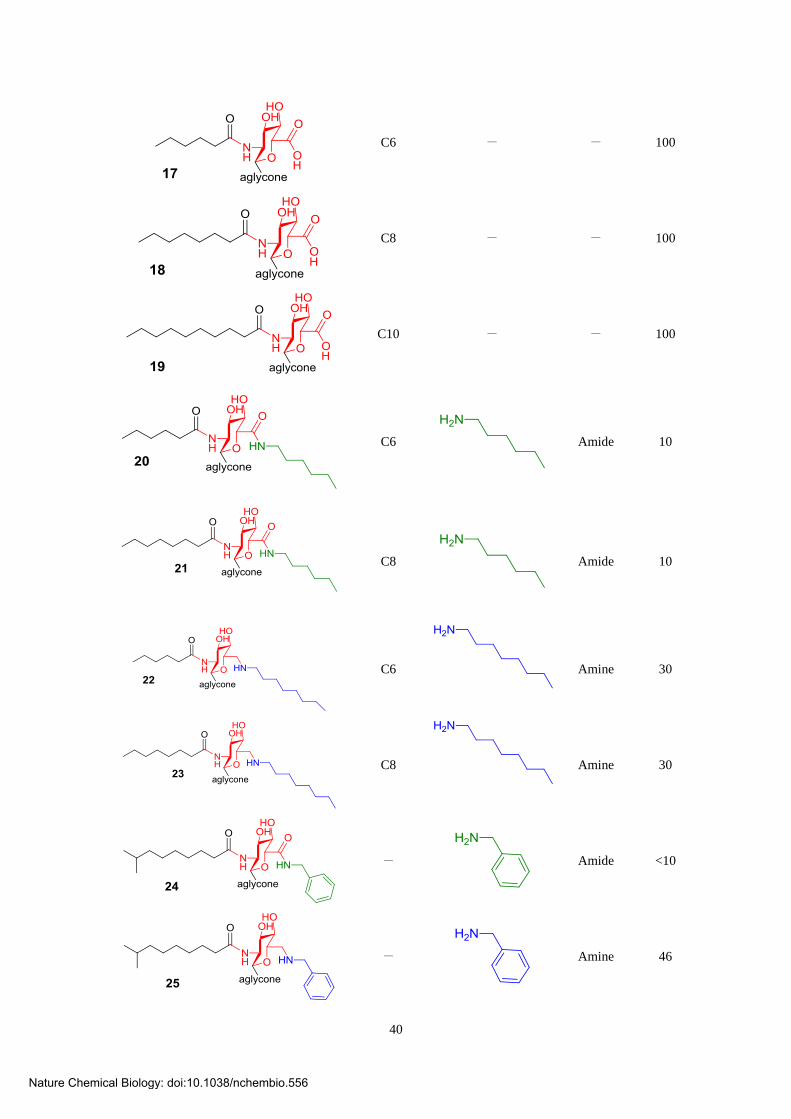
Supplementary Table 3. Product yields of oxidized, aminated or amidated teicoplanin analogs synthesized by Dbv29.
Product
Coenzyme A
derivative
(Carbon No.)1
Amine added
Product type:
amide or
amine
Yield
(%)2
- - - 100
-
Amine 25
-
Amide 10
-
Amide <10
-
Amide 10
-
Amine 25
-
Amine 17
C4 - - 100
Nature Chemical Biology: doi:10.1038/nchembio.556
40
C6 - - 100
C8 - - 100
C10 - - 100
C6
Amide 10
C8
Amide 10
C6
Amine 30
C8
Amine 30
-
Amide <10
-
Amine 46
Nature Chemical Biology: doi:10.1038/nchembio.556

41
-
Amine <5
-
Amine <5
-
Amine <5
-
Amide <5
-
Amine <10
-
Amine
25
1. Dbv8 was used to add various lengths of acyl side chains from corresponding
coenzyme A derivatives to the C2 amine group. If no CoA derivative is listed,
Teicoplanin was used directly.
The product yields were determined by HPLC; yield = (peak area of aminated or
amidated product)/(peak areas of aminated and amidated and oxidized products) ×
100%.
Nature Chemical Biology: doi:10.1038/nchembio.556

42
a
b
Supplementary figure 6. Mice infection test for analog 25 in blood bacterial
clearance. (a) The plot shows the whole blood bacterial counts of mice infected by E.
faecalis (ATCC 51559) and treated with vancomycin (Van, in black) or teicoplanin (1,
in red) or analog 25 (in green) or saline (control, in blue) for three days. The bacterial
counts for the control are steadily increased over time, while the counts for groups
treated with drugs are all suppressed but in various extents. Teicoplanin and analog 25
are more prominent than vancomycin in terms of overall drug efficacy. (b) The bar
chart shows the bacterial counts at day 3 (end of treatment). In general, these three
drugs all show positive effects against the infection, while only analog 25 displays
significant. The asterisk (*) indicates significant difference (P < 0.05); data were
expressed as mean ± SD for a group of three mice)
0 1 2 3
3
4
5
6
7
8
9
Van
1
25
Saline
Lo
g E
.faec
ium
cfu
/ml
wh
ole
blo
od
Day
Van 1 25 Saline
0
2
4
6
8
10
Log E
.faec
ium
cfu
/ml
wh
ole
blo
od
Nature Chemical Biology: doi:10.1038/nchembio.556

43
WT
Dimers=5.97Mcal=103.9 (kDa)
fr=1.33
Y165F
Dimers=5.92Mcal=109.7 (kDa)
fr=1.44
Y473F
Dimers=6.00Mcal=98.1 (kDa)
fr=1.00
Y165F/Y473F
Monomers=3.44, 4.12 Mcal=68.9, 64.1 (kDa)
fr=1.66
Nature Chemical Biology: doi:10.1038/nchembio.556
44
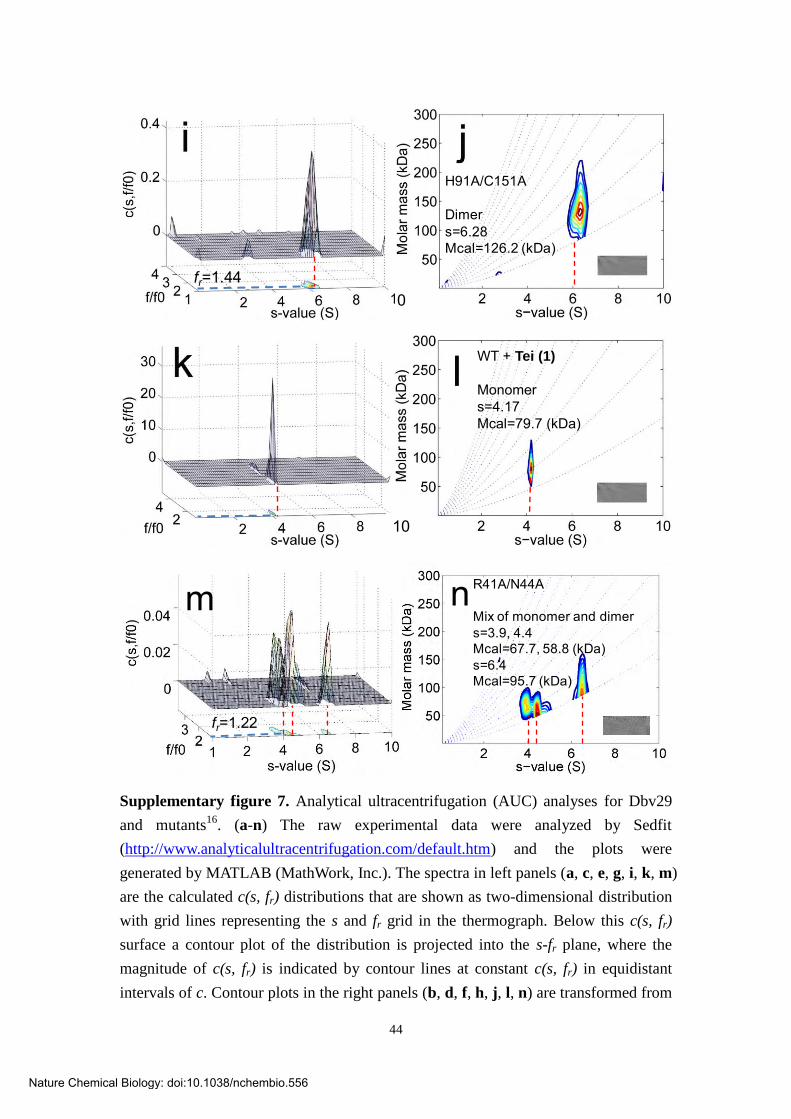
0
H91A/C151A
Dimers=6.28Mcal=126.2 (kDa)
fr=1.44
10
WT + Tei (1)
Monomers=4.17Mcal=79.7 (kDa)
R41A/N44A
Mix of monomer and dimers=3.9, 4.4 Mcal=67.7, 58.8 (kDa)s=6.4Mcal=95.7 (kDa)
m n
fr=1.22
Supplementary figure 7. Analytical ultracentrifugation (AUC) analyses for Dbv29
and mutants16
. (a-n) The raw experimental data were analyzed by Sedfit
(http://www.analyticalultracentrifugation.com/default.htm) and the plots were
generated by MATLAB (MathWork, Inc.). The spectra in left panels (a, c, e, g, i, k, m)
are the calculated c(s, fr) distributions that are shown as two-dimensional distribution
with grid lines representing the s and fr grid in the thermograph. Below this c(s, fr)
surface a contour plot of the distribution is projected into the s-fr plane, where the
magnitude of c(s, fr) is indicated by contour lines at constant c(s, fr) in equidistant
intervals of c. Contour plots in the right panels (b, d, f, h, j, l, n) are transformed from
Nature Chemical Biology: doi:10.1038/nchembio.556
45
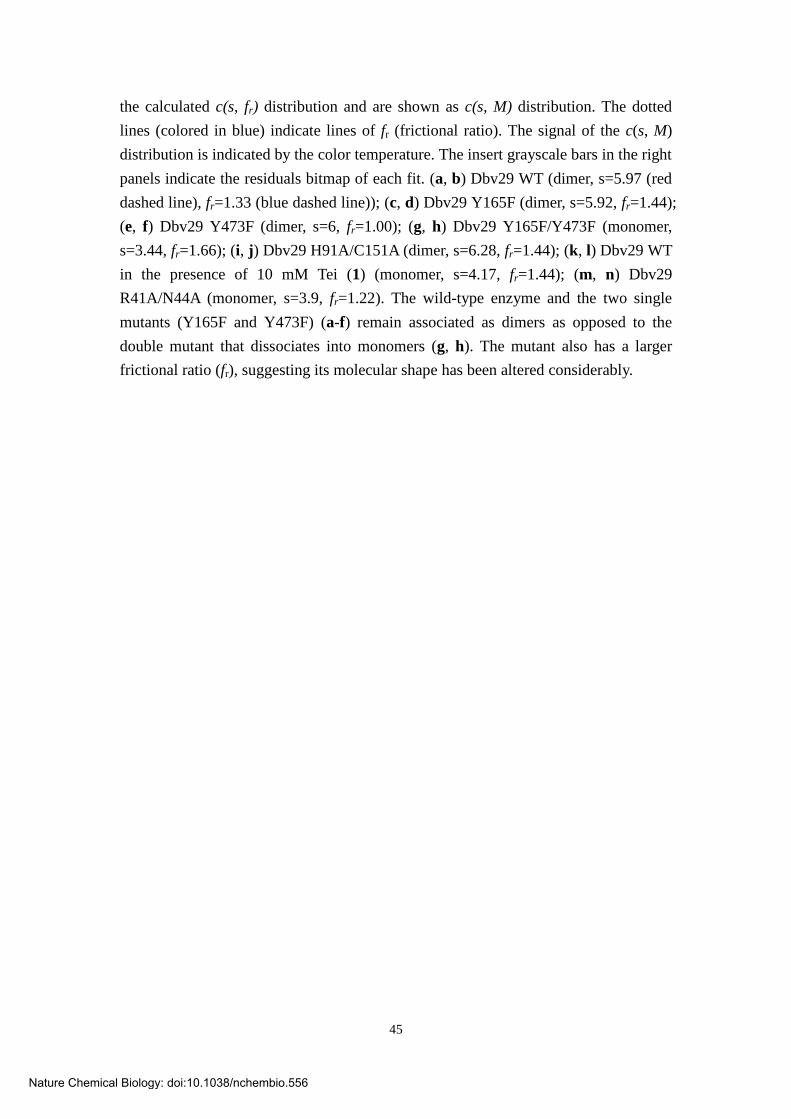
the calculated c(s, fr) distribution and are shown as c(s, M) distribution. The dotted
lines (colored in blue) indicate lines of fr (frictional ratio). The signal of the c(s, M)
distribution is indicated by the color temperature. The insert grayscale bars in the right
panels indicate the residuals bitmap of each fit. (a, b) Dbv29 WT (dimer, s=5.97 (red
dashed line), fr=1.33 (blue dashed line)); (c, d) Dbv29 Y165F (dimer, s=5.92, fr=1.44);
(e, f) Dbv29 Y473F (dimer, s=6, fr=1.00); (g, h) Dbv29 Y165F/Y473F (monomer,
s=3.44, fr=1.66); (i, j) Dbv29 H91A/C151A (dimer, s=6.28, fr=1.44); (k, l) Dbv29 WT
in the presence of 10 mM Tei (1) (monomer, s=4.17, fr=1.44); (m, n) Dbv29
R41A/N44A (monomer, s=3.9, fr=1.22). The wild-type enzyme and the two single
mutants (Y165F and Y473F) (a-f) remain associated as dimers as opposed to the
double mutant that dissociates into monomers (g, h). The mutant also has a larger
frictional ratio (fr), suggesting its molecular shape has been altered considerably.
Nature Chemical Biology: doi:10.1038/nchembio.556

46
a
0 20 40 60 80 100 120 ml1 2 3 4 5 6 7 8 9 10 11 12 13 14 15 16 17 18 19 20 21 22 23 24 25 26 27 28 29 30 31 32 33 34 35 3637
Dbv29 WT
b
0 20 40 60 80 100 120 ml1 2 3 4 5 6 7 8 9 10 11 12 13 14 15 16 17 18 19 20 21 22 23 24 25 26 27 28 29 30 31 32 33 34 35 3637
Dbv29 Y165F
c 0 20 40 60 80 100 120 ml1 2 3 4 5 6 7 8 9 10 11 12 13 14 15 16 17 18 19 20 21 22 23 24 25 26 27 28 29 30 31 32 33 34 35 3637
Dbv29 Y473F
d
e f 0 20 40 60 80 100 120 ml
1 2 3 4 5 6 7 8 9 10 11 12 13 14 15 16 17 18 19 20 21 22 23 24 25 26 27 28 29 30 31 32 33 34 35 3637
Dbv29 Y165F/Y473F
Supplementary figure 8. Gel filtration analyses for wild-type and mutant Dbv29.
The wild-type enzyme (a), single mutations Y165F (b) and Y473F (c), and the double
mutant H91A/C151A (d) all display sharp and symmetric peaks. Mutations at the
interface (R41A/N44A) cause a destabilization of dimeric structure, yielding a
bimodal distribution (e). The broadened and distorted peak for the Y165F/Y473F
double mutant (f) suggests structural heterogeneity.
Nature Chemical Biology: doi:10.1038/nchembio.556

47
-8000
-6000
-4000
-2000
0
2000
4000
190 200 210 220 230 240
Wavelength (nm)
Mea
n R
esid
ue
Ell
ipti
city
WT
Y165F
Y473F
Y165F/Y473F
H91A/C151A
R41A/N44A
Helix
(%)
Strand
(%)
Turns
(%)
Unordered
(%)
WT 8 38 11 43
Y165F 9 36 11 43
Y473F 8 37 12 43
Y165F/Y473F 16 31 13 40
H91A/C151A 8 35 11 44
R41A/N44A 16 26 20 39
Supplementary figure 9. Circular dichroism (CD) analyses for Dbv29 and mutants.
CD spectra of WT and mutants (Y165F, Y473F, Y165F/Y473F, H91A/C151A and
R41A/N44A), in which Y165F/Y473F and R41A/N44A double-mutations are
somewhat deviated from others as shown in secondary structure distributions.
Nature Chemical Biology: doi:10.1038/nchembio.556
48
a
b
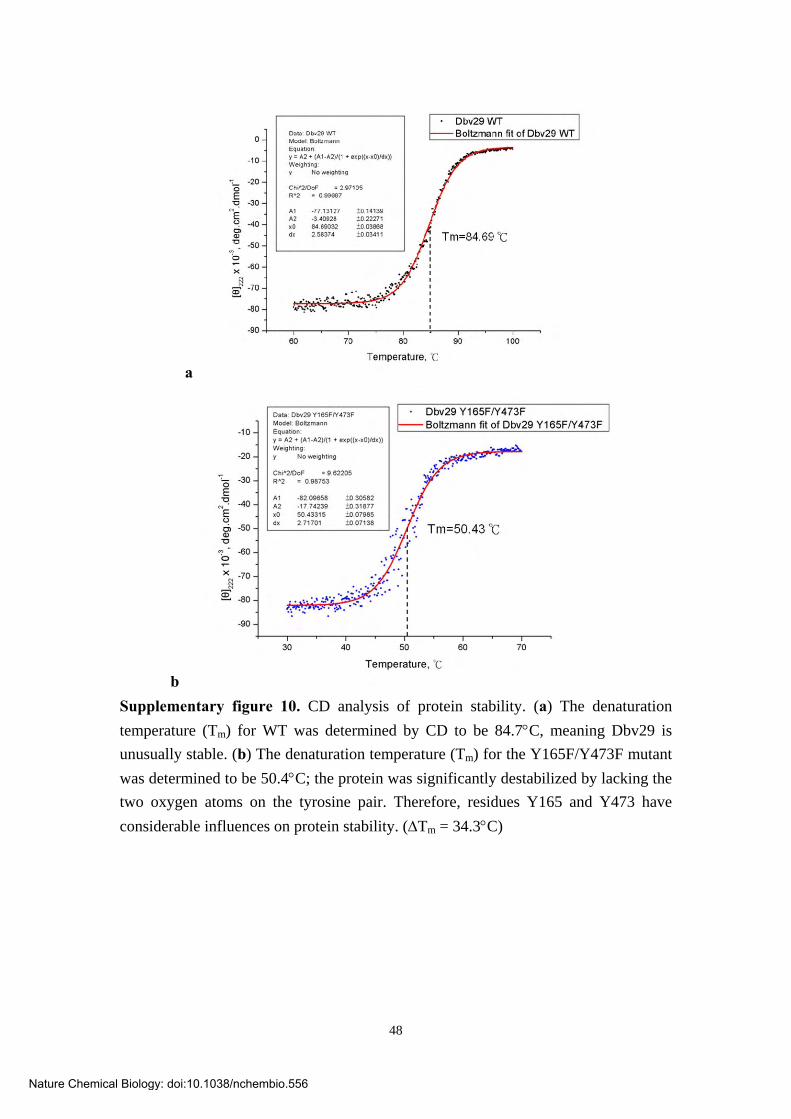
Supplementary figure 10. CD analysis of protein stability. (a) The denaturation
temperature (Tm) for WT was determined by CD to be 84.7C, meaning Dbv29 is
unusually stable. (b) The denaturation temperature (Tm) for the Y165F/Y473F mutant
was determined to be 50.4C; the protein was significantly destabilized by lacking the
two oxygen atoms on the tyrosine pair. Therefore, residues Y165 and Y473 have
considerable influences on protein stability. (Tm = 34.3C)
Nature Chemical Biology: doi:10.1038/nchembio.556
49
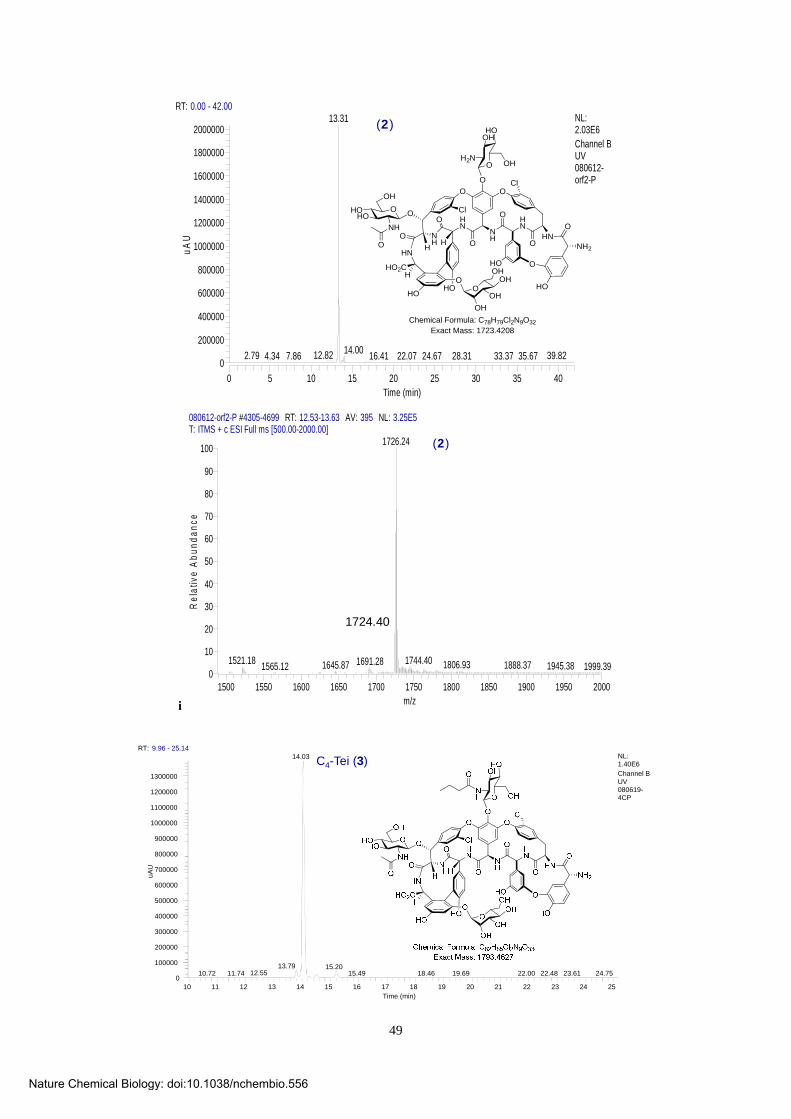
RT: 0.00 - 42.00
0 5 10 15 20 25 30 35 40Time (min)
0
200000
400000
600000
800000
1000000
1200000
1400000
1600000
1800000
2000000
uA
U
13.31
14.0012.822.79 39.8224.67 28.3122.0716.41 33.374.34 35.677.86
NL:2.03E6Channel B UV 080612-orf2-P
(2)
O
NH
HN
HN
HN
NH
ONH2
O
O
O
O O
O
H
HO
Cl
Cl
HHN
O
HO2CH
O
HO
O OH
OHHO
H2N
HO O
HO
O
OH
HOHO
NH
O
O
OH
OH
OHOH
O
Chemical Formula: C78H79Cl2N9O32
Exact Mass: 1723.4208
i
080612-orf2-P #4305-4699 RT: 12.53-13.63 AV: 395 NL: 3.25E5T: ITMS + c ESI Full ms [500.00-2000.00]
1500 1550 1600 1650 1700 1750 1800 1850 1900 1950 2000m/z
0
10
20
30
40
50
60
70
80
90
100
Rel
ativ
e A
bu
nd
an
ce
1726.24
1744.401521.18 1691.28 1806.931645.87 1888.37 1945.38 1999.391565.12
(2)
1724.40
RT: 9.96 - 25.14
10 11 12 13 14 15 16 17 18 19 20 21 22 23 24 25Time (min)
0
100000
200000
300000
400000
500000
600000
700000
800000
900000
1000000
1100000
1200000
1300000
uAU
14.03
13.79 15.2012.55 15.49 23.6122.00 24.7522.4811.7410.72 19.6918.46
NL:1.40E6Channel B UV 080619-4CP
C4-Tei (3)
Nature Chemical Biology: doi:10.1038/nchembio.556

50
ii
080619-4CP #4826-4894 RT: 14.05-14.23 AV: 69 NL: 2.08E6T: ITMS + c ESI Full ms [500.00-2000.00]
1740 1760 1780 1800 1820 1840 1860 1880 1900 1920 1940m/z
0
10
20
30
40
50
60
70
80
90
100
Rel
ativ
e A
bun
dan
ce
1795.53
1807.08 1822.051739.29 1841.13 1850.61 1877.151779.35 1896.36 1905.491756.20 1937.281926.29
C4-Tei (3)
1794.43
RT: 9.89 - 25.05
10 11 12 13 14 15 16 17 18 19 20 21 22 23 24 25Time (min)
0
200000
400000
600000
800000
1000000
1200000
1400000
1600000
1800000
2000000
uAU
15.44
15.19
15.8716.1514.7714.12 23.6212.69 21.9311.75 22.43 24.7517.4911.00 19.7118.46
NL:2.12E6Channel B UV 080619-6CP
C6-Tei (4)
iii
080619-6CP #5332-5413 RT: 15.49-15.71 AV: 82 NL: 6.19E6T: ITMS + c ESI Full ms [500.00-2000.00]
1740 1760 1780 1800 1820 1840 1860 1880 1900 1920 1940m/z
0
10
20
30
40
50
60
70
80
90
100
Rel
ativ
e A
bund
ance
1823.90
1837.441759.19 1860.55 1878.94 1933.121910.111772.64 1819.60 1889.421804.961783.49
C6-Tei (4)
1822.30
Nature Chemical Biology: doi:10.1038/nchembio.556

51
RT: 9.89 - 25.04
10 11 12 13 14 15 16 17 18 19 20 21 22 23 24 25Time (min)
0
50000
100000
150000
200000
250000
300000
350000
400000
450000
500000
550000
600000
650000
700000
uA
U17.10
15.19 17.4816.73 21.85 23.6114.23 18.81 24.7612.69 22.5710.83 11.73 19.61
NL:7.47E5Channel B UV 080619-8CP
C8-Tei (5)
iv
080619-8CP #5869-5954 RT: 17.10-17.33 AV: 86 NL: 2.35E6T: ITMS + c ESI Full ms [500.00-2000.00]
1740 1760 1780 1800 1820 1840 1860 1880 1900 1920 1940m/z
0
10
20
30
40
50
60
70
80
90
100
Rel
ativ
e A
bund
ance
1852.15
1756.83 1862.23 1874.59 1890.491780.22 1933.861907.48 1919.271834.191789.94 1811.90
C8-Tei (5)
1850.07
RT: 9.93 - 25.06
10 11 12 13 14 15 16 17 18 19 20 21 22 23 24 25Time (min)
0
50000
100000
150000
200000
250000
300000
350000
400000
450000
500000
550000
uA
U
18.79
19.1315.19 18.45 21.79 23.6122.2114.23 24.7412.69 17.6815.31 19.4110.83 11.25
NL:5.88E5Channel B UV 080619-10cp
C10-Tei (6)
Nature Chemical Biology: doi:10.1038/nchembio.556

52
v
080619-10cp #6473-6530 RT: 18.85-19.00 AV: 58 NL: 2.82E6T: ITMS + c ESI Full ms [500.00-2000.00]
1740 1760 1780 1800 1820 1840 1860 1880 1900 1920 1940m/z
0
10
20
30
40
50
60
70
80
90
100
Rel
ativ
e A
bun
danc
e
1880.26
1775.53 1888.62 1907.971802.08 1918.65 1936.101811.981740.95 1863.031787.41 1827.75 1839.781754.97
C10-Tei (6)
1878.36
RT: 0.00 - 50.00
0 5 10 15 20 25 30 35 40 45Time (min)
0
10
20
30
40
50
60
70
80
90
100
Re
lativ
e A
bu
nd
ance
17.50
20.7716.82 37.4721.6716.14 34.7313.30 29.655.01
NL:3.46E6Base Peak m/z= 1199.50-1200.50 MS 090327-teicohydrolysis-test3
aglycone (7)
vi
090327-teicohydrolysis-test3 #5333-5540 RT: 17.01-17.64 AV: 208 NL: 1.60E6T: ITMS + c ESI Full ms [200.00-2000.00]
200 400 600 800 1000 1200 1400 1600 1800 2000m/z
0
10
20
30
40
50
60
70
80
90
100
Re
lativ
e A
bun
dan
ce
1200.05
1798.47608.83 1999.441360.001181.07 1599.00789.55533.12303.19 877.60
aglycone (7)
1198.20
Nature Chemical Biology: doi:10.1038/nchembio.556

53
RT: 16.98 - 23.06
17.0 17.5 18.0 18.5 19.0 19.5 20.0 20.5 21.0 21.5 22.0 22.5 23.0Time (min)
0
50000
100000
150000
200000
250000
300000
350000
400000
450000
500000
550000
uA
U20.23
20.62
20.0419.85 23.0222.4722.2921.15 21.6919.4917.22 19.0517.75 18.7718.23
NL:5.56E5Channel B UV 090714-tei+dbv29+dmso+butylamine
12
090714-tei+dbv29+dmso+nacnbh3+butylamine #3554-3569 RT: 20.81-20.93 AV: 8 SB: 179 21.12-23.08 , 19.55-20.64 NL: 4.15E4
F: ITMS + c ESI Full ms [100.00-2000.00]
1920 1930 1940 1950 1960 1970 1980 1990 2000
m/z
0
10
20
30
40
50
60
70
80
90
100
Re
lativ
e A
bun
dan
ce
1949.41
1948.38
1971.771950.44
1970.83
1972.721947.311969.80
1951.43
1973.721961.35
1952.44
1962.23 1990.091980.131944.61
1957.681939.811922.73 1963.68 1992.261932.62
1933.721923.60
1937.49
(1947 + Na)
vii
090714-tei+dbv29+dmso+butylamine #3557-3575 RT: 20.84-20.98 AV: 9 SB: 178 21.12-23.07 , 19.55-20.64 NL: 9.78E3F: ITMS + c ESI Full ms [100.00-2000.00]
260 280 300 320 340 360 380 400 420 440 460 480 500 520 540m/z
0
10
20
30
40
50
60
70
80
90
100
Re
lativ
e A
bun
da
nce
385.33
367.38
321.36 459.55407.40248.31 475.53265.26 515.91349.38282.50 425.75 539.40488.07
Nature Chemical Biology: doi:10.1038/nchembio.556

54
RT: 14.96 ‐ 25.08 SM: 15B
15 16 17 18 19 20 21 22 23 24 25
Time (min)
0
10
20
30
40
50
60
70
80
90
100
Relative Abundance
20.83
19.71
19.70
19.77
20.97
20.11
21.11 24.2523.0623.8919.30 22.81 24.6121.24
19.21 22.7821.5416.57 18.4115.98 16.70 17.8315.16
090707‐Tei+Dbv29+DMSO+NaCNBH3+anline
13
090707-tei+dbv29+dmso+nacnbh3+anline #6635-6683 RT: 20.96-21.12 AV: 49 NL: 1.28E4T: ITMS + c ESI Full ms [200.00-2000.00]
1900 1910 1920 1930 1940 1950 1960 1970 1980 1990 2000m/z
0
10
20
30
40
50
60
70
80
90
100
Rel
ativ
e A
bun
dan
ce
1969.23
1967.151991.68
1970.22
1992.68
1989.611971.23
1993.71
1972.31
1994.731980.67
1999.511973.321954.371908.451984.861894.24 1909.47
1950.20 1955.401919.451895.36 1938.311931.84
13
(1967 + Na)
viii
090707-tei+dbv29+dmso+nacnbh3+anline #6635-6683 RT: 20.96-21.12 AV: 49 NL: 6.86E3T: ITMS + c ESI Full ms [200.00-2000.00]
260 280 300 320 340 360 380 400 420 440 460 480 500 520 540m/z
0
10
20
30
40
50
60
70
80
90
100
Rel
ativ
e A
bu
nda
nce
405.29
373.35
387.32
316.31
330.27298.31 528.39447.14341.34 431.12369.35287.33266.31 543.10465.05 488.79 509.10
Nature Chemical Biology: doi:10.1038/nchembio.556

55
RT: 16.97 - 23.01
17.0 17.5 18.0 18.5 19.0 19.5 20.0 20.5 21.0 21.5 22.0 22.5 23.0Time (min)
0
5000
10000
15000
20000
25000
30000
35000
40000
45000
50000
55000
60000
65000
70000
75000
80000u
AU
19.84
20.21
20.75
18.9721.73 22.14 22.7121.0119.65
17.33 18.8118.39
NL:8.29E4Channel B UV 090511-tei+dbv29+dmso+nacnbh3+octyalmine-10mm-025mm
14
090612-Tei+Dbv29+DMSO+NaCNBH3+octylamine-10mM-ms #3566-3589 RT: 20.88-21.05 AV: 12 SB: 235 18.65-20.73 , 21.55-23.48 NL: 2.85E5F: ITMS + c ESI Full ms [100.00-2000.00]
1920 1930 1940 1950 1960 1970 1980 1990 2000m/z
0
10
20
30
40
50
60
70
80
90
100
Rel
ativ
e A
bun
dan
ce
1991.60
1990.591992.59
1989.55
1993.58
1994.56
1999.53
1976.061966.331954.271936.07 1947.07 1962.22 1984.081924.92 1929.87
14
ix
090612-Tei+Dbv29+DMSO+NaCNBH3+octylamine-10mM-ms #3567-3596 RT: 20.88-21.11 AV: 15 SB: 235 18.65-20.73 , 21.55-23.48 NL: 7.63E3F: ITMS + c ESI Full ms2 [email protected] [50.00-2000.00]
260 280 300 320 340 360 380 400 420 440 460 480 500 520 540m/z
0
10
20
30
40
50
60
70
80
90
100
Re
lativ
e A
bun
danc
e
409.39
427.31
391.41255.22 381.54337.45268.26 349.45293.25 312.28 443.08 470.43
Nature Chemical Biology: doi:10.1038/nchembio.556

56
RT: 14.94 ‐ 25.05 SM: 7G
15 16 17 18 19 20 21 22 23 24 25
Time (min)
0
10
20
30
40
50
60
70
80
90
100
Relative Abundance
23.48
23.69 24.9819.70
19.80
22.57 24.5021.9421.0920.3118.19 19.5218.0716.4116.22
090707‐Tei+Dbv29+DMSO+NaCNBH3+dodecylamine
15
090707-tei+dbv29+dmso+nacnbh3+dodecylamine #2777-2797 RT: 23.46-23.81 AV: 21 SB: 77 22.64-23.34 , 24.07-24.68 NL: 4.45E3T: ITMS + c ESI Full ms [200.00-2500.00]
2000 2010 2020 2030 2040 2050 2060 2070 2080 2090m/z
0
10
20
30
40
50
60
70
80
90
100
Re
lativ
e A
bun
danc
e
2047.11
2046.082048.13
2045.08
2070.08
2049.07
2068.41 2084.022050.16
2082.752071.022059.48 2088.512007.73 2058.192032.24 2080.50
2013.73 2052.962001.41 2075.012063.482018.64 2024.89 2036.45
15
x
090707-tei+dbv29+dmso+nacnbh3+dodecylamine #7523-7581 RT: 23.82-24.00 AV: 59 NL: 2.10E4T: ITMS + c ESI Full ms [200.00-2000.00]
260 280 300 320 340 360 380 400 420 440 460 480 500 520 540m/z
0
10
20
30
40
50
60
70
80
90
100
Re
lativ
e A
bun
da
nce
465.50
483.38
528.29
447.39266.23 316.18293.33 415.25395.37 431.10 545.31348.16 487.67364.25 505.18
O
OHHO
NH
O
NH
Chemical Formula: C28H55N2O4•
Exact Mass: 483.42
Nature Chemical Biology: doi:10.1038/nchembio.556

57
Time (min)
0
6 8 10 12 14 16 18 20 22 24 26
500000
uAU
14.03
14.56
13.77
16
xi
080619-4CP+Dbv29 #4933-5092 RT: 14.33-14.77 AV: 160 NL: 3.15E5T: ITMS + c ESI Full ms [500.00-2000.00]
1700 1750 1800 1850 1900m/z
20
40
60
80
100
Re
lativ
e A
bu
nd
an
ce
1810.26
1796.221830.28
1848.401688.12 1876.48 1911.251708.16 1729.07 1786.581759.48
1808.25
16
0
6 8 10 12 14 16 18 20 22 24 26Time (min)
1000000
uA
U
16.10
15.22 17
Nature Chemical Biology: doi:10.1038/nchembio.556

58
xii
080619-6cp+dbv29 #5461-5655 RT: 15.83-16.35 AV: 195 NL: 3.16E6T: ITMS + c ESI Full ms [500.00-2000.00]
1700 1750 1800 1850 1900m/z
20
40
60
80
100
Re
lativ
e A
bu
nd
an
ce
1837.88
1701.47 1851.511736.85 1823.32 1876.51 1920.061770.66 1902.971804.40
1836.40
O
NH
HN
HN
HN
NH
O
NH2
O
O
O
O O
O
H
HO
Cl
Cl
HHN
O
HO2CH
O
HO
ONH
HO O
HO
O
OH
HOHO
NH
O
O
OH
OH
OH
OH
O
OHOH
O
OH
O
Chemical Formula: C84H87Cl2N9O34
Exact Mass: 1835.47
17
0
500000
uA
U
17.75
6 8 10 12 14 16 18 20 22 24 26Time (min)
18
xiii
080619-8cp+dbv29 #6008-6282 RT: 17.45-18.21 AV: 275 NL: 1.10E6T: ITMS + c ESI Full ms [500.00-2000.00]
1700 1750 1800 1850 1900m/z
20
40
60
80
100
Re
lativ
e A
bu
nd
an
ce
1866.29
1888.541715.44 1904.471765.62 1853.511830.371798.621702.15
1864.3918
Nature Chemical Biology: doi:10.1038/nchembio.556

59
6 8 10 12 14 16 18 20 22 24 26Time (min)
0
400000
uAU
19.40
19
xiv
080619-10cp+dbv29 #6554-6850 RT: 19.01-19.84 AV: 297 NL: 8.25E5T: ITMS + c ESI Full ms [500.00-2000.00]
1700 1750 1800 1850 1900m/z
20
40
60
80
100
Re
lativ
e A
bu
nda
nce
1894.38
1689.24 1916.551730.21 1792.96 1880.441858.381813.27 1827.561748.43
1892.2919
RT: 14.92 ‐ 25.08 SM: 5G
15 16 17 18 19 20 21 22 23 24 25
Time (min)
0
10
20
30
40
50
60
70
80
90
100
Relative Abundance
19.40
23.33
23.52 24.9117.62 23.0517.7816.60 22.8919.7816.8816.44 20.59 22.3018.6515.75
090721‐6C‐Tei+Dbv29+DMSO+NaCNBH3+hexylamine
20
Nature Chemical Biology: doi:10.1038/nchembio.556

60
090721-6C-Tei+Dbv29+DMSO+NaCNBH3+hexylamine #3103-3114 RT: 19.40-19.49 AV: 4 NL: 1.03E4F: ITMS + c ESI Full ms [100.00-2000.00]
1880 1890 1900 1910 1920 1930 1940 1950 1960m/z
0
10
20
30
40
50
60
70
80
90
100
Re
lativ
e A
bund
anc
e
1921.13
1920.04
1919.04 1922.26
1942.63
1943.67
1944.681941.13
1924.70
1906.85 1932.78 1945.671960.271904.87 1956.711930.83 1938.051887.76 1897.23 1913.56
1885.74
20
xv
090721-6C-Tei+Dbv29+DMSO+NaCNBH3+hexylamine #3100-3111 RT: 19.37-19.46 AV: 4 SB: 110 19.91-21.38 , 17.26-19.21 NL: 3.15E3F: ITMS + c ESI Full ms [100.00-2000.00]
260 280 300 320 340 360 380 400 420 440 460 480 500 520 540m/z
0
10
20
30
40
50
60
70
80
90
100
Rel
ativ
e A
bun
dan
ce
357.24321.22
339.39447.05335.82
532.96273.23315.72279.05 443.66367.09 519.42414.50 502.27471.71308.55 387.26355.20254.05 542.25433.13294.18
RT: 14.94 ‐ 25.11 SM: 5G
15 16 17 18 19 20 21 22 23 24 25
Time (min)
0
10
20
30
40
50
60
70
80
90
100
Relative Abundance
20.46
23.82
23.3923.2922.11
18.68 23.14 24.5118.37 18.83 22.4521.2119.6816.8416.53 17.0915.22
090721‐8C‐Tei+Dbv29+DMSO+NaCNBH3+hexylamine
21
Nature Chemical Biology: doi:10.1038/nchembio.556

61
090721-8C-Tei+Dbv29+DMSO+NaCNBH3+hexylamine #3197-3211 RT: 20.36-20.48 AV: 5 SB: 91 20.80-22.36 , 18.93-20.17 NL: 5.89E3F: ITMS + c ESI Full ms [100.00-2000.00]
1910 1920 1930 1940 1950 1960 1970 1980 1990m/z
0
10
20
30
40
50
60
70
80
90
100
Re
lativ
e A
bund
anc
e
1948.22
1949.16
1950.09
1969.71
1951.21
1972.621952.26 1982.74
1964.381933.66 1973.581911.59 1986.551938.74
1942.88 1989.651917.97 1974.591955.921925.56
21
1947.20
xvi
090721-8C-Tei+Dbv29+DMSO+NaCNBH3+hexylamine #3197-3211 RT: 20.36-20.48 AV: 5 SB: 91 20.80-22.36 , 18.93-20.17 NL: 2.69E3F: ITMS + c ESI Full ms [100.00-2000.00]
260 280 300 320 340 360 380 400 420 440 460 480 500 520 540m/z
0
10
20
30
40
50
60
70
80
90
100
Rel
ativ
e A
bun
dan
ce
385.37
442.83481.50 508.08
383.53 430.25334.91 522.17365.28254.59 465.92390.53305.27274.69 545.36406.85 500.63
RT: 14.90 ‐ 25.04 SM: 5G
15 16 17 18 19 20 21 22 23 24 25
Time (min)
0
10
20
30
40
50
60
70
80
90
100
Relative Abundance
22.21
19.28
24.3523.7322.7420.5319.6517.00 18.9616.66 17.9315.09 21.06 21.8315.81
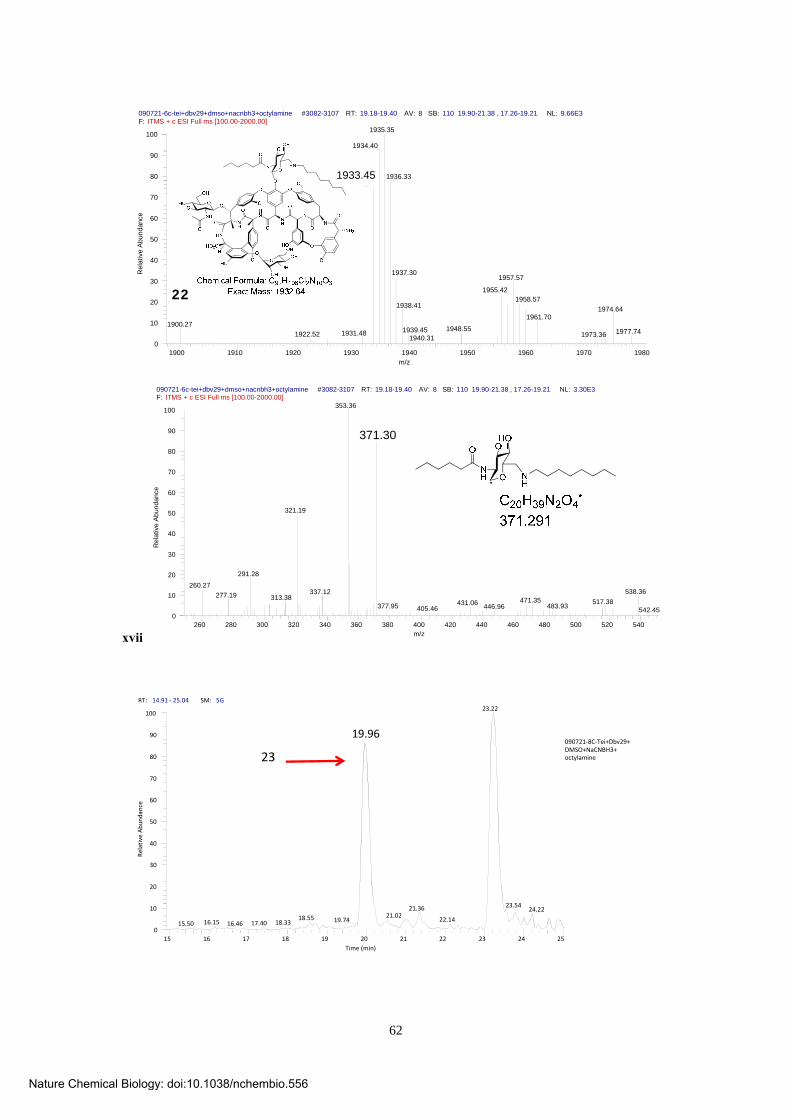
090721‐6C‐Tei+Dbv29+DMSO+NaCNBH3+octylamine22
Nature Chemical Biology: doi:10.1038/nchembio.556
62
090721-6c-tei+dbv29+dmso+nacnbh3+octylamine #3082-3107 RT: 19.18-19.40 AV: 8 SB: 110 19.90-21.38 , 17.26-19.21 NL: 9.66E3F: ITMS + c ESI Full ms [100.00-2000.00]
1900 1910 1920 1930 1940 1950 1960 1970 1980m/z
0
10
20
30
40
50
60
70
80
90
100R
elat
ive
Abu
ndan
ce1935.35
1934.40
1936.331933.45
1937.301957.57
1955.421958.57
1938.41 1974.641961.70
1900.271948.551939.45 1977.741931.481922.52 1973.361940.31
22
xvii
090721-6c-tei+dbv29+dmso+nacnbh3+octylamine #3082-3107 RT: 19.18-19.40 AV: 8 SB: 110 19.90-21.38 , 17.26-19.21 NL: 3.30E3F: ITMS + c ESI Full ms [100.00-2000.00]
260 280 300 320 340 360 380 400 420 440 460 480 500 520 540m/z
0
10
20
30
40
50
60
70
80
90
100
Re
lativ
e A
bun
dan
ce
353.36
371.30
321.19
291.28
260.27538.36337.12277.19 313.38 471.35 517.38431.06377.95 483.93446.96405.46 542.45
RT: 14.91 ‐ 25.04 SM: 5G
15 16 17 18 19 20 21 22 23 24 25
Time (min)
0
10
20
30
40
50
60
70
80
90
100
Relative Abundance
23.22
19.96
23.5421.36 24.2221.0218.55 22.1419.7416.15 18.3317.4015.50 16.46
090721‐8C‐Tei+Dbv29+DMSO+NaCNBH3+octylamine23
Nature Chemical Biology: doi:10.1038/nchembio.556

63
090721-8c-tei+dbv29+dmso+nacnbh3+octylamine #3148-3173 RT: 19.86-20.08 AV: 8 SB: 91 20.79-22.37 , 18.93-20.17 NL: 9.15E3F: ITMS + c ESI Full ms [100.00-2000.00]
1920 1930 1940 1950 1960 1970 1980 1990 2000m/z
0
10
20
30
40
50
60
70
80
90
100
Re
lativ
e A
bund
ance
1963.52
1962.44
1961.40
1964.46
1985.57
1965.37
1983.401986.58 1999.281946.66 1955.01 1966.34
1934.83 1987.531967.40 1993.861931.63 1973.69
1995.561957.68 1982.281935.77 1970.041924.03 1944.34
23
xviii
090723-8C-Tei+Dbv29+DMSO+NaCNBH3+octylamine #3150-3160 RT: 19.86-19.95 AV: 4 SB: 117 20.31-21.95 , 17.65-19.66 NL: 1.19E3F: ITMS + c ESI Full ms [100.00-2000.00]
260 280 300 320 340 360 380 400 420 440 460 480 500 520 540m/z
0
10
20
30
40
50
60
70
80
90
100
Rel
ativ
e A
bu
nd
an
ce
381.43
399.28
328.20
457.22
498.89418.83 463.98454.50 504.98 520.53253.87 275.35 298.56 431.02369.93345.29 483.29 540.86316.38
269.36
RT: 16.98 - 23.07
17.0 17.5 18.0 18.5 19.0 19.5 20.0 20.5 21.0 21.5 22.0 22.5 23.0Time (min)
0
20000
40000
60000
80000
100000
120000
140000
160000
180000
200000
220000
uA
U
19.85
20.22
19.30
21.1921.0320.68
22.9721.63 21.83 22.6119.1518.9617.29 18.4917.95
NL:2.33E5Channel B UV 090723-Tei+Dbv29+DMSO+NaCNBH3+benzylamine
24
Nature Chemical Biology: doi:10.1038/nchembio.556

64
090723-tei+dbv29+dmso+nacnbh3+benzylamine #6667-6673 RT: 21.01-21.03 AV: 7 SB: 641 21.27-22.60 , 20.10-20.79 NL: 1.35E4T: ITMS + c ESI Full ms [200.00-2000.00]
1920 1930 1940 1950 1960 1970 1980 1990 2000m/z
0
10
20
30
40
50
60
70
80
90
100
Re
lativ
e A
bund
anc
e
1983.14
1982.14
1981.141984.15
1985.07
1977.43 1986.11 1994.31
1932.741955.90
O
NH
HN
HN
HN
NH
O
NH2
O
O
O
O O
O
H
HO
Cl
Cl
HHN
O
HO2CH
O
HO
ONH
HO O
HO
O
OH
HOHO
NH
O
O
OH
OH
OH
OH
O
OHOH
O
HN
O
Chemical Formula: C95H102Cl2N10O33
Exact Mass: 1980.6024
xix
090723-tei+dbv29+dmso+nacnbh3+benzylamine #6645-6684 RT: 20.94-21.07 AV: 40 NL: 5.00E3T: ITMS + c ESI Full ms [200.00-2000.00]
260 280 300 320 340 360 380 400 420 440 460 480 500 520 540m/z
0
10
20
30
40
50
60
70
80
90
100
Rel
ativ
e A
bun
dan
ce
419.29
316.29
403.39
431.09387.38
528.34312.21
RT: 16.98 - 23.07
17.0 17.5 18.0 18.5 19.0 19.5 20.0 20.5 21.0 21.5 22.0 22.5 23.0Time (min)
0
20000
40000
60000
80000
100000
120000
140000
160000
180000
200000
220000
uA
U
19.85
20.22
19.30
21.1921.0320.68
22.9721.63 21.83 22.6119.1518.9617.29 18.4917.95
NL:2.33E5Channel B UV 090723-Tei+Dbv29+DMSO+NaCNBH3+benzylamine
25
Nature Chemical Biology: doi:10.1038/nchembio.556

65
090723-tei+dbv29+dmso+nacnbh3+benzylamine #6163-6200 RT: 19.43-19.54 AV: 38 NL: 2.36E5T: ITMS + c ESI Full ms [200.00-2000.00]
1920 1930 1940 1950 1960 1970 1980 1990 2000m/z
0
10
20
30
40
50
60
70
80
90
100R
ela
tive
Ab
un
da
nce
1969.32
1970.33
1968.40
1971.28
1967.33
1991.531982.041972.33
1992.5225
xx
090723-tei+dbv29+dmso+nacnbh3+benzylamine #6155-6237 RT: 19.40-19.65 AV: 83 NL: 5.28E4T: ITMS + c ESI Full ms [200.00-2000.00]
260 280 300 320 340 360 380 400 420 440 460 480 500 520 540m/z
0
10
20
30
40
50
60
70
80
90
100
Rel
ativ
e A
bun
dan
ce
387.34
405.23
419.42369.38
O
OHHO
NH
O
HN
C23H37N2O4•
405.275
RT: 14.96 ‐ 25.09 SM: 7G
15 16 17 18 19 20 21 22 23 24 25
Time (min)
0
10
20
30
40
50
60
70
80
90
100
Relative Abundance
19.99
22.9922.76 23.4521.14 24.9824.0119.15 22.0215.40 18.1817.8117.0215.72
091109‐Tei+Dbv29+DMSO+NaCNBH3+1‐Admantanemethylamine
26
Nature Chemical Biology: doi:10.1038/nchembio.556
66
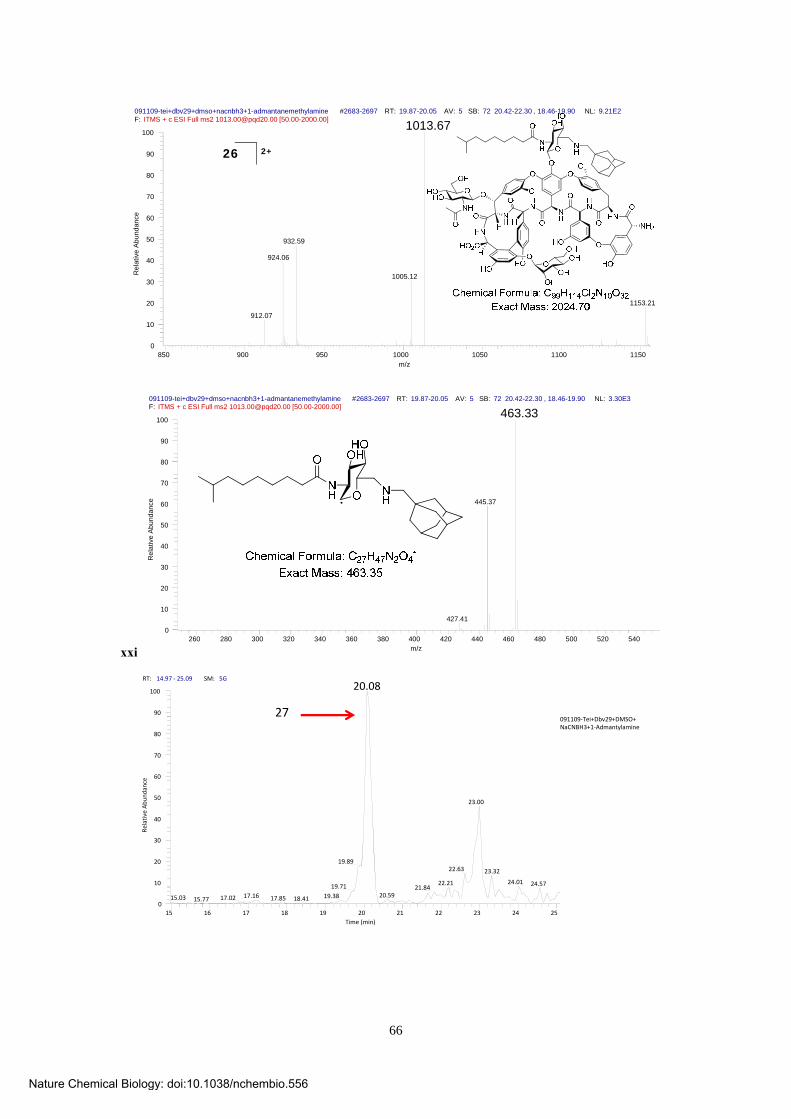
091109-tei+dbv29+dmso+nacnbh3+1-admantanemethylamine #2683-2697 RT: 19.87-20.05 AV: 5 SB: 72 20.42-22.30 , 18.46-19.90 NL: 9.21E2F: ITMS + c ESI Full ms2 [email protected] [50.00-2000.00]
850 900 950 1000 1050 1100 1150m/z
0
10
20
30
40
50
60
70
80
90
100R
ela
tive
Ab
un
da
nce
1013.67
932.59
924.06
1005.12
1153.21
912.07
26 2+
xxi
091109-tei+dbv29+dmso+nacnbh3+1-admantanemethylamine #2683-2697 RT: 19.87-20.05 AV: 5 SB: 72 20.42-22.30 , 18.46-19.90 NL: 3.30E3F: ITMS + c ESI Full ms2 [email protected] [50.00-2000.00]
260 280 300 320 340 360 380 400 420 440 460 480 500 520 540m/z
0
10
20
30
40
50
60
70
80
90
100
Re
lativ
e A
bund
anc
e
463.33
445.37
427.41
RT: 14.97 ‐ 25.09 SM: 5G
15 16 17 18 19 20 21 22 23 24 25
Time (min)
0
10
20
30
40
50
60
70
80
90
100
Relative Abundance
20.08
23.00
19.8922.63 23.32
24.0122.21 24.5719.71 21.8420.5917.16 19.3815.03 17.02 17.85 18.4115.77
091109‐Tei+Dbv29+DMSO+NaCNBH3+1‐Admantylamine
27
Nature Chemical Biology: doi:10.1038/nchembio.556

67
091109-tei+dbv29+dmso+nacnbh3+1-admantylamine #2694-2699 RT: 20.05-20.10 AV: 2 NL: 3.88E2F: ITMS + c ESI Full ms2 [email protected] [50.00-2000.00]
850 900 950 1000 1050 1100 1150m/z
0
10
20
30
40
50
60
70
80
90
100R
ela
tive
Ab
un
da
nce
1006.56
925.51
997.90
1153.29
1125.34
27
27 2+
xxii
091109-tei+dbv29+dmso+nacnbh3+1-admantylamine #2693-2704 RT: 20.05-20.19 AV: 4 NL: 8.83E2F: ITMS + c ESI Full ms2 [email protected] [50.00-2000.00]
260 280 300 320 340 360 380 400 420 440 460 480 500 520 540m/z
0
10
20
30
40
50
60
70
80
90
100
Rel
ativ
e A
bu
nda
nce
449.35
431.41
RT: 14.96 ‐ 25.09 SM: 5G
15 16 17 18 19 20 21 22 23 24 25
Time (min)
0
10
20
30
40
50
60
70
80
90
100
Relative Abundance
19.99
23.5022.81 23.69 24.7022.6221.6519.34 20.5915.07 17.3915.77 18.2316.88
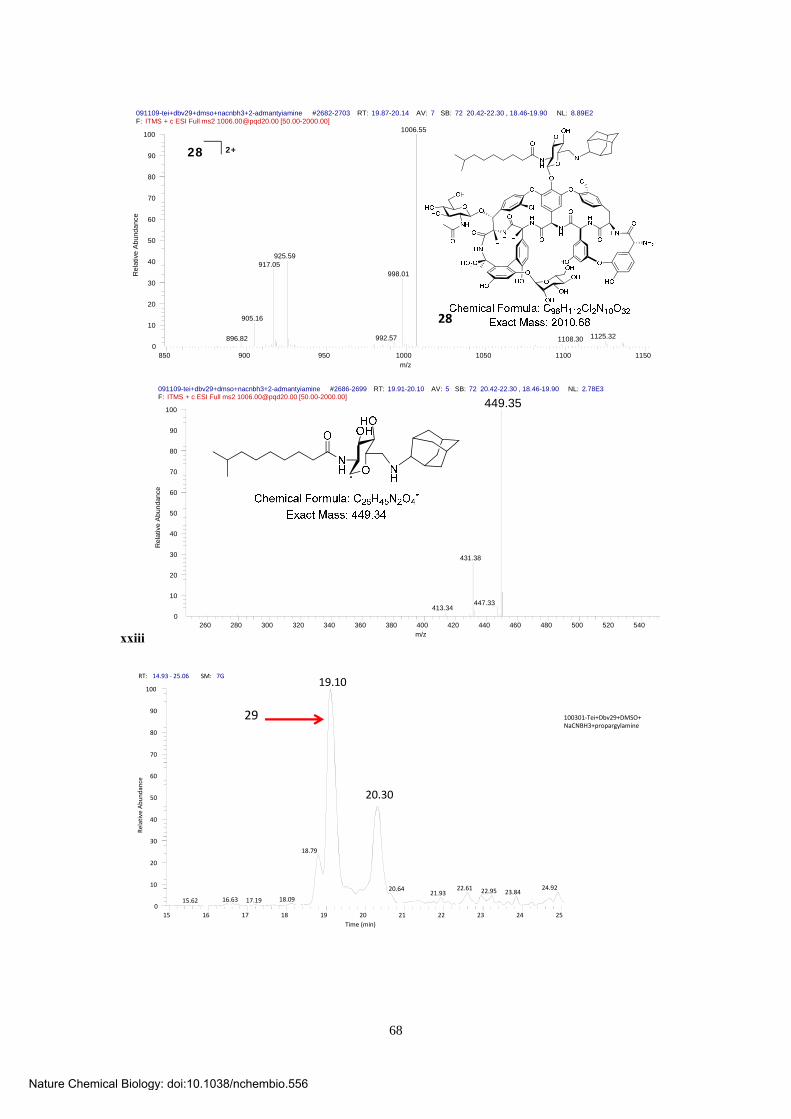
091109‐Tei+Dbv29+DMSO+NaCNBH3+2‐Admantyiamine
28
Nature Chemical Biology: doi:10.1038/nchembio.556
68
091109-tei+dbv29+dmso+nacnbh3+2-admantyiamine #2682-2703 RT: 19.87-20.14 AV: 7 SB: 72 20.42-22.30 , 18.46-19.90 NL: 8.89E2F: ITMS + c ESI Full ms2 [email protected] [50.00-2000.00]
850 900 950 1000 1050 1100 1150m/z
0
10
20
30
40
50
60
70
80
90
100R
ela
tive
Ab
un
da
nce
1006.55
925.59917.05
998.01
905.16
1125.32992.57896.82 1108.30
28 2+
28
xxiii
091109-tei+dbv29+dmso+nacnbh3+2-admantyiamine #2686-2699 RT: 19.91-20.10 AV: 5 SB: 72 20.42-22.30 , 18.46-19.90 NL: 2.78E3F: ITMS + c ESI Full ms2 [email protected] [50.00-2000.00]
260 280 300 320 340 360 380 400 420 440 460 480 500 520 540m/z
0
10
20
30
40
50
60
70
80
90
100
Re
lativ
e A
bu
nda
nce
449.35
431.38
447.33413.34
RT: 14.93 ‐ 25.06 SM: 7G
15 16 17 18 19 20 21 22 23 24 25
Time (min)
0
10
20
30
40
50
60
70
80
90
100
Relative Abundance
19.10
20.30
18.79
24.9222.6120.64 22.95 23.8421.9318.0916.63 17.1915.62
100301‐Tei+Dbv29+DMSO+NaCNBH3+propargylamine
29
Nature Chemical Biology: doi:10.1038/nchembio.556

69
100301-tei+dbv29+dmso+nacnbh3+propargylamine #3200-3210 RT: 20.21-20.27 AV: 3 SB: 121 20.73-22.97 , 18.50-19.98 NL: 1.54E5F: ITMS + c ESI Full ms [100.00-2000.00]
1800 1820 1840 1860 1880 1900 1920 1940 1960 1980 2000m/z
0
10
20
30
40
50
60
70
80
90
100R
ela
tive
Ab
un
da
nce
1931.29
1894.35
1892.40
1914.18
1942.171905.901924.01
1887.08
1929.30
xxiv
100301-tei+dbv29+dmso+nacnbh3+propargylamine #3198-3207 RT: 20.18-20.24 AV: 3 SB: 121 20.73-22.97 , 18.50-19.98 NL: 5.87E3F: ITMS + c ESI Full ms [100.00-2000.00]
260 280 300 320 340 360 380 400 420 440 460 480 500 520 540m/z
0
10
20
30
40
50
60
70
80
90
100
Rel
ativ
e A
bu
nda
nce
367.29
316.30 330.26
389.42 431.44
RT: 14.93 ‐ 25.06 SM: 7G
15 16 17 18 19 20 21 22 23 24 25
Time (min)
0
10
20
30
40
50
60
70
80
90
100
Relative Abundance
19.10
20.30
18.79
24.9222.6120.64 22.95 23.8421.9318.0916.63 17.1915.62
100301‐Tei+Dbv29+DMSO+NaCNBH3+propargylamine
30
Nature Chemical Biology: doi:10.1038/nchembio.556

70
100301-tei+dbv29+dmso+nacnbh3+propargylamine #3092-3100 RT: 19.10-19.16 AV: 3 NL: 2.82E5F: ITMS + c ESI Full ms [100.00-2000.00]
1840 1860 1880 1900 1920 1940 1960 1980 2000m/z
0
10
20
30
40
50
60
70
80
90
100R
ela
tive
Ab
unda
nce
1917.42
1928.251938.641899.861892.251864.32
1915.42
xxv
100301-tei+dbv29+dmso+nacnbh3+propargylamine #3076-3112 RT: 18.92-19.29 AV: 13 NL: 3.08E4F: ITMS + c ESI Full ms [100.00-2000.00]
260 280 300 320 340 360 380 400 420 440 460 480 500 520 540m/z
0
10
20
30
40
50
60
70
80
90
100
Rel
ativ
e A
bu
ndan
ce
335.35
353.19
O HN
OHHO
NH
O
Chemical Formula: C19H33N2O4•
Exact Mass: 353.24
RT: 14.95 ‐ 25.04 SM: 7G
15 16 17 18 19 20 21 22 23 24 25
Time (min)
0
10
20
30
40
50
60
70
80
90
100
Relative Abundance
19.54
21.7923.9922.25 22.43 24.41
20.6918.6216.51 18.3015.22 17.0115.86
100301‐Tei+Dbv29+DMSO+NaCNBH3+azidepentylamine
31
Nature Chemical Biology: doi:10.1038/nchembio.556
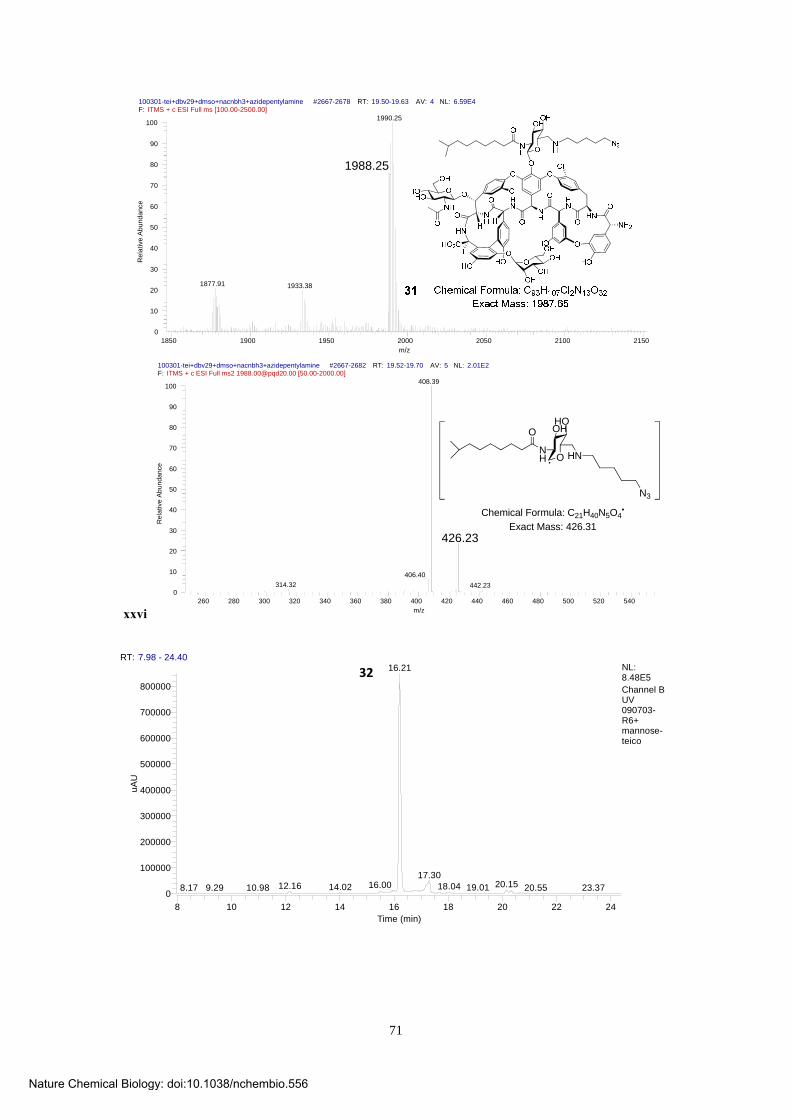
71
100301-tei+dbv29+dmso+nacnbh3+azidepentylamine #2667-2678 RT: 19.50-19.63 AV: 4 NL: 6.59E4F: ITMS + c ESI Full ms [100.00-2500.00]
1850 1900 1950 2000 2050 2100 2150m/z
0
10
20
30
40
50
60
70
80
90
100
Re
lativ
e A
bund
ance
1990.25
1877.91 1933.38
1988.25
xxvi
100301-tei+dbv29+dmso+nacnbh3+azidepentylamine #2667-2682 RT: 19.52-19.70 AV: 5 NL: 2.01E2F: ITMS + c ESI Full ms2 [email protected] [50.00-2000.00]
260 280 300 320 340 360 380 400 420 440 460 480 500 520 540m/z
0
10
20
30
40
50
60
70
80
90
100
Re
lativ
e A
bun
dan
ce
408.39
426.23
406.40
314.32 442.23
O HN
OHHO
NH
O
N3
Chemical Formula: C21H40N5O4•
Exact Mass: 426.31
RT: 7.98 - 24.40
8 10 12 14 16 18 20 22 24Time (min)
0
100000
200000
300000
400000
500000
600000
700000
800000
uA
U
16.21
17.3020.1516.0012.16 18.0414.02 19.0110.98 20.558.17 9.29 23.37
NL:8.48E5Channel B UV 090703-R6+mannose-teico
32
Nature Chemical Biology: doi:10.1038/nchembio.556
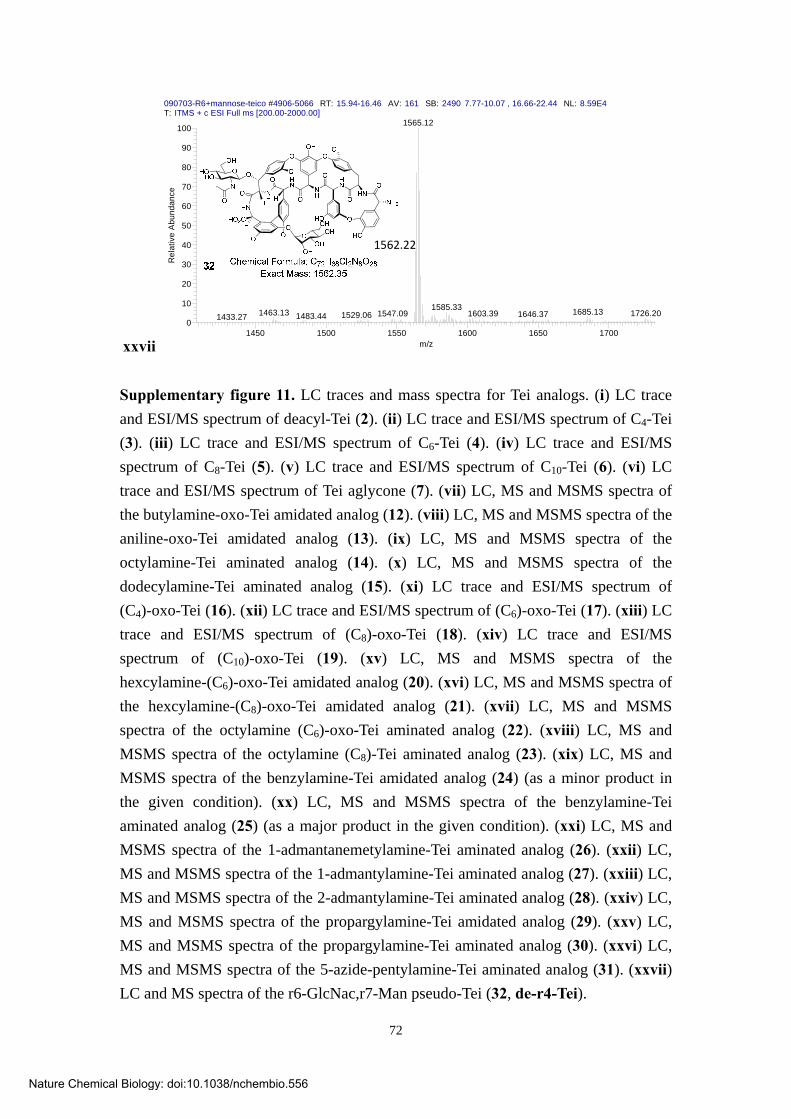
72
xxvii
090703-R6+mannose-teico #4906-5066 RT: 15.94-16.46 AV: 161 SB: 2490 7.77-10.07 , 16.66-22.44 NL: 8.59E4T: ITMS + c ESI Full ms [200.00-2000.00]
1450 1500 1550 1600 1650 1700m/z
0
10
20
30
40
50
60
70
80
90
100
Re
lativ
e A
bu
nd
an
ce
1565.12
1585.331685.131463.13 1726.201603.391547.09 1646.371529.061483.441433.27
1562.22
Supplementary figure 11. LC traces and mass spectra for Tei analogs. (i) LC trace
and ESI/MS spectrum of deacyl-Tei (2). (ii) LC trace and ESI/MS spectrum of C4-Tei
(3). (iii) LC trace and ESI/MS spectrum of C6-Tei (4). (iv) LC trace and ESI/MS
spectrum of C8-Tei (5). (v) LC trace and ESI/MS spectrum of C10-Tei (6). (vi) LC
trace and ESI/MS spectrum of Tei aglycone (7). (vii) LC, MS and MSMS spectra of
the butylamine-oxo-Tei amidated analog (12). (viii) LC, MS and MSMS spectra of the
aniline-oxo-Tei amidated analog (13). (ix) LC, MS and MSMS spectra of the
octylamine-Tei aminated analog (14). (x) LC, MS and MSMS spectra of the
dodecylamine-Tei aminated analog (15). (xi) LC trace and ESI/MS spectrum of
(C4)-oxo-Tei (16). (xii) LC trace and ESI/MS spectrum of (C6)-oxo-Tei (17). (xiii) LC
trace and ESI/MS spectrum of (C8)-oxo-Tei (18). (xiv) LC trace and ESI/MS
spectrum of (C10)-oxo-Tei (19). (xv) LC, MS and MSMS spectra of the
hexcylamine-(C6)-oxo-Tei amidated analog (20). (xvi) LC, MS and MSMS spectra of
the hexcylamine-(C8)-oxo-Tei amidated analog (21). (xvii) LC, MS and MSMS
spectra of the octylamine (C6)-oxo-Tei aminated analog (22). (xviii) LC, MS and
MSMS spectra of the octylamine (C8)-Tei aminated analog (23). (xix) LC, MS and
MSMS spectra of the benzylamine-Tei amidated analog (24) (as a minor product in
the given condition). (xx) LC, MS and MSMS spectra of the benzylamine-Tei
aminated analog (25) (as a major product in the given condition). (xxi) LC, MS and
MSMS spectra of the 1-admantanemetylamine-Tei aminated analog (26). (xxii) LC,
MS and MSMS spectra of the 1-admantylamine-Tei aminated analog (27). (xxiii) LC,
MS and MSMS spectra of the 2-admantylamine-Tei aminated analog (28). (xxiv) LC,
MS and MSMS spectra of the propargylamine-Tei amidated analog (29). (xxv) LC,
MS and MSMS spectra of the propargylamine-Tei aminated analog (30). (xxvi) LC,
MS and MSMS spectra of the 5-azide-pentylamine-Tei aminated analog (31). (xxvii)
LC and MS spectra of the r6-GlcNac,r7-Man pseudo-Tei (32, de-r4-Tei).
Nature Chemical Biology: doi:10.1038/nchembio.556
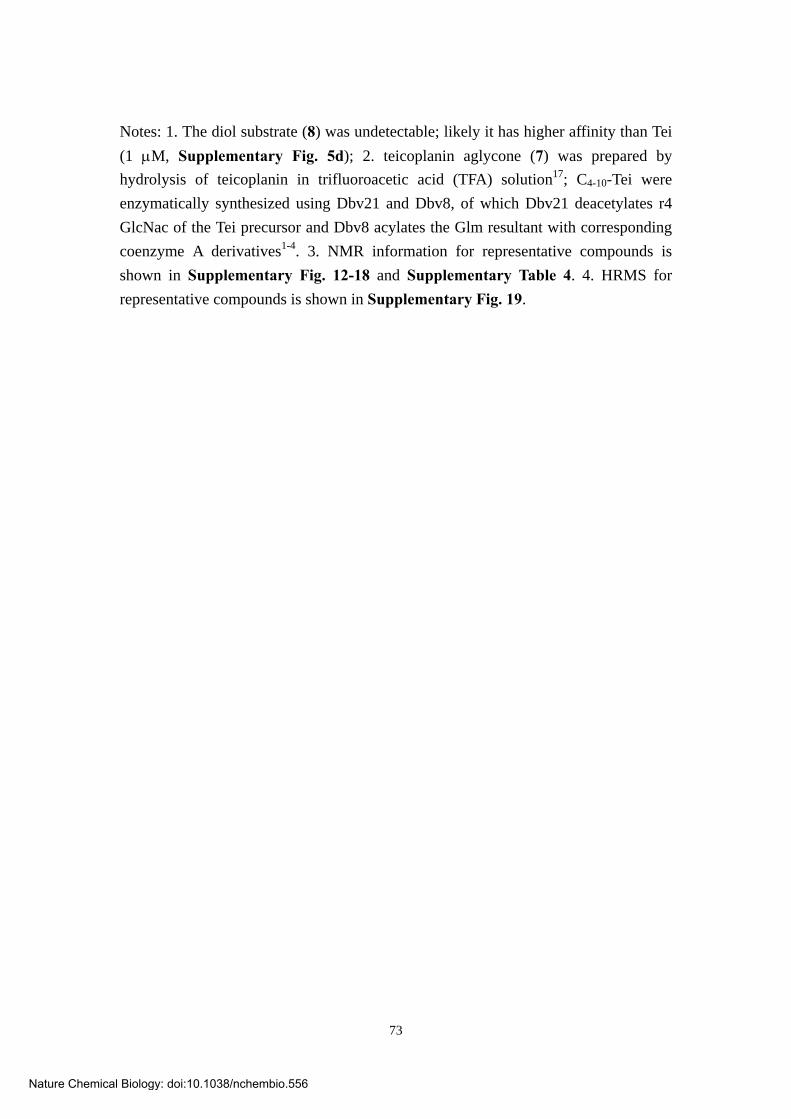
73
Notes: 1. The diol substrate (8) was undetectable; likely it has higher affinity than Tei
(1 M, Supplementary Fig. 5d); 2. teicoplanin aglycone (7) was prepared by
hydrolysis of teicoplanin in trifluoroacetic acid (TFA) solution17; C4-10-Tei were
enzymatically synthesized using Dbv21 and Dbv8, of which Dbv21 deacetylates r4
GlcNac of the Tei precursor and Dbv8 acylates the Glm resultant with corresponding
coenzyme A derivatives1-4. 3. NMR information for representative compounds is
shown in Supplementary Fig. 12-18 and Supplementary Table 4. 4. HRMS for
representative compounds is shown in Supplementary Fig. 19.
Nature Chemical Biology: doi:10.1038/nchembio.556
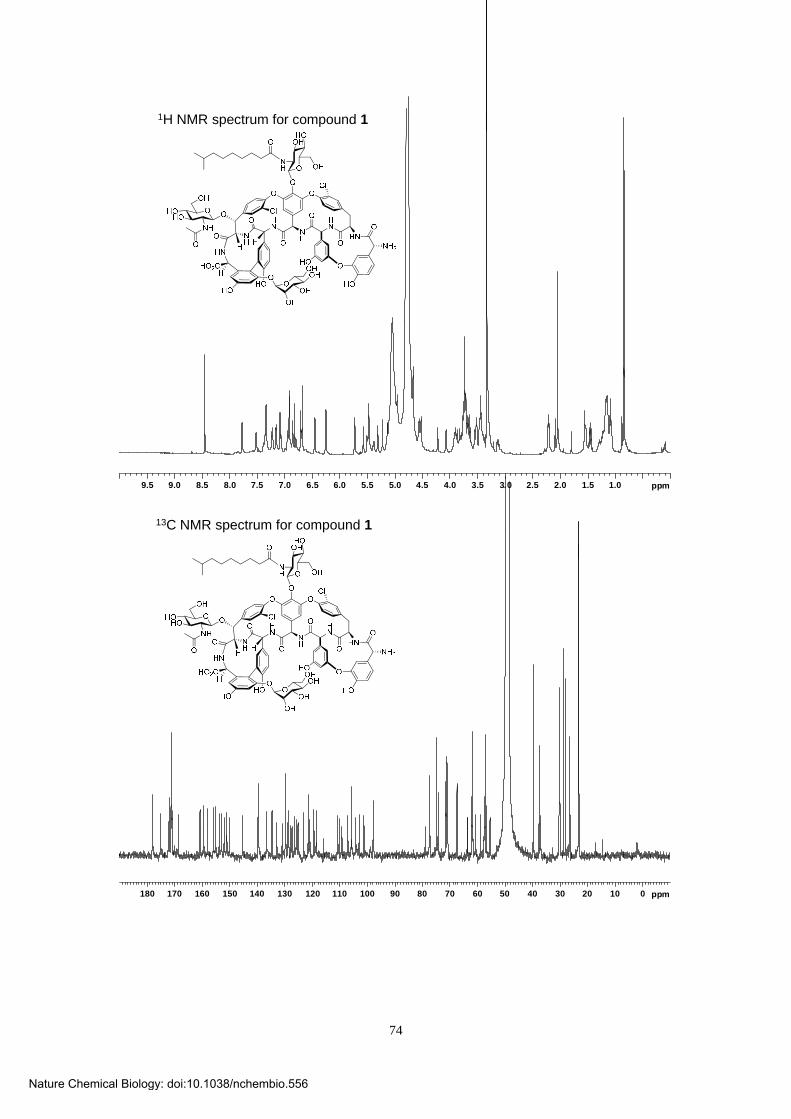
74
9.5 9.0 8.5 8.0 7.5 7.0 6.5 6.0 5.5 5.0 4.5 4.0 3.5 3.0 2.5 2.0 1.5 1.0 ppm
1H NMR spectrum for compound 1
180 170 160 150 140 130 120 110 100 90 80 70 60 50 40 30 20 10 0 ppm
13C NMR spectrum for compound 1
Nature Chemical Biology: doi:10.1038/nchembio.556

75
ppm
9 8 7 6 5 4 3 2 1 ppm
160
140
120
100
80
60
40
20
0
1H-13C HSQC spectrum for compound 1
ppm
11 10 9 8 7 6 5 4 3 2 1 ppm
180
160
140
120
100
80
60
40
20
1H-13C HMBC spectrum for compound 1
Supplementary figure 12. NMR information for compound 1. NMR spectra include 1H, 13C, HSQC, and HMBC.
Nature Chemical Biology: doi:10.1038/nchembio.556
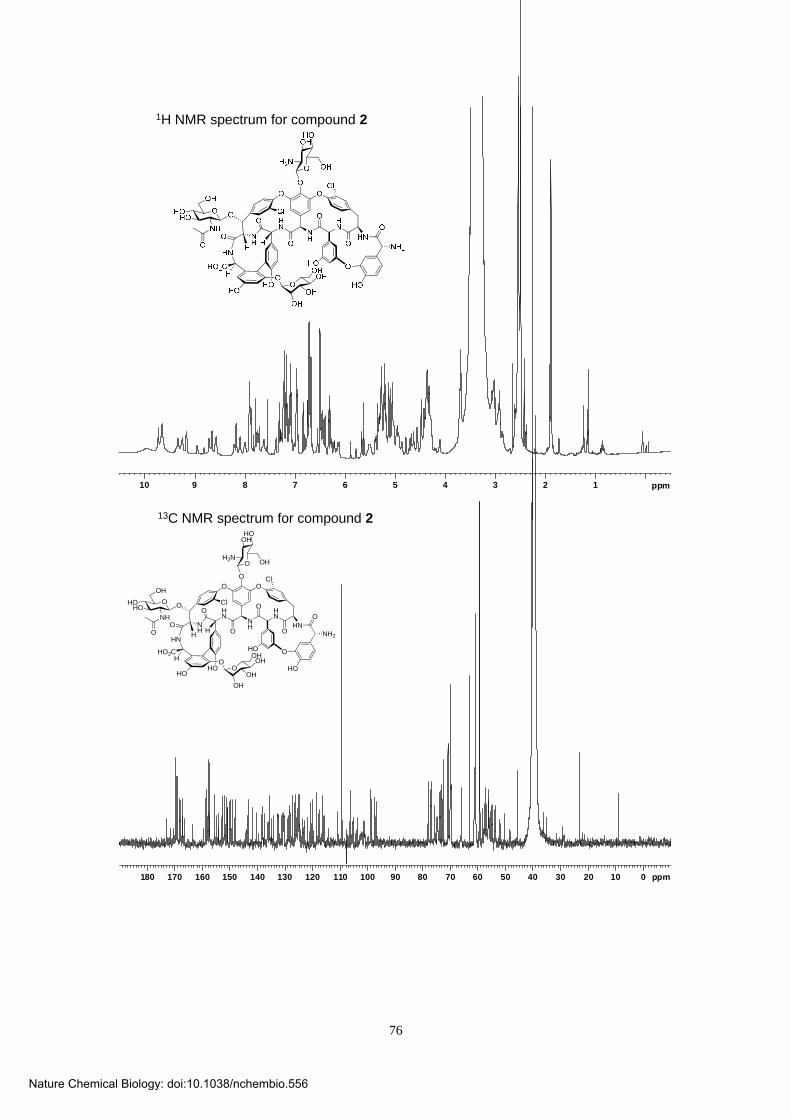
76
10 9 8 7 6 5 4 3 2 1 ppm
1H NMR spectrum for compound 2
180 170 160 150 140 130 120 110 100 90 80 70 60 50 40 30 20 10 0 ppm
13C NMR spectrum for compound 2
O
NH
HN
HN
HN
NH
ONH2
O
O
O
O O
O
H
HO
Cl
Cl
HHN
O
HO2CH
O
HO
O OH
OHHO
H2N
HO O
HO
O
OH
HOHO
NH
O
O
OH
OH
OHOH
O
Nature Chemical Biology: doi:10.1038/nchembio.556
77
ppm
9 8 7 6 5 4 3 2 1 ppm
160
140
120
100
80
60
40
20
0
1H-13C HSQC spectrum for compound 2
O
NH
HN
HN
HN
NH
ONH2
O
O
O
O O
O
H
HO
Cl
Cl
HHN
O
HO2CH
O
HO
O OH
OHHO
H2N
HO O
HO
O
OH
HOHO
NH
O
O
OH
OH
OHOH
O
ppm
11 10 9 8 7 6 5 4 3 2 1 ppm
180
160
140
120
100
80
60
40
20
1H-13C HMBC spectrum for compound 2
O
NH
HN
HN
HN
NH
ONH2
O
O
O
O O
O
H
HO
Cl
Cl
HHN
O
HO2CH
O
HO
O OH
OHHO
H2N
HO O
HO
O
OH
HOHO
NH
O
O
OH
OH
OHOH
O
Nature Chemical Biology: doi:10.1038/nchembio.556

78
ppm
10 9 8 7 6 5 4 3 2 1 ppm10
9
8
7
6
5
4
3
2
1
1H COSY spectrum for compound 2
O
NH
HN
HN
HN
NH
ONH2
O
O
O
O O
O
H
HO
Cl
Cl
HHN
O
HO2CH
O
HO
O OH
OHHO
H2N
HO O
HO
O
OH
HOHO
NH
O
O
OH
OH
OHOH
O
Supplementary figure 13. NMR information for compound 2. NMR spectra include 1H, 13C, HSQC, HMBC, and COSY.
Nature Chemical Biology: doi:10.1038/nchembio.556

79
9.5 9.0 8.5 8.0 7.5 7.0 6.5 6.0 5.5 5.0 4.5 4.0 3.5 3.0 2.5 2.0 1.5 1.0 ppm
1H NMR spectrum for compound 9
180 170 160 150 140 130 120 110 100 90 80 70 60 50 40 30 20 10 0 ppm
13C NMR spectrum for compound 9
Nature Chemical Biology: doi:10.1038/nchembio.556

80
ppm
9 8 7 6 5 4 3 2 1 ppm
160
140
120
100
80
60
40
20
0
1H-13C HSQC spectrum for compound 9
ppm
11 10 9 8 7 6 5 4 3 2 1 ppm
180
160
140
120
100
80
60
40
20
1H-13C HMBC spectrum for compound 9
Supplementary figure 14. NMR information for compound 9. NMR spectra include 1H, 13C, HSQC, and HMBC.
Nature Chemical Biology: doi:10.1038/nchembio.556

81
10 9 8 7 6 5 4 3 2 1 ppm
1H NMR spectrum for compound 10
180 170 160 150 140 130 120 110 100 90 80 70 60 50 40 30 20 10 0 ppm
13C NMR spectrum for compound 10
O
NH
HN
HN
HN
NH
ONH2
O
O
O
O O
O
H
HO
Cl
Cl
HHN
O
HO2CH
O
HO
O NH
OHHO
NH
HO O
HO
O
OH
HOHO
NH
O
O
OH
OH
OHOH
O
O
Nature Chemical Biology: doi:10.1038/nchembio.556

82
ppm
9 8 7 6 5 4 3 2 1 ppm
160
140
120
100
80
60
40
20
0
1H-13C HSQC spectrum for compound 10
ppm
11 10 9 8 7 6 5 4 3 2 1 ppm
180
160
140
120
100
80
60
40
20
1H-13C HMBC spectrum for compound 10
Nature Chemical Biology: doi:10.1038/nchembio.556

83
ppm
10 9 8 7 6 5 4 3 2 1 ppm10
9
8
7
6
5
4
3
2
1
1H COSY spectrum for compound 10
O
NH
HN
HN
HN
NH
ONH2
O
O
O
O O
O
H
HO
Cl
Cl
HHN
O
HO2CH
O
HO
O NH
OHHO
NH
HO O
HO
O
OH
HOHO
NH
O
O
OH
OH
OHOH
O
O
Supplementary figure 15. NMR information for compound 10. NMR spectra include 1H, 13C, HSQC, HMBC and COSY.
Nature Chemical Biology: doi:10.1038/nchembio.556

84
10 9 8 7 6 5 4 3 2 1 ppm
1H NMR spectrum for compound 25
180 170 160 150 140 130 120 110 100 90 80 70 60 50 40 30 20 10 0 ppm
13C NMR spectrum for compound 25
Nature Chemical Biology: doi:10.1038/nchembio.556

85
ppm
9 8 7 6 5 4 3 2 1 ppm
160
140
120
100
80
60
40
20
0
1H-13C HSQC spectrum for compound 25
O
NH
HN
HN
HN
NH
ONH2
O
O
O
O O
O
H
HO
Cl
Cl
HHN
O
HO2CH
O
HO
O HN
OHHO
NH
HO O
HO
O
OH
HOHO
NH
O
O
OHOH
OHOH
O
O
ppm
11 10 9 8 7 6 5 4 3 2 1 ppm
180
160
140
120
100
80
60
40
20
1H-13C HMBC spectrum for compound 25
Nature Chemical Biology: doi:10.1038/nchembio.556
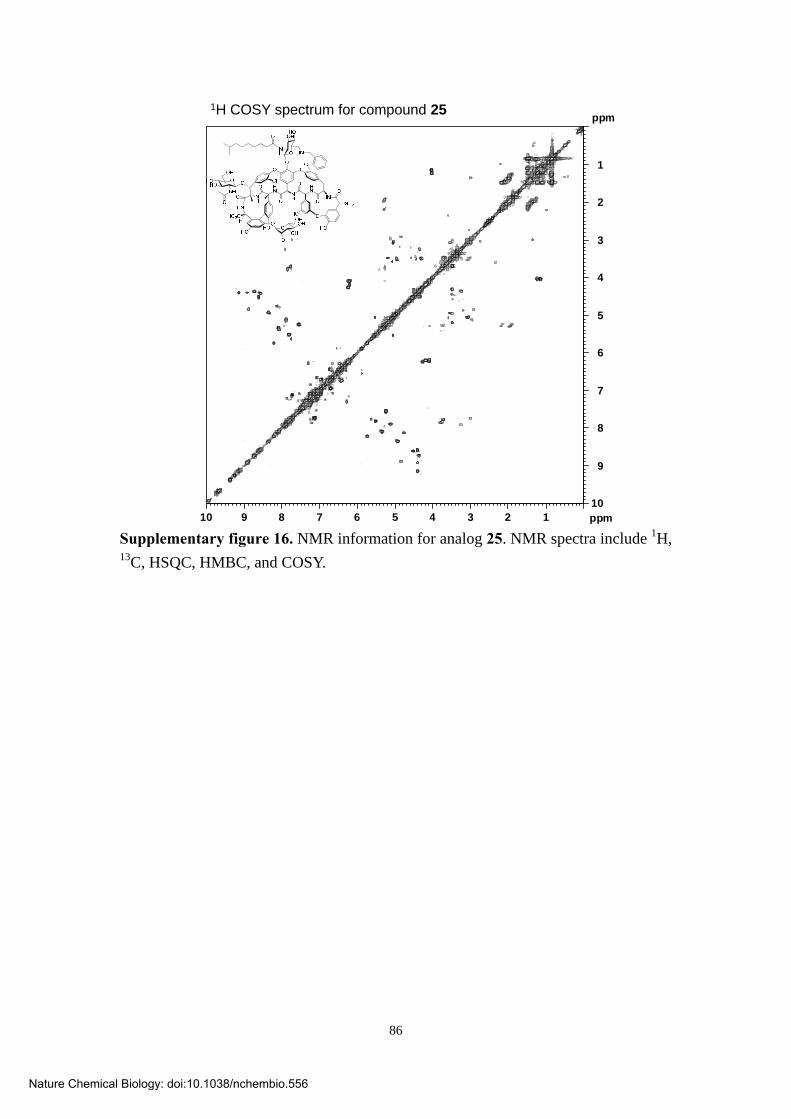
86
ppm
10 9 8 7 6 5 4 3 2 1 ppm10
9
8
7
6
5
4
3
2
1
1H COSY spectrum for compound 25
Supplementary figure 16. NMR information for analog 25. NMR spectra include 1H, 13C, HSQC, HMBC, and COSY.
Nature Chemical Biology: doi:10.1038/nchembio.556

87
10 9 8 7 6 5 4 3 2 1 ppm
1H NMR spectrum for compound 32 (de-r4-Tei)
180 170 160 150 140 130 120 110 100 90 80 70 60 50 40 30 20 10 0 ppm
13C NMR spectrum for compound 32 (de-r4-Tei)
Nature Chemical Biology: doi:10.1038/nchembio.556

88
ppm
9 8 7 6 5 4 3 2 1 ppm
160
140
120
100
80
60
40
20
0
1H-13C HSQC spectrum for compound 32 (de-r4-Tei)
OH
NH
HN
HN
HN
NH
ONH2
O
O
O
O O
O
H
HO
Cl
Cl
HHN
O
HO2CH
O
HO
HO O
HO
O
OH
HOHO
NH
O
O
OH
OH
OHOH
O
ppm
11 10 9 8 7 6 5 4 3 2 1 ppm
180
160
140
120
100
80
60
40
20
1H-13C HMBC spectrum for compound 32 (de-r4-Tei)
Nature Chemical Biology: doi:10.1038/nchembio.556

89
ppm
10 9 8 7 6 5 4 3 2 1 ppm10
9
8
7
6
5
4
3
2
1
1H COSY spectrum for compound 32 (de-r4-Tei)
Supplementary figure 17. NMR information for 32 (de-r4-Tei). NMR spectra
include 1H, 13C, HSQC, HMBC, and COSY.
Nature Chemical Biology: doi:10.1038/nchembio.556
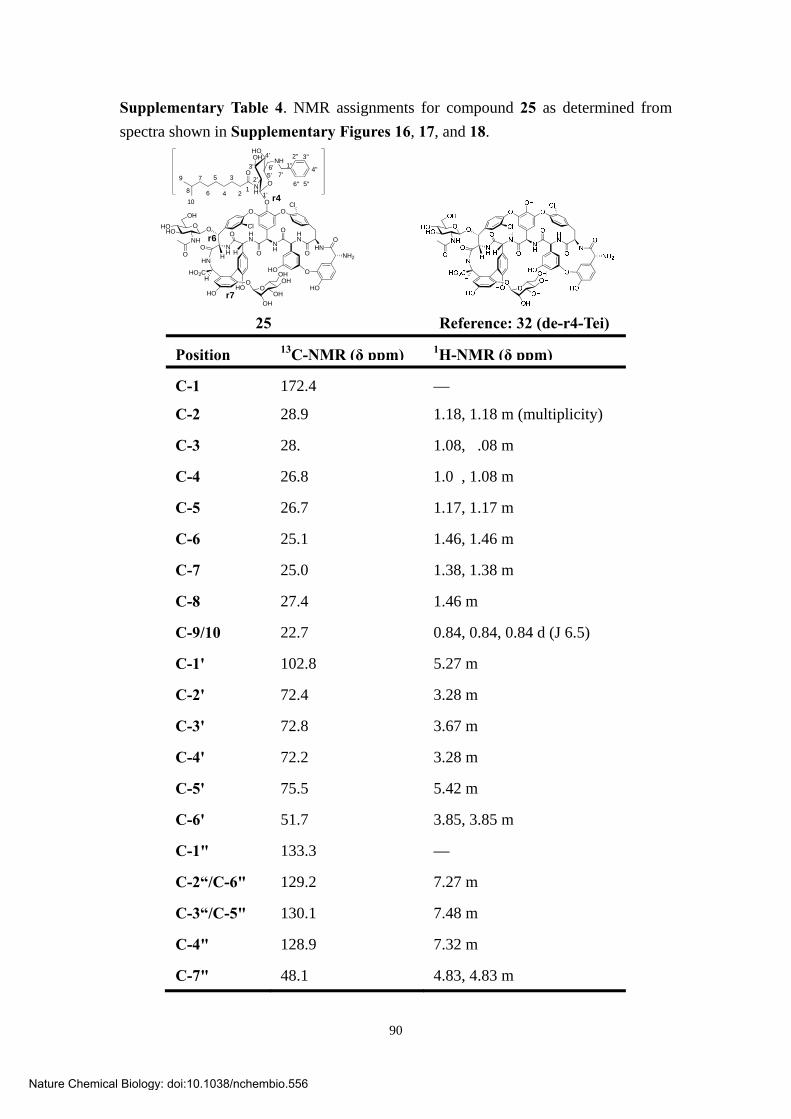
90
Supplementary Table 4. NMR assignments for compound 25 as determined from
spectra shown in Supplementary Figures 16, 17, and 18.
O
HOOH
NH
NH
O
21
3
4
5
6
7
8
9
101'
2'
3'
4'
5'6'
7'
1"
2" 3"
4"
5"6"
O
NH
HN
HN
HN
NH
ONH2
O
O
O
O
O
O
O
H
HO
Cl
Cl
HHN
O
HO2CH
O
HO
HO O
HO
O
OH
HOHO
NH
O
O
OH
OH
OHOH
r4
r6
r7 25 Reference: 32 (de-r4-Tei)
Position 13C-NMR (δ ppm) 1H-NMR (δ ppm)
C-1 172.4 —
C-2 28.9 1.18, 1.18 m (multiplicity)
C-3 28. 1.08, .08 m
C-4 26.8 1.0 , 1.08 m
C-5 26.7 1.17, 1.17 m
C-6 25.1 1.46, 1.46 m
C-7 25.0 1.38, 1.38 m
C-8 27.4 1.46 m
C-9/10 22.7 0.84, 0.84, 0.84 d (J 6.5)
C-1' 102.8 5.27 m
C-2' 72.4 3.28 m
C-3' 72.8 3.67 m
C-4' 72.2 3.28 m
C-5' 75.5 5.42 m
C-6' 51.7 3.85, 3.85 m
C-1" 133.3 —
C-2“/C-6" 129.2 7.27 m
C-3“/C-5" 130.1 7.48 m
C-4" 128.9 7.32 m
C-7" 48.1 4.83, 4.83 m
Nature Chemical Biology: doi:10.1038/nchembio.556

91
12
5.
62
12
5.
93
12
6.
25
12
7.
80
12
8.
38
12
8.
62
12
8.
80
12
8.
86
12
9.
04
12
9.
13
12
9.
20
12
9.
88
12
9.
96
13
0.
09
13
0.
21
13
0.
47
13
0.
63
13
1.
07
13
1.
14
126127128129130131132 ppm
DEPT 135
25
32 (de-r4-Tei)
*
*
*
*
*
C-5’’C-3’’
C-6’’
C-2’’
C-4’’
72
.15
72
.20
72
.2
6
72
.44
72
.5
6
72
.71
72
.80
72
.8
5
73
.1
3
73
.73
73
.80
74
.1
7
75
.5
4
75
.8
6
75
.9
6
72.573.073.574.074.575.075.576.0 ppm
DEPT 135
25
32 (de-r4-Tei)
*
* **
C-5’
C-3’ C-2’C-4’
Nature Chemical Biology: doi:10.1038/nchembio.556

92
10
1.
38
10
1.
64
10
1.
78
10
2.
20
10
2.
75
10
3.
72
10
3.
96
10
4.
63
10
5.
04
100.5101.0101.5102.0102.5103.0103.5104.0104.5105.0 ppm
DEPT 135
25
32 (de-r4-Tei)
*C-1’
17
1.
75
17
2.
36
17
2.
41
17
2.
79
17
2.
87
171.2171.4171.6171.8172.0172.2172.4172.6172.8173.0173.2173.4 ppm
13C
*C-1
25
32 (de-r4-Tei)
Nature Chemical Biology: doi:10.1038/nchembio.556

93
22
.6
5
23
.1
62
3.
25
27
.4
02
7.
47
23.023.524.024.525.025.526.026.527.027.528.028.529.029.5 ppm
DEPT 135
25
32 (de-r4-Tei)
**C-2 C-3
*C-8
*** *
*
C-4 C-5C-6 C-7
C-9C-10
Supplementary figure 18. NMR information for analog 25. While the structure of
analog 25 is big and complicated, the H1 and C13 chemical shifts (listed in
Supplementary Table 4) for the r4 (2)N-decsyl-(6)N-benzyl Glm moiety (bracketed)
were assigned. To achieve this, teicoplanin was subjected to partial degradation.
r7-Mannose (Man) pseudo-teicoplanin was identified and isolated from the
degradation mixtures. r6-GlcNac,r7-Man pseudo-teicoplanin (32, de-r4-Tei) (that
served as a reference) was enzymatically synthesized using r7-Man
pseudo-teicoplanin as a substrate and Orf1 (from Tei biosynthetic pathway) as a
catalyst, which (3 mg) was purified from reaction mixtures and subjected to NMR
analysis. Target peaks were identified by subtracting the spectra of analog 25 with
those of 32. Spectra of 13C and DEPT are shown here as both are useful to
differentiate primary, secondary and tertiary carbons. Peak assignments were also
assisted from spectra of 1H, COSY, HSQC, HMBC (Supplementary Fig. 16, 17, see
also Supplementary Table 4).
Nature Chemical Biology: doi:10.1038/nchembio.556

94
a
961.7654
962.2925
962.7728
963.2820
+MS, 0.3-0.5min #(23-36), Smoothed (0.00,2,GA)
0
1
2
3
4
Intens.
960 961 962 963 964 965 966 m/z
Compound 1HRMS ES(+): 961.7654 [M+2Na]2+, calc. for C88H97Cl2N9O33Na2 961.7680 [M+2Na]2+
b
873.7280
874.2443
874.7433 875.2475
875.7393
+MS, 0.5-0.7min #(39-54), Smoothed (0.0,2, GA)
0
1
2
3
4
5
6
Intens.
872 873 874 875 876 877 878 m/z
O
NH
HN
HN
HN
NH
ONH2
O
O
O
O O
O
H
HO
Cl
Cl
HHN
O
HO2CH
O
HO
O OH
OHHO
H2N
HO O
HO
O
OH
HOHO
NH
O
O
OH
OH
OHOH
O
Compound 2HRMS ES(+): 873.7280 [M+H+Na]2+, calc. for 873.7092 C78H80Cl2N9O32Na [M+H+Na]2+
Nature Chemical Biology: doi:10.1038/nchembio.556

95
c
957.7779
958.2754
958.7741
959.2989
959.7795
960.2555
+MS, 0.6-1.2min #(46-94), Smoothed (0.00,2,GA)
0
1
2
3
4
Intens.
955 956 957 958 959 960 961 962 963 m/z
Compound 9HRMS ES(+): 957.7779 [M+H+Na]2+, calc. for C88H96Cl2N9O34Na 957.7667 [M+H+Na]2+
d
1009.3786
1009.8808
1010.3791
1010.8801
1011.3976
1011.8808
1006 1007 1008 1009 1010 1011 1012 1013 1014 1015 m/z0
100
200
300
400
Intens.
Compound 10HRMS ES(+): 1009.3786 [M+2H]2+, calc. for C98H120O32N10Cl2 1009.37235 [M+2H]2+
Nature Chemical Biology: doi:10.1038/nchembio.556

96
e
984.3033
984.7898
985.2953
985.8031
986.2985
986.7818
982 983 984 985 986 987 988 989 m/z0
50
100
150
200
Intens.
Compound 25HRMS ES(+): 984.3033 [M+2H]2+, calc. for C95H104O32N10Cl2984.3098 [M+2H]2+
f
1006.3450
1006.8514
1007.3505
1007.8441
1008.3488
1008.8258
+MS, 0.1-0.6min #(10-49), Smoothed (0.0,2, GA)
0
2
4
6
Intens.
1004 1005 1006 1007 1008 1009 1010 1011 1012 m/z
Compound 28HRMS ES(+): 1006.3450 [M+2H]2+, calc. for C98H114Cl2N10O32 1006.3411 [M+2H]2+
Nature Chemical Biology: doi:10.1038/nchembio.556

97
g
958.2853
958.7712
959.2653
959.7758
960.2661
960.7763
961.2732
4p-tei.d: +MS, Smoothed (0.0,3, GA)
0
50
100
150
200
250
300
Intens.
957 958 959 960 961 962 963 m/z
O
NH
HN
HN
HN
NH
ONH2
O
O
O
O O
O
H
HO
Cl
Cl
HHN
O
HO2CH
O
HO
O HN
OHHO
NH
HOO
HO
O
OH
HOHO
NH
O
O
OH
OH
OHOH
O
O
Compound 31HRMS ES(+): 958.2853 [M+2H]2+, calc. for C91H102Cl2N10O32
958.2941 [M+2H]2+
h
780.1677
780.6697
781.1707
781.6668
782.1841
782.6713
-MS, 0.0-0.5min #(4-51), Smoothed (0.0,2, GA)
0.5
1.0
1.5
2.0
Intens.
777 778 779 780 781 782 783 784 785 m/z
32 de-r4-TeiHRMS ES(-): 780.1677 [M-2H]-2, calc. for C72H68O28N8Cl2780.1760 [M-2H]-2
Supplementary figure 19. HRMS data for representative compounds. High
resolution mass spectra were obtained for compounds 1 (a), 2 (b), 9 (c), 10 (d), 25 (e),
28 (f), 31 (g), and 32 (h), in which experimental and theoretical values are designated.
Nature Chemical Biology: doi:10.1038/nchembio.556

98
Supplementary References
1 Ho, J.Y. et al., Glycopeptide biosynthesis: Dbv21/Orf2 from dbv/tcp gene
clusters are N-Ac-Glm teicoplanin pseudoaglycone deacetylases and Orf15
from cep gene cluster is a Glc-1-P thymidyltransferase. J Am Chem Soc 128,
13694-13695 (2006).
2 Li, Y.S. et al., A unique flavin mononucleotide-linked primary alcohol oxidase
for glycopeptide A40926 maturation. J Am Chem Soc 129, 13384-13385
(2007).
3 Li, T.L. et al., Biosynthetic gene cluster of the glycopeptide antibiotic
teicoplanin: characterization of two glycosyltransferases and the key
acyltransferase. Chem Biol 11, 107-119. (2004).
4 Chan, H. C. et al. Regioselective deacetylation based on
teicoplanin-complexed Orf2* crystal structures. Mol Biosyst,
doi:10.1039/C0MB00320D (2011).
5 Borch, R.F., Bernstein, M.D., & Durstlb, H.D., The cyanohydridoborate anion
as a selective reducing agent. J Am Chem Soc 93, 2897-2904 (1971).
6 Abruzzo, G.K. et al., Evaluation of the echinocandin antifungal MK-0991
(L-743,872): efficacies in mouse models of disseminated Aspergillosis,
Candidiasis, and Cryptococcosis. Antimicrob Agents Chemother 41,
2333–2338 (1997).
7 Wang, J. et al., Platensimycin is a selective FabF inhibitor with potent
antibiotic properties. Nature 441, 358-361 (2006).
8 Wiegand, I., Hilpert, K., & Hancock, R.E., Agar and broth dilution methods to
determine the minimal inhibitory concentration (MIC) of antimicrobial
substances. Nat Protoc 3, 163-175 (2008).
9 Huang, C.H. et al., Crystal structure of glucooligosaccharide oxidase from
Acremonium strictum: a novel flavinylation of 6-S-cysteinyl,
8alpha-N1-histidyl FAD. J Biol Chem 280, 38831-38838 (2005).
10 Alexeev, I., Sultana, A., Mäntsälä, P., Niemi, J., & Schneider, G.,
Aclacinomycin oxidoreductase (AknOx) from the biosynthetic pathway of the
antibiotic aclacinomycin is an unusual flavoenzyme with a dual active site.
Proc Natl Acad Sci U S A 104, 6170-6175 (2007).
11 Winkler, A. et al., A concerted mechanism for berberine bridge enzyme. Nat
Chem Biol 4, 739-741 (2008).
12 Krissinel, E. & Henrick, K., Inference of macromolecular assemblies from
crystalline state. J Mol Biol 372, 774-797 (2007).
13 Donadio, S. & Sosio, M., Biosynthesis of glycopeptides: prospects for
Nature Chemical Biology: doi:10.1038/nchembio.556
99
improved antibacterials. Curr Top Med Chem 8, 654-666 (2008).
14 Truman, A.W., Robinson, L., & Spencer, J.B., Identification of a deacetylase
involved in the maturation of teicoplanin. Chembiochem 7, 1670-1675 (2006).
15 Huang, Y.T. et al., In vitro characterization of enzymes involved in the
synthesis of nonproteinogenic residue (2S,3S)-beta-methylphenylalanine in
glycopeptide antibiotic mannopeptimycin. Chembiochem 10, 2480-2487
(2009).
16 Schuck, P., Size distribution analysis of macromolecules by sedimentation
velocity ultracentrifugation and Lamm equation modeling. Biophysical
Journal 78, 1606-1619 (2000).
17 Malabarba, A., Ferrari, P., Gallo, G.G., Kettenring, J., & Cavalleri, B.,
Teicoplanin, antibiotics from Actinoplanes teichomyceticus nov. sp. VII.
Preparation and NMR characteristics of the aglycone of teicoplanin. J Antibiot
39, 1430-1442 (1986).
Nature Chemical Biology: doi:10.1038/nchembio.556