supplementary information - rsc.org · supplementary information . structure effect of carbon...
TRANSCRIPT
Supplementary Information
Structure Effect of Carbon Nanovectors in Regulation of Cellular Responses Shashwat S. Banerjeea, Archana Jalota-Badhwarb, Prateek Watec, Sneha Asaia, Khushbu R. Zopea, Russel Mascarenhasa, Dimple Bhatiab and Jayant Khandarea*
a NCE-Polymer Chemistry Group, Piramal Life Science Ltd. Goregaon, Mumbai-400063, India. E-mail: [email protected] b Cancer Biology Group, Piramal Healthcare Ltd. Goregaon, Mumbai-400063, India. c Materials Science and Engineering, University of Florida, Gainesville, FL 32608, USA.
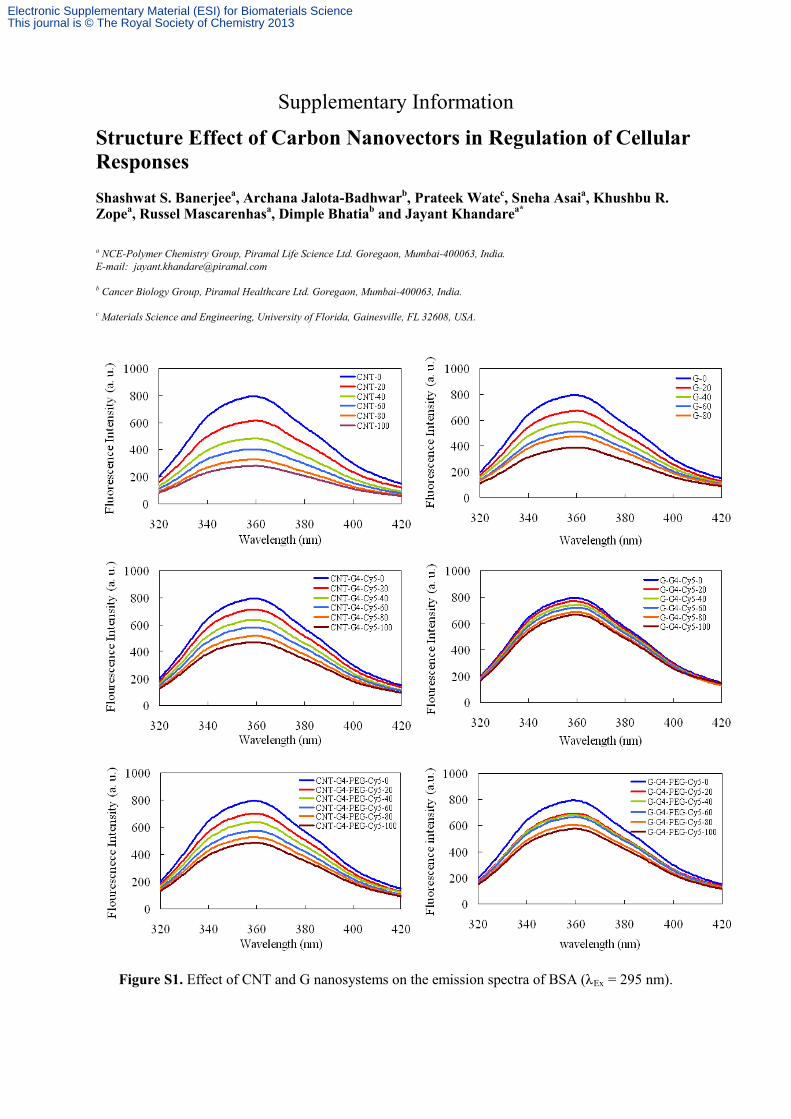
Figure S1. Effect of CNT and G nanosystems on the emission spectra of BSA (λEx = 295 nm).
Electronic Supplementary Material (ESI) for Biomaterials ScienceThis journal is © The Royal Society of Chemistry 2013
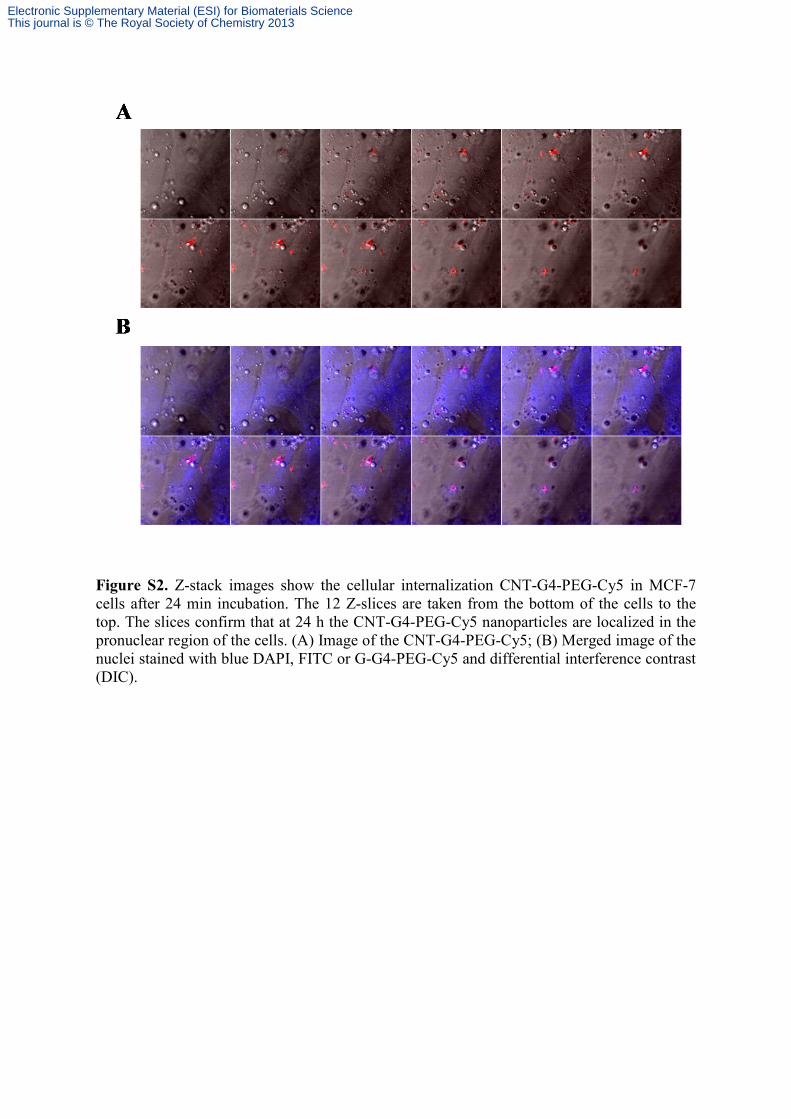
Figure S2. Z-stack images show the cellular internalization CNT-G4-PEG-Cy5 in MCF-7 cells after 24 min incubation. The 12 Z-slices are taken from the bottom of the cells to the top. The slices confirm that at 24 h the CNT-G4-PEG-Cy5 nanoparticles are localized in the pronuclear region of the cells. (A) Image of the CNT-G4-PEG-Cy5; (B) Merged image of the nuclei stained with blue DAPI, FITC or G-G4-PEG-Cy5 and differential interference contrast (DIC).
Electronic Supplementary Material (ESI) for Biomaterials ScienceThis journal is © The Royal Society of Chemistry 2013
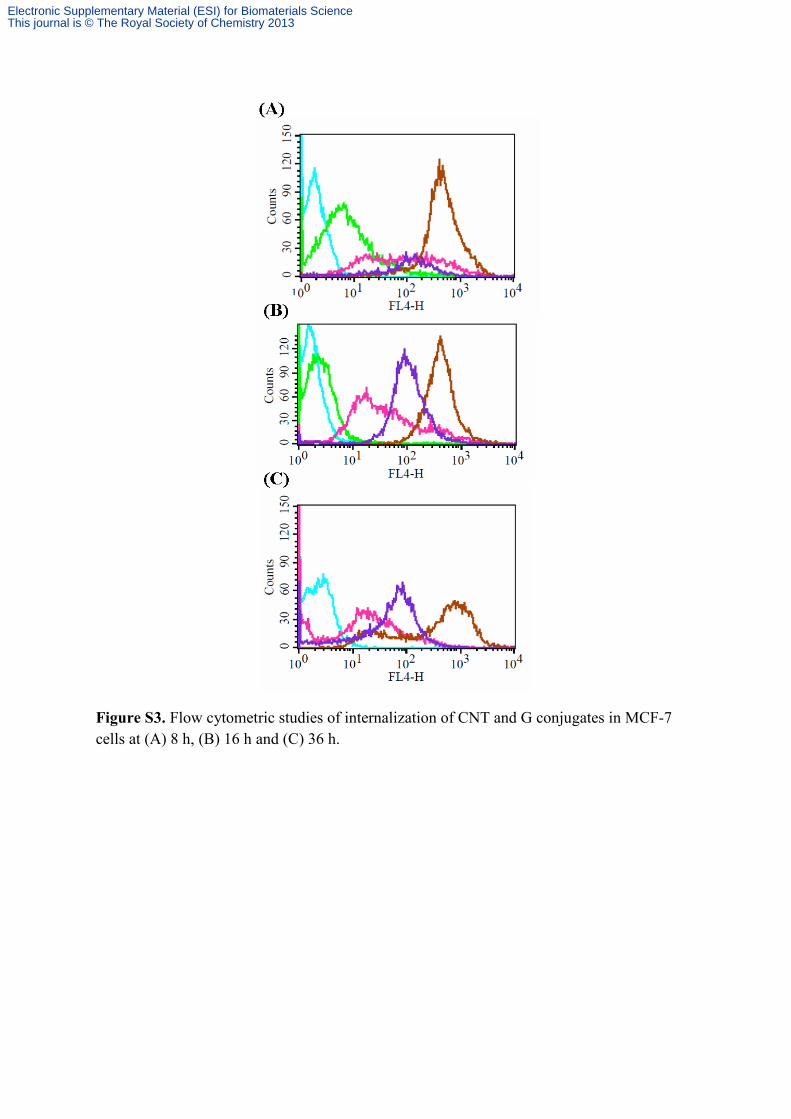
Figure S3. Flow cytometric studies of internalization of CNT and G conjugates in MCF-7 cells at (A) 8 h, (B) 16 h and (C) 36 h.
Electronic Supplementary Material (ESI) for Biomaterials ScienceThis journal is © The Royal Society of Chemistry 2013
0
40
80
120
160
4 8 16 24 48Time (h)
Cel
lula
r Upt
ake
(%) CNT-G4-Cy5 CNT-G4-PEG-Cy5
G-G4-Cy5 G-G4-PEG-Cy5
* * * * *
0
40
80
120
160
4 8 16 24 48Time (h)
Cel
lula
r Upt
ake
(%) CNT-G4-Cy5 CNT-G4-PEG-Cy5
G-G4-Cy5 G-G4-PEG-Cy5
* * * * * * * * * *
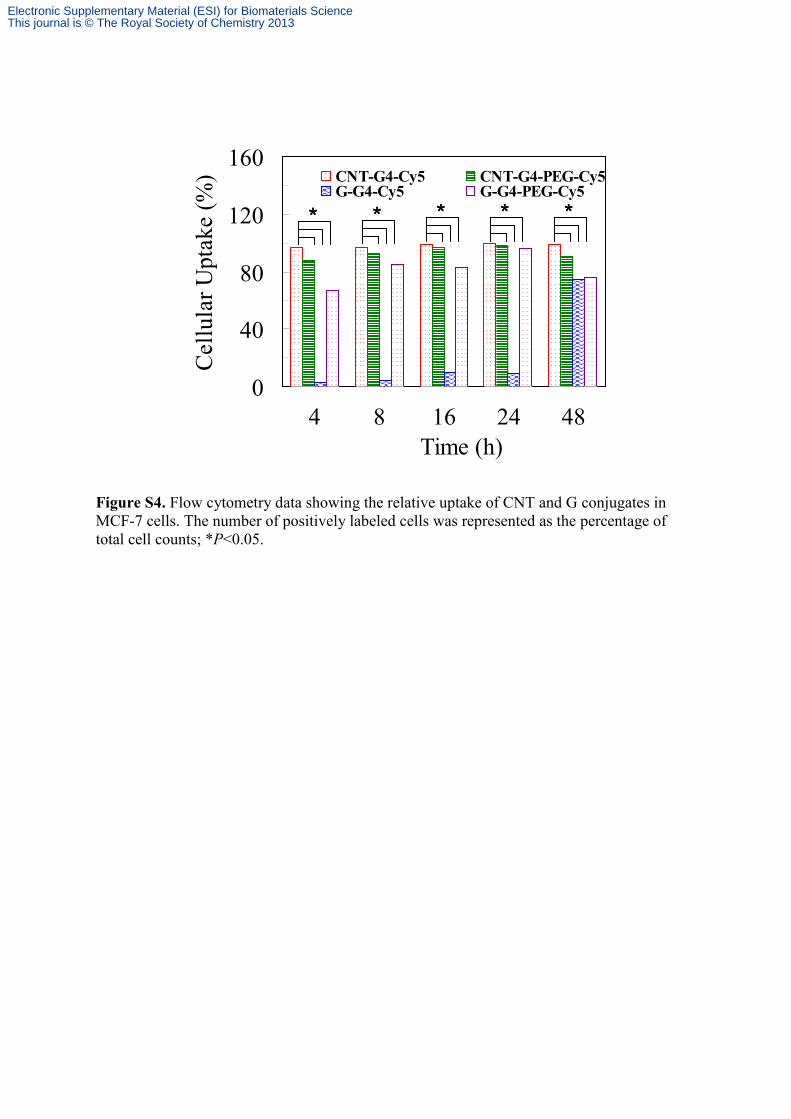
Figure S4. Flow cytometry data showing the relative uptake of CNT and G conjugates in MCF-7 cells. The number of positively labeled cells was represented as the percentage of total cell counts; *P<0.05.
Electronic Supplementary Material (ESI) for Biomaterials ScienceThis journal is © The Royal Society of Chemistry 2013

Figure S5. Flow cytometric studies of internalization of CNT and G conjugates in H460 cells at (A) 4 h, (B) 8 h, (C) 16 h, (D) 24 h, (E) 36 h and (F) 48 h.
Electronic Supplementary Material (ESI) for Biomaterials ScienceThis journal is © The Royal Society of Chemistry 2013
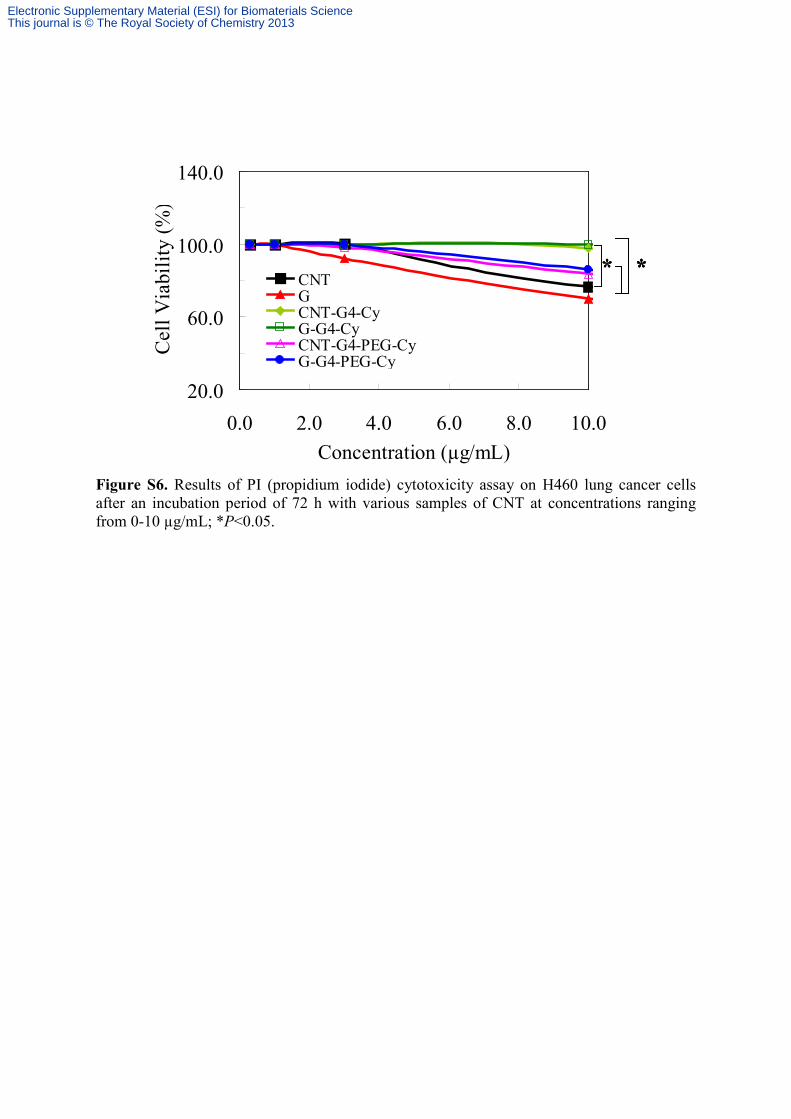
20.0
60.0
100.0
140.0
0.0 2.0 4.0 6.0 8.0 10.0Concentration (µg/mL)
Cel
l Via
bilit
y (%
)
CNTGCNT-G4-CyG-G4-CyCNT-G4-PEG-CyG-G4-PEG-Cy
* *
20.0
60.0
100.0
140.0
0.0 2.0 4.0 6.0 8.0 10.0Concentration (µg/mL)
Cel
l Via
bilit
y (%
)
CNTGCNT-G4-CyG-G4-CyCNT-G4-PEG-CyG-G4-PEG-Cy
* ** *
Figure S6. Results of PI (propidium iodide) cytotoxicity assay on H460 lung cancer cells after an incubation period of 72 h with various samples of CNT at concentrations ranging from 0-10 µg/mL; *P<0.05.
Electronic Supplementary Material (ESI) for Biomaterials ScienceThis journal is © The Royal Society of Chemistry 2013