supplementary materials for...materials and methods . animals . all wt, knockout and transgenic mice...
TRANSCRIPT
www.sciencemag.org/content/352/6293/1535/suppl/DC1
Supplementary Materials for
A sentinel goblet cell guards the colonic crypt by triggering Nlrp6-dependent
Muc2 secretion
George M. H. Birchenough, Elisabeth E. L. Nyström, Malin E. V. Johansson, Gunnar C. Hansson*
*Corresponding author. Email: [email protected]
Published 24 June 2016, Science 352, 1535 (2016) DOI: 10.1126/science.aaf7419
This PDF file includes: Materials and Methods
Figs. S1 to S7
Movies S1 to S7
References
Materials and Methods Animals All WT, knockout and transgenic mice were male 8-12 week old on the C57BL/6 background bred in house. Animals were anesthetized using isofluorane and killed by cervical dislocation prior to collection of samples. For in vivo experiments animals were anesthetized and 200 µl of test reagents were administered intrarectally using a blunt needle 10 min prior to cervical dislocation and sample collection. For some experiments DSS (Dextran Sodium Sulfate, TdB Consultancy, Uppsala, Sweden) was dissolved in animal drinking water to 3% (w/v) and animals were allowed to drink freely. The DSS water was given before the 12 h night period and the experiments were performed 12, 36 or 84 h later. mCherry labelled human MUC2 transgenic mice (RedMUC298trTg) were generated by pronuclear injection of an mCherry-MUC2-98tr containing BAC clone was generated by homologous recombination of BAC clone RP13-870H17 with an mCherry targeting cassette inserted between the MUC2 CysD1 and CysD2 domains. All animal experimental procedures were approved by the Swedish Laboratory Animal Ethical Committee in Gothenburg. The following knock-out mice strains were utilized: Tlr2-/- generated by Carsten J. Kirschning, Technical University of Munich, Munich, Germany; Tlr4-/-, MyD88-/-, IL18-/-, and Trif-/- generated by Shizuo Akira, Osaka University, Osaka, Japan; Nlrp3-/- generated by Jürg Tschopp, University of Lausanne, Lausanne, Switzerland; Nlrc4-/- and Caspase 11-/- generated by Vishva Dixit, Genentech, South San Francisco, CA; Nlrp6-/- generated by Gabriel Nuñez, University of Michigan, Ann Arbor, MI; Caspase 1/11-/- generated by Tara Seshadri, BASF Bioresearch, Worcester, MA; IL1αβ-/- generated by Yoichiro Iwakura, University of Tokyo, Tokyo, Japan; and Rag1-/- generated by Virginia E. Papaioannou, MIT, Cambridge, MA. Reagents All reagents were Ultrapure grade and purchased from Invivogen unless otherwise stated. Final concentrations used to treat explants are indicated in brackets: LPS from E. coli O111:B4 (200 µg/ml), E. coli diphosphoryl Lipid A (Sigma; 10 µg/ml), LTA from S. aureus (200 µg/ml), P3CSK4 (50 µg/ml), DNA from E. coli (200 µg/ml), flagellin from B. subtilis (50 µg/ml), MDP (200 µg/ml), iE-DAP (200 µg/ml) and Carbachol (Sigma; 1 mM). Experiments requiring fluorescently tagged reagents utilized: E. coli LPS-Alexa488 (ThermoFisher; 200 µg/ml), P3CSK4-Rhodamine (50 µg/ml), P3CSK4-FITC (EMC Microcollections; 50 µg/ml) and Dextran-Alexa488 (ThermoFisher; 0.5 mg/ml). Reagents were reconstituted in Krebs-mannitol buffer, H2O (P3CSK4) or DMSO (Lipid A, Carbachol). LPS, Lipid A, P3CSK4 and LTA stocks were sonicated prior to use. Intestinal explant mucus measurements Intestinal tissues were prepared for ex-vivo mucus analysis as previously described (13). Briefly, intestinal tissues were collected by dissection and flushed with Krebs buffer to remove luminal content and unattached mucus. The muscle layer was removed by microdissection and tissue was mounted in a horizontal chamber system and maintained at 37°C with basolateral Krebs-glucose buffer perfusion and apical Krebs-mannitol buffer. Removal of the muscular layer improves viability and allowes serosal addition of compounds. The senGC cells and system was working in the same way with an intact muscular layer, Fig. S1A. To visualize the mucus formed on the apical side of the tissue explant, the mucus was overlaid with charcoal. The surface charcoal and epithelium was observed by a stereomicroscope and the difference making up the mucus thickness measured using a glass micropipette connected to a micrometer. Mucus thickness was measured every 15 min from t=0-60
2
min. Inhibitors were added to the apical or basolateral buffer at t=0 and mucus secretion was stimulated at t=30 (unless stated otherwise) and mucus growth rate before and after treatment was calculated. Transepithelial potential difference (PD) was recorded using electrodes linked to the basolateral and apical chambers via agar bridges. The PD remained constant during the experiments showing that ion channels were functoning normally. Intestinal explant live imaging
Intestinal tissue explants were prepared and chamber mounted using the same method as described above. For mucus penetrability analysis the tissue was stained by adding Calcein violet (ThermoFisher; 1 µg/ml) to the basolateral Krebs-glucose buffer and the mucus was overlaid with 1 µm Fluosphere beads (ThermoFisher) as described previously (20). Tissue and beads were visualized by generating confocal z-stacks using an LSM 700 microscope equipped with a x20 water immersion objective (Zeiss). For live imaging of GC secretion MUC2-mCtg explants were used and Hoechst-34580 (Sigma; 1 µg/mL) was included in the apical Krebs-mannitol buffer. For live imaging of inflammasome activity tissues were treated with Z-YVAD-R110 Caspase1/11 fluorogenic peptide probe (ThermoFisher; 100 µM) for 30 min at RT. For live imaging of Ca2+ signaling in GCs, RedMUC298trTg explants were incubated with apical HEPES buffer (pH 7; 140 mM NaCl) containing Fluo4 dye (ThermoFisher; 5 µM) for 30 min at 4°C. The apical buffer was then replaced with fresh HEPES and the tissue incubated for 30 min at 37°C prior to imaging. Imaging of GC secretion and Ca2+ signaling was performed by acquiring continuous confocal z-stacks over a 1 h period. Inhibitors Stock inhibitor solutions were prepared in DMSO and added to the apical buffer unless otherwise stated. Dynasore (Sigma; 100 µM), DPI (Sigma; 100 µM), Ac-YVAD-cmk Caspase1/11 inhibitory peptide (Sigma; 200 µM), basolateral atropine (Sigma; 50 µM), NAC (Sigma; 0.5 mM), Mito-TEMPO (Sigma; 0.5 mM), Pepinh-MYD MyD88 inhibitory peptide (Invivogen; 50 µM), carbenoxolone (Sigma; 75 µM), tetrodotoxin (Abcam; 100 µM), BAPTA-AM (ThermoFisher; 200 µM), EGTA (Sigma; 2 mM), Xestospongin-C (Tocris, 100 µM) and Ryanodine (100% ethanol solubilized; Tocris; 100 µM). All inhibitors were incubated with explant tissue for 30 min prior to different treatments, with the exception of carbenoxolone which was incubated for 1 h. Estimation of stool and colonic mucus soluble endotoxin: Stool samples were collected by dissection and transferred to tubes containing 1 ml PBS. For mucus samples unflushed colonic tissues containing no fecal material were opened and pinned flat to silicon dissection plates. Mucus and underlying mucosal tissue were collected using 2 mm biopsy punches (Miltex) and transferred to tubes containing 1 ml PBS. A 5 mm steel bead (Qiagen) was added to each tube and samples were homogenized for 1 min using a Fast-Prep 24 instrument (MP-Biomedicals). Homogenates were clarified by centrifugation at 5,000xg for 10 min and supernatants were collected. Supernatant endotoxin was quantified using LAL Chromogenic Endotoxin Quantitation Kits (ThermoFisher) with PBS used as the negative control and data was normalized to stool or mucus volume. All buffers, plastics and dissection equipment were sterile and pyrogen free. Pipette tips and sample tubes were maximum recovery grade (Axygen).
3
Estimation of stool and colonic mucus bacterial load Stool and mucus were collected (as described in previous section) and transferred to 1 ml TE buffer supplemented with 0.5% SDS (w/v) and 200 µg/ml proteinase K (Qiagen) in Lysing Matrix E tubes (MP Biomedicals). Lysing tubes were incubated at 55˚C for 1 h after which DNA was isolated using mechanical disruption and phenol:chloroform:isoamylalcohol extraction as previously described (28). Extracted DNA was precipitated using ethanol and 0.2 M NaCl. DNA was pelleted by centrifugation at 20,000xg for 20 min and the pellet was washed with 70% ethanol. Finally DNA pellets were rehydrated in 100 µl TE buffer and stored at -20˚C until used. In order to allow quantification of relatively low copy number bacterial 16S DNA in mucus samples by qPCR, the ratio of 16S DNA to total DNA was increased by limited cycle number (LCN) PCRs amplifying the whole 16S gene (20). 50 µL LCN PCRs were prepared using HotStar Taq Plus PCR Mastermix (Qiagen), 0.2 µM universal forward primer 27F (AGAGTTTGATCMTGGCTCAG), 0.2 µM universal reverse primer 1492R (CGGTTACCTTGTTACGACTT) and 500 ng template DNA. Thermocycling conditions were: 1 cycle of 95˚C for 5 min; 16 cycles of 94˚C for 1min, 55˚C for 1 min, 72˚C for 1.5 min; 1 cycle of 72˚C for 10 min. 16S standards (quantified E. coli 16S DNA), contamination controls and no template controls were amplified at the same time as samples. Amplified samples, standards and controls were then analyzed by qPCR to determine the total number of 16S copies. Briefly, 20 µl qPCRs were prepared using 2 µl of LCN PCR amplifications as template, SsoFast EvaGreen qPCR Supermix (Bio-Rad) and 0.3 µM each of universal 16S primers 926F (AAACTCAAAKGAATTGACGG) and 1062R (CTCACRRCACGAGCTGAC). DNA extracted from stool (25 ng) was used in qPCRs directly without LCN-PCR enrichment. qPCRs were analyzed on a CFX96 instrument (Bio-Rad) and resulting Cq values were exported from CFX manager software (Bio-Rad) and calibration curves constructed from 16S standard data. Calibration curves were used to calculate the total original 16S copy number from stool and mucus sample DNA extractions and data was normalized to sample volume. Explant and whole tissue histology For explant histology tissues were submerged in 4% (w/v) neutral buffered formalin for 1 h. Fixed tissue was incubated in 30% (w/v) sucrose at 4°C for 15 h and then embedded in Optimal Cutting Temperature compound prior to cryosectioning. Sections were washed in PBS and stained with Hoechst-34580 (Sigma; 1µg/ml) to visualize nuclei. Stained tissue sections were cover-slipped with Prolong-Gold Antifade mounting medium (ThermoFisher) and visualized by confocal microscopy using an LSM 700 microscope with a x40 oil immersion objective (Zeiss). For whole tissue histology colonic tissue containing a stool pellet was submerged in Methacarn fixative for at least 24h (1). Fixed tissue was paraffin embedded and sectioned, followed by dewaxing and staining using a combination of Alcian Blue and Periodic acid-Schiff (AB/PAS) stains (1). Explant whole mounts Explant tissue was fixed in 4% neutral buffered formalin for 1 h and then permeabilized with 0.5% (v/v) Triton X-100 for 15 min and washed with PBS. Tissue was stained for 1 h with 10 µg/ml Hoechst-34580 (Sigma) to visualize nuclei and 1:500 Phalloidin-Alexa647 (ThermoFisher) to visualize actin. Stained tissue was washed with PBS, transferred to a microscope slide and cover-slipped with Prolong-Gold Antifade mounting medium (ThermoFisher). Whole mounts were visualized by generating confocal z-stacks using an LSM 700 microscope equipped with a x40 oil immersion objective (Zeiss).
4
Ex-vivo ROS quantification in colonic epithelial cell suspensions Epithelial cells were isolated from colonic tissues by disassociating them from the underlying lamina propria. Colons were first thoroughly flushed with Krebs buffer then were inverted using a blunt needle and syringe. One end of the tissue was ligated with nylon thread then the colon was inflated with Krebs buffer and the other end of the colon ligated in a similar manner. Inverted/inflated colons were transferred to 10 ml Hanks balanced salt solution with 5% (v/v) FCS, 5 mM EDTA and 1 mM DTT and incubated at 37°C in a shaking incubator for 30 min. Tissue was vortexed for 1 min to disassociate cells and the remaining intact tissue was removed. The cell suspension was passed through a 40 µm filter (BD Biosciences) to remove clumped cells and the filter was washed with 10 ml PBS. Cells were centrifuged at 100xg for 10 min and pellets resuspended in 2 ml of 140 mM pH 7 HEPES buffer. Cells were loaded with ROS sensitive DCFDA-AM dye (Sigma; 10 µM) and Mito-TEMPO (Sigma; 200 µM) to quench mitochondrial ROS production. Cell suspensions were divided into different treatment groups and different inhibitors added to the concentrations detailed previously. Cells were incubated for 1 h at 37°C then distributed to wells on black 96-well plates. Different bacterial molecules or vehicle buffer was added to wells and plates were incubated for 30 min at 37°C. DCFDA fluorescence was measured using a Victor plate reader (PerkinElmer) and data for bacterial molecule treated wells normalized to vehicle treated controls. Ex-vivo FRAP Colonic tissue explants were prepared and chamber mounted as described above. The apical Krebs-mannitol buffer was supplemented with Calcein Violet tissue stain (ThermoFisher; 1 µg/ml) and incubated in the dark at RT for 30 min. Explants were thoroughly washed 5 times with fresh Krebs-mannitol and incubated for 30 min at 37°C. The tissue surface was imaged and FRAP data acquired using an LSM 700 confocal microscope with a x20 water immersion lens and 405 nm laser with Zen acquisition software (Zeiss). For each FRAP measurement Calcien violet fluorescence was initially recorded over a 0.0256 mm2 experimental area of tissue using 1% laser power for 1 min (pre-bleach). A 1,200 µm2 sub-region of this area (the target) was then bleached using 15% laser power for 15 s, followed by recording of fluorescence over the experimental area using 1% laser power for 10 min (recovery). Fluorescence data for the target region was first normalized to a non-target region to control for photobleaching then baseline corrected to control for background fluorescence. Data was normalized to average pre-bleach data to allow relative comparison of FRAP experiments from different tissues. For experiments analyzing the effect of gap junction inhibition on FRAP, carbenoxolone (Sigma; 75 µM) was added to the apical Krebs-mannitol buffer during staining and incubation steps. Ex-vivo bacterial crypt clearance Citrobacter rodentium (strain ICC169) was grown to mid-log phase in BHI broth and 1 ml OD600 0.1 culture was centrifuged at 5,000xg for 5 min. Cell pellets were resuspended in 1ml PBS containing Baclight Red cell stain (ThermoFisher; 0.5 µM) and incubated at 37°C for 30 min. Labelled bacteria were washed 4 times in PBS then resuspended in 100 µl Krebs-mannitol buffer. Chamber mounted colonic explants were prepared as described above with apical Krebs-mannitol containing Syto9 nucleic acid stain (ThermoFisher; 10 µM) and incubated for 30 min at RT. Tissue was then washed with fresh Krebs-mannitol buffer and the attached mucus was disrupted by vigorous aspiration with a micropipette. Labelled C. rodentium was then applied to the tissue and allowed to sediment for 5 min before the apical chamber was refilled with Krebs-mannitol buffer. Labelled tissue and bacteria were visualized before and after treatment with LPS by generating confocal z-stacks using an LSM 700 microscope with a x20 water immersion lens.
5
Statistical and image analysis All statistical analyses were 1- or 2-way ANOVA with post-hoc testing and were performed using Prism 6 software (Graphpad). FRAP time-series were produced using Zen software (Zeiss) and fluorescence data extracted directly for analysis. To quantify GC secretion and bacterial clearance from crypts, confocal z-stack time-series were produced using Zen then exported to Imaris software (Bitplane). For secretion, individual GC thecas were mapped to isosurfaces using the mCherry-MUC2 signal and isosurface volumes were tracked over time. To analyze bacterial clearance from crypts, individual bacteria were mapped using Baclight Red signal and crypt opening locations were mapped manually. 3D spatial coordinate data was extracted for each and the distance of individual bacteria from crypt openings was calculated.
6
WT Rag1-/-0
2
4
6
8
10
12
Muc
usgr
owth
(μm
/min
)
UntreatedLPSP3CSK4FlagellinCCh
Unt. LPS P3CSK40
2
4
6
8
10
12M
ucus
grow
th(μ
m/m
in)
Without muscle With muscle
A
B
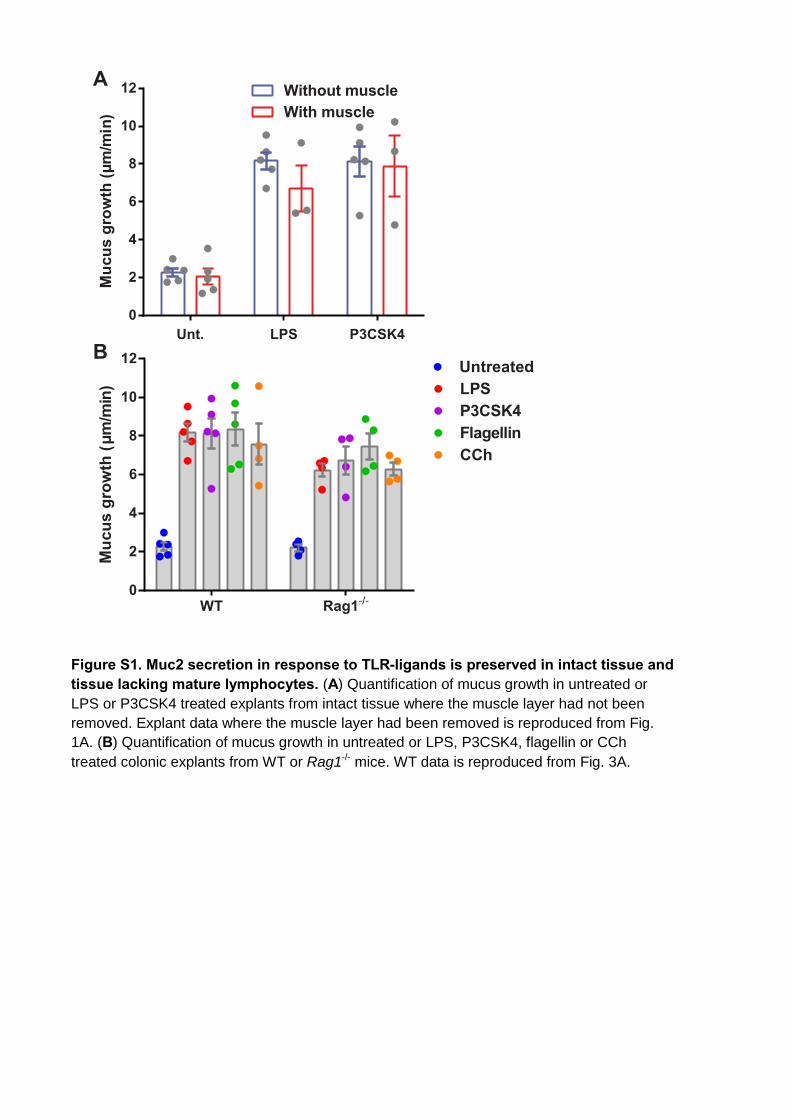
Figure S1. Muc2 secretion in response to TLR-ligands is preserved in intact tissue and tissue lacking mature lymphocytes. (A) Quantification of mucus growth in untreated or LPS or P3CSK4 treated explants from intact tissue where the muscle layer had not been removed. Explant data where the muscle layer had been removed is reproduced from Fig. 1A. (B) Quantification of mucus growth in untreated or LPS, P3CSK4, flagellin or CCh treated colonic explants from WT or Rag1-/- mice. WT data is reproduced from Fig. 3A.
WT
Cas
pase
1/11
-/-C
aspa
se11
-/-
Nlrc
4-/-
N
lrp3-/-
N
lrp6-/-
AB/PAS Ex-vivo penetrability
Tissue Beads
A B
im
im
im
im
im im
im
im
imim
im im
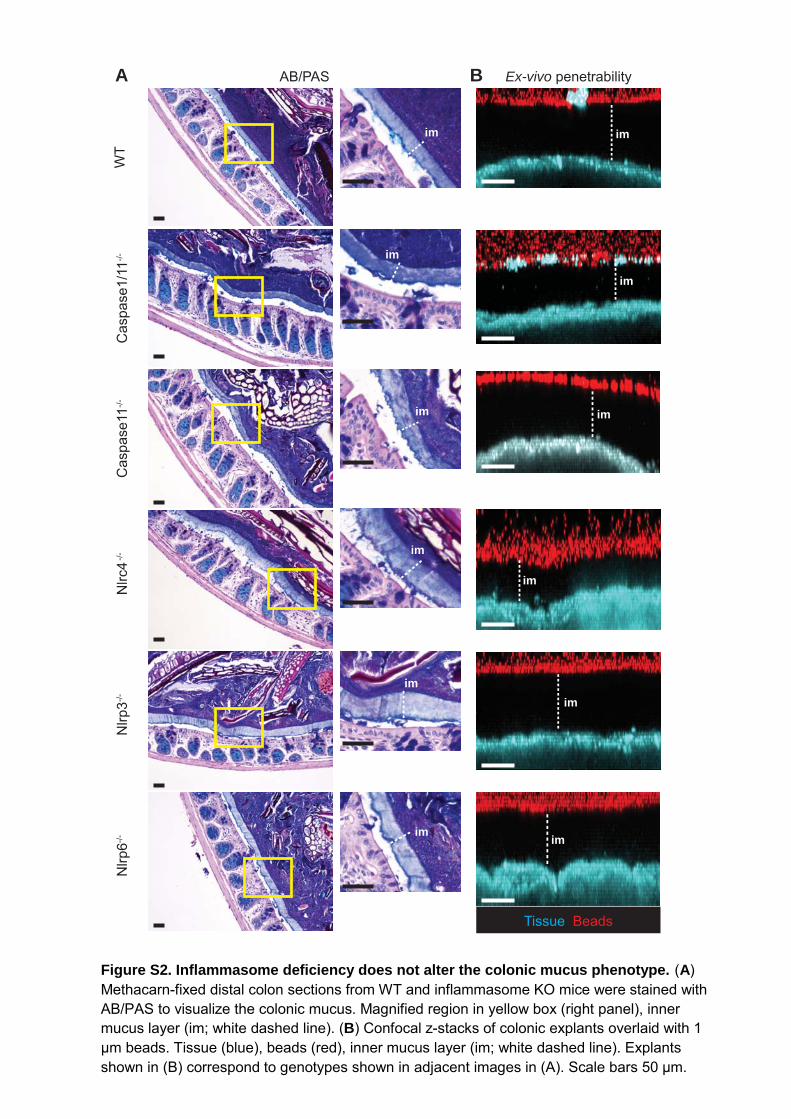
Figure S2. Inflammasome deficiency does not alter the colonic mucus phenotype. (A) Methacarn-fixed distal colon sections from WT and inflammasome KO mice were stained with AB/PAS to visualize the colonic mucus. Magnified region in yellow box (right panel), inner mucus layer (im; white dashed line). (B) Confocal z-stacks of colonic explants overlaid with 1 μm beads. Tissue (blue), beads (red), inner mucus layer (im; white dashed line). Explants shown in (B) correspond to genotypes shown in adjacent images in (A). Scale bars 50 μm.
A
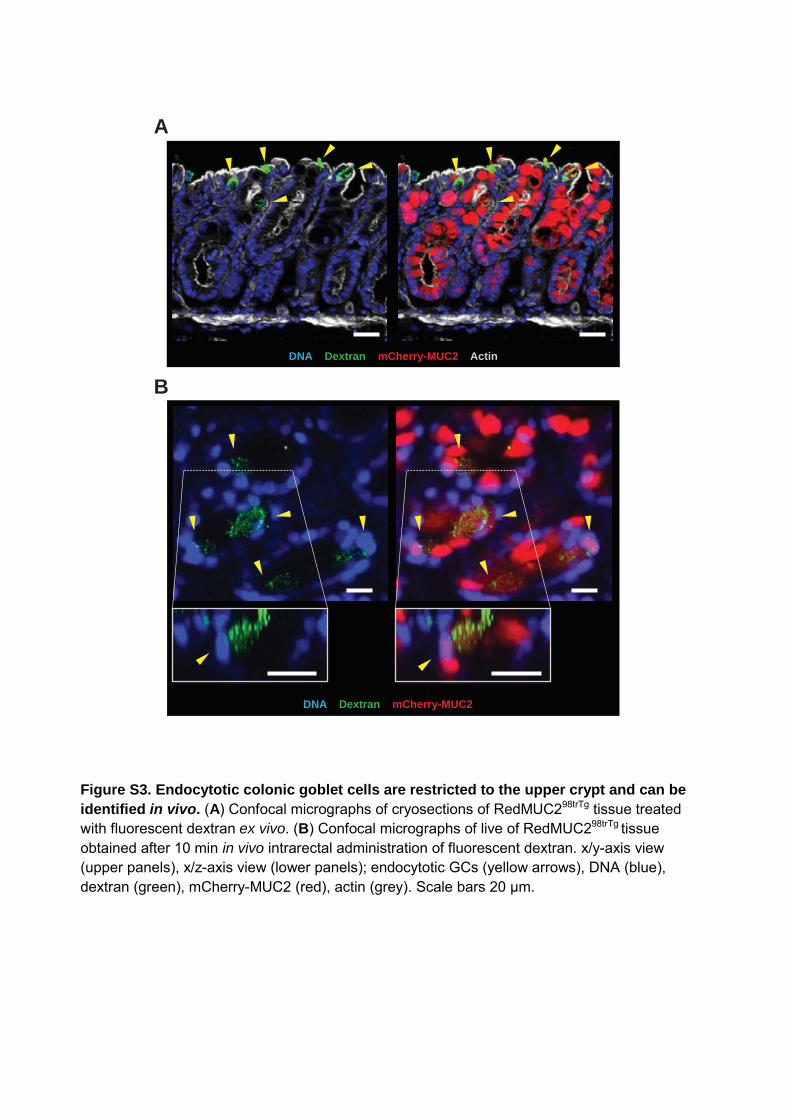
BDNA Dextran mCherry-MUC2 Actin
DNA Dextran mCherry-MUC2
Figure S3. Endocytotic colonic goblet cells are restricted to the upper crypt and can be identified in vivo. (A) Confocal micrographs of cryosections of RedMUC298trTg tissue treated with fluorescent dextran ex vivo. (B) Confocal micrographs of live of RedMUC298trTg tissue obtained after 10 min in vivo intrarectal administration of fluorescent dextran. x/y-axis view (upper panels), x/z-axis view (lower panels); endocytotic GCs (yellow arrows), DNA (blue), dextran (green), mCherry-MUC2 (red), actin (grey). Scale bars 20 μm.
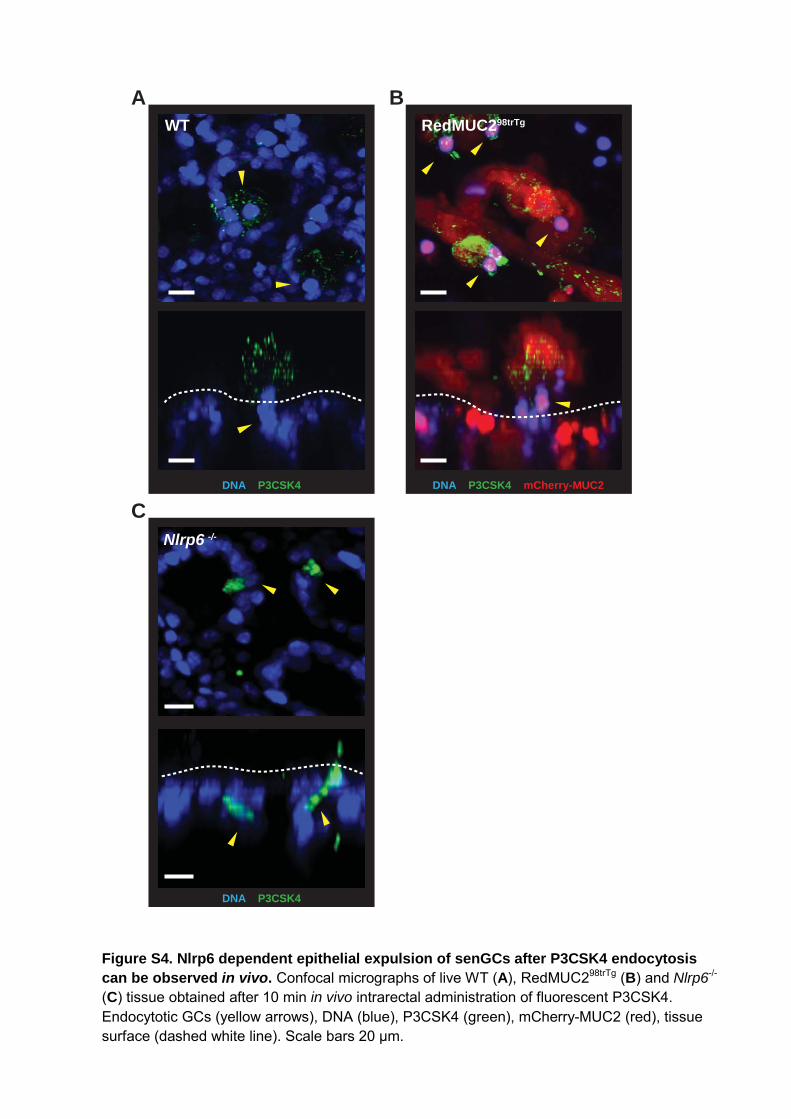
DNA P3CSK4
DNA P3CSK4
DNA P3CSK4 mCherry-MUC2
A B
C
WT RedMUC298trTg
Nlrp6 -/-
Figure S4. Nlrp6 dependent epithelial expulsion of senGCs after P3CSK4 endocytosis can be observed in vivo. Confocal micrographs of live WT (A), RedMUC298trTg (B) and Nlrp6-/- (C) tissue obtained after 10 min in vivo intrarectal administration of fluorescent P3CSK4. Endocytotic GCs (yellow arrows), DNA (blue), P3CSK4 (green), mCherry-MUC2 (red), tissue surface (dashed white line). Scale bars 20 μm.
A
Veh.
CBX
Pre-bleach Bleach Recovery
0 200 400 600 800
0.0
0.2
0.4
0.6
0.8
1.0
1.2
Time (s)
Nor
mal
ised
fluor
esce
nce
(AU
)
Veh.CBX
B
C
No inhibitor DPI NAC Casp. IP EGTA XeC0
2
4
6
8
10
12
Muc
usgr
owth
(μm
/min
)
UntreatedIonomycin
* *
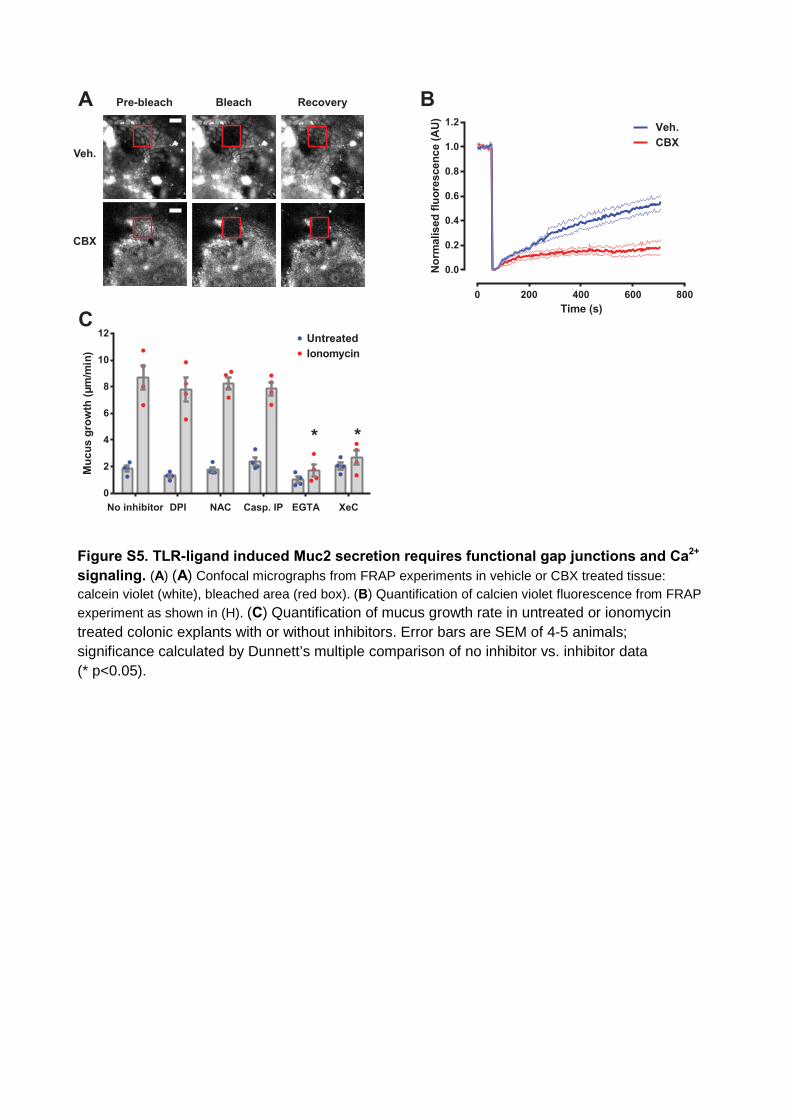
Figure S5. TLR-ligand induced Muc2 secretion requires functional gap junctions and Ca2+
signaling. (A) (A) Confocal micrographs from FRAP experiments in vehicle or CBX treated tissue: calcein violet (white), bleached area (red box). (B) Quantification of calcien violet fluorescence from FRAPexperiment as shown in (H). (C) Quantification of mucus growth rate in untreated or ionomycin treated colonic explants with or without inhibitors. Error bars are SEM of 4-5 animals; significance calculated by Dunnett’s multiple comparison of no inhibitor vs. inhibitor data (* p<0.05).
0 20 40 60 80 10020
22
24
26
28
30
Time (h)
Mas
s(g
)
DSS (3%)
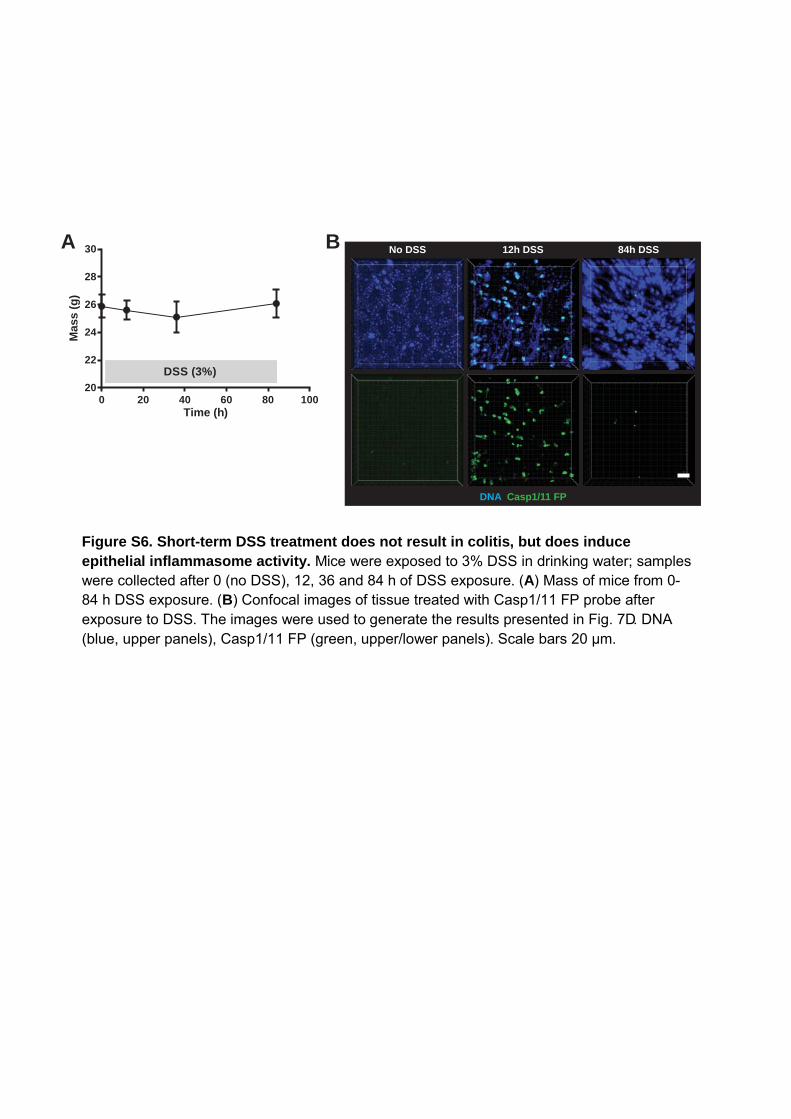
No DSS 12h DSS 84h DSS
DNA Casp1/11 FP
A B
Figure S6. Short-term DSS treatment does not result in colitis, but does induce epithelial inflammasome activity. Mice were exposed to 3% DSS in drinking water; samples were collected after 0 (no DSS), 12, 36 and 84 h of DSS exposure. (A) Mass of mice from 0-84 h DSS exposure. (B) Confocal images of tissue treated with Casp1/11 FP probe after exposure to DSS. The images were used to generate the results presented in Fig. 7D. DNA (blue, upper panels), Casp1/11 FP (green, upper/lower panels). Scale bars 20 μm.
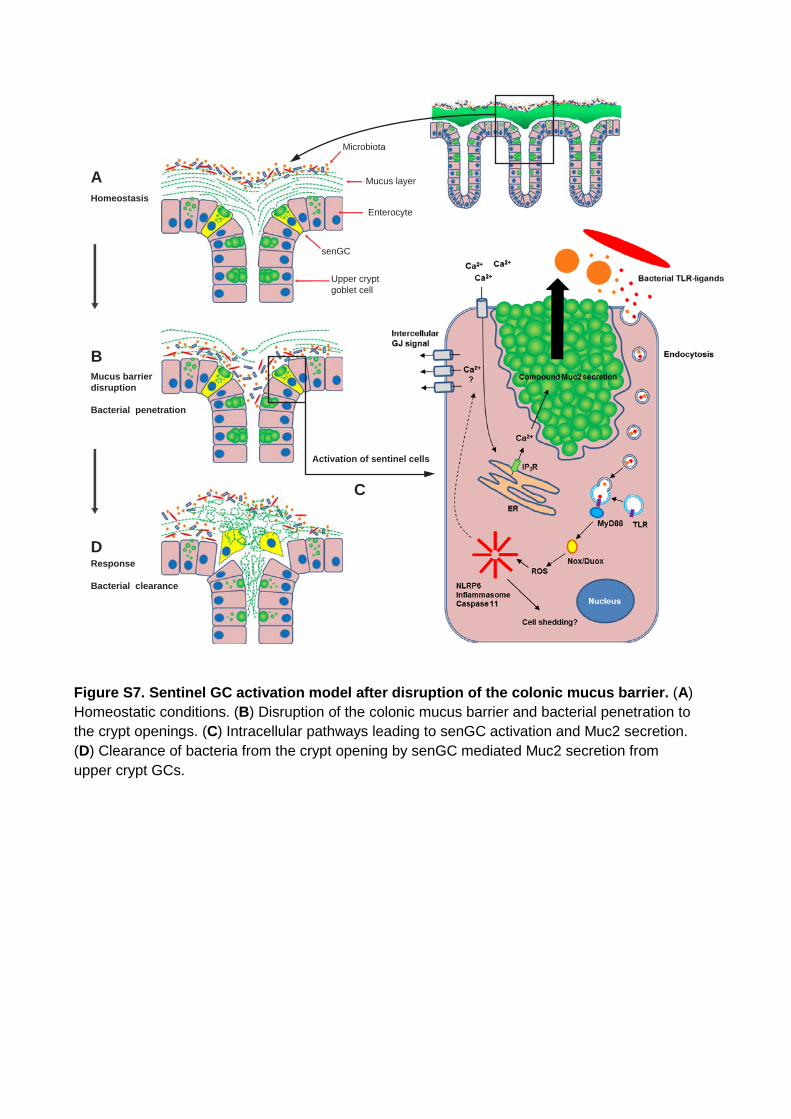
Microbiota
Mucus layer
Enterocyte
senGC
Upper cryptgoblet cell
Homeostasis
Mucus barrierdisruption
Bacterial penetration
Response
Bacterial clearance
A
B
C
D
Activation of sentinel cells
Figure S7. Sentinel GC activation model after disruption of the colonic mucus barrier. (A) Homeostatic conditions. (B) Disruption of the colonic mucus barrier and bacterial penetration to the crypt openings. (C) Intracellular pathways leading to senGC activation and Muc2 secretion. (D) Clearance of bacteria from the crypt opening by senGC mediated Muc2 secretion from upper crypt GCs.
CAPTIONS FOR MOVIES
Movie S1. Vehicle treated RedMUC298trTg colonic explant x/z-axis view of explant imaged by confocal microscopy; vehicle treatment occurred at t=2 min; mCherry-MUC2 (red). This movie is the negative control for Movie S2. Scale bar 40 µm.
Movie S2. LPS treated RedMUC298trTg colonic explant x/z-axis view of explant imaged by confocal microscopy; LPS (0.2 mg/ml) treatment occurred at t=2 min; mCherry-MUC2 (red). Scale bar 40 µm.
Movie S3. LPS treated RedMUC298trTg colonic crypt top view x/y-axis view of explant crypt imaged by confocal microscopy; LPS (0.2 mg/ml) treatment occurred at t=30 sec; mCherry-MUC2 (red), DNA (blue). Scale bar 10 µm.
Movie S4. LPS treated RedMUC298trTg colonic crypt side view x/z-axis view of explant crypt shown in Movie S3; mCherry-MUC2 (red), DNA (blue). Scale bar 10 µm.
Movie S5. LPS treated RedMUC298trTg mCherry-MUC2 isosurface top view x/y-axis view of mCherry-MUC2 mapped isosurfaces from explant crypt shown in Movie S3; LPS (0.2 mg/mL) treatment occurred at t=30 s; senGC (green), responsive GCs (orange) non-responsive GCs (blue), DNA (white). Scale bar 10 µm.
Movie S6. LPS treated RedMUC298trTg mCherry-MUC2 isosurface side view x/z-axis view of mCherry-MUC2 mapped isosurfaces from explant crypt shown in Movie S5; senGC (green), responsive GCs (orange) non-responsive GCs (blue), DNA (white). Scale bar 10 µm.
Movie S7. LPS treated RedMUC298trTg colonic crypt loaded with Fluo4 Ca2+ indicator x/y-axis view of explant crypt imaged by confocal microscopy; LPS (0.2 mg/ml) treatment occurred at t=30 s; mCherry-MUC2 (red), Fluo4 (green), DNA (blue). Scale bar 10 µm.
14
References
1. M. E. V. Johansson, M. Phillipson, J. Petersson, A. Velcich, L. Holm, G. C. Hansson, The inner of the two Muc2 mucin-dependent mucus layers in colon is devoid of bacteria. Proc. Natl. Acad. Sci. U.S.A. 105, 15064–15069 (2008). Medline doi:10.1073/pnas.0803124105
2. D. Ambort, M. E. Johansson, J. K. Gustafsson, H. E. Nilsson, A. Ermund, B. R. Johansson, P. J. Koeck, H. Hebert, G. C. Hansson, Calcium and pH-dependent packing and release of the gel-forming MUC2 mucin. Proc. Natl. Acad. Sci. U.S.A. 109, 5645–5650 (2012). Medline doi:10.1073/pnas.1120269109
3. A. Velcich, W. Yang, J. Heyer, A. Fragale, C. Nicholas, S. Viani, R. Kucherlapati, M. Lipkin, K. Yang, L. Augenlicht, Colorectal cancer in mice genetically deficient in the mucin Muc2. Science 295, 1726–1729 (2002). Medline doi:10.1126/science.1069094
4. S. Rakoff-Nahoum, J. Paglino, F. Eslami-Varzaneh, S. Edberg, R. Medzhitov, Recognition of commensal microflora by Toll-like receptors is required for intestinal homeostasis. Cell 118, 229–241 (2004). Medline doi:10.1016/j.cell.2004.07.002
5. A. L. Frantz, E. W. Rogier, C. R. Weber, L. Shen, D. A. Cohen, L. A. Fenton, M. E. Bruno, C. S. Kaetzel, Targeted deletion of MyD88 in intestinal epithelial cells results in compromised antibacterial immunity associated with downregulation of polymeric immunoglobulin receptor, mucin-2, and antibacterial peptides. Mucosal Immunol. 5, 501–512 (2012). Medline
6. M. Lamkanfi, V. M. Dixit, Mechanisms and functions of inflammasomes. Cell 157, 1013–1022 (2014). Medline doi:10.1016/j.cell.2014.04.007
7. E. Elinav, T. Strowig, A. L. Kau, J. Henao-Mejia, C. A. Thaiss, C. J. Booth, D. R. Peaper, J. Bertin, S. C. Eisenbarth, J. I. Gordon, R. A. Flavell, NLRP6 inflammasome regulates colonic microbial ecology and risk for colitis. Cell 145, 745–757 (2011). Medline doi:10.1016/j.cell.2011.04.022
8. M. E. V. Johansson, Fast renewal of the distal colonic mucus layers by the surface goblet cells as measured by in vivo labeling of mucin glycoproteins. PLOS ONE 7, e41009 (2012). doi:10.1371/journal.pone.0041009
9. K. A. Knoop, K. G. McDonald, S. McCrate, J. R. McDole, R. D. Newberry, Microbial sensing by goblet cells controls immune surveillance of luminal antigens in the colon. Mucosal Immunol. 8, 198–210 (2015). Medline doi:10.1038/mi.2014.58
10. M. Wlodarska, C. A. Thaiss, R. Nowarski, J. Henao-Mejia, J. P. Zhang, E. M. Brown, G. Frankel, M. Levy, M. N. Katz, W. M. Philbrick, E. Elinav, B. B. Finlay, R. A. Flavell, NLRP6 inflammasome orchestrates the colonic host-microbial interface by regulating
goblet cell mucus secretion. Cell 156, 1045–1059 (2014). Medline doi:10.1016/j.cell.2014.01.026
11. D. R. Halm, S. T. Halm, Secretagogue response of goblet cells and columnar cells in human colonic crypts. Am. J. Physiol. 277, C501–C522 (1999). Medline
12. J. K. Gustafsson et al., Am. J. Physiol. 302, G430–G438 (2012).
13. See supplementary materials on Science Online.
14. R. Zhou, A. Tardivel, B. Thorens, I. Choi, J. Tschopp, Thioredoxin-interacting protein links oxidative stress to inflammasome activation. Nat. Immunol. 11, 136–140 (2010). Medline doi:10.1038/ni.1831
15. F. Bauernfeind, E. Bartok, A. Rieger, L. Franchi, G. Núñez, V. Hornung, Cutting edge: Reactive oxygen species inhibitors block priming, but not activation, of the NLRP3 inflammasome. J. Immunol. 187, 613–617 (2011). Medline doi:10.4049/jimmunol.1100613
16. R. D. Specian, M. R. Neutra, Mechanism of rapid mucus secretion in goblet cells stimulated by acetylcholine. J. Cell Biol. 85, 626–640 (1980). Medline doi:10.1083/jcb.85.3.626
17. M. E. V. Johansson, J. K. Gustafsson, K. E. Sjöberg, J. Petersson, L. Holm, H. Sjövall, G. C. Hansson, Bacteria penetrate the inner mucus layer before inflammation in the dextran sulfate colitis model. PLOS ONE 5, e12238 (2010). doi:10.1371/journal.pone.0012238
18. H. E. Jakobsson, A. M. Rodríguez-Piñeiro, A. Schütte, A. Ermund, P. Boysen, M. Bemark, F. Sommer, F. Bäckhed, G. C. Hansson, M. E. Johansson, The composition of the gut microbiota shapes the colon mucus barrier. EMBO Rep. 16, 164–177 (2015). Medline doi:10.15252/embr.201439263
19. M. E. V. Johansson, J. K. Gustafsson, J. Holmén-Larsson, K. S. Jabbar, L. Xia, H. Xu, F. K. Ghishan, F. A. Carvalho, A. T. Gewirtz, H. Sjövall, G. C. Hansson, Bacteria penetrate the normally impenetrable inner colon mucus layer in both murine colitis models and patients with ulcerative colitis. Gut 63, 281–291 (2014). Medline
20. K. S. B. Bergstrom, V. Kissoon-Singh, D. L. Gibson, C. Ma, M. Montero, H. P. Sham, N. Ryz, T. Huang, A. Velcich, B. B. Finlay, K. Chadee, B. A. Vallance, Muc2 protects against lethal infectious colitis by disassociating pathogenic and commensal bacteria from the colonic mucosa. PLOS Pathog. 6, e1000902 (2010). doi:10.1371/journal.ppat.1000902
21. J. R. McDole, L. W. Wheeler, K. G. McDonald, B. Wang, V. Konjufca, K. A. Knoop, R. D. Newberry, M. J. Miller, Goblet cells deliver luminal antigen to CD103+ dendritic cells in the small intestine. Nature 483, 345–349 (2012). Medline doi:10.1038/nature10863
22. P. C. Colony, R. D. Specian, Endocytosis and vesicular traffic in fetal and adult colonic goblet cells. Anat. Rec. 218, 365–372 (1987). Medline doi:10.1002/ar.1092180403
23. A. Panday, M. K. Sahoo, D. Osorio, S. Batra, NADPH oxidases: An overview from structure to innate immunity-associated pathologies. Cell. Mol. Immunol. 12, 5–23 (2015). Medline doi:10.1038/cmi.2014.89
24. K. K. Patel, H. Miyoshi, W. L. Beatty, R. D. Head, N. P. Malvin, K. Cadwell, J. L. Guan, T. Saitoh, S. Akira, P. O. Seglen, M. C. Dinauer, H. W. Virgin, T. S. Stappenbeck, Autophagy proteins control goblet cell function by potentiating reactive oxygen species production. EMBO J. 32, 3130–3144 (2013). Medline doi:10.1038/emboj.2013.233
25. M. E. Sellin, A. A. Müller, B. Felmy, T. Dolowschiak, M. Diard, A. Tardivel, K. M. Maslowski, W. D. Hardt, Epithelium-intrinsic NAIP/NLRC4 inflammasome drives infected enterocyte expulsion to restrict Salmonella replication in the intestinal mucosa. Cell Host Microbe 16, 237–248 (2014). Medline doi:10.1016/j.chom.2014.07.001
26. L. A. Knodler, S. M. Crowley, H. P. Sham, H. Yang, M. Wrande, C. Ma, R. K. Ernst, O. Steele-Mortimer, J. Celli, B. A. Vallance, Noncanonical inflammasome activation of caspase-4/caspase-11 mediates epithelial defenses against enteric bacterial pathogens. Cell Host Microbe 16, 249–256 (2014). Medline doi:10.1016/j.chom.2014.07.002
27. D. Demon, A. Kuchmiy, A. Fossoul, Q. Zhu, T. D. Kanneganti, M. Lamkanfi, Caspase-11 is expressed in the colonic mucosa and protects against dextran sodium sulfate-induced colitis. Mucosal Immunol. 7, 1480–1491 (2014). Medline doi:10.1038/mi.2014.36
28. E. G. Zoetendal, H. G. Heilig, E. S. Klaassens, C. C. Booijink, M. Kleerebezem, H. Smidt, W. M. de Vos, Isolation of DNA from bacterial samples of the human gastrointestinal tract. Nat. Protoc. 1, 870–873 (2006). Medline doi:10.1038/nprot.2006.142