supplementary materials for - science...
TRANSCRIPT

advances.sciencemag.org/cgi/content/full/1/11/e1501086/DC1
Supplementary Materials for
The crystal structure of the global anaerobic transcriptional regulator
FNR explains its extremely fine-tuned monomer-dimer equilibrium
Anne Volbeda, Claudine Darnault, Oriane Renoux, Yvain Nicolet, Juan C. Fontecilla-Camps
Published 4 December 2015, Sci. Adv. 1, e1501086 (2015)
DOI: 10.1126/sciadv.1501086
The PDF file includes:
Materials and Methods
Fig. S1. Stereo view of the electron density of the N-terminal region of holo-FNR
(starting at His19), shown as a black mesh contoured at 1σ.
Fig. S2. Comparison of the α-C helical dimerization interfaces of FNR and other
selected CRP-family members, using deposited structures at the Protein Data
Bank.
Fig. S3. Stereo image viewed down the dimer twofold axis.
Fig. S4. Stereo image of the electron density near the center of the dimer
interface.
Fig. S5. Stereo image of the superposition of FNR (purple) to FixK2 (green)
showing the similar position and orientation of the DNA binding α-F helices at
the bottom of the figure.
Table S1. X-ray data and refinement statistics.
References (24–33)
Materials and Methods
Expression vector for AfFNR. The synthetic gene of AfFNR (GenBank ID ACH67249.1) was
purchased from Genscript™. The DNA sequence was codon optimized for expression in
Escherichia coli and inserted into a pET-15b expression vector (Novagen™) between the NcoI
and BamHI restriction sites. A streptavidin-tag was subsequently inserted between methionine 1
and serine 2 by PCR following the QuikChange® strategy, using the following primers: forward
5´-CACCCGCAGTTCGAAAAGGCAAGCAGTGATAACAGCGCAAATAAACG-3´ and reverse 5´-
CTTTTCGAACTGCGGGTGGCTCCACATGGTATATCTCCTTCTTAAAGTTAAACAAAA-3´ and
Phusion™ polymerase. The integrity of the construction was verified by sequencing the entire
gene. This led to a pStrepAfFNR construct with the following sequence:
ATGTGGAGCCACCCGCAGTTCGAAAAGGCAAGCAGTGATAACAGCGCAAATAAACGTATCCAGA
GCGGCGGTTGCGCCATTCATTGCCAGGATTGTAGCATTTCTCAGCTGTGTATCCCGTTCACCCT
GAACGATTCTGAACTGGATCAGCTGGATGAAATTATCGAACGTAAAAAACCGATCCAGAAAGGC
CAGGAACTGTTTAAAGCGGGTGATGAACTGAAATGCCTGTATGCCATTCGCTCTGGCACCATCA
AAAGTTACACCATTACGGAACAGGGTGATGAACAGATCACGGCATTCCATCTGGCGGGCGATCT
GGTGGGTTTTGATGCCATTACCGAAGCACAGCACCCGAGCTTTGCACAGGCGCTGGAAACGTCT
ATGGTTTGTGAAATTCCGTATGAAATCCTGGATGATCTGAGCGGCAAAATGCCGAAACTGCGTC
AGCAGATTATGCGCCTGATGTCTAATGAAATCAAAGGTGATCAGGAAATGATTCTGCTGCTGAG
CAAGAAAAACGCGGAAGAACGTCTGGCGGCCTTCCTGTACAATCTGAGTACCCGTTTTCATCAG
CGCGGCTTCAGCCCGCGTGAATTTCGCCTGACCATGACGCGCGGCGATATCGGTAACTATCTGG
GCCTGACCGTGGAAACGATTAGCCGTCTGCTGGGTCGCTTTCAGAAAACCGAAATGCTGACGGT
TAAAGGCAAATACATTACCATCAATGATCACGATGCCCTGGCAGAACTGGCGGGTAGCGCCAAA
GAAATTAAATAATGA, which corresponds to the following protein sequence:
MWSHPQFEKASSDNSANKRIQSGGCAIHCQDCSISQLCIPFTLNDSELDQLDEIIERKKPIQKG
QELFKAGDELKCLYAIRSGTIKSYTITEQGDEQITAFHLAGDLVGFDAITEAQHPSFAQALETS
MVCEIPYEILDDLSGKMPKLRQQIMRLMSNEIKGDQEMILLLSKKNAEERLAAFLYNLSTRFHQ
RGFSPREFRLTMTRGDIGNYLGLTVETISRLLGRFQKTEMLTVKGKYITINDHDALAELAGSAK
EIK.
Anaerobic culture of AfFNR using BL21 Escherichia coli cells transformed with the pRSF-
ISC-MetK plasmid (24). Cells were grown in a glove box at 20°C with addition of fumarate,
cysteine, methionine and iron citrate. The induction was carried out by addition of IPTG
(isopropyl β-D-1-thiogalactopyranoside) when the cultures reached an OD600 = 1. After
overnight growth in the glove box, cells were pelleted by centrifugation for 15 min at 6000 rpm
and then stored at -80 °C.
Protein purification. The pelleted cells were thawed, resuspended in tampon A (50 mM Tris
pH 8, 300 mM NaCl) and disrupted by sonication in the glove box. Next, the sonicated sample
was centrifuged for 45 min at 15,000 rpm and the supernatant was injected to a Strep-tactin
superflow column (10 ml, IBA®) (Akta purifier, GE) previously equilibrated with 100 mM Tris
pH 10, 150 mM NaCl. The column was then washed with 6 column volumes of tampon A in the
glove box followed by 3 column volumes of tampon A + 2.5 mM desthiobiotine. Fractions
containing purified AfFNR, as verified by SDS-PAGE, were pooled and shown to contain a total
of 16.3 mg of protein in 51 mL (determined by the Rose Bengal method (25). After about 8-fold
concentration by ultrafiltration the protein solution was applied to a Superdex 200 Hiload 16/60
(120mL) column previously equilibrated with tampon A + 2 mM DTT. After verification of the
protein purity by SDS-PAGE, a volume of 47 mL was obtained by pooling the relevant fractions.
The total amount of protein was 15.51 mg as determined by the Rose Bengal method. AfFNR
was then concentrated by ultrafiltration with tampon A to 2.5 mg/ml and frozen in liquid N2 in
either 100 L or 500 L aliquots.
Preparation of an AfFNR sample for aerobic studies. A 500 L aliquot of AfFNR prepared as
described in the Protein purification paragraph was thawed and diluted to 0.5 mg/mL with
tampon A + 2 mM -mercaptoethanol in the glove box (the latter was used to prevent protein
aggregation). 180 L of this solution were then poured into a cuvette that was then sealed and
taken out of the glove box.
Stability of the [4Fe-4S] cluster as a function of time upon air exposure. UV/visible spectra
of the previous sample were recorded after being exposed to air at t = 0, 15 min, 60 min, 330
min, and overnight. Selected times are shown in Fig. 1A.
Dimer-monomer equilibrium as a function of time upon air exposure. The stability of the
starting dimeric anaerobic AfFNR was determined by size-exclusion chromatography using a
calibrated Superdex 200 HR 10/30 column (GE) using a sample prepared as described above.
The protein was eluted using tampon A + 2 mM -mercaptoethanol. After overnight exposure to
air AfFNR was mostly monomeric. Conversely, an identical anaerobic sample applied to a
Superdex 200 HR 10/30 column inside the glove box was dimeric. These results are summarized
in Fig. 1B.
Crystallization. Initial AfFNR crystals were obtained using the sitting drop vapor diffusion
method and a high throughput screening strategy with a Gryphon robot (AriRobbins, CA, USA)
inside a glove box. Thin brown plates were thereafter manually obtained from 1:1 mixtures of a
solution containing 50 mM Tris base, pH 8.0, 30 mM NaCl, 2 mM dithionite and 5 mg/mL of
anaerobically prepared AfFNR and crystallization solutions composed of 16 to 18% methyl
pentanediol, 100 mM MES, pH 6 to 6.6 and 25 mM LiCl. Because some crystals contained
degraded iron-sulfur clusters (see text and Table S1) 2 mM dithionite were added to subsequent
assays.
X-ray data collection and structure determination. All the X-ray data used here were
collected at the European Synchrotron Radiation Facility (ESRF) in Grenoble, at beam lines
BM30A, ID23eh1 and ID23eh2. Initially, two data sets were collected at BM30A at = 0.97972
and = 1.74147Å to 3.15 Å and 3.3 Å resolution, respectively. Fe absorption edge spectra of
FNR crystals were measured with a Roentec X-Flash multi channel analyzer. The program
CHOOCH (26) was then used to select the X-ray wavelength providing the maximal iron
anomalous signal for the 3.15 Å resolution data. X-ray diffraction data were indexed, integrated
and scaled with XDS (27). A final scaling and merging step was performed with the AIMLESS
program (28) of the CCP4 package (29). X-ray data statistics for the crystals used are given in
Table S1. A molecular replacement (MR) solution for FNR was obtained with the program
PHASER (30), using the related FixK2 structure (17), which has 24% amino acid sequence
identity to AfFNR, as a search model. This solution was confirmed by the presence of a
significant peak in a 5 Å resolution MR-phased anomalous electron density difference map close
to the Cys122 thiolate, a known ligand of the [4Fe-4S] cluster (1). Initial structure refinement
was performed with REFMAC5 (31), using COOT (32) for manual model corrections. In order to
improve the resolution, we then rapidly collected highly redundant holo-FNR X-ray data from
three volumes of the same tetragonal I422 crystal taking advantage of the high beam intensity at
the ID23eh2 microfocus beam line. This procedure allowed us to collect 120° of data for each
volume within 80 sec on a Pilatus detector, and extended the resolution to 2.65 Å. Due to the
intrinsic disorder of our crystals the data were very weak in the highest resolution shell.
However, the corresponding CC1/2 correlation coefficient between random half data sets was still
significant (Table S1), which justified the choice of resolution cutoff (28). In addition, we
collected data from the same crystal at the Fe absorption edge and used the hybrid substructure
search in the PHENIX package (33) to obtain independent single anomalous dispersion (SAD)
phase information. After combining molecular replacement and SAD phases using the MR-SAD
Phaser mode in PHENIX an interpretable electron density map could be obtained for most of the
more disordered parts of the N-terminal region of holo-FNR. We also used PHENIX for the final
refinement of atomic positions (xyz) and grouped B-factors, including refinement of TLS groups
that were automatically selected by the program (33). Final refinement statistics are given in
table S1.

Figures
Fig. S1. Stereo view of the electron density of the N-terminal region of holo-FNR (starting at
His19), shown as a black mesh contoured at 1. The corresponding anomalous difference map is
shown as a pink peak contoured at 7 as in Fig 1C. The C-trace of the main chain is depicted in
green.
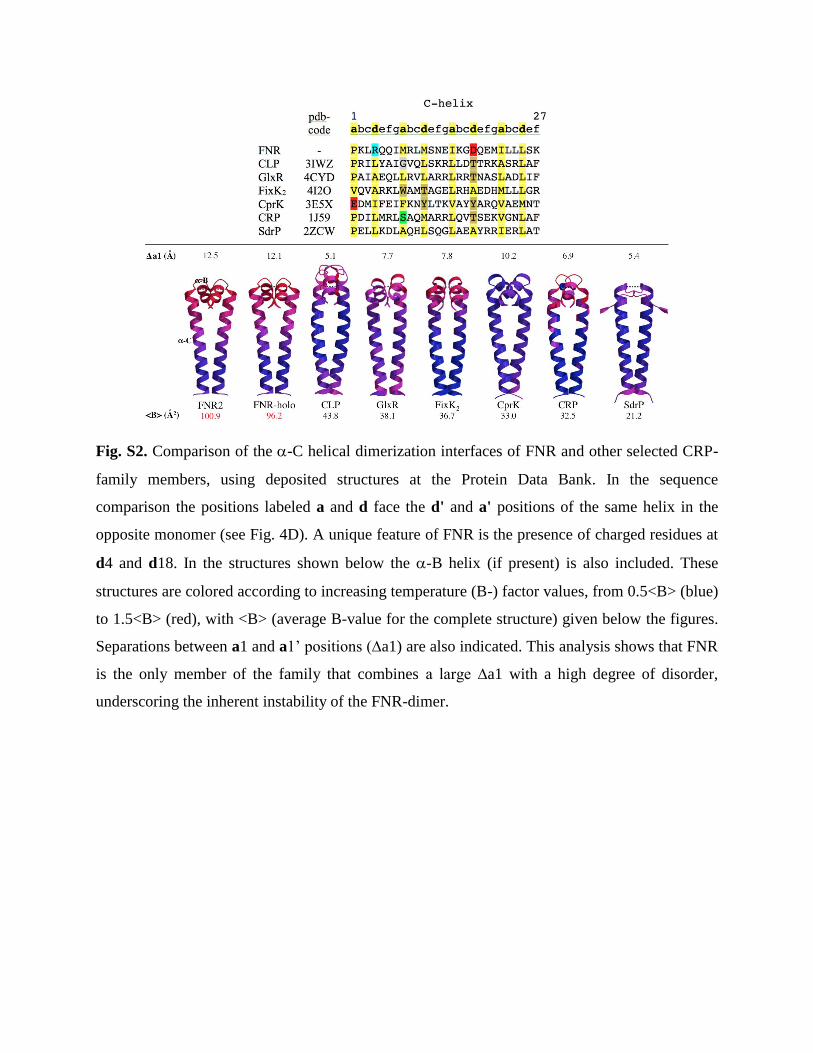
Fig. S2. Comparison of the -C helical dimerization interfaces of FNR and other selected CRP-
family members, using deposited structures at the Protein Data Bank. In the sequence
comparison the positions labeled a and d face the d' and a' positions of the same helix in the
opposite monomer (see Fig. 4D). A unique feature of FNR is the presence of charged residues at
d4 and d18. In the structures shown below the -B helix (if present) is also included. These
structures are colored according to increasing temperature (B-) factor values, from 0.5<B> (blue)
to 1.5<B> (red), with <B> (average B-value for the complete structure) given below the figures.
Separations between a1 and a1’ positions (∆a1) are also indicated. This analysis shows that FNR
is the only member of the family that combines a large ∆a1 with a high degree of disorder,
underscoring the inherent instability of the FNR-dimer.
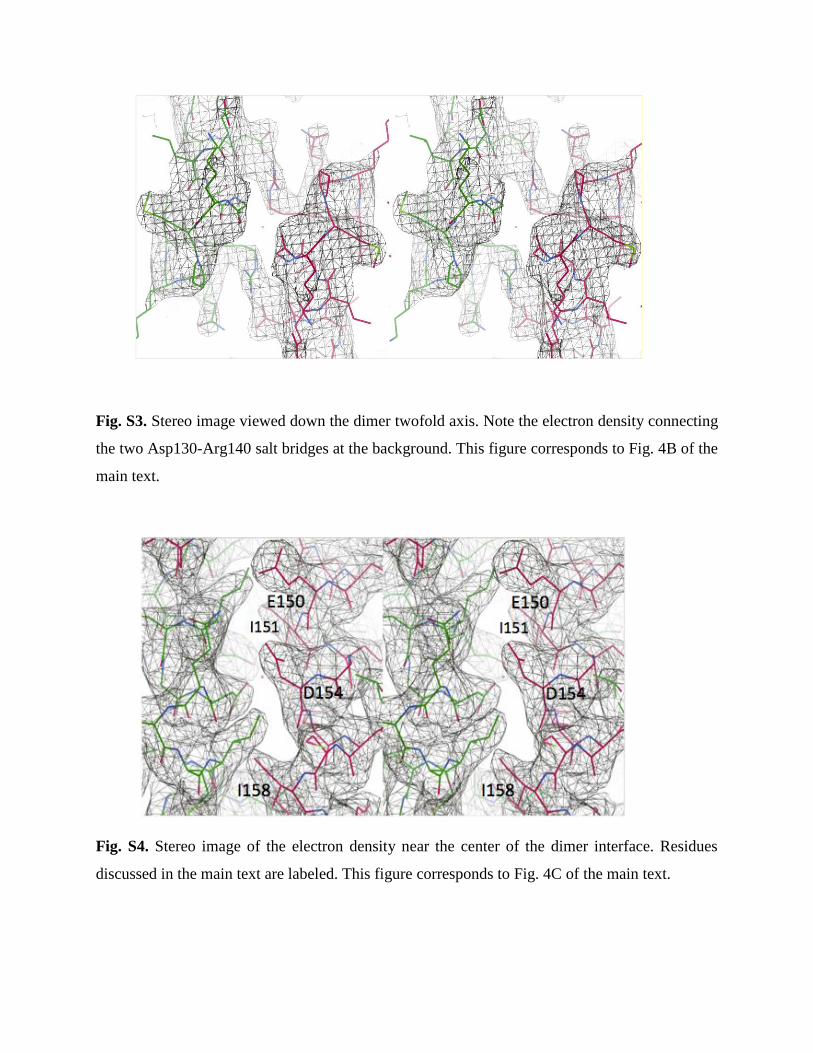
Fig. S3. Stereo image viewed down the dimer twofold axis. Note the electron density connecting
the two Asp130-Arg140 salt bridges at the background. This figure corresponds to Fig. 4B of the
main text.
Fig. S4. Stereo image of the electron density near the center of the dimer interface. Residues
discussed in the main text are labeled. This figure corresponds to Fig. 4C of the main text.

Fig. S5. Stereo image of the superposition of FNR (purple) to FixK2 (green) showing the similar
position and orientation of the DNA binding -F helices at the bottom of the figure.

Table S1. X-ray data and refinement statistics.
Crystal Holo-FNR Holo-FNR FNR2#
Data collection
ESRF beamline ID23eh2 BM30a ID23eh1
Wavelength (Å) 0.87260 1.74028 0.97242
Space group I422 I422 I422
Cell dimensions: a, b, c (Å) 75.2, 75.2, 218.1 75.5, 75.5, 218.1 75.3, 75.3, 212.4
Molecules/asymmetric unit 1 1 1
Resolution (Å) 47.9-2.65 (2.74-2.65) 47.9-2.65 (2.75-2.65) 47.6-2.60 (2.69-2.60)
Measured reflections 244263 (23228) 97063 (9176) 126067 (12722)
Unique reflections 9609 (899) 9524 (900) 9847 (938)
Redundancy 25.4 (25.8) 10.2 (10.2) 12.8 (13.6)
Completeness (%) 99.8 (97.9) 98.4 (98.1) 99.9 (99.9)
Rmerge (%)* 17.2 (438.9) 10.1 (371.8) 9.1 (240.7)
Rpim (%)* 4.8 (123.3) 4.5 (170.5) 3.7 (95.3)
CC1/2* 0.997 (0.376) 0.997 (0.340) 1.000 (0.586)
<I/I> 14.2 (1.0) 18.3 (0.7) 21.1 (1.3)
Refinement
Resolution (Å) 47.9-2.65 37.6-2.6
Number of reflections 17484 17948
Rwork (%) 18.8 19.1
Rfree (%) 24.2 23.7
Number of atoms
All 1795 1626
Fe (in FeS cluster) 4 2
S (in FeS cluster) 4 2
Water 0 8
Others (in MPD) 16 24
Number of TLS groups 4 10
Average B-factors (Å2)
Domain 1 (Nt-126) 108.3 114.6
Domain 2 (127-163) 101.1 108.1
Domain 3 (164-248) 79.9 85.1
R.m.s. deviations
Bond lengths (Å) 0.013 0.009
Bond angles (°) 1.5 1.2
Ramachandran plot statistics (%)
Most favored 89.0 92.6
Allowed 11.0 6.9
Disallowed 0.0 0.5
* as defined in (28);
# Although the crystals used to solve the two structures were grown and flash-cooled under equivalent anaerobic
conditions, the one with degraded cluster (FNR2) sat in the glove box over two months prior to flash cooling.

Conversely, the crystal containing holo-AfFNR was flash-cooled only 8 days after setting the crystallization drops.
We have already observed long-term iron-cluster degradation at about 1ppm O2 (22) and here we speculate that slow
O2 release from plastic ware within the glove box may be responsible for this effect.
$ Bijvoet pairs were treated as independent observations. This allowed the inclusion of the anomalous contributions
from Fe and S atoms in the refinement procedure, which gave significantly improved refinement statistics.