supplementary materials for - science...
TRANSCRIPT

www.sciencesignaling.org/cgi/content/full/7/311/ra12/DC1
Supplementary Materials for
Interconnected Network Motifs Control Podocyte Morphology and Kidney Function
Evren U. Azeloglu, Simon V. Hardy, Narat John Eungdamrong, Yibang Chen, Gomathi Jayaraman, Peter Y. Chuang, Wei Fang, Huabao Xiong, Susana R. Neves, Mohit R. Jain,
Hong Li, Avi Ma’ayan, Ronald E. Gordon, John Cijiang He,* Ravi Iyengar*
*Corresponding author. E-mail: [email protected] (R.I.); [email protected] (J.C.H.)
Published 4 February 2014, Sci. Signal. 7, ra12 (2014) DOI: 10.1126/scisignal.2004621
Thes PDF file includes:
Methods Fig. S1. Results for enrichment analysis for down-regulated proteomic components in glomeruli from puromycin-induced nephropathy animals. Fig. S2. Enrichment analysis for the second proteomics experiment (biological replicate) with puromycin-induced nephropathy rats. Fig. S3. Protein-protein interaction network constructed with down-regulated components as seed nodes along with one intermediate. Fig. S4. Multimodal experimental constraints for the multicompartmental dynamic model of cAMP/PKA signaling network topology. Fig. S5. Analysis of CREB activity by EMSA to confirm CREB binding to DNA. Fig. S6. Process for building dynamic graphs and visual summary of the associated computational methods. Fig. S7. Dynamic graphs of individual component and motif activities. Fig. S8. Relative contribution of FFM paths and their lifetimes. Fig. S9. Spread of RT-PCR and morphometric data for animal studies. Fig. S10. High-magnification transmission electron microscopy (TEM) images showing in vivo actin bundles. Table S1. Proteins that were significantly up- or down-regulated according to differential proteomics of glomeruli from control (saline-injected) and puromycin-injected rats. Table S2. Abundance of different PKA subunits as measured by the two independent proteomic experiments. Table S3. Simulation parameters for the computational model. Table S4. Parameter normalized local sensitivity analysis.

Table S5. Abundance of glomerular and tubular markers as quantified by proteomic analysis. References (48–93)

SUPPLEMENTARY METHODS Electrophoretic Mobility Shift Assay (EMSA) The sequence for the double-stranded DNA that binds CREB was used for the synthesis of the following oligonucleotides 5’-TCAAATTGACGTCATGGTAA-3’ and 5’-TTACCATGACGTCAATTTGA-3’. DNA probes were prepared by annealing complementary single-stranded oligonucleotides with 5’GATC overhangs (Genosys Biotechnologies, Inc.) and labeled by filling in with [α-32P]dGTP and [α -32P]dCTP using Klenow enzyme. DNA-binding complexes were separated by electrophoresis on a 5% polyacrylamide-Tris/glycine-EDTA gel, which was dried and exposed to X-ray film. The specificity of DNA-protein binding was verified by incubation with 100-fold excess of cold probe and by super-shifted with specific anti-CREB antibody (Cell Signaling Technology). All experiments were repeated at least 3 times and representative experiments are shown here. MAPK 1,2 Kinase Enzyme Activity Assay This assay was done in two parts: immunoprecipitation of MAPK1,2 and determination of MAPK1,2 activity using a radio-assay kit (Upstate MAP Kinase/ Erk Assay). Briefly, podocytes lysates were immunoprecipitated by incubating with 4 µg of anti-MAPK1,2 antibody (Cell Signaling) at room temperature for 1hr, followed by further incubation at 4oC with 60 ml of protein A/G plus agarose beads (Santa Cruz, CA) for overnight. Immunoprecipites (50µg) were incubated with 15 mM MgCl2, 1.00mM ATP, γ-P32 ATP (10000 to 16000 CPM), 4mM MOPS pH7.2, 5mM b-glycerol phosphate, 1mM EGTA, 0.2mM sodium orthovanadate, 0.2mM dithiothreitol with 4mM PKC inhibitor (catalog # 12-121), 0.5M PKA inhibitor (PKI) (catalog # 12-151), and 4mM compound R24571. After incubation for 10 minutes, the reaction was stopped and 25ml of reaction mixture were pipetted slowly onto the center of a P81 phosphocellulose papers. After washing with 0.75% phosphoric acid in water and 0.75% phosphoric acid in ethanol, the papers were dried and counted in 5ml of scintillation biodegradable cocktail EcoLife (ICN Biomedicals) using a scintillation counter (Beckman LS6500). Experiments were done in triplicates and each experiment was repeated for at least 3 times. MAP kinase activities were normalized by total immunoprecipited MAPK1,2, as determined by densitometric analysis of bands in Western blot. Evaluation of Glomerular Purity In order to ensure purity, glomeruli, which were isolated in 4ºC immediately following the sacrifice of the animal, were inspected under low power light microscopy for tubular contamination. Accordingly, no large pieces of proximal tubules were visible. We further analyzed proteomic spectral abundance (48) for the 15 well-known glomerular proteins comparing them against 10 well-known tubular proteins. The results of protein abundance analysis are presented in table S5 below. Dynamic Graphs
Dynamic graphs were built from the compartmental ODE model developed with Virtual Cell. A Petri net representation of the model was created with the SBML conversion feature of the software Snoopy (49). First, the results of a p-invariant analysis were used to create an interaction graph of the model. Then, the results of a t-invariant analysis on every p-invariant subnets were used to create an influence graph of the model [for more information on Petri net theory and related analysis methods, see David and Alla (50)]. In parallel, the numerical data from the simulation of the mathematical model in Virtual Cell was used to compute activation and reaction flow values to assign color intensities to the nodes and edges of the influence graph. The result is one intensity graph with shaded nodes and edges for each simulation time step (fig S6). Assembled together , these graphs of changing shades form a dynamic graph and

can be visualized as a movie (fig. S7). Such a movie is akin to a cartoon movie in which each frame is shown as a fixed temporal sequence. Because, here frames arise from ODE simulation, the dynamics show the rate of change of reaction and state of the component. The nodes are assigned different shading (or coloration) to represent a, the percentage of activation
of the signaling component out of the total concentration. The value is the
ratio of the sum of all active states of a given signaling component (e.g. multiple subunits) over the total concentration of this component. Except for cAMP, MKP1, and MKP1 mRNA, the total concentration of signaling components is constant over time. The edges are assigned grayscale shades to represent r, the percentage of reaction flow of an interaction out of the maximal value.
The value is a measure of the relative reaction flow value using the
maximum attained during the simulation as the denominator. For the incoming edges on the nodes MEK, PKAn, MAPKc, and CREB, the same denominator was used for all edges to allow for visual comparison. Also, the maxima from the simulations with the Isoproterenol-dependent activation were used to generate the dynamic graphs of the two other simulations. See fig. S6 for a visual summary of the method for building a dynamic graph, and Hardy and Iyengar (51) for more information. Computational Assessment of Motif Lifetime The lifetime of a FFM is the period during which the output of the motif is above the threshold that will cause an arbitrary level of activation of the ultimate output of the signaling pathway. In this study, we used a 33% level of CREB activation. Thresholds for regulatory motifs activation are determined from the values of the downstream signal amplification. The signal amplification A of one enzymatic reaction, for example ** YY X⎯→⎯ where Y is phosphorylated by X* and
YY P⎯→⎯* where Y* is dephosphorylated by P, corresponds to the following equation:
*]/[*]/[
YJXJA
YP
XYXY = , where J is the reaction flow of this reaction. An amplification value greater
than 1 means that the signal is amplified at that step. The product of all amplifications between the source and the output of a linear signaling cascade is the signal amplification value of this path. If the path comprises a coherent OR FFM in which the two paths of the FFM activate the target, then the summation of the amplification values from the two paths is used. As we defined it, the signal amplification value is a linear simplification of nonlinear reactions, thus it is time-dependent. This measure of motif activity, as opposed to individual component activity, is based on the work of Heinrich et al. (52). For example, the FFM1 is deemed active when the product of the output of the motif [Raf*] and the signal amplification value of the downstream path up to CREB is equal or above 33% of the maximum concentration of active CREB. The start of the lifetime bars is the time point when this product is above the threshold and the end is when it goes below. Simply put, a FFM is defined as active when its downstream target reaches an activity level above a defined threshold.
ionconcentrat total
stateactivean is
][
X
X
ai
i∑=
)max(components wobetween t
flowreaction a is
components wobetween t flowreaction a is
∑
∑=
ii
ii
J
J
r

A)
Supplementary Figure S1
B)
C)
D)
MP0009643_abnormal_urine_homeostasis_
MP0002083_premature_death_
MP0002135_abnormal_kidney_morphology_
MP0002066_abnormal_motor_capabilities/c_
MP0003186_abnormal_redox_activity_
MP0005332_abnormal_amino_acid_
MP0009642_abnormal_blood_homeostasis_
MP0002136_abnormal_kidney_physiology_
MP0000003_abnormal_adipose_tissue_
MP0010770_preweaning_lethality_
mitochondrion (GO:0005739)
cell projection membrane (GO:0031253)
mitochondrial intermembrane space (GO:0005758)
basolateral plasma membrane (GO:0016323)
mitochondrial part (GO:0044429)
cytosol (GO:0005829)
cell surface (GO:0009986)
membrane raft (GO:0045121)
mitochondrial matrix (GO:0005759)
actin cytoskeleton (GO:0015629)
kidney
liver
heart
adipose_white
intestine_small
B-cells_marginal_zone
osteoblast_day21
pancreas
macrophage_bone_marrow_2hr_LPS
ciliary_bodies
Kidney
Liver
Fetalliver
Placenta
Adipocyte
PrefrontalCortex
721_B_lymphoblasts
Ovary
Amygdala
Appendix
Figure S1. Results for enrichment analysis for down regulated proteomic components in glom-eruli from puromycin-induced nephropathy animals. Green arrows point to concepts pertinent to differentiation of podocytes, which were significantly enriched (Fisher exact test with Bonferroni correc-tion). Bar size indicates normalized negative-log of p-values. Top enriched terms according to (A) Mouse Genome Informatics Mammalian Phenotype Ontology, (B) Gene Ontology, cellular component, (C) Mouse Gene Atlas, and (D) Human Gene Atlas.
-

0 0.5 1 1.5 2 2.5
EGFR PRKACA
PKD1 CAMK2D CAMK2B CAMK2G
SRC CSNK1A1
PAK2 PRKCA
MAP2K2 OXSR1 PRKCD PIK3CB
BCR
-log(p-value)
Supplementary Figure S2A
ctn
4C
d2a
pD
dn
Ptp
rdK
irre
lM
agi2
Np
hs1
Pard
3bPd
lim2
Np
hs2
Sem
a3g
Iqg
ap1
Arf
6M
ertk
Pod
xlG
apd
hLd
ha
Vd
ac2
Mrp
s31
Tub
a1a
Act
bN
up
155
Cg
nK
rt18
Krt
8N
esTj
p2
F11r
MP0009643_abnormal_urine_homeostasis_
MP0004272_abnormal_basement_membrane_
MP0002136_abnormal_kidney_physiology_
MP0002135_abnormal_kidney_morphology_
MP0000001_mammalian_phenotype_
MP0001756_abnormal_urination_
MP0002066_abnormal_motor_capabilities/c_
MP0005636_abnormal_mineral_homeostasis_
MP0001765_abnormal_ion_homeostasis_
MP0001243_abnormal_dermal_layer_
Kidney
Adipocyte
SubthalamicNucleus
Lung
Colorectaladenocarcinoma
colon
Liver
CardiacMyocytes
SmoothMuscle
Ovary
A)
B)
C) D)
Log2 Change: -0.6 0 0.6
Figure S2. Enrichment analysis for the second proteomics experiment (biological replicate) with puromycin-induced nephropathy rats. (A) List of top 15 upstream kinases with their negative-log p-values. (B) Protein abundance of podocyte differentiation markers, housekeeping markers, and de-differentiation markers. (C) Enrichment analysis for the highest ranked MGI ontology terms. (D) Enrichment analysis for the highest ranked Human Gene Atlas terms.

Supplementary Figure S3Figure S3. Protein-protein interaction network constructed with down-regulated components as seed nodes along with one intermediate. The 91 down-regulated proteins were used as seed nodes (red) along with single intermediate genes (green) from the X2K suite. The final network has 212 nodes and 948 edges. Enrichment analysis using this signaling network also ranked PKA as a significant upstream kinase (p < 0.001, Fisher exact test).

Supplementary Figure S4
B)
0 15 30 450.0
0.5
1.0
1.5Iso + U0126 (exp)Iso + MEK inhibition(sim)
t (min.)
[CR
EB*]
(AU
)
0 15 30 450.0
0.5
1.0
1.5Iso + Rp-cAMPs (exp)Iso + PKA-DN (exp)Iso + PKA inhibition(sim)
t (min.)
[CR
EB*]
(AU
)
0 15 30 450.0
0.5
1.0
1.5Iso (exp)Iso (sim)
t (min.)
[CR
EB*]
(AU
)
A)
Iso + U0126
Iso+ PKA-DN
Iso+ Rp-cAMPs
CREB*
Total CREB
CREB*
Total CREB
CREB*
Total CREB
0 5 10 15 30 45
0 5 10 15 30 45
0 5 10 15 30 45
time (min.)
IsoCREB*
Total CREB
Figure S4. Multimodal experimental constraints for the multicompartmental dynamic model of cAMP/PKA signaling network topology. (A) Cultured podocytes were stimulated with 10 μM isoproter-enol under control conditions, with U0126, with Rp-cAMP, or when transfected with dominant-negative PKA (PKA-DN). The amount of active CREB* (Ser133 -phosphorylated CREB) was measured by immu-noblotting. (B) Time courses comparing numerical simulations and experiments of the relative amount of active CREB under various treatment conditions and model predictions (duplicate of Fig. 4). (C) Cells were treated with 100 μM of the cAMP GEF-selective agonist 8-pMeOPT-2'-O-Me-cAMP or 100 μM of the PKA-selective agonist 6-Bnz-cAMP. The amount of activated MAPK (MAPK*) was quantified by immu-noblotting. (D) Cells transfected with wild-type Rap1 (Rap1-WT) or dominant-negative Rap1 (Rap-DN) were stimulated with isoproterenol. The amount of activated MAPK was analyzed by immunoblotting. (E) Podocytes treated with Rp-cAMPs were stimulated with isoproterenol, and active MAPK and total MAPK were measured by immunoblotting. (F) Podocytes treated with Rp-cAMPs or U0126 were stimulated with isoproterenol, and the amount of MAPK activity for the whole cell was measured by radio enzyme activity assay. All quantified data are presented as mean ± SEM of at least 3 experiments.

Supplementary Figure S4 (continued)
D)
C)
Iso + Rap1-DN
Iso + Rap1-WT
time (min.) 0 5 10 15 30 45
MAPK*Total MAPK
MAPK*Total MAPK
8-p-MeOPT-cAMP
6-Bnz-cAMP
time (min.) 0 5 10 15 30 45
MAPK*Total MAPK
MAPK*Total MAPK
0 15 30 450.0
0.5
1.0
1.58-p-MeOPT-cAMP6-Bnz-cAMP
t (min.)
[MAP
K*]
(AU
)
0 15 30 450.0
0.5
1.0
1.5Iso + Rap1-WTIso + Rap1-DN
t (min.)
[MAP
K*]
(AU
)
PKA b-Raf
MEK
MAPK
cAMP-GEF Rap1cAMP
Rap1-DN
6-Bnz-cAMP
PKA b-Raf
MEK
MAPK
cAMP-GEF Rap1
8-p-MeOPT-cAMP E)
F)
Iso
Iso+ Rp-cAMPs
0 5 10 15 30 45time (min.)
MAPK*
Total MAPK
MAPK*
Total MAPK
0 15 30 450.0
0.5
1.0
1.5IsoIso + Rp-cAMPs
t (min.)
[MAP
K*]
(AU
)
0 15 30 450
2000
4000
6000
8000
10000IsoIso + Rp-cAMPsIso + U0126
t (min.)
MAP
K k
inas
e ac
tivity
(cpm
/mg
tota
l pro
tein
)
PKA b-Raf
MEK
MAPK
cAMP-GEF Rap1cAMP
Rp-cAMPs
U0126
FFM1

CREB
Total CREB
0 5 10 15 30 C STime (min.)
Iso Iso +U0126
Iso + PKA-DN
0 5 10 15 30 0 5 10 15 30
Supplementary Figure S5Figure S5. Analysis of CREB activity by EMSA to confirm CREB binding to DNA. The activities of CREB under various conditions were measured by electrophoretic mobility shift assay (EMSA) in the presence of MEK inhibition with U0126 or PKA inhibition with PKA-DN. After stimulation with 10 μM isoproternol for the indicated time interval, nuclear proteins were extracted. EMSA were performed with 105 cpm of labeled probe (CREB: 5’- CAAATTGACGTCATGGTAA -3’; 5’- TTACCATGACGTCAATTT-GA-3’) and 5 mg of nuclear extracts. The DNA binding complexes were separated on 5% polyacrylamide gel, and then exposed to X-ray film. The specificity of DNA-protein binding was verified by incubation with excess unlabeled probe and by super-shifting with specific antibody for CREB. Loading controls of nuclear proteins were verified by immunoblot of total CREB. C, cold probe control; S, supershift.

From ODE to influence graph with Petri nets theory
Numerical simulation and mapping of results onto graph
Petri net model
Interaction graph
In�uence graph
Dynamic graphs
Implementation of model in Virtual Cell Numerical data
Mathematical model
Supplementary Figure S6Figure S6. Process for building dynamic graphs and visual summary of the associated computa-tional methods. Schema of the different steps to build a dynamic graph from a mathematical model using Petri net theory. There are two parallel series of steps. In the first series, the mathematical model is converted into a Petri net model. An undirected interaction graph and then an influence graph are built using p- and t-invariant analysis. In the second series, the mathematical model is simulated using Virtual Cell. Shading (coloration) for the nodes and edges of the influence graph are computed from the numeri-cal simulation data as explained in Supplementary methods: Dynamics Graphs. The result is a set of graphs with nodes and edges of varying shades that are assembled together to form a dynamic graph.

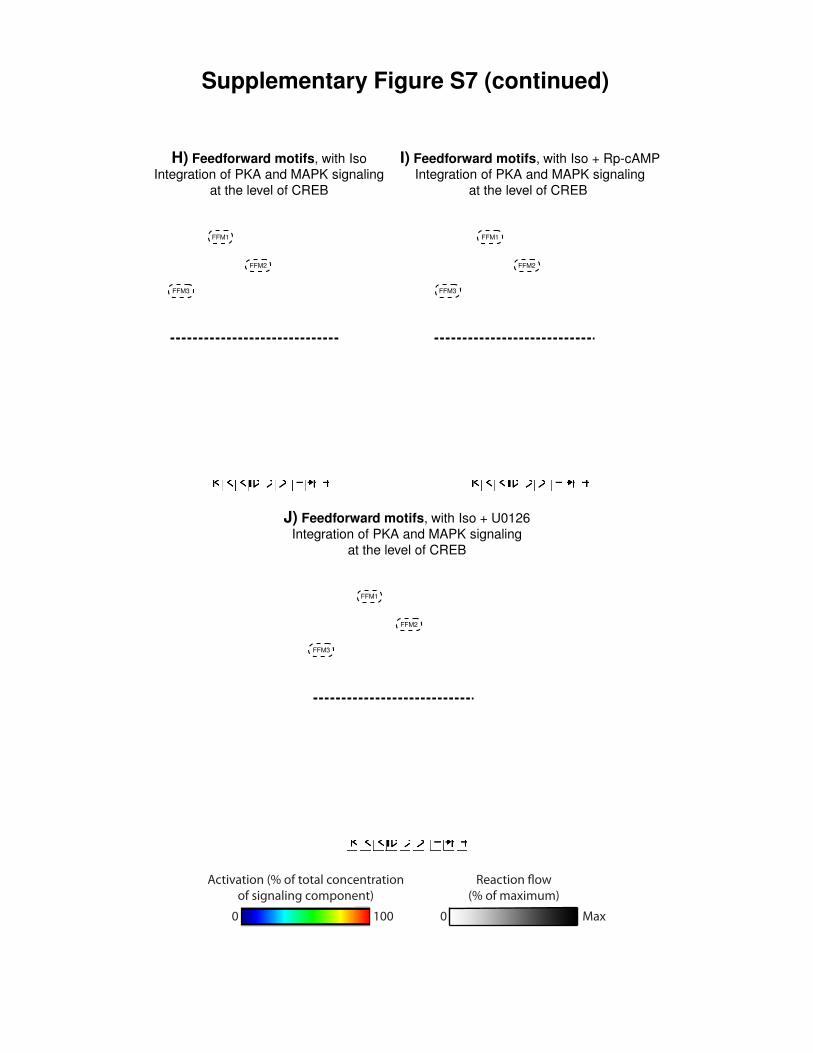
Figure S7: Dynamic graphs of individual component and motif activities. (A) Dynamic graphs that highlight the activity and flux levels of the three feedforward motifs (FFMs) upon -adrenergic receptor stimulation under baseline conditions (top), PKA inhibition (middle), and MEK inhibition (bottom). Fig. S7A is the interactive duplicate of Fig. 4. The FFMs are shown as diamonds and the components in the pathway are shown as ovals. The activities of the simulated feedforward motifs (diamonds) are depicted with color-coded scales; cAMP and CREB activities are depicted in grayscale. The intensity of the relationship lines represents the percent of the activity through that reaction with dashed lines representing indirect and solid lines representing direct interactions. (B) Dynamic graph of the complete model showing isoproterenol (ISO)-stimulated activity and flux levels for individual components and reactions, respectively. Graph was built from simulation data of the computational model at baseline conditions with ISO stimulation. The dashed arc represents an interaction by an unknown direct or indirect mechanism. Dashed borders represent boundaries between membrane, cytoplasmic, and nuclear compartments. The time shown is the simulation time. (C) Dynamic graph of FFM1 between cAMP and MEK after isoproterenol stimulation. (D) Dynamic graph of FFM1 between cAMP and MEK after isoproterenol stimulation with inhibition of PKA. (E) Dynamic graph of FFM2 between cAMP and MAPK after isoproterenol stimulation. (F) Dynamic graph of FFM2 between cAMP and MAPK after isoproterenol stimulation with inhibition of PKA. (G) Dynamic graph of FFM3 between cAMP and PKA after isoproterenol stimulation. (H) Dynamic graph of nested FFMs between cAMP and CREB after isoproterenol stimulation. (I) Dynamic graph of nested FFMs between cAMP and CREB after isoproterenol stimulation with inhibition of PKA. (J) Dynamic graph of nested FFMs between cAMP and CREB after isoproterenol stimulation with inhibition of MEK. Note: In the electronic version, all the dynamic graphs in this figure are interactive, and they can be animated by the control panels at the bottom. This function is available only in Adobe Acrobat Reader 6 or higher.
Supplementary Figure S7

Supplementary Figure S7
A) Note: Click on the network diagrams on the left to animate (available only in Adobe Acrobat 6 or higher)
CREB
cAMP
FFM1
FFM2
FFM3
Ac
tiv
ati
on
of
Ind
ivid
ua
l Co
mp
on
en
ts (
% o
f m
ax
imu
m)
Dynamics of feedforward motifs at baseline
0
0,5
1
1,5
0 15 30 45
[CR
EB
*] (
AU
)
Time (min)
ISO (Sim)
ISO (Exp)
0
1
0 15 30 45 0
1
0 15 30 45 0
1
0 15 30 45 Time (min)
FF
M 1
(A
U)
FF
M 2
(A
U)
FF
M 3
(A
U)
Dynamics of feedforward motifs with inhibition of PKA
0
0,5
1
1,5
0 15 30 45
[CR
EB
*] (
AU
)
Time (min)
PKAi (Sim)
Rp-cAMP (Exp)
PKA-DN (Exp)
0
1
0 15 30 45 0
1
0 15 30 45 0
1
0 15 30 45 Time (min)
FF
M 1
(A
U)
FF
M 2
(A
U)
FF
M 3
(A
U)
Dynamics of feedforward motifs with inhibition of MEK
0
0,5
1
1,5
0 15 30 45
[CR
EB
*] (
AU
)
Time (min)
MEKi (Sim)
U0126 (Exp)
0
1
0 15 30 45 0
1
0 15 30 45 0
1
0 15 30 45 Time (min)
FF
M 1
(A
U)
FF
M 2
(A
U)
FF
M 3
(A
U)

Supplementary Figure S7 (continued)
FFM1
FFM2
FFM3
FBL1
B) Complete signaling network, with Iso
0 100
Activation (% of total concentration
of signaling component)
0 Max
Reaction !ow
(% of maximum)

Supplementary Figure S7 (continued)
C) Feedforward motif 1, with Iso D) Feedforward motif 1, with Iso + Rp-cAMP
Activation of bRaf by PKA and Activation of bRaf by cAMP-GEF onlycAMP-GEF
E) Feedforward motif 2, with Iso F) Feedforward motif 2, with Iso + Rp-cAMP
cAMP regulation of activator and cAMP regulation of activator anddeactivator of MAPK deactivator of MAPK
G) Feedforward motif 3, with IsoDelayed inactivation of nuclear PKA
after translocation
0 100
Activation (% of total concentration
of signaling component)
0 Max
Reaction !ow
(% of maximum)
Supplementary Figure S7 (continued)
FFM1
FFM2
FFM3
FFM1
FFM2
FFM3
FFM1
FFM2
FFM3
H) Feedforward motifs, with Iso I) Feedforward motifs, with Iso + Rp-cAMPIntegration of PKA and MAPK signaling Integration of PKA and MAPK signaling
at the level of CREB at the level of CREB
J) Feedforward motifs, with Iso + U0126
Integration of PKA and MAPK signaling
at the level of CREB
0 100
Activation (% of total concentration
of signaling component)
0 Max
Reaction !ow
(% of maximum)
B)
C)
Supplementary Figure S8
PKA and MAPK paths to CREB
MEK
CREB
0 15 30 45t. (min)
100
Relative contribution of
the two paths leading to proteins
100
PKA direct path to CREB
0 15 30 45t. (min)
FFM1
FFM2
FFM3
14%
86%
PKAMSK
Relative CREB phosphorylation in nucleus
83%
17%
PKAEPAC
Relative MEK phosphorylation in cytoplasm
A) MAPK path to CREB when PKAis not operative
0 15 30 45t. (min)
FFM1
FFM2
FFM3
cAMP
PKAcyto
MAPKcyt
PKAnuc
MSKCREB
FFM3
MEKFFM1
PTP-sl
FFM2
MAPKnuc
cytoplasmnucleus
PKI
bRaf
cAMP
PKAcyto
CREB
MEKcytoplasm
nucleus
cAMP
PKAcyto
MAPKcyt
PKAnuc
MSKCREB
FFM3
MEKFFM1
PTP-sl
FFM2
MAPKnuc
cytoplasmnucleus
PKI
bRaf
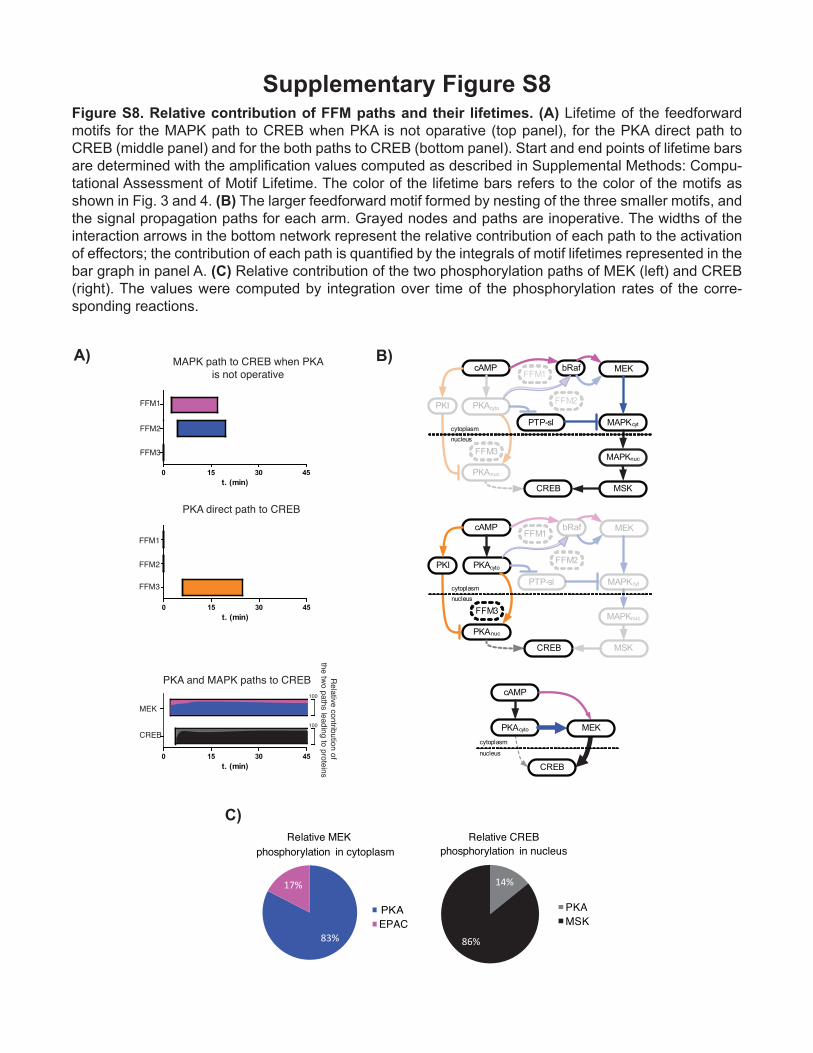
Figure S8. Relative contribution of FFM paths and their lifetimes. (A) Lifetime of the feedforward motifs for the MAPK path to CREB when PKA is not oparative (top panel), for the PKA direct path to CREB (middle panel) and for the both paths to CREB (bottom panel). Start and end points of lifetime bars are determined with the amplification values computed as described in Supplemental Methods: Compu-tational Assessment of Motif Lifetime. The color of the lifetime bars refers to the color of the motifs as shown in Fig. 3 and 4. (B) The larger feedforward motif formed by nesting of the three smaller motifs, and the signal propagation paths for each arm. Grayed nodes and paths are inoperative. The widths of the interaction arrows in the bottom network represent the relative contribution of each path to the activation of effectors; the contribution of each path is quantified by the integrals of motif lifetimes represented in the bar graph in panel A. (C) Relative contribution of the two phosphorylation paths of MEK (left) and CREB (right). The values were computed by integration over time of the phosphorylation rates of the corre-sponding reactions.

B)
A)
Supplementary Figure S9
0.00
1.00
2.00
3.00
4.00
5.00
6.00
7.00
8.00
9.00
RTP
CR
Cyc
les
Nor
mal
ized
to G
APD
H SYNPO
Control
Puromycin
Rolipram (after puromycin)
Rolipram + AZD6244 (after puromycin)
0.00
1.00
2.00
3.00
4.00
5.00
6.00
7.00
RTP
CR
Cyc
les
Nor
mal
ized
to G
APD
H NPHS1
Control
Puromycin
Rolipram (after puromycin)
Rolipram + AZD6244 (after puromycin)0.00
1.00
2.00
3.00
4.00
5.00
6.00
7.00
8.00
9.00
10.00
RTP
CR
Cyc
les
Nor
mal
ized
to G
APD
H WT1
Control
Puromycin
Rolipram (after puromycin)
Rolipram + AZD6244 (after puromycin)
0
0.5
1
1.5
2
2.5
3
Foot
Pro
cess
Den
sity
(FP/
um)
Rolipram + AZD6244 (after puromycin)
Control Puromycin Rolipram (after puromycin)
Figure S9. Spread of RT-PCR and morphometric data for animal studies. (A) Spread of raw cycle numbers (GAPDH subtracted) for podocyte differentiation markers synaptopodin (SYNPO), nephrin (NPHS1), and WT-1 (WT1). (B) Spread of foot process density (distance normalized number of foot processes around a glomerular capillary per unit length) as quantified by a blinded observer from 5,000X transmission electron microscope images for the four different treatment groups.

A)
Supplementary Figure S10
B)
C) D)
Figure S10. High magnification transmission electron microscope (TEM) images showing in vivo actin bundles. Super high resolution (50,000X) TEM images showing foot process cytoskeletal integrity in (A) control, (B) puromycin, (C) rolipram treatment after puromycin, and (D) rolipram plus AZD6244 co-treatment after puromycin. Green arrows point to actin bundles that are critical in maintenance of specialized foot process morphology (scale bar = 200 nm).
-

Table S1. Proteins that were significantly up- or down-regulated according to differential proteomics of glomeruli from control (saline-injected) and puromycin-injected rats. The raw proteomics data from two separate experiments are available at the Systems Biology Center New York (SBCNY) website (http://sbcny.org/supplementary_materials.htm).
Identified Protein Name
Uniprot Accession
Number
MW Percent Coverage
Number of
Unique Peptides
Protein ID
Probability
No of Spectra
Gene ID Control Puromycin ΔLog2
Protein Nebl (Fragment)
F1LVX3_RAT 19 kDa 56% 5 100% 28 Nebl 1 0.4 -1.3
Protein Gm2a D3ZR01_RAT 21 kDa 35% 5 100% 14 Gm2a 1 0.5 -1.0
Glycine amidinotransferase, mitochondrial
GATM_RAT 48 kDa 54% 20 100% 254 Gatm 1 0.5 -1.0
Ficolin-1 FCN1_RAT 37 kDa 17% 4 100% 24 Fcn1 1 0.5 -1.0
Aminoacylase-1A ACY1A_RAT 46 kDa 13% 3 100% 4 Acy1a 1 0.5 -1.0
RCG20695, isoform CRA_b
D4A4W6_RAT 13 kDa 22% 2 100% 4 Slirp 1 0.6 -0.7
Protein Slc25a13 (Fragment)
F1LZW6_RAT 74 kDa 23% 9 100% 18 Slc25a13 1 0.6 -0.7
Solute carrier family 23 member 1 S23A1_RAT 65 kDa 2% 2 100% 4 Slc23a1 1 0.6 -0.7
40S ribosomal protein S13 RS13_RAT 17 kDa 19% 2 100% 6 Rps13 1 0.6 -0.7
Rho-associated protein kinase 2
D3ZZU3_RAT 167 kDa 2% 2 100% 5 Rock2 1 0.6 -0.7
LRRGT00043 Q6TXF6_RAT 95 kDa 6% 4 100% 6 Rab11fip3 1 0.6 -0.7
Atrial natriuretic peptide receptor 3
ANPRC_RAT 60 kDa 16% 6 100% 19 Npr3 1 0.6 -0.7
Cytochrome c oxidase subunit 2
Q8SEZ5_RAT 26 kDa 16% 4 100% 27 Mt-co2 1 0.6 -0.7
3-mercaptopyruvate sulfurtransferase THTM_RAT 33 kDa 25% 5 100% 26 Mpst 1 0.6 -0.7
Membrane-associated guanylate kinase, WW and PDZ domain-containing protein 2
F1LN71_RAT 139 kDa 22% 17 100% 52 Magi2 1 0.6 -0.7
Isoamyl acetate-hydrolyzing esterase 1 homolog
IAH1_RAT 28 kDa 14% 3 100% 5 Iah1 1 0.6 -0.7
Histone H1.2 H12_RAT 22 kDa 13% 3 100% 19 Hist1h1c 1 0.6 -0.7
Histone H1.0 H10_RAT 21 kDa 19% 3 100% 6 H1f0 1 0.6 -0.7
Protein Gldc D3ZJJ9_RAT 114 kDa 16% 10 100% 22 Gldc 1 0.6 -0.7
Disabled homolog 2 DAB2_RAT 82 kDa 16% 7 100% 16 Dab2 1 0.6 -0.7
Decay accelarating factor 1, isoform CRA_b
G3V6H8_RAT 47 kDa 7% 2 100% 5 Cd55 1 0.6 -0.7
Fructose-bisphosphate aldolase
Q66HT1_RAT 40 kDa 32% 10 100% 31 Aldob 1 0.6 -0.7
Disintegrin and metalloproteinase domain-containing protein 17
ADA17_RAT 93 kDa 6% 2 100% 3 Adam17 1 0.6 -0.7
Acyl-CoA synthetase family member 2, mitochondrial
ACSF2_RAT 68 kDa 14% 5 100% 12 Acsf2 1 0.6 -0.7
Protein Vill D3Z8F1_RAT 97 kDa 17% 8 100% 13 Vill 1 0.7 -0.5
Protein Vil1 B5DFA0_RAT 93 kDa 17% 8 100% 16 Vil1 1 0.7 -0.5
Trimethyllysine dioxygenase, mitochondrial
TMLH_RAT 50 kDa 14% 3 100% 9 Tmlhe 1 0.7 -0.5
Sulfite oxidase G3V6R5_RAT 61 kDa 32% 8 100% 18 Suox 1 0.7 -0.5
Protein Sptbn1 (Fragment)
F1LRX5_RAT 268 kDa 56% 2 100% 9 Sptbn1 1 0.7 -0.5
Serine hydroxymethyltrans
Q5U3Z7_RAT 56 kDa 36% 10 100% 24 Shmt2 1 0.7 -0.5

Protein Vil1 B5DFA0_RAT 93 kDa 17% 8 100% 16 Vil1 1 0.7 -0.5
Trimethyllysine dioxygenase, mitochondrial
TMLH_RAT 50 kDa 14% 3 100% 9 Tmlh
e 1 0.7 -0.5
Sulfite oxidase G3V6R5_RAT 61 kDa 32% 8 100% 18 Suox 1 0.7 -0.5
Protein Sptbn1 (Fragment)
F1LRX5_RAT
268 kDa 56% 2 100% 9 Sptbn
1 1 0.7 -0.5
Serine hydroxymethyltransferase
Q5U3Z7_RAT 56 kDa 36% 10 100% 24 Shmt
2 1 0.7 -0.5
Protein Serpinf1 (Fragment)
F1LSW0_RAT 44 kDa 8% 2 100% 3 Serpi
nf1 1 0.7 -0.5
Protein Rpl10l D4A1P2_RAT 25 kDa 36% 7 100% 30 Rpl10
l 1 0.7 -0.5
Protein Robo2 (Fragment)
F1LN24_RAT
151 kDa 12% 11 100% 23 Robo
2 1 0.7 -0.5
Ribonuclease 4 RNAS4_RAT 17 kDa 22% 3 100% 9 Rnas
e4 1 0.7 -0.5
Protein RGD1312026
D4A563_RAT
191 kDa 2% 2 100% 2
RGD1312026
1 0.7 -0.5
Protein Ptpro Q62797_RAT
138 kDa 10% 8 100% 33 Ptpro 1 0.7 -0.5
Probable proline dehydrogenase 2
B0BNG1_RAT 51 kDa 9% 3 100% 6 Prodh
2 1 0.7 -0.5
Protein Ppa2 D4A830_RAT 38 kDa 42% 10 100% 29 Ppa2 1 0.7 -0.5
Protein Plekhg1 D4AE81_RAT
155 kDa 4% 3 100% 4 Plekh
g1 1 0.7 -0.5
Na(+)/H(+) exchange regulatory cofactor NHE-RF3
NHRF3_RAT 57 kDa 52% 18 100% 70 Pdzk
1 1 0.7 -0.5
Protein Pard3b (Fragment)
F1LW22_RAT
115 kDa 27% 19 100% 55 Pard3
b 1 0.7 -0.5
Phenylalanine-4-hydroxylase
PH4H_RAT 52 kDa 11% 3 100% 4 Pah 1 0.7 -0.5
Platelet-activating factor acetylhydrolase IB subunit alpha (Fragment)
F1LPG0_RAT 32 kDa 13% 2 100% 4 Pafah
1b1 1 0.7 -0.5
Succinyl-CoA:3-ketoacid-coenzyme A transferase 1, mitochondrial
SCOT1_RAT 56 kDa 46% 14 100% 104 Oxct1 1 0.7 -0.5
Protein Nipsnap1
D4A867_RAT 37 kDa 25% 5 100% 12 Nipsn
ap1 1 0.7 -0.5
NADH dehydrogenase [ubiquinone] 1 alpha subcomplex subunit 11
NDUAB_RAT 15 kDa 28% 2 100% 4 Ndufa
11 1 0.7 -0.5
Sodium-dependent glucose transporter 1
NAGT1_RAT 52 kDa 7% 2 100% 7 Naglt
1 1 0.7 -0.5
Uncharacterized protein (Fragment)
F1M111_RAT
202 kDa 3% 3 100% 4 Myo5
c 1 0.7 -0.5
Mitochondrial peptide methionine sulfoxide reductase
MSRA_RAT 26 kDa 11% 2 100% 2 Msra 1 0.7 -0.5
Uncharacterized protein
F1LPX0_RAT 81 kDa 4% 2 100% 8 Mipe
p 1 0.7 -0.5
Malate dehydrogenase, cytoplasmic
MDHC_RAT 36 kDa 15% 4 100% 6 Mdh1 1 0.7 -0.5
Putative lysozyme C-2
F1M8E9_RAT 17 kDa 38% 4 100% 23 Lyz2 1 0.7 -0.5
Protein Lrp1 G3V928_RAT
505 kDa 2% 4 100% 6 Lrp1 1 0.7 -0.5
Protein LOC100363713
D4A412_RAT 15 kDa 17% 2 100% 2
LOC100363713
1 0.7 -0.5
Protein LOC100361295
D3ZKG1_RAT 83 kDa 8% 3 100% 11
LOC100361295
1 0.7 -0.5
Protein LOC100359960
D3ZHD8_RAT 24 kDa 16% 2 100% 5
LOC100359960
1 0.7 -0.5

Legumain LGMN_RAT 49 kDa 20% 5 100% 36 Lgmn 1 0.7 -0.5
L-lactate dehydrogenase B chain
LDHB_RAT 37 kDa 17% 3 100% 5 Ldhb 1 0.7 -0.5
Integral membrane protein 2B
ITM2B_RAT 30 kDa 20% 3 100% 8 Itm2b 1 0.7 -0.5
IQ motif containing GTPase activating protein 1 (Predicted), isoform CRA_b
G3V7Q7_RAT
189 kDa 28% 29 100% 124 Iqgap
1 1 0.7 -0.5
10 kDa heat shock protein, mitochondrial
CH10_RAT 11 kDa 45% 5 100% 18 Hspe
1 1 0.7 -0.5
Maleylacetoacetate isomerase
MAAI_RAT 24 kDa 14% 3 100% 5 Gstz1 1 0.7 -0.5
Uncharacterized protein (Fragment)
F1LQY0_RAT 46 kDa 37% 9 100% 27 Gsr 1 0.7 -0.5
Beta-galactosidase
D3ZUM4_RAT 73 kDa 8% 3 100% 5 Glb1 1 0.7 -0.5
Fructose-1,6-bisphosphatase 1
F16P1_RAT 40 kDa 35% 9 100% 33 Fbp1 1 0.7 -0.5
Erythrocyte protein band 4.1-like 3
A3E0T0_RAT 97 kDa 26% 17 100% 55 Epb4.
1l3 1 0.7 -0.5
Ectonucleotide pyrophosphatase/phosphodiesterase family member 1
ENPP1_RAT
103 kDa 3% 2 100% 3 Enpp
1 1 0.7 -0.5
EH domain-containing protein 1
EHD1_RAT 61 kDa 47% 7 100% 12 Ehd1 1 0.7 -0.5
Aspartyl aminopeptidase
Q4V8H5_RAT 53 kDa 10% 3 100% 8 Dnpe
p 1 0.7 -0.5
2,4-dienoyl-CoA reductase, mitochondrial
DECR_RAT 36 kDa 14% 4 100% 6 Decr1 1 0.7 -0.5
D-dopachrome decarboxylase
DOPD_RAT 13 kDa 32% 2 100% 3 Ddt 1 0.7 -0.5
Dendrin DEND_RAT 76 kDa 16% 8 100% 28 Ddn 1 0.7 -0.5
N(G),N(G)-dimethylarginine dimethylaminohydrolase 1
DDAH1_RAT 31 kDa 11% 2 100% 3 Ddah
1 1 0.7 -0.5
Bifunctional ATP-dependent dihydroxyacetone kinase/FAD-AMP lyase (cyclizing)
DHAK_RAT 59 kDa 6% 2 100% 5 Dak 1 0.7 -0.5
Cytochrome P450 4A2
CP4A2_RAT 58 kDa 36% 12 100% 67 Cyp4
a2 1 0.7 -0.5
Cytochrome c, somatic
CYC_RAT 12 kDa 49% 5 100% 88 Cycs 1 0.7 -0.5
Cubilin CUBN_RAT
399 kDa 2% 4 100% 7 Cubn 1 0.7 -0.5
Cathepsin B CATB_RAT 37 kDa 29% 8 100% 18 Ctsb 1 0.7 -0.5
Protein Cpsf6 D3ZPL1_RAT 59 kDa 7% 2 100% 6 Cpsf6 1 0.7 -0.5
Coatomer subunit beta'
COPB2_RAT
103 kDa 4% 2 100% 3 Copb
2 1 0.7 -0.5
Catechol O-methyltransferase
COMT_RAT 30 kDa 16% 3 100% 4 Comt 1 0.7 -0.5
Argininosuccinate synthase
ASSY_RAT 46 kDa 25% 6 100% 25 Ass1 1 0.7 -0.5
Argininosuccinate lyase
ARLY_RAT 52 kDa 6% 2 100% 8 Asl 1 0.7 -0.5
Protein Ank3 (Fragment)
F1LM13_RAT
195 kDa 8% 8 100% 14 Ank3 1 0.7 -0.5
Protein AMBP AMBP_RAT 39 kDa 10% 2 100% 3 Ambp 1 0.7 -0.5
Alpha-aminoadipic semialdehyde dehydrogenase
AL7A1_RAT 59 kDa 41% 16 100% 55 Aldh7
a1 1 0.7 -0.5
Aflatoxin B1 aldehyde reductase member 2
ARK72_RAT 41 kDa 17% 5 100% 16 Akr7a
2 1 0.7 -0.5

Adenylate kinase isoenzyme 4, mitochondrial
KAD4_RAT 25 kDa 30% 6 100% 19 Ak4 1 0.7 -0.5
Protein Agphd1 D3ZUX1_RAT 42 kDa 15% 3 100% 7 Agph
d1 1 0.7 -0.5
Protein Acss1 D3ZZN3_RAT 75 kDa 19% 7 100% 23 Acss
1 1 0.7 -0.5
Protein Acsf3 D3ZUX7_RAT 65 kDa 5% 2 98% 4 Acsf3 1 0.7 -0.5
von Willebrand factor A domain-containing protein 1
VWA1_RAT 45 kDa 6% 3 100% 6 Vwa1 1 1.4 0.5
Transthyretin TTHY_RAT 16 kDa 52% 5 100% 5 Ttr 1 1.4 0.5
Two pore calcium channel protein 1 (Fragment)
F1LNS4_RAT 59 kDa 9% 3 100% 8 Tpcn
1 1 1.4 0.5
Protein Sqrdl (Fragment)
F1LLX4_RAT 36 kDa 8% 2 100% 3 Sqrdl 1 1.4 0.5
Sorbitol dehydrogenase
DHSO_RAT 38 kDa 8% 2 100% 6 Sord 1 1.4 0.5
Protein Slc43a2 D3ZDC2_RAT 63 kDa 6% 3 100% 3 Slc43
a2 1 1.4 0.5
Protein Slc25a24 B1WC67_RAT 53 kDa 13% 4 100% 13 Slc25
a24 1 1.4 0.5
U4/U6.U5 tri-snRNP-associated protein 1
SNUT1_RAT 91 kDa 6% 3 100% 16 Sart1 1 1.4 0.5
Reticulon-4 D3ZT22_RAT 41 kDa 20% 5 100% 64 Rtn4 1 1.4 0.5
Protein kinase C delta-binding protein
PRDBP_RAT 28 kDa 10% 2 100% 2 Prkcd
bp 1 1.4 0.5
Uncharacterized protein
F1LPS3_RAT 74 kDa 4% 2 100% 4 Nolc1 1 1.4 0.5
Myl9 protein B0BMS8_RAT 20 kDa 54% 4 100% 25 Myl9 1 1.4 0.5
Myosin-11 E9PTI3_RAT
228 kDa 13% 5 100% 8 Myh1
1 1 1.4 0.5
Protein Luc7l (Fragment)
F1LNK3_RAT 42 kDa 9% 2 100% 3 Luc7l 1 1.4 0.5
Heterochromatin protein 1-binding protein 3
F1M6V1_RAT 61 kDa 10% 4 100% 7 Hp1b
p3 1 1.4 0.5
Golgin subfamily A member 4
F1LPQ7_RAT
257 kDa 2% 2 100% 2 Golga
4 1 1.4 0.5
Guanine nucleotide-binding protein subunit gamma
Q3KRE3_RAT 7 kDa 53% 2 100% 4 Gng1
0 1 1.4 0.5
Guanine nucleotide-binding protein G(q) subunit alpha
D4AE68_RAT 31 kDa 26% 4 100% 9 Gnaq 1 1.4 0.5
Gamma-glutamyltransferase 5
GGT5_RAT 62 kDa 17% 4 100% 29 Ggt5 1 1.4 0.5
Band 4.1-like protein 1
D3ZL93_RAT
171 kDa 2% 2 100% 2 Epb4
1l1 1 1.4 0.5
ELAV (Embryonic lethal, abnormal vision, Drosophila)-like 1 (Hu antigen R)
B5DF91_RAT 36 kDa 10% 2 100% 4 Elavl
1 1 1.4 0.5
Cytochrome b5 reductase 1
G3V9S0_RAT 34 kDa 17% 3 100% 5 Cyb5r
1 1 1.4 0.5
Protein Ckap4 D3ZH41_RAT 64 kDa 15% 5 100% 16 Ckap
4 1 1.4 0.5
CUGBP Elav-like family member 1
CELF1_RAT 52 kDa 6% 2 100% 3 Celf1 1 1.4 0.5
Protein Bag2 (Fragment)
F1LQH9_RAT 19 kDa 19% 2 100% 3 Bag2 1 1.4 0.5
Acid ceramidase ASAH1_RAT 44 kDa 19% 5 100% 6 Asah
1 1 1.4 0.5
Apolipoprotein H
Q5I0M1_RAT 38 kDa 22% 5 100% 12 Apoh 1 1.4 0.5
Protein Ahnak D3ZN29_RAT 53 kDa 34% 11 100% 19 Ahna
k 1 1.4 0.5
Acid phosphatase-like protein 2
ACPL2_RAT 55 kDa 5% 2 100% 3 Acpl2 1 1.4 0.5

Protein S100-A11
S10AB_RAT 11 kDa 28% 2 100% 22 S100
a11 1 1.5 0.6
Nestin, isoform CRA_b
G3V8F8_RAT
209 kDa 50% 69 100% 402 Nes 1 1.5 0.6
MOSC domain-containing protein 2, mitochondrial
MOSC2_RAT 38 kDa 15% 2 100% 3 Marc
2 1 1.5 0.6
Keratin complex 2, basic, gene 7, isoform CRA_a
G3V712_RAT 51 kDa 11% 3 100% 6 Krt7 1 1.5 0.6
Heat shock 70 kDa protein 1A/1B (Fragment)
F1LPF5_RAT 70 kDa 18% 4 100% 7 Hspa
1a 1 1.5 0.6
High mobility group nucleosome-binding domain-containing protein 5
HMGN5_RAT 49 kDa 20% 4 100% 6 Hmgn
5 1 1.5 0.6
Four and a half LIM domains protein 2
FHL2_RAT 32 kDa 36% 9 100% 18 Fhl2 1 1.5 0.6
Endoplasmic reticulum aminopeptidase 1
ERAP1_RAT
106 kDa 4% 2 100% 3 Erap1 1 1.5 0.6
NADH-cytochrome b5 reductase 3
NB5R3_RAT 34 kDa 54% 12 100% 56 Cyb5r
3 1 1.5 0.6
Ceruloplasmin D3ZZX3_RAT
124 kDa 12% 9 100% 31 Cp 1 1.5 0.6
Phosphatidate cytidylyltransferase 2
CDS2_RAT 51 kDa 16% 5 100% 10 Cds2 1 1.5 0.6
C4b-binding protein alpha chain
C4BPA_RAT 62 kDa 20% 10 100% 34 C4bp
a 1 1.5 0.6
Annexin A3 ANXA3_RAT 36 kDa 44% 11 100% 35 Anxa
3 1 1.5 0.6
Disintegrin and metalloproteinase domain-containing protein 15
ADA15_RAT 93 kDa 3% 2 100% 4 Adam
15 1 1.5 0.6
Actin, alpha cardiac muscle 1
ACTC_RAT 42 kDa 63% 7 100% 38 Actc1 0.9 1.5 0.6
Tropomyosin beta chain (Fragment)
F1LRB1_RAT 29 kDa 38% 2 98% 3 Tpm2 1 1.6 0.7
Lamina-associated polypeptide 2, isoform beta
D3ZNL2_RAT 75 kDa 19% 2 100% 3 Tmpo 1 1.6 0.7
Spectrin alpha chain, brain
SPTA2_RAT
285 kDa 63% 127 100% 924 Sptan
1 1 1.6 0.7
Protein Pnn D3ZAY8_RAT 83 kDa 9% 4 100% 4 Pnn 1 1.6 0.7
Galectin-1 LEG1_RAT 15 kDa 45% 5 100% 20 Lgals
1 1 1.6 0.7
Eukaryotic translation initiation factor 2, subunit 2 (Beta)
Q6P685_RAT 38 kDa 14% 3 100% 5 Eif2s
2 1 1.6 0.7
CD34 antigen (Predicted)
B1PLB1_RAT 41 kDa 17% 3 100% 17 Cd34 1 1.6 0.7
ATP synthase subunit d, mitochondrial
ATP5H_RAT 19 kDa 43% 6 100% 29 Atp5h 1 1.6 0.7
Aquaporin-1 AQP1_RAT 29 kDa 20% 2 100% 7 Aqp1 1 1.6 0.7
Plasminogen PLMN_RAT 91 kDa 3% 2 100% 4 Plg 1 1.7 0.8
Peroxisomal membrane protein PEX14
PEX14_RAT 41 kDa 13% 2 100% 4 Pex1
4 1 1.7 0.8
Myeloid-associated differentiation marker
MYADM_RAT 35 kDa 9% 2 100% 21 Myad
m 1 1.7 0.8
Granulin, isoform CRA_c
G3V8V1_RAT 65 kDa 6% 2 100% 8 Grn 1 1.7 0.8
Cathepsin D 34 kDa heavy chain
D3ZGP8_RAT 48 kDa 17% 5 100% 16 Ctsd 1 1.7 0.8
Vitamin K-dependent protein S
PROS_RAT 75 kDa 9% 5 100% 9 Pros1 1 1.8 0.8
Gamma-synuclein
D4ACB0_RAT 13 kDa 26% 2 100% 4 Sncg 1 2 1.0

Protein FAM151A
F151A_RAT 67 kDa 5% 2 100% 2 Fam1
51a 1 2 1.0
Hemopexin HEMO_RAT 51 kDa 10% 3 100% 4 Hpx 1 2.2 1.1
Protein Cfh F1M983_RAT
140 kDa 3% 2 100% 3 Cfh 1 2.4 1.3
Alpha-1-macroglobulin
A1M_RAT
167 kDa 7% 5 100% 19 A1m 1 2.4 1.3
Desmin DESM_RAT 53 kDa 61% 19 100% 111 Des 1 2.7 1.4
Apolipoprotein A-I
APOA1_RAT 30 kDa 16% 3 100% 8 Apoa
1 1 2.8 1.5
Serine protease inhibitor A3N
SPA3N_RAT 47 kDa 9% 3 100% 8 Serpi
na3n 1 2.9 1.5
Complement C3 CO3_RAT
186 kDa 16% 16 100% 34 C3 1 3 1.6
Alpha-2-HS-glycoprotein
FETUA_RAT 38 kDa 28% 5 100% 50 Ahsg 1 3 1.6
Fibrinopeptide A D3ZJ95_RAT 87 kDa 15% 8 100% 22 Fga 1 3.6 1.8
Inter alpha-trypsin inhibitor, heavy chain 4
Q5EBC0_RAT
104 kDa 5% 3 100% 5 Itih4 1 3.7 1.9
Serine protease inhibitor A3L
SPA3L_RAT 46 kDa 13% 2 100% 4 Serpi
na3l 1 4.1 2.0
Fibrinogen gamma chain
FIBG_RAT 51 kDa 31% 10 100% 29 Fgg 1 4.1 2.0
Serine protease inhibitor A3K
SPA3K_RAT 47 kDa 25% 5 100% 6 Serpi
na3k 1 4.2 2.1
Protein Synpo2l D3ZZ68_RAT
103 kDa 5% 3 100% 7 Synp
o2l 1 4.5 2.2
Uncharacterized protein
D3Z8Y5_RAT 54 kDa 40% 13 100% 40 Fgb 1 4.5 2.2
Serum albumin ALBU_RAT 69 kDa 52% 27 100% 259 Alb 1.1 4.5 2.2
Alpha-1-antiproteinase
A1AT_RAT 46 kDa 21% 5 100% 29 Serpi
na1 1 4.7 2.2
Alpha-1-inhibitor 3
A1I3_RAT
164 kDa 8% 8 100% 39 A1i3 1 5.8 2.5

Table S2. Abundance of different PKA subunits as measured by the two independent proteomic experiments. Note that one-peptide hits below were not included in the general proteomic analysis.
Name Uniprot ID Size # Pep. ID Pr. Gene ID Level
First Experiment
cAMP-dependent protein kinase type I-alpha regulatory subunit KAP0_RAT 43 kDa 4 98% Prkar1a 1.2
cAMP-dependent protein kinase type II-alpha regulatory subunit KAP2_RAT 46 kDa 4 100% Prkar2a 1.2
cAMP-dependent protein kinase type II-beta regulatory subunit KAP3_RAT 46 kDa 1 86% Prkar2b 0.8
5'-AMP-activated protein kinase subunit beta-1 AAKB1_RAT 30 kDa 1 78% Prkab1 0.8
5'-AMP-activated protein kinase subunit gamma-1 AAKG1_RAT 37 kDa 1 88% Prkag1 0.9
Second Experiment
cAMP-dependent protein kinase type I-alpha regulatory subunit KAP0_RAT 43 kDa 5 100% Prkar1a 1.1
cAMP-dependent protein kinase type II-beta regulatory subunit KAP3_RAT 46 kDa 1 50% Prkar2b 1.1
Protein kinase, cAMP-dependent, regulatory, type 2, alpha, isoform CRA_a G3V8Q6_RAT 45 kDa 3 100% Prkar2a 1.2
5'-AMP-activated protein kinase subunit gamma-1 AAKG1_RAT 37 kDa 1 50% Prkag1 0.8
5'-AMP-activated protein kinase catalytic subunit alpha-1 AAPK1_RAT 64 kDa 2 100% Prkaa1 1
Protein kinase, cAMP-dependent, catalytic, alpha A1L1M0_RAT 41 kDa 1 50% Prkaca 1

Table S3. Simulation parameters for the computational model. This model is accessible in the Virtual Cell database under the username sihar and the name Podocyte Nested FFM Model. Reac. No.
Reaction Name (enzyme)
Reaction Type
kf (µM-s)
-1 kb (s-1)
KD or KM (µM)
kcat (s-1)
References Comments
Nucleus 1 MSK → MSK*
(MAPK*nuc) catalysis NA NA 25 10 (53, 54)
2 MSK* → MSK mass action 0.04 s-1 0 NA NA Constrained from the time course of CREB activation.
3 CREB → CREB* (PKAnuc)
catalysis NA NA 17 6 (21) Reference found Km ~ 17 µM. kcat was constrained by experimental PKA, MAPK and CREB data.
4 CREB → CREB* (MSK*) catalysis NA NA 2 1.5 (21) Reference found Km ~ 2 µM. kcat was constrained by experimental PKA, MAPK and CREB data.
5 CREB* → CREB (PP2Anuc)
catalysis NA NA 15.66 6 (55, 56)
6 CREB* → CREB (PP1Anuc)
catalysis NA NA 3 0.4 (57)
7 MKP1 gene → MKP1 RNA (MAPK*nuc)
catalysis NA NA 4 0.0003
(4) This step is a “black box” that accounts for the negative feedback loop involved in shutting down MAPK activity. Reference modeled this process with Km ~ 4 µM and kcat ~ 0.0008 s-1. The number used was partly constrained by the observed duration of MAPK activity in podocytes.
8 MKP1 gene → MKP1 RNA (basal transcription)
mass action 2 x 10⁻⁶ s-1
0 NA NA (4) See note for reaction 7
9 MAPK* → MAPKthr (MKP2)
catalysis NA NA 0.0667 1 (58)
10 MAPK* → MAPKthr (MKP1)
catalysis NA NA 0.0667 1 (58)
11 MAPK* → MAPKthr (MKP1*)
catalysis NA NA 0.0667 1 (58)

12 MAPKthr → MAPK (MKP2)
catalysis NA NA 0.0667 1 (58)
13 MAPKthr → MAPK (MKP1)
catalysis NA NA 0.0667 1 (58)
14 MAPKthr → MAPK (MKP1*)
catalysis NA NA 0.0667 1 (58)
15 MKP1→ MKP1* (MAPK*)
catalysis NA NA 25.641 1 (54)
16 MKP1* → MKP1 mass action 0.0001s-
1 0 NA NA (4) Constrained by timecourse from
literature 17 MKP1 degradation mass action 0.00037
s-1 0 NA NA (59)
18 MKP1* degradation mass action 0.0001s-
1 0 NA NA (59)
19 PKA + PKI ↔ PKI.PKA mass action 1 0.0001 NA NA (60) Reference found Ki ~ 0.1nM
Cytoplasm 20 MKP1 RNA → MKP1 mass action 0.004 0 NA NA Constrained by experimental MAPK
data 21 MAPKK → MAPKK ser
(B-Raf*) catalysis NA NA 0.159 0.105 (61) Kinetics from c-Raf
22 MAPKK ser → MAPKK* (B-Raf*)
catalysis NA NA 0.159 0.105 (61) Kinetics from c-Raf
23 MAPK → MAPK tyr (MAPKK *)
catalysis NA NA 0.046296
0.15 (62, 63)
24 MAPK tyr → MAPK* (MAPKK *)
catalysis NA NA 0.046296
0.15 (62, 63)
25 cAMP → AMP (PDE) catalysis NA NA 1.3 8 (64) 26 cAMP → AMP (PDE*) catalysis NA NA 1.3 20 (65) 27 cAMP → AMP
(PDEhighKM) catalysis NA NA 15 8 (26) Constrained by timecourse from
literature 28 B-Raf → B-Raf* (PKAcyt) catalysis NA NA 1 0.1 Constrained by experimental MAPK
data 29 B-Raf* → B-Raf (PP2A) catalysis NA NA 15.66 6 (55, 56) 30 PTP-SL → PTP-SL*
(PKAcyt) catalysis NA NA 0.1 0.2 (66)

31 PTP-SL* → PTP-SL (PP1)
catalysis NA NA 6 5 (67)
32 MAPKK* → MAPKK ser (PP2Acyt)
catalysis NA NA 15.66 6 (55, 56)
33 MAPKK ser → MAPKK (PP2Acyt)
catalysis NA NA 15.66 6 (55, 56)
34 MAPK* → MAPK tyr (MKP1)
catalysis NA NA 0.0667 1 (58)
35 MAPK tyr → MAPK (MKP1)
catalysis NA NA 0.0667 1 (58)
36 MAPK* → MAPK tyr (MKP1*)
catalysis NA NA 0.0667 1 (58)
37 MAPK tyr → MAPK (MKP1*)
catalysis NA NA 0.0667 1 (58)
38 MAPK* → MAPK tyr (MKP2)
catalysis NA NA 0.0667 1 (58)
39 MAPK tyr → MAPK (MKP2)
catalysis NA NA 0.0667 1 (37)
40 MAPK* → MAPK tyr (PTP-SL)
catalysis NA NA 0.5 1 (68)
41 MKP1→ MKP1* (MAPK*)
catalysis NA NA 25.641 1 (54)
42 MKP1* → MKP1 mass action 0.0001s-
1 0 NA NA (4) Constrained by timecourse from
literature 43 MKP1 degradation mass action 0.00037
s-1 0 NA NA (59)
44 MKP1* degradation mass action 0.0001s-
1 0 NA NA (59)
45 PDE → PDE* (PKAcyt) catalysis NA NA 0.5 9 (69) 46 PDE* → PDE (PDEPP) catalysis NA NA 0.96 0.77 (37) Constrained by timecourse from
literature 47 R2C2 + cAMP ↔
cAMP.R2C2 mass action 54 33 NA NA (70, 71)
48 cAMP.R2C2 + cAMP ↔ cAMP2.R2C2
mass action 54 33 NA NA (70, 71)
49 cAMP2.R2C2 + cAMP ↔ cAMP3.R2C2
mass action 75 110 NA NA (72)

50 cAMP3.R2C2 + cAMP ↔ cAMP4.R2C2
mass action 75 32.5 NA NA (72)
51 cAMP4.R2C2 ↔ cAMP4.R2C + PKA
mass action 0.6 s-1 0.18 NA NA (37) Constrained by timecourse from literature
52 cAMP4.R2C ↔ cAMP4.R2 + PKA
mass action 0.6 s-1 0.18 NA NA (37) Constrained by timecourse from literature
53 PKA.PKI ↔ PKA + PKI mass action 0.0001s-
1 0 NA NA (60) Binding of PKA to PKI occurs in
nucleus only. 54 cAMP + EPAC ↔
cAMP.EPAC mass action 32 96 NA NA (73) Reference found Kd ~ 3.3 uM
Golgi Reactions 55 MAPKK → MAPKK ser
(Rap1.Braf) catalysis NA NA 0.4 0.95 Constrained by experimental MAPK
data 56 MAPKK ser → MAPKK*
(Rap1.Braf) catalysis NA NA 0.4 0.95 Constrained by experimental MAPK
data 57 B-Raf + Rap1GTP ↔
Rap1.BRaf mass action 4 10 NA NA Constrained by experimental MAPK
data 58 Rap1GDP ↔ Rap1GTP mass action 3x10⁻⁶ 8x10⁻⁵ NA NA (74, 75) "five orders of magnitude" difference
between GTPase rate ± RapGAP. The rate given here given here were calculated from Kraemer et al (2002) for the above reasons.
59 cAMP.EPAC + Rap1GDP ↔ Rap1.EPAC
mass action 2 0.8 NA NA Constrained by experimental MAPK data
60 Rap1.EPAC → cAMP.EPAC + Rap1GTP
mass action 0.2 0 NA NA Constrained by experimental MAPK data
61 RG1 + Rap1GTP ↔ Rap1.RG1
mass action 0.62 8.7 NA NA (76)
62 Rap1.RG1 → Rap1GDP + RG1
mass action 8 0 NA NA (74, 76)
Plasma Membrane 63 ATP → cAMP (AC.Gsa) catalysis NA NA 3.15 8.5 (77)

64 βAR.iso → βAR.P (GRKPM)
catalysis NA NA 250 0.204 (78) Reference used kcat = 0.2 s-1 and Km = 0.2 µM. Converted the Km to molecule per µm2 as described (see notes).
65 iso + βAR ↔ βAR.iso mass action 0.1 0.1 NA NA (79) Reference estimated the binding affinity to the purified receptor is at about 1 uM, but the conformational change only happens at 30 uM. We will use the former value, since it is already much weaker binding between the receptor and G protein.
66 βAR.iso + Gs trimer ↔ βAR.Gs
mass action 0.01 0.1 NA NA Estimated
67 βAR.Gs → βAR iso + Gsa + Gbg
mass action 0.025 0 NA NA (80, 81) Rate varies, but the first reference suggested a rate ~ 1.5-2.5 per min
68 Gbg + GRKcyt ↔ GRK.Gbg
mass action 1 0.25 NA NA (78) Reaction 68 and 69 describes the recruitment of GRK to the plasma membrane by the beta-gamma subunit. Reference suggested that binding to the beta gamma subunit has affinity ~ 30 nM and is dependent on the presence of phospholipids. We increased the backward rate constant by an order of magnitude to fit experimentally observed data.
69 GRK.Gbg ↔ GRKPM + Gbg
mass action 1 1x10⁻⁴ NA NA See reaction 68.
70 GRKPM → GRKcyt mass action 0.01 0 NA NA See reaction 68. 71 Gsa + AC ↔ AC.Gsa mass action 1 3.4 NA NA (82) 72 Gsa → GsaGDP mass action 0.11 0 NA NA (80) Reference reported a rate of 4/min at
30°C (0.11/s at 37°C). 73 GsaGDP + Gbg → Gs
trimer mass action 0.006 0 NA NA Estimated
74 βAR.P → βAR mass action 0.00047 0 NA NA (83) Black box for receptor recycling. Constrained with functional receptor time course from reference.

Note: 1. For reactions on the plasma membrane, we used the conversion factor 1 µM = 1200 molecules per µm2. For reactions on the plasma
membrane, we used the conversion factor 1 µM =600 molecules per µm2. These factors were determined by the geometric parameters of the compartments of the model.
2. Nuclear transport was modeled using the equation [ ] [ ]nucortcytimport xkxkJ ⋅−⋅= exp . The following parameters were used for the simulations: Species kimport kexport Reference Comment MAPK* 0.0175 0.01 (84, 85) Once dually phosphorylated, MAPK is actively imported. First
reference measured a τ of 80 s when MAPK is phosphorylated and a passive import τ of 200 s for inactive MAPK.
MAPK 0.005 0.006 (84, 85) See preceding rate. Export constant takes into account CRM1-mediated export measured in (84).
PKA 0.0075 0.0075 (86, 87) In the first reference, the nuclear PKA level reached the maximum value about 15 minutes post stimulation. In the second experiment, application of forskolin, stimulate CBP-CREB complex formation in < 10 min. after stimulation. Assuming t ½ of about 5 min., the characteristic rate is ~ 0.002 s-1.
PKI.PKA 0.0125 0 (22) Binding of PKA and PKI induces a conformation change exposing and nuclear export sequence. Constrained by experimental PKA and CREB data.
PKI 0.001 0 (22) After stimulation of the cAMP, PKI translocates to the nucleus. Constrained by experimental PKA and CREB data.
MKP1 RNA 1 0 This rate, along with the rate of MKP translation in the cytoplasm is a black box representing the steps involved in MKP-1 negative feedback.
MKP1 0.001 0.001 Constrained by experimental MAPK data MKP1* 0.001 0.001 Constrained by experimental MAPK data

Initial conditions (only species with non-zero initial concentration are shown.) Species compartment Buffered? Concentration unit References comments Iso extracellular
fluid Yes 10 µM Used in the experiment
βAR plasma membrane
No 33 molecules/µm2 A typical number is ~ 10,000-20,000 per cells. Phosphorylated receptor concentrations (Beta-P and beta-IsoP) were set to 1x10⁻⁶ µM for computational purposes.
Gs trimer plasma membrane
No 100 molecules/µm2 (88, 89) Quantification in myocytes demonstrated that adenylyl-cyclase is the signaling bottleneck of this pathway, and that Gs is in excess compared to BAR. The value of Gs and the resulting dynamics were adjusted to respect these physiological constraints.
AC plasma membrane
No 100 molecules/µm2 (89)
MAPK cytosol No 0.263 µM (54) R2C2 cytosol No 0.2 µM (90) ATP cytosol Yes 4000 µM (37) Constrained by timecourse from literature MKP1 cytosol No 0.00036 µM Steady state value BRaf cytosol No 0.2 µM (91) Rap1GAP cytosol No 0.15 µM Constrained by experimental MAPK data. MAPKK cytosol No 0.18 µM (62) cAMP cytosol No 1x10⁻⁴ µM Basal cAMP concentration, steady state value EPAC cytosol No 0.16 µM Constrained by experimental MAPK activation
time course. [EPAC-cAMP] was set to a very low level (1x10⁻⁶ µM) for computational purposes.
PTP-SL cytosol No 0.01 µM Constrained by experimental CREB activation time course.
PP2A cytosol No 0.075 µM Estimated GRK cytosol No 0.045 µM (92) Reference estimated cellular concentration
between 0.01-0.2 µM. PDE cytosol No 0.4 µM (37) Constrained by timecourse from literature MKP2 cytosol No 0.001 µM Estimated

Rap1GDP Golgi membrane
No 100 molecules/µm2 (93) Reference found total cellular Rap1 to be ~ 1 µM. Converting to the number of molecules per area of Golgi membrane gives concentration on the order of ~100 molecules/µm2.The concentrations of Rap1 in complexes (Rap1-RGII, Rap1-EPAC, Rap1-BRaf) were set to 1x10⁻⁶ µM
Rap1GTP Golgi membrane
No 0 molecules/µm2 Assumed that all Rap 1 is in the GDP bound state.
MSK Nucleus No 0.1 µM Constrained by experimental CREB output PP1A Nucleus No 0.04 µM Assume the same estimated concentration as
PP2A. MKP1 gene Nucleus Yes 0.2 µM Constrained by experimental MAPK output PP2A Nucleus No 0.05 µM Assume approximately the same concentration
as cytoplasmic. CREB Nucleus No 0.3 µM (86) Note: The following conversion factors were used: 1 µM = 1200 molecules/µm2 (plasma membrane) and 1 µM = 600 molecules/µm2 (Golgi). These factors were determined by the geometric parameters of the compartments of the model.
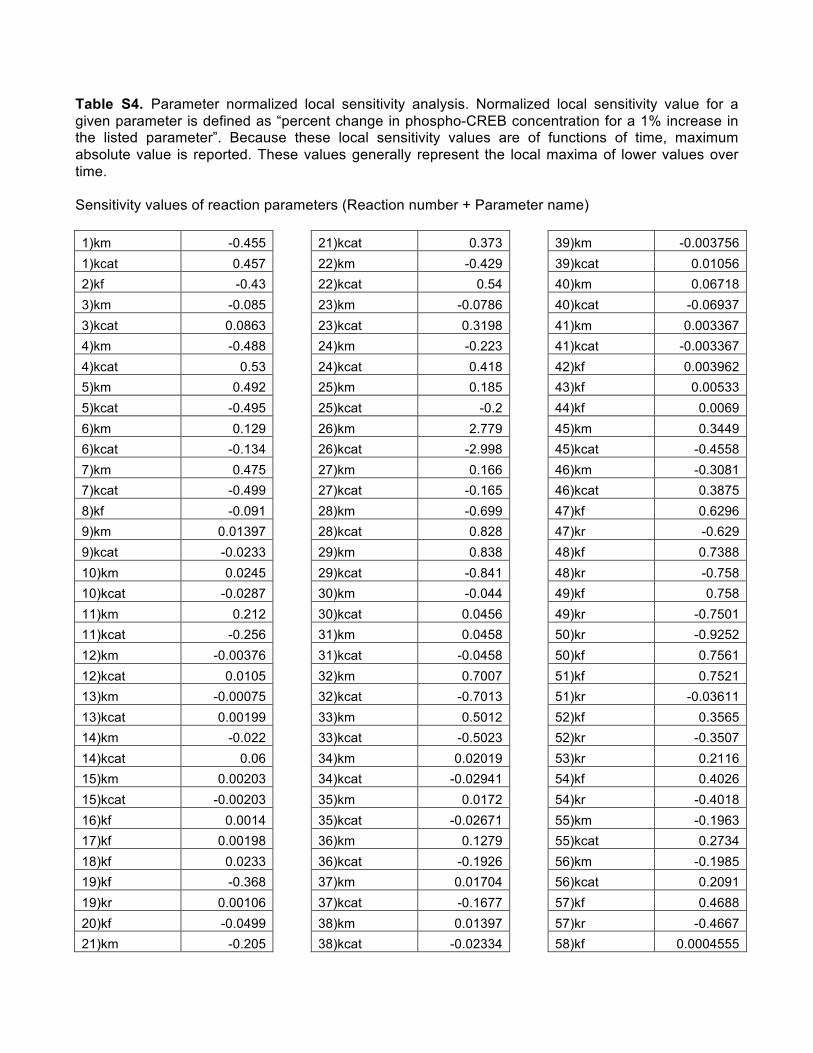
Table S4. Parameter normalized local sensitivity analysis. Normalized local sensitivity value for a given parameter is defined as “percent change in phospho-CREB concentration for a 1% increase in the listed parameter”. Because these local sensitivity values are of functions of time, maximum absolute value is reported. These values generally represent the local maxima of lower values over time. Sensitivity values of reaction parameters (Reaction number + Parameter name) 1)km -0.455 1)kcat 0.457 2)kf -0.43 3)km -0.085 3)kcat 0.0863 4)km -0.488 4)kcat 0.53 5)km 0.492 5)kcat -0.495 6)km 0.129 6)kcat -0.134 7)km 0.475 7)kcat -0.499 8)kf -0.091 9)km 0.01397 9)kcat -0.0233 10)km 0.0245 10)kcat -0.0287 11)km 0.212 11)kcat -0.256 12)km -0.00376 12)kcat 0.0105 13)km -0.00075 13)kcat 0.00199 14)km -0.022 14)kcat 0.06 15)km 0.00203 15)kcat -0.00203 16)kf 0.0014 17)kf 0.00198 18)kf 0.0233 19)kf -0.368 19)kr 0.00106 20)kf -0.0499 21)km -0.205
21)kcat 0.373 22)km -0.429 22)kcat 0.54 23)km -0.0786 23)kcat 0.3198 24)km -0.223 24)kcat 0.418 25)km 0.185 25)kcat -0.2 26)km 2.779 26)kcat -2.998 27)km 0.166 27)kcat -0.165 28)km -0.699 28)kcat 0.828 29)km 0.838 29)kcat -0.841 30)km -0.044 30)kcat 0.0456 31)km 0.0458 31)kcat -0.0458 32)km 0.7007 32)kcat -0.7013 33)km 0.5012 33)kcat -0.5023 34)km 0.02019 34)kcat -0.02941 35)km 0.0172 35)kcat -0.02671 36)km 0.1279 36)kcat -0.1926 37)km 0.01704 37)kcat -0.1677 38)km 0.01397 38)kcat -0.02334
39)km -0.003756 39)kcat 0.01056 40)km 0.06718 40)kcat -0.06937 41)km 0.003367 41)kcat -0.003367 42)kf 0.003962 43)kf 0.00533 44)kf 0.0069 45)km 0.3449 45)kcat -0.4558 46)km -0.3081 46)kcat 0.3875 47)kf 0.6296 47)kr -0.629 48)kf 0.7388 48)kr -0.758 49)kf 0.758 49)kr -0.7501 50)kr -0.9252 50)kf 0.7561 51)kf 0.7521 51)kr -0.03611 52)kf 0.3565 52)kr -0.3507 53)kr 0.2116 54)kf 0.4026 54)kr -0.4018 55)km -0.1963 55)kcat 0.2734 56)km -0.1985 56)kcat 0.2091 57)kf 0.4688 57)kr -0.4667 58)kf 0.0004555

58)kr -0.0006866 59)kf 0.4258 59)kr -0.3389 60)kf 0.3613 61)kf -0.26 61)kr 0.13 62)kcat -0.1897 63)km -0.0031636 63)kcat 3.367 64)km 1.382 64)kcat -1.391
65)kf 0.288379806 65)kr 0.020341354 66)kf 1.4033564 66)kr -1.1581675 67)kf 2.0 67)kr 0 68)kf -0.2164726 68)kr 0.0534714 69)kf -0.06977 69)kr 0.0161 70)kr 0
71)kf 1.8309 71)kr -1.831 72)kf -1.7926 73)kf 0.024 74)kf 1.1692
Sensitivity values of the parameters of translocation reactions and initial concentration
Translocation Initial Concentrations Initial Concentrations (cont) MAPK* import 0.424 ISO 1.286 PP2A -2.0471 MAPK* export 0.1414 BAR 1.809 GRK -1.389 MAPK import -0.01096 Gs 2.2669 PDE -3.192 MAPK export 0.01622 AC 2.5456 MKP2 -0.1921 PKA import 0.942 MAPK -0.31 RAP1GDP 0.2621 PKA export -0.0855 R2C2 1.40 MSK 0.53 PKI-PKA export 0.01322 ATP 0 PP1A -0.1335 PKI import -1.0236 MKP1 0 MKP1 DNA 0 MKPRNA export -0.00021 Braf 1.084 PP2A nucleus 0.4952 MKP1_import -0.01807 Rap1GAP -0.0364 MKP1_export 0.004312 MEK 0.6764 MKP1*_import -0.1225 EPAC 0.4358 MKP1*_export 0.05891 PTP -0.0703

Table S5. Abundance of glomerular and tubular markers as quantified by proteomic analysis. Spectral counts of podocyte specific proteins were an order of magnitude higher than those of tubular proteins, with a median of 52 unique glomerular spectra vs. 5 tubular spectra (214 ± 136 vs. 23 ± 18; p < 0.001, t-test). Of the 10 tubular proteins, only 5 had 2 or more unique peptides (7 ± 6); whereas all 15 glomerular proteins had 3 or more (17 ± 4), demonstrating high levels of enrichment for glomeruli with only trace amounts of tubular contamination.
TUBULAR MARKERS Gene ID Uniprot ID Size Coverage Peptides ID Prob. Spectra
Megalin* Lrp2 LRP2_RAT 519 kDa 18% 54 100% 165
Aquaporin-1 Aqp1 AQP1_RAT 29 kDa 20% 2 100% 7
Aquaporin-2 Aqp2 AQP2_RAT 29 kDa 0% 0 0% 0
V-ATPase, V1 subunit G1 Atp6v1g1 B2GUV5_RAT 14 kDa 12% 2 100% 6
V-ATPase, V1 subunit D Atp6v1d Q6P503_RAT 28 kDa 16% 3 100% 5
Solute carrier family 12 member 3 Slc12a3 G3V8G0_RAT 111 kDa 1% 1 50% 2
Chloride Channel Voltage-Sensitive 5 Clcn5 CLCN5_RAT 83 kDa 0% 0 0% 0
SGLT-1 Slc5a1 SC5A1_RAT 73 kDa 4% 1 50% 2
SGLT-2 Slc5a2 F1LMI6_RAT 73 kDa 7% 3 100% 23
Mean 9% 7.3 67% 23
SEM 3% 5.8 14% 18
Median 7% 2.0 100% 5
PODOCYTE MARKERS Gene ID Uniprot ID Size Coverage Peptides ID Prob. Spectra
Alpha-actinin-4 Actn4 ACTN4_RAT 105 kDa 80% 72 100% 2086
Protein tryrosine kinase Mer Mertk MERTK_RAT 109 kDa 10% 9 100% 21
Dendrin Ddn DEND_RAT 76 kDa 16% 8 100% 28
IQ motif containing GAP 1 Iqgap1 G3V7Q7_RAT 189 kDa 28% 29 100% 124
Kin of IRRE-like protein 1 Kirrel F1M7V1_RAT 87 kDa 23% 13 100% 38
Magi-2 Magi2 F1LN71_RAT 139 kDa 22% 17 100% 52
Nephrin Nphs1 NPHN_RAT 136 kDa 27% 21 100% 65
Podocalyxin Podxl PODXL_RAT 52 kDa 26% 9 100% 276
Podocin Nphs2 PODO_RAT 42 kDa 47% 14 100% 90
CD2AP Cd2ap F1LRS8_RAT 70 kDa 17% 8 100% 21
Fat1 Fat1 F1LP84_RAT 506 kDa 1% 3 100% 5
Par-3 partitioning defective 3 homolog B Pard3b F1LW22_RAT 115 kDa 27% 19 100% 55
GLEPP1, PTP-RO Ptpro Q62797_RAT 138 kDa 10% 8 100% 33
Semaphorin 3G Sema3g F1LNH0_RAT 87 kDa 12% 5 100% 9
Synaptopodin Synpo SYNPO_RAT 100 kDa 38% 27 100% 307
Mean 26% 17 100% 214
SEM 5% 4 0% 136
Median 23% 13 100% 52