supplier capacity planning in the face of market uncertainty
TRANSCRIPT

Supplier Capacity Planning in the face
of Market Uncertainty
MASTER THESIS WITHIN: MSc in Logistics & Transport Management
NUMBER OF CREDITS: 30
AUTHOR: Elin Forsell, Efstathios Sidiropoulos
TUTOR: Sharon Cullinane
GOTHENBURG May 2018
The impact of forecast communication on
capacity planning

i
Master Thesis in Logistics & Transport Management
Title: Supplier Capacity Planning in the face of Market Uncertainty
Authors: Elin Forsell
Efstathios Sidiropoulos
Tutor: Sharon Cullinane
Date: 2018-05-27
Subject Terms: Demand Management, Capacity Constraints, Capacity Planning,
Forecasting, Sales and Operations Planning, Supply Chain
Management, Supplier Relations.
Abstract
The purpose of this paper is to investigate the internal and external processes at Company X,
focusing on forecast creation and how the forecast process impact supplier capacity planning.
In order to do so, two research questions have been created. How is the forecast
developed internally and how is communicated to internal and external suppliers? How is
internal and external supplier capacity planning connected to forecast communication? The
topic for the study has been developed together with Company X and focuses on an area in
which the results can be of value to the company. The study has been performed using a
combination of observations and interviews with internal and external actors. Finding from
these interviews have been used to develop a discussion on areas identified as especially
important. What can be found is that Company X has well developed internal processes, that
have been used over a long period of time. No need can be identified to radically change the
internal process. Instead, more focus should be put on developing supplier relationships to
improve communication and cooperation.
ii
Acknowledgement
We would like to show our deepest appreciation for everyone supporting us during this study.
You have been invaluable for us to finish our research and reach our end goal. We are grateful
for the opportunity to perform our thesis together with Company X and for everything we have
learned.
First, we want to express our gratitude to our supervisor Sharon Cullinane who has shown us
support and encouragement throughout the process. Secondly, we would like to thank our
supervisors at Company X that have guided us through the topic to give us an understanding of
company processes. Without their guidance, encouragement, feedback and help this study
would not have been finalized. We highly appreciate the cooperation and work we have done
together during this process.
In addition to this we would like to thank everyone who has taken their time to meet us for
interviews and discussions on the topic and share their knowledge with us. Without this
information, the value of our research would be low. Thanks to everyone who has helped us
with our research we can present findings that can be useful for Company X and other people
interested in the topic.

iii
Abbreviations
BI Business Intelligence
BWE Bullwhip Effect
EDI Electronic Data Interchange
KPI Key Performance Indicator
LTVF Long-Term Volume Forecast
MPS Master Production Schedule
MRP Material Requirements Planning
MTO Make-to-Order
MTS Make-to-Stock
PCC Program Capacity Check
PPL Production Plan
RBWE Reverse Bullwhip Effect
RCCP Rough-Cut Capacity Planning
SCA Supplier Capacity Audit
SCM Supply Chain Management
SDA Supplier Delivery Assurance Engineer
SRM Supplier Relationship Manager
S&OP Sales & Operations Planning
TMF Total Market Forecast

iv
Table of Contents
1 Introduction ....................................................................... 1
1.1 Industry Background ................................................................................. 3
1.2 Problem Definition..................................................................................... 4
1.3 Purpose ..................................................................................................... 5
1.3.1 Contribution ............................................................................................... 6
1.4 Research Questions ................................................................................. 6
1.5 Delimitations.............................................................................................. 6
1.6 Structure of Report ................................................................................... 7
2 Methodology ...................................................................... 8
2.1 Research Paradigm: Interpretivism .......................................................... 8
2.2 Research Approach .................................................................................. 9
2.3 Research Design ...................................................................................... 9
2.3.1 Research Method and Research Entity ................................................... 9
2.3.2 Case Study .............................................................................................. 10
2.3.3 The Research Subject ............................................................................ 10
2.3.4 Qualitative Approach .............................................................................. 11
2.4 Data Collection Method .......................................................................... 12
2.4.1 Observations ........................................................................................... 13
2.4.2 Primary Source Information .................................................................... 13
2.4.3 Exploratory and Semi-Structured Interviews ......................................... 13
2.4.4 Secondary Data ...................................................................................... 14
2.5 Reliability and Validity ............................................................................. 15
2.5.1 Reliability ................................................................................................. 15
2.5.2 Validity ..................................................................................................... 16
3 Theoretical Framework.................................................... 17
3.1 Supply Chain Management .................................................................... 18
3.1.1 Supplier Partnership ............................................................................... 20
3.2 Sales and Operations Planning .............................................................. 21
3.2.1 Planning Horizon..................................................................................... 23
3.3 Demand Management ............................................................................ 24
3.3.1 Forecasting ............................................................................................. 25

v
3.3.2 Forecasting Techniques ......................................................................... 26
3.3.3 Demand Sales & Operations Planning................................................... 27
3.3.3.1 Forecasting in S&OP .................................................................................................... 28
3.3.4 Bullwhip Effect ........................................................................................ 29
3.4 Capacity Planning ................................................................................... 30
3.4.1 Capacity Management ............................................................................ 31
3.4.2 Capacity Imbalances .............................................................................. 32
3.4.3 Capacity Measurements ......................................................................... 34
3.4.4 External Capacity .................................................................................... 34
3.4.5 Reverse Bullwhip Effect .......................................................................... 35
3.4.6 Supply Sales and Operations Planning ................................................. 36
3.4.7 Reconciliation Sales and Operations Planning ...................................... 38
3.5 Measurement and Communication ........................................................ 39
4 Empirical Framework ...................................................... 40
4.1 Forecasts ................................................................................................ 40
4.1.1 Total Market Forecast ............................................................................. 41
4.1.2 Long-term Volume Forecast & PPL ....................................................... 41
4.1.3 The Forecast Process............................................................................. 42
4.1.4 Comments on the forecast processes.................................................... 43
4.2 The Sales and Operations Planning Process ........................................ 44
4.2.1 Comments on the S&OP process .......................................................... 46
4.3 The Demand Plan ................................................................................... 47
4.3.1 The Unconstrained Demand Plan .......................................................... 48
4.3.1.1 Create New Demand Plan ............................................................................................ 49
4.3.1.2 Review Volume Plan with Market ................................................................................. 50
4.3.1.3 Consolidate Data .......................................................................................................... 50
4.3.2 The Challenged Unconstrained Demand Plan ...................................... 50
4.3.2.1 Analyze Unconstrained Demand Plan versus KPIs and Adjust ................................... 51
4.3.2.2 Compile Summary of all Demand Plans ....................................................................... 51
4.3.3 Comments on Demand Plan .................................................................. 52
4.4 Supply Plan ............................................................................................. 53
4.4.1 Supply Plan Proposal ............................................................................. 54
4.4.2 Supply Plan Response ........................................................................... 56
4.4.3 The EDI Creation .................................................................................... 57

vi
4.4.4 The Role of Purchasing in the Supply Plan ........................................... 58
4.4.5 Comments on Supply Plan ..................................................................... 59
4.4.6 Reconciliation of the S&OP Process ...................................................... 60
4.5 Measurements ........................................................................................ 61
5 Supplier Communication ................................................ 62
5.1 Supplier Relationship Management ....................................................... 62
5.1.1 Comments on Supplier Communication ................................................ 63
5.2 Material Control ....................................................................................... 65
6 Supplier Interviews .......................................................... 67
6.1 Internal Supplier ...................................................................................... 67
6.1.1 Production Planning ................................................................................ 70
6.2 External Supplier – Supplier A ............................................................... 71
6.2.1 Forecast Communication ........................................................................ 71
6.2.2 Forecast Accuracy .................................................................................. 73
6.2.3 Capacity Planning ................................................................................... 74
6.2.4 Concluding Remarks .............................................................................. 75
6.3 External Supplier – Supplier B ............................................................... 75
6.3.1 Forecast Communication ........................................................................ 76
6.3.2 Capacity Planning ................................................................................... 77
6.3.3 Concluding Remarks .............................................................................. 77
7 Discussion ....................................................................... 78
7.1 The Internal Processes ........................................................................... 78
7.1.1 Forecasts ................................................................................................ 78
7.2 Sales & Operations Planning ................................................................. 80
7.2.1 Demand Plan .......................................................................................... 80
7.2.2 Supply Plan ............................................................................................. 81
7.2.3 Purchasing .............................................................................................. 82
7.3 External Processes ................................................................................. 82
7.3.1 Forecast Communication & Accuracy .................................................... 82
7.3.2 Electronic Data Interchange Quality ....................................................... 82
7.4 Supplier Relationships ............................................................................ 83
7.4.1 Trust, Confidence and Confidentiality .................................................... 84

vii
7.5 Recommendations .................................................................................. 85
8 Conclusion ....................................................................... 87
8.1 Recommendations for Future Research ................................................ 89
References ..................................................................................... 1

viii
Figures
Figure 1: Theoretical Framework .................................................................... 17
Figure 2: Umbrella Pattern (Rong et al., 2008) ............................................... 36
Figure 3: The Forecast Process ...................................................................... 43
Figure 4: S&OP Process at Company X ......................................................... 45
Figure 5: Creation of the Demand Plan........................................................... 48
Figure 6: Creation of the Unconstrained Demand Plan .................................. 49
Figure 7: Creation of the Challenged Unconstrained Demand Plan .............. 51
Figure 8: Creation of the Supply Plan ............................................................. 54
Figure 9: Creation of the Supply Plan Proposal .............................................. 55
Figure 10: Creation of the Supply Plan Response ......................................... 57
Tables
Table 1: Internal Interviewees ......................................................................... 40
Table 2: Forecasts in Company X ................................................................... 40
Table 3: Comments on the Forecasting Process ............................................ 44
Table 4: Comments on the Sales & Operations Planning Process ................ 47
Table 5: Comments on the Demand Plan Process ........................................ 53
Table 6: Comments on the Supply Plan Process ........................................... 60
Table 7: Comments on the Supplier Communication Process ....................... 65
Table 8: Comments on the Role of Material Controllers in Supplier Communication
............................................................................................................. 67
Appendix 1. S&OP Process Maps
Appendix 2. Interview Guide - Internal Interviews
Appendix 3. Interview Guide - External Interviews

1
1 Introduction
The concept of supply chains has been around ever since the first time a product or service was
delivered to a customer. Early on it was rudimentary, an exchange between the manufacturer
and customer, but as societies developed the relationship between seller and customer became
more complex. The development of industries created region or country specializations, with
specializations in different goods or services. Innovation and technological advances have
changed the production industry. Meanwhile the development of free-trade agreements and
customs unions have changed international trade. Along with societal development, customer
preferences have shifted and created demand for a new type of goods and services. This has led
to a more integrated global market with converging customer preferences across the world
(Basu & Wright, 2017). For companies, the globalization has meant increasingly complex and
dynamic markets, and a highly competitive environment for all industries (Crum & Palmatier,
2003). The impact of globalization was realized already in the 1990 in a study by Sheffi and
Bovet (1998), highlighting the shift that will occur in demographics and economic power. The
benefits of global sourcing have long been known. However, with increased access to low price
products and fast transport, demand has become increasingly global (Sheffi & Bovet, 1998).
Due to increased competition, awareness of the environment and increased information, Sheffi
and Bovet (1998) predicts that companies will increase the speed of innovation across the
supply chain. This will be enabled by the development of an integrated and flexible supply
chains that will enable flow of products, information and ideas across the entire chain. The
ability to quickly respond to customer demand and sourcing will be important indicators of
company performance and success.
As a consumer today, there is a massive number of products to choose from and better ability
to research products of interest (Basu & Wright, 2017). Most consumers are now conscious
enough to compare products between different retailers and chose the one with the lowest price.
When customers expect excellence in delivery performance, product availability, low price, as
well high responsiveness to their demands, suppliers struggle to provide customer satisfaction
(Crum & Palmatier, 2003). The study by Sheffi and Bovet (1998) highlights the impact of this
development on the automotive industry, where automotive manufacturers attempt to deliver
higher quality vehicles, at a lower price, with short delivery time. With customers expecting
continuous price reductions, companies must attempt to satisfy this expectation (Sheffi &
Bovet, 1998) and this trend has continued throughout the first decades of the 21st century.

2
Companies need to display high flexibility in order to adhere to customer demand; however, it
is difficult for a single organization to acquire all capabilities to do so (Basu & Wright, 2017).
Any high-performance organization must have the competencies that allow them to understand
the fluctuations in the market and enable them to forecast these changes to create an agile
organization, that is able to respond quickly. If an organization does not display these qualities,
they face the risk of customers moving to a competitor (Sheldon, 2006). Therefore, a company
must select suppliers that can provide missing skills and competences (Basu & Wright, 2017;
Zacharia, Nix & Lusch, 2009). When investigating what capabilities are needed, internal
capabilities should be identified to exploit internal supply capacity. Thereafter external partners
should be selected to complement the competences not present internally (Feldmann & Olhager,
2008). The collaboration with suppliers has become critical to achieving a flexible and efficient
supply chain (Zacharia, et al., 2009). Crum and Palmatier (2003) identify the manufacturing
industry, as one industry that has felt the effects of increasingly complex supply chains and long
lead times as a result of the globalized economy, strongly.
Supply Chain Management directly affects company performance and depending on how the
supply chain is operated the impact can be positive or negative (Sheffi & Bovet, 1998). Basu
and Wright (2017) define Supply Chain Management as a concept that aims at optimizing
supply chain performance by focusing on critical elements. This implies that an effective supply
chain is essential to firm performance, operational excellence and to get a competitive edge
(Sheffi & Bovet, 1998). The elements of the supply chain include both internal and external
actors located at each end of the chain, suppliers at one and customers at the other. Suppliers
and customers must be matched with the internal capabilities of the manufacturing process,
achieving this enables the organization to have a twofold focus, satisfying customer needs and
keeping costs to a minimum (Basu & Wright, 2017). Manufacturing firms, especially in the
automotive industry, demand yearly cost reductions from suppliers, while simultaneously
asking for best practice standards in demand collaboration and flexibility. To fulfill the
expectations on price, delivery and quality, companies and its suppliers are increasingly
dependent on forecast accuracy and demand management. The consequences of inaccurate
forecasts such as, undesirable inventory levels and supply chain disruptions have been known
for a long time. Inaccurate forecasts also compromise sales and financial performance and in
turn affect customer satisfaction (Crum & Palmatier, 2003). Given the clear advantages of an
efficient supply chain, companies across all industries have focused on reducing cost and
increasing speed in the supply chain (Lee, Padmanabhan & Whang, 2004). The issue raised by
3
Lee et al. (2004) is that despite this, companies still face difficulty in delivering goods. This is
attributed to the fact that a supply chain characterized by speed and low cost is unable to quickly
respond to variations in demand and supply (Lee et al., 2004). The focus must therefore be on
developing a coordinated supply chain, cooperating with both customers and suppliers.
Organizational ability to build strong and mutually beneficial partnerships is a strong
determinant of company success (Sheffi & Bovet, 1998).
Recognizing the need for forecast accuracy to minimize risk, companies develop processes to
improve and coordinate their demand- and supply planning functions (Sheldon, 2006). One way
of accomplishing this is by adopting the Sales and Operations Planning (S&OP) philosophy to
achieve integrated business management processes and supply chain excellence by focusing
and aligning demand, supply and financial functions within the organization (Sheldon, 2006;
Schorr, 2007a; Bowersox, Closs & Cooper, 2010). With increasing pace in both the marketplace
and technological development, the S&OP process has evolved beyond operations planning to
integrate all organizational functions (Basu & Wright, 2017). Managers are also realizing that
the financial benefits from reducing inventories and supply chain costs can only be achieved by
improving demand management and capacity planning mechanisms (Crum & Palmatier, 2003).
The S&OP process is divided into four steps, the sales forecast, demand plan, supply plan and
consolidation and release of final volume plan. All with the aim to create an accurate demand
forecast and plan production accordingly. According to Sheldon (2006) the implementation of
a robust S&OP process does not replace the need for good judgment and experience. S&OP
should not be a source of easy answers but rather to empower the right people to discuss the
right topics at the right time and thus increasing the quality of the decisions made throughout
the supply chain (Sheldon, 2006).
For the purpose of this paper a case study will be performed at a multi-national company within
the automotive industry. The name of the specific company will be kept confidential at their
request; therefore, the company will be called Company X throughout this paper and
background information will be kept at the industry level.
1.1 Industry Background
The globalization of international trade has impacted all industries including the automotive
manufacturing industry. As automotive industries developed from operating nationally to
expanding globally, the need for creating efficient supply chains and coordinate the purchasing

4
of complex components and sub-systems. With global and dispersed supply, information
exchange must be frequent and accurate. The concentrated structure of the industry gives a
small number of manufacturing firms power over suppliers, often enough to force them to
comply to specific standards, information systems and business processes (Sturgeon, van
Biesebroeck & Gereffi, 2008).
During the last decades, the automotive industry has shifted from mass production to mass
customization; the latter enables companies to provide a high variety of products while
maintaining low costs and short delivery times (Vollmann et al., 2005). This shift was
accompanied by a change in production planning, from make-to-stock (MTS) to make-to-order
(MTO). In MTO driven production, planning is more accurate if the share of customer specific
orders increases. The coordination of MTO production processes is complex and require
sophisticated planning methods (Meyr, 2004). The supply chain in the automotive industry is
characterized by a large flow of material converging towards production and a dispersed flow
of final products towards customers that can be situated around the world. This makes the
supply chain difficult to coordinate, not only due to the potential bottlenecks in capacity and
work force, but also as the supply chain is vulnerable to disruption in the incoming flow of
components or parts from suppliers (Meyr, 2004).
The relationships between automotive manufacturers and their suppliers have evolved since the
1980s. From being characterized by short-term contracts, multiple sourcing and little exchange
of information. Supplier relationships have been developed to include more extensive use of
long-term contracts, more information exchange and closer cooperation. This development is
surprising as automotive manufacturers are sacrificing purchasing power to create long-term
relationships with their suppliers. However, in the face of economic and market uncertainty, the
increased integration of the supply chain makes sense (Helper, 1991).
1.2 Problem Definition
In light of the increased sales in the automotive industry over years following the financial crisis
(Oh, 2014), the industry has suffered from supply constraints. With the unexpected increase in
demand, Company X has faced significant supplier capacity constraints, causing disruptions
throughout the supply chain and impacting customer satisfaction.
5
The supplier capacity issue has put strain on the purchasing organization to develop solutions
in cooperation with suppliers. One source of the problem could be the forecasting process and
the suppliers’ confidence in it. The unanticipated peak in demand made suppliers realize that
they did not have sufficient capacity to cope with the increased volume in the orders.
Information gathered internally has showed that historically, the forecasts have been inaccurate,
estimating too high or too low demand volumes; this has in turn led to low confidence in the
forecast among suppliers.
Actions have therefore been taken to evaluate the Sales and Operations Planning process used
to develop the volume forecast in Company X. As projects evaluating the S&OP process have
already been initiated, this study will take a different approach, highlighting the topic from
another perspective. With the current supplier capacity problem as a starting point, the study,
developed together with the purchasing department, will focus on how the forecast and more
specifically its accuracy, impacts supplier capacity planning. The theoretical framework
including Capacity Planning, Demand Management and Forecasting, as well as the Sales and
Operations Planning processes, will enable a comparison between empirical findings and
theoretical best practice. Further, a comparison between different types of suppliers will be done
to see whether best practices and issues can be identified. Thereafter, current processes will be
analyzed to make recommendations for future actions.
1.3 Purpose
The purpose of this study is twofold, first aimed at investigating how the forecast is created at
Company X. In doing that, the internal forecast process at Company X will be outlined,
clarifying the different steps and responsibilities within the process. Since the company
employs the Sales and Operations planning process to create the demand and volume forecasts,
this process will be mapped with the purpose of understanding how the forecast is developed.
Once this process has been outlined, the step can be taken to see how the forecast is
communicated to suppliers. The purpose of this is to identify how the forecast is received and
in turn how it influences capacity planning at the supplier. By identifying this, the impact of
forecast accuracy on supplier confidence can be determined. Establishing the level of
confidence in the forecast enables the deduction of actions that can be taken by Company X to
improve supplier capacity planning. The topic for this study has been developed together with
Company X, and is focused on analyzing the forecasting process from the development of
6
customer demand to first tier suppliers with focus on capacity planning. Therefore, the scope
of the study is broad, and rather than doing an in-depth analysis of a single topic, a discussion
on different areas within the process will be conducted.
1.3.1 Contribution
The contribution of this study is to increase the knowledge and understanding for the internal
forecast process. In order to achieve this the internal forecast process at Company X has been
mapped to create an overview and simplification of the complex S&OP process. Therefore,
information has been gathered from documented processed and interviews with nine people
involved in different stages of the process. From this a number of process maps has been
created, this with the aim of providing an overview of the S&OP process to increase the
knowledge and understanding internally and externally. The process maps in the empirical
framework are created by the authors and is one of the major contribution of this study, to be
used by Company X to identify improvements to the process. Another contribution of this study
is the investigation of the connection between the internal forecast process and supplier capacity
planning. This is done with the aim of increasing the knowledge of the existing capacity
problem to identify the causes of the issue and recommendations for potential improvements.
The theoretical contribution is largely connected to the case study, providing empirical findings
on the operations of a mature S&OP process and a link between this process and external actors.
This is something that is missing from existing academic literature on the subject (Tuomikangas
& Kaipia, 2014).
1.4 Research Questions
Based on the problem definition and purpose, two research questions have been identified and
are stated below:
How is the forecast developed internally and how is it communicated to internal and external
suppliers?
How is internal and external supplier capacity planning connected to forecast communication?
1.5 Delimitations
Performing a case study at a large multinational company, a highly complex organizational
structure and supply chain are encountered. In investigating the supply chain process at
Company X, the focus lies on the forecast process. This means that the study will be limited to
the S&OP process and the forecasts used to develop it. In the S&OP process, the financial

7
aspect will be excluded to limit the scope of the study. For the same reason, the role of
marketing in the S&OP process will be not be studied in detail.
In the investigation of the different capacity planning processes at internal and external
suppliers, the focus lies solely on the planning stage and on how the forecast from Company X
impacts this planning process. Further investigating supplier communication, the study will
include all departments that have contact with tier 1 suppliers. However, the decision has been
taken to exclude the role of tier 2 suppliers, and the departments in contact with this type of
supplier from the study due to time constraints.
Due to the large scale of the company, the forecast process will be limited to only one of the
brands within the organization. When investigating the internal process, a number of interviews
is performed. When selecting interviewees, the number was limited to key people in the process,
as including everyone connected to the process is too large of a scope for this study. Another
aspect is that only few suppliers will be evaluated due to the time constraints of the study.
Specifically, this study is aimed at investigating the supply chain from a forecasting perspective
taking the approach from the S&OP process, from the sales market to tier 1 suppliers.
Performing interviews with everyone related to the topic is impossible, therefore
generalizations must be made based on the opinions of the interviewees. This also means that
there is full understanding for that the findings may have been different if the interview was
held with another person.
1.6 Structure of Report
The paper continues with an outline of the methodology used as the approach for this study and
to structure the interviews and processes. Following this, is the theoretical framework identified
as relevant to perform an analysis of the topic. Thereafter, the empirical findings are presented
with information gathered from existing processes, documented company information and
interviews. Finally, a discussion regarding the findings will be presented along with
recommendations connected to the discussion. To close the paper, a conclusion will be outlined
along with recommendation for further research.

8
2 Methodology
This section will describe the approach that has been used to conduct the study. It explains the
procedures and methodology approach in the context of collecting and analyzing information.
With the background of the existing problem, the goal was to describe and explain a process in
order to make deductions as of the source of the problem and to identify suggestions.
2.1 Research Paradigm: Interpretivism
The research paradigm uses a philosophical framework outlining how research should be
conducted (Collis & Hussey, 2013). There are two research paradigms that are used in research,
positivism and interpretivism. Positivism rests on the assumption that the social reality will not
be influenced by a researcher that investigates it (Weber, 2004). The positivism paradigm
postulates explanatory theories that are used to understand an existing social phenomenon, with
the goal of discovering theories that are based on empirical research (Collis & Hussey, 2013).
As positivism assumes that the social reality can be measured, it is said to be connected to
quantitative research methods based on statistical analysis (Weber, 2004).
Interpretivism developed as a reaction to positivism, and believes that the social reality will be
influenced by researcher’s studying it (Collis & Hussey, 2013). It believes that it is impossible
for a researcher to not be a part of and influence the phenomenon that is investigated, as
everyone brings their own values and perspectives (Weber, 2004). The focus of the positivism
paradigm is to measure reality, while interpretivism focuses on exploring the complexity of a
phenomenon and understand it. This suggests that research that is not measured by statistical
methods is interpretative and thus linked to qualitative research (Collis & Hussey, 2013)
Because of the nature of this study, a positivistic approach is not suitable to produce the
desirable type of findings. Therefore, we adopt interpretivism as our research paradigm, with
the aim of achieving findings that are derived from qualitative methods of analysis. However,
it must be noted, that several authors have raised a critical voice against this distinction, and its
relevance for research. Weber (2004), drew the conclusion that the difference lies in the choice
of research method, rather than providing another way to view the world. Positivistic studies
tend to use surveys and experiments, while interpretivists tend to use case studies. Thus, further
providing support for the use of an interpretivistic approach in this study.

9
2.2 Research Approach
This study aims to investigate supplier capacity planning processes from a forecasting
perspective. This is done by describing the forecasting process at Company X and thereafter
investigating how this is communicated and received by its external and internal suppliers. In
doing so, we can identify best practices and issues to provide recommendations for future
actions within Company X.
Using an applied research approach, this study aims to shed light on an existing problem within
the company that is the target of the research (Collis & Hussey, 2013). Applied research is
commonly used when a deduction is to be made about a specific problem, in a real-life situation
(Adams, Khan, Raeside & White, 2007). Within the framework of applied research, the result
of this study can be applied to help understand the capacity issue that Company X is facing.
However, as the topic of the study relates to a generally accepted theory, it can be used to
improve the understanding of existing concepts within Capacity Planning, Demand
Management, Forecasting and S&OP, which is the aim of basic research. The argument can
therefore be made, that the study crosses the border to basic research and uses a combination of
the two research approaches (Collis & Hussey, 2013).
The use of the deductive approach describes the logic of the research. The study is performed
in such a way that a conceptual and theoretical structure is developed and tested by empirical
observations. Therefore, the study moves from a general theoretical approach to particular
instances, using a deductive approach (Collis & Hussey, 2013). By narrowing real observations
to testable hypotheses, the outcome of the study may or may not align with the arguments in
theory. Issues that may occur using deductive methods are to a large extent related to ill-advised
assumptions leading to flawed conclusions (Adams, et al., 2007).
2.3 Research Design
2.3.1 Research Method and Research Entity
As mentioned above, this study is conducted at a large manufacturing company where the
current S&OP is studied with the purpose of understanding the process of creating the demand
forecast and tracing it throughout the organization until it reaches the supplier. The main focus
is the processes within Company X and how it affects the capacity planning at supplier level,
therefore this research is to be considered a case study. The purpose is to provide answers to
the research questions for Company X (Bryman & Bell, 2015).

10
2.3.2 Case Study
Adams et al. (2007) define a case study as “an in-depth study which explores issues, present
and past, as they affect one or more units (organization, group, department or person)” (Adams
et al., 2007, p. 112). The main purpose of a case study is to examine particular occurrences in
specific contexts that can be used to provide a comprehensive view of the processes used in
said contexts. Therefore, it is the method of choice by researchers when investigating
organizations. Yin (2014) goes more into detail, claiming that a case study is appropriate when
the processes in question are complex. In fact, Yin (2014) points out that a case study is
necessary in order to gain better insight, as the depth that distinguishes case studies from other
methods is essential to reach the desired outcome. The empirical data used to reach this outcome
is usually collected by researchers using a combination of observations and interviews, which
can be used to enhance the theoretical basis of the research. However, because of its depth, a
case study is often limited scope-wise and is not meant for generalization, as they examine the
uniqueness of the unit in question (Adams et al., 2007).
Since Demand Management and Capacity Planning are complex processes (Basu & Wright,
2017), a research method in the form of a case study seemed appropriate (Yin, 2014). The
complexity of processes increases further as Company X has a global supply chain with a
dispersed customer and supplier, something that can cause several disturbances to operations
(Basu & Wright, 2017).
2.3.3 The Research Subject
Developing a case study is an understandable choice, as it is the ideal method of examining
specific processes in real life to get a better understanding of the object in question (Yin, 2014).
Therefore, the empirical data has been gathered at a large multinational manufacturing
company. There is a multitude of reasons for choosing this particular company. First of all, this
is a large company, with almost 100,000 employees located in nearly 30 countries around the
globe and more than 2,500 suppliers worldwide. An investigation on how the demand creation
process is managed was considered to be of interest for a company of this scale, as a result of
the high degree of complexity that governs a global supply chain. Cross-functional processes,
in particularly, are accompanied by high complexity that only intensifies if the organization is
multi-national and part of a global supply chain (Basu & Wright, 2017). Lastly, since the
manufacturing company that was examined has provided us with sensitive and sometimes

11
confidential information for the purposes of this study, we have come to an agreement to keep
the name of the company, its suppliers and the interviewees undisclosed throughout this paper.
The topic of the study was developed together with Company X that expressed the desire to
have more information on the forecasting process in the face of capacity constraints and market
uncertainty. Therefore, the current forecast creation has been studied with the purpose of
mapping the series of activities linked to it and tracing it throughout the organization until it
reaches the suppliers. The main focus lies on the process within Company X and how it affects
capacity planning at supplier level. The goal is to structure in such a way that will answer the
research questions for this particular case and provide Company X with valuable results and
recommendations.
In order to handle the disadvantages of the specific case study and provide a more in-depth
result, clear delimitations had to be set. The scope of the study had to be narrowed down in
order to deal with the limitations. This was done in consultation with our school supervisor and
the team we worked with within Company X. A company of this scale has processes that run
through multiple functions, which would be impossible to examine all in-depth. So, first and
foremost, the focus was placed on one of the brands within the company. Furthermore, the
supplier interviews were limited to one internal and two external suppliers and only first tier
suppliers were considered, as it is also mentioned in the delimitations of the study.
2.3.4 Qualitative Approach
In research, either quantitative or qualitative methods can be used as an approach to the research
questions. In quantitative studies, researchers gather numerical data that is then analyzed using
statistical methods. In qualitative methods, qualitative data is gathered and analyzed using
descriptive methods (Collis & Hussey, 2013). Qualitative research utilizes distinctive methods
for information collection such as, observation, in-depth interviews and text analysis. What
differentiates these methods from quantitative research is the possibility for flexibility and
openness in the study (Simonsson, Hjorth, Sandberg & Thelander, 1998). As the interpretivism
paradigm is used as the philosophy of the study, there is no desire to use statistical analysis of
data (Collis & Hussey, 2013). Instead qualitative data will be gathered using observation and
semi-structured interviews and then interpreted using qualitative methods. This enables the
researchers and respondents to ensure that the questions are clearly phrased and defined in order
for the topic to be fully understood (Adams, et al., 2007).

12
The qualitative approach is especially appropriate for studies that see to examine an occurrence
to fully understand its root cause and the processes surrounding it (Adams, et al., 2007). In
studying complex events and situations, it is helpful to use the qualitative research approach as
it allows more details to be gathered on the subject to understand it in more depth (Collis &
Hussey, 2013). In order to gather the details required for the study, the research questions have
been designed using “how” and “why”, to open up for discussion and analysis of the findings
(Adams, et al., 2007).
This study aims to investigate complex internal and external processes, by reviewing existing
documentation and performing interviews. In the light of this, a qualitative approach is
identified as the most suitable method to identify all details in the process. For this paper, the
choice has been made to perform a case study to fully understand the problem faced by
Company X and how it could be investigated with the use of a theoretical framework. The use
of semi-structured interviews with open-ended question presents the ability to get access to
other perspectives and additional insights into the identified problem. Given the characteristics
of the study, it is clear that no other method of investigation could have been chosen. However,
the criticism towards qualitative studies must be addressed, so that it can be taken into
consideration when constructing the study. Points to be discussed include the difficulty in
replicating the study, as the findings are impacted by the context and the time-frame, thus
displaying low reliability. In general, qualitative studies are said to produce results with high
validity but low reliability. Along with these issues, a lack of transparency in the selection of
respondents and data analysis can be identified (Collis & Hussey, 2013), this is something that
will be present to some extent in this study due to confidentiality.
2.4 Data Collection Method
For this study, both primary and secondary sources have been used. The primary sources consist
of interviews performed at Company X and with selected suppliers to the company. These
interviews are conducted to gather new information on the current processes at Company X.
Secondary sources that have been used have been gathered internally and externally from the
company. To provide an overview, documented information about current processes at
Company X has been utilized. External secondary sources in the form of books, and academic
journals have been used to develop a background and a theoretical framework to the topic.
13
2.4.1 Observations
Although observations can be used as a single source of data collection, in this study it is used
as a complement to interviews and documented company processes. In case studies performed
at companies, it is often important to note company operations outside the interviews, such as
physical infrastructure, employee behavior and organizational culture. While investigating
operations within a company, it is important to be unobtrusive, so that operations are as normal
as possible (Adams, et al., 2007). Yin (2014) brings up the concept of “direct observations”,
referring to observations that are done in the objects “natural setting”. For this study, we use
participant observations, meaning that we have become part of the organization, as employees
(Adams, et al., 2007). This choice has been taken to get full insight into the company and reduce
confidentiality concerns. This way, we managed to collect data that could not have been
received through interviews, either because the interviewees might consider them negligible or
because they are intertwined in their everyday life and no longer actively considered.
2.4.2 Primary Source Information
The method used to determine the sample is the Snowball (or Network) sampling. This method
is especially useful for non-probability sampling where respondents are difficult to identify. It
is more efficient when the members of the target sample are connected through some type of
network. The sampling process is initiated by locating a group to be interviewed; this can
typically be done using observation methods. This group is then asked to identify other
individuals that would be interesting to interview, and the process continues on like a snowball
(hence the name) increasing the number of individuals in the sample. Clear advantages of the
method are lower sample sizes and costs, the disadvantage is that bias is likely to occur as a
person recommended by another tend to be similar to the first person. This must be carefully
considered in selecting the sample, as well as in analyzing the results from the interviews
(Adams, et al., 2007).
2.4.3 Exploratory and Semi-Structured Interviews
As the study performed is a qualitative study, semi- structured interviews are used to gather
qualitative data. This provides in-depth information about company processes, using either
face-to-face or telephone/Skype interviews. The aim of these interviews is to get a well-rounded
understanding of the forecasting process at Company X and its impact on supplier capacity
planning. In any study, formulation of the problem is key to successful research, and part of
this is having access to the stakeholders relevant to the study. In order to identify them

14
exploratory interviews with company supervisors and other employees have been performed in
a non-formal setting to determine the scope of the study and to identify relevant stakeholders
(Adams, et al., 2007).
The in-depth interviews are often semi-structured to allow a more general discussion to find all
relevant information to the topic. Interviews tend to last about an hour to have the time to
explore all topics without putting too much pressure on the respondent (Adams, et al., 2007).
The questions posed to the respondents are based on the theoretical framework to ensure that
the outcome of the interviews is aligned with the scope of the study (Collis & Hussey, 2013).
The interview guide can be found for further review in appendix 2 and 3. By performing semi-
structured interviews the researchers are able to steer the discussion while allowing the
respondent to freely expand on the subject (Collis & Hussey, 2013). However, the bias that may
occur in interviews must be considered. The most common bias is that the question or answer
is misunderstood, either by the interviewer or the respondent. To avoid this, the questions must
be targeted towards the respondents’ field of expertise and by creating clear and defined
questions. Another source of error is interviewer bias, it may occur through personal bias, or
untruthful replies from the respondent. The interviewer must also remember that the respondent
may direct their answers to please the researcher. In this study, both face-to-face and Skype
interviews are held due to the large geographical distances between business units (Adams, et
al., 2007).
2.4.4 Secondary Data
Secondary data is information collected by someone else; an organization, company or another
researcher. This type of data is usually in the form of books or articles and accessible from
libraries or on the Internet (Adams, et al., 2007). For this study, secondary data is used to
support the findings from the primary data as well as providing an overview of theoretical
methods and company processes. The drawbacks of secondary data should also be mentioned,
initially the quality of the information should be carefully controlled before using it and the
authenticity of both the information and the source considered. Source criticism should be
considered at every step of the process. Another aspect to consider is the compatibility and
relevance of the information to the scope of the study.
For the background and theoretical framework, a combination of peer-reviewed articles and
books have been used as a source of information. The books have been identified using library
15
services and examined for its relevance to the scope of the study. Articles have been identified
using academic journals, such as the International Journal of Production Economics, the Journal
of Operations Management and the Strategic Management Journal. By using published books,
peer-reviewed articles and our knowledge in source criticism, the reliability and accuracy of the
sources can be believed to be high. The extensive research field in Supply Chain Management,
and in the sub-fields of Capacity Planning, Demand Management and Sales and Operations
Planning, ensures the access to multiple perspectives on these processes from a varied group of
researchers.
For the identification of current processes used in the empirical framework, an outline of the
processes used at Company X was studied. The information on the S&OP process has been
carefully outlined by individuals that are knowledgeable and experienced in the existing
processes at Company X.
2.5 Reliability and Validity
2.5.1 Reliability
The concept of reliability is strongly connected to the consistency of the study (Adams et al.,
2007). Bryman & Bell (2015) interpret reliability as whether or not a study is repeatable and
refer to it as a term that is mostly found in the context of qualitative studies. In order to achieve
reliability in a qualitative study there are two important factors that need to be taken into
consideration, stability and inter-rater reliability. Stability relates to whether the time of the
study has an effect on the results, while inter-rater reliability relates to influence the researcher
him/herself has on the result, meaning that it tests whether another researcher would come to
the same result or not (Cohen, Manion & Morrison, 2011). Even if a study is found to produce
reliable results it does not mean that they are valid, but rather that the results are predictable
(Adams, et al., 2007). While performing a case study, company processes are investigated at a
single point in time. Therefore, it is highly possible that the study would not have come to the
same conclusions regarding company processes if the same study would be conducted at a
different time. A company is not a fixed entity but evolves, with improvement projects and
reorganizations, the structure of the organization may also vary substantially over time. Given
this, it can be concluded that a case study rarely displays the criteria for stability. When
performing interviews and observations within the organization, the results vary depending on
the researchers’ perspective, aligning with the adoption of an interpretivism paradigm. The
answers and perspective of the respondent also varies over time and depends on the setting in

16
which the interview is held. However, to improve the reliability of the results, the choice was
taken to hold several interviews with people with different perceptions of the process. This
enables us to see where the views differ and where information overlaps, to fully understand
the processes. Therefore, given that the processes are not restructured within the organization,
the holistic view of the research subject would be similar if performed by another researcher in
another point in time.
Even though this study fulfills the requirements for internal consistency, it lacks stability and
therefore displays low reliability. However, as mentioned above, that was an already known
fact about case studies (Collis & Hussey, 2013) when the research method was chosen.
2.5.2 Validity
Validity refers to the credibility of the study´s results. Simply put, it measures the genuineness
of the research (Adams, et al., 2007). According to Cohen et al. (2011), the validity of a study
is divided into internal and external. External validity is referring to the extent as to which the
results of a particular study can be generalized. On the other hand, internal validity deals with
the methods that were used for the study and whether or not they are effective or even capable
of measuring what was meant to be measured. Since this research has been conducted as a case
study, the external validity is low. As the subject is a specific company, data connected to the
organizational processes has been gathered and therefore the conclusions may only be valid for
the particular company. However, several measures have been performed to make sure to
achieve the highest degree of internal validity possible. Both observations and semi structured
interviews are considered methods highly appropriate for case studies (Yin, 2014).
Furthermore, triangulation was used to validate the findings. The concept of triangulation
involves the use of two or more methods of data collection and is an especially important tool
for researches within social sciences (Cohen et al., 2011). As mentioned above, both
observations and interviews were used for data collecting purposes. The two methods
complement each other in the sense that the data collected from observations were validated
during the interviews and the data collected through interviews were validated by observations
wherever possible.

17
3 Theoretical Framework
Presented here is the theoretical framework that serves as the foundation for the empirical
study and analysis. The theory is based on existing research in the field of Demand
Management, Capacity Planning and Sales and Operations Planning. The structure of the
theoretical framework will emphasize the position of each of these fields of research within the
field of Supply Chain Management. The Sales and Operations Planning process serves as the
integration mechanism, integrating the fields of Demand Management and Capacity Planning
(see figure 1).
Figure 1: Theoretical Framework
At the company at which the case study is performed, the Sales and Operations Planning process
is used to create the demand forecast, and in turn to determine desired supplier capacity. As the
S&OP process connects the two main topics of this thesis, demand management and capacity
planning, it will be described further from the perspective of these processes. The approach of
this study is not simply looking at the internal processes of Company X, but examining how the
output of this process, the forecast, impact the way suppliers plan their capacity. The sections
below will therefore outline a theoretical framework for the Demand Management and Capacity
Planning to be used for the analysis of these processes at Company X and its suppliers. The
coordination mechanism, Sales and Operations Planning, has been chosen in part because of its

18
relevance in theory but mainly because it has been implemented by Company X to produce the
volume forecast internally and externally.
Tuomikangas and Kaipia (2014) performed an extensive literature review within the field of
S&OP and identified a gap in existing literature. In literature, there is a lack of empirical studies,
and in particular case studies and given the complexity of the S&OP process, these types of
studies are important to fully understand the process. This study therefore aims to contribute to
this gap in literature by performing a case-study at a multi-national company that employs the
S&OP process. The S&OP process at Company X is mature and has been developed over time,
this study can therefore provide other researchers in the field with an understanding of how the
process works after implementation. Thus, enabling researchers to review the process and how
it can be used to achieve strategic goals within the company. In addition to this, the study
investigates the impact of the S&OP process beyond the confines of the company, a topic that
the authors have not found in existing academic literature.
3.1 Supply Chain Management
In any market in which goods and services are exchanged, there are activities that link suppliers
to customers. Supply Chain Management (SCM) was created as a tool to balance these links
and provide the best value for customer to an as low as possible cost and effort for suppliers.
Mentzer, DeWitt, Keebler, Min, Nix, Smith and Zacharia (2001) use previous research to
develop the following definitions for a supply chain and Supply Chain Management. A supply
chain is defined as:
“A set of three or more entities (organizations or individuals) directly involved in the upstream
and downstream flows of products, services, finances, and/or information from a source to a
customer” (Mentzer, et al., 2001, p. 4).
The concept of Supply Chain Management is defined as:
“The systemic, strategic coordination of the traditional business functions and the tactics
across these business functions within a particular company and across businesses within the
supply chain, for the purposes of improving the long-term performance of the individual
companies and the supply chain as a whole” (Mentzer et al., 2001, p. 18).
In manufacturing and production organizations, Supply Chain Management is particularly
concerned with the flow of production components through the system to deliver on time to
fulfill customer requirements while maintaining low costs (Basu & Wright, 2017). According

19
to Bowersox et al. (2010) one of the main reasons for unsatisfactory supply chain performance
is lack of visibility. Supply chain visibility does not only relate to the ability to track products
and inventory within the company but also the access to and proper use of the information on
company resources. Increasing visibility throughout the chain can prevent potential disruptions
by creating activity and resource plans to counteract the problem (Bowersox, et al., 2010).
Mentzer et al. (2001) traced the increased interest in Supply Chain Management back to the
globalization and following global sourcing and pressure for speed, quality and cost in
competition. As previously discussed, these factors create more uncertainty in the global
economic environment. With global supply chains companies must identify tools such as SCM
to help them coordinate the flow of products and services to and from the company (Mentzer,
et al., 2001). In order to improve the performance of the business, customer demand must be
matched with the capabilities of the company, existing knowledge and resources, flexibility and
capacity. If these capabilities are not present internally, the company must seek to find them
externally by identifying world-class suppliers (Basu & Wright, 2017).
Achieving a balance between customer service and capacity and resource planning may be one
of the hardest tasks for an organization. When the organization is faced with excess capacity
and large inventory, managers and the financial departments aspire to reduce inventory to free
up capital (Vollmann et al., 2005; Jonsson & Mattsson, 2009). On the other hand, if the
organization lacks capacity to fulfill customer demand, firm performance is also impacted.
Developing successful supply chains enables organizations to balance capacity and customer
satisfaction while improving company performance. In order to properly plan production and
capacity, the organization must have access to an estimate of future demand. The demand can
only be accurately predicted if customers order in advance and they commit to these orders.
This may be possible in the short-term, but as the time horizon increases, the accuracy of the
forecast declines. Thus, the creation of accurate forecasts in the medium and long-term is a vital
task to properly plan future production capacity (Basu & Wright, 2017). To provide reliable
forecasts, the organization must develop an effective communication of information beyond
company borders. Sharing information between all participants in the supply chain improves
cooperation and thus planning in all time horizons. By providing suppliers with a preliminary
supply plan for the coming year, the attention can be put on potential capacity bottlenecks. In
the short-term, suppliers receive daily supply plans, that include the orders for the coming time-
period, as well as forecasts for coming weeks and months (Meyr, 2004).
20
In their research, Crum and Palmatier (2003) found that despite the advantages of integrated
business process and long-term demand planning such as increasing profitability and customer
satisfaction, many companies have not yet implemented these processes. In order to develop an
efficient and flexible supply chain, the organization must identify trade-offs where investments
and increased costs in areas such as manufacturing or warehousing, might lead to a lower total
cost for the organization (Bowersox, et al., 2010). Alongside the increased popularity of Supply
Chain Management, Sales and Operations Planning has been recognized as an efficient process
for supply chain planning (Feng, D’Amours & Beauregard, 2008). In order to successfully
implement processes such as demand management and S&OP, the company must display great
competency within areas such as business process integration, employee development and
information infrastructure. This in turn translates into investment of time and resources to
allocate and develop these competencies, explaining the relatively low usage of these methods.
Often companies try to improve their forecasting methods using easier approaches, often
relying heavily on information technology. However, for creating accurate forecasts and
successful demand management processes, information systems must be combined with human
knowledge and experience (Crum & Palmatier, 2003).
3.1.1 Supplier Partnership
Historically, suppliers have often been perceived as opponents to the organization (Basu &
Wright, 2017). Purchasing departments have been tasked to secure the best deal, with the
highest quality to the lowest costs. Suppliers have recognized the lack of loyalty from
organizations and long-term relationships have therefore rarely been developed. With increased
demand for performance on the global market, organizations realize the value of securing
world-class suppliers, with whom partnerships and information exchange agreements can be
formed. The consequences of poor coordination in supply chains have made companies realize
the benefits of collaborating with supply chain stakeholders (Basu & Wright, 2017). Companies
that share an understanding and respect for each other’s knowledge and skill are more likely to
develop collaborative relationships. Sharing information and processes improves the
performance of the supply chain and strengthens the relationship, thus generating benefits such
as reduced cost, improved quality and trust for all stakeholders (Zacharia et al., 2009). By
building alliances and long-term relationship, suppliers can become an additional source of
market intelligence. Partnership agreements are often characterized by data exchange, using
information systems, such as Electronic Data Interchange (EDI), enabling real-time

21
communication between the company and its suppliers. The success of the partnerships is
however solely dependent on mutual trust (Basu & Wright, 2017).
Creating partnerships with suppliers, improves the coordination and flexibility of the supply
chain in order to meet customer requirements and generate competitive advantages (Mentzer,
et al., 2001). An organization that focus on developing company specific internal supply chain
processes, such as forecasting, capacity planning, inventory management and distribution
management, can achieve excellence in operations within the confines of the organization.
However, in order to optimize customer service and competitiveness, the organization must
adopt a total view of the supply chain, working in collaboration with all stakeholders. When
establishing collaborative partnerships, all stakeholders must understand the necessity of
forecast accuracy and transparency (Basu & Wright, 2017). In developing supplier
relationships, trust is a key to developing long-term collaborative partnerships. There are
numerous studies that emphasize the organizational benefits of supplier partnerships
characterized by trust, and especially its ability in increase competitive advantages (Barney &
Hansen, 1994; Jarillo, 1988; Mohr & Spekman, 1994; Sako & Helper, 1998). Jarillo (1988)
identifies other benefits from the establishment of supplier trust, such as lower total costs due
to specialization and a reduction in risk and uncertainty stemming from dynamic and volatile
markets. Trust is something that is built over time, by establishing information sharing practices
and showing commitment to the customer-supplier partnership. This is especially important in
the automotive industry where the customer tend to have more market power than its suppliers
(Sako & Helper, 1998). For suppliers, the commitment of capacity to a customer is a question
of risk. If the supplier attaches a large share of their capacity to a single customer they are
vulnerable if anything was to disrupt customer demand (von Massow & Canbolat, 2014).
3.2 Sales and Operations Planning
Companies need to develop efficient and well-integrated supply chains in order to be
competitive in the global market. As stated by Bowersox et al. (2010) an integrated business
management process such as Sales and Operations Planning is necessary for an organization to
achieve this. The purpose of the S&OP process is to create a cross-functional process to balance
supply and demand as well as connecting the strategic organizational plans with the operational
plans (Thomé, Scavarda, Fernandez & Scavarda, 2012a; Lapide, 2006). The concept of Sales
and Operations Planning stems from the Manufacturing Resource Planning (MRP) process and
has been developed into a formal planning process (Basu & Wright, 2017; Olhager, Rudberg &

22
Wikner, 2001; Vollmann et. al, 2005) with the aim of creating a coordinated plan to respond to
customer demand within the capacity constraints of the business (Bowersox, et al., 2010;
Lapide, 2006). The S&OP process runs on a monthly occurrence and is continuously reviewed
by managers at an aggregate level to determine alignment to the strategic goals (Sheldon, 2006;
Thomé, Scavarda, Fernandez & Scavarda, 2012b; Schorr, 2007a). The development of tactical
plans through the S&OP process can help managers steer the business towards competitive
advantage by integrating customer focus and the management of the supply chain. By
combining the sales, marketing, manufacturing, sourcing and financial plans into one integrated
set of plans on both the detailed and aggregate level (Thomé, et al., 2012b). Identifying the gaps
between the strategic business plan and the activities within the company is one of the main
purposes if the S&OP process in order to run the company as one business (Schorr, 2007a).
Due to the ramifications of the decisions made in the S&OP process, both monetary and
operational, the ownership of the process should lie on the top-management level, and it should
receive the proper attention and careful consideration (Sheldon, 2006).
Vollmann et al., 2005 identifies five steps in the monthly planning process, initially a sales
forecast should be developed, thereafter a demand plan is outlined, and this is then used to
develop a supply plan. These plans are then followed by a pre-S&OP consensus meeting and
lastly a top-executive meeting that determines release of the final plan (Vollmann, et al., 2005;
Sheldon, 2006). Lapide (2011) describes a similar outline of the S&OP process, where the
process is driven by a baseline forecast that reflects the demand in the marketing and sales
plans. This plan drives the supply plan that reflects the activities performed by operations,
manufacturing, logistics and purchasing organizations. Other researchers outline the process
with different steps, Schorr (2007a) includes an additional step before the development of the
demand plan, the product management review, that includes the new product introduction and
other activities that influence demand and supply. The product management review is by other
researchers included in the creation of the demand plan and not outlined as a separate step
(Sheldon, 2006, Lapide, 2011). From studying various companies Sheldon (2006) identified
what benefits a company can gain by implementing a successful S&OP process. The main
advantages of S&OP are increased communication and cooperation between the demand and
supply side of the company; this in turn leads to better customer service by shortening lead
times, increasing capacity utilization, more flexibility to market changes, more accurate
planning and eventually increased profitability. The benefits for top-management also
encourage the use of S&OP, essentially creating discipline in the organization and thus enabling

23
better risk management and payback on investments (Sheldon, 2006; Crum & Palmatier, 2003;
Vollmann et. al, 2005; Basu & Wright, 2017). As stated by Sheldon (2006) with these benefits,
it is easy to understand why the S&OP process has become popular amongst manufacturing
companies.
Previously, financial, sales and operational plans have been developed in isolation, often with
conflicting goals. The process is then usually initiated with the development of strategic
financial targets, thereafter sales and marketing plans are developed to meet these strategic
goals. In the last stage, the operational plans are developed in response to the sales demand plan
(Bowersox et al., 2010). Cross-functional integration often generates conflicts, with sales
pushing for selling more products of high variety, while responding to customer demand with
short lead times (Vollmann et. al, 2005). While operations instead prefer minimizing product
variety and extend lead times to exploit economies of scale (Bowersox et al., 2010). The aim
of the S&OP process is to align the different plans created in an organization to improve the
efficiency of the supply chain. For the process to work consensus must be reached to create one
common plan. If consensus is not reached for the different plans and an agreement cannot be
reached, the collaboration often collapses. This results in sales and marketing producing their
own numbers, to drive the plans, and thus, operations and finance cannot be sure what numbers
should be used to drive their plans. In the end of this process each function has created their
own numbers based on a best estimate of the demand numbers, and the final volume forecast
will not display high accuracy. Given this process, the suppliers feel unable to have confidence
in the forecasted numbers and chose to operate from once again their own set of numbers. This
type of process typically results in a bullwhip effect and customer requirements for volume and
delivery precision cannot be fulfilled. With unsatisfied customers, the organization loses sales
and profitability is decreased (Crum & Palmatier, 2003). Using the S&OP process provides all
involved functions with an efficient way of controlling company operations across all stages of
the supply chain (Basu & Wright, 2017). Cross-functional planning processes such as the S&OP
have shown some evidence to counteract collaboration problems and misalignment. Thomé et
al. (2012b) found that if the internal processes are aligned, supply chain integration with both
customers and suppliers is improved.
3.2.1 Planning Horizon
In many businesses, the S&OP process is seen as a long-term planning process, this conflicts
with the perspective presented by Lapide (2011) that the S&OP is a medium-term tactical
24
planning process different from the long-term strategic planning process. Following this
definition, three planning levels are outlined, strategic, tactical and operational, from long-term
to short-term in that order. The time horizon is what the major difference between the planning
levels, strategic plans have long planning horizons developing aggregated plans that change at
will. Tactical plans are medium term, developed in detail and updated according to a
predetermined schedule; the operational plans have the shortest planning horizon, are most
detailed and change most frequently. The S&OP process is based on strategic plans, to create a
tactical plan that drive operational plans, meaning it connects strategy to execution. Thus, the
accuracy and effectiveness of the S&OP process determine how well the strategic goals will be
reached. The output of the S&OP process is a set of tactical plans based on demand and supply
that should be driven by the goals of the strategic plan. Developed by first generating a demand
plan that in turn drives the supply plan in order to create a final S&OP volume plan within the
company (Lapide, 2006).
3.3 Demand Management
The use of demand management practices in manufacturing companies is a relatively new
phenomenon; just thirty years ago it was more or less unheard of. Crum and Palmatier (2003)
discuss the existence of forecasts, in a small number of companies, but the process of
forecasting was rather unknown and only to a small extent used to drive financial plans and
production planning. As mentioned previously, the increased complexity of the market, with
more customization, and demand for speed, flexibility and accuracy, organizations must be able
to be determine inventory requirements as correctly as possible, demand management is a tool
to help provide these capabilities (Bowersox, et al., 2010). At present day, companies develop
new models in their supply chain for managing demand. The developed demand plans are used
to drive financial plans and supply plans, resulting in demand plans being updated at a higher
frequency, with monthly plans rather than annual or quarterly (Bowersox, et al., 2010; Crum &
Palmatier, 2003). The collaboration between customers and suppliers has evolved to include
communication of demand information and developing strategies for sales and marketing
(Crum & Palmatier, 2003). In realizing the potential benefits of collaborative partnerships
between suppliers and customers, companies are finding that in order to be successful in
collaboration, they must have effective internal processes for demand forecasting. Initiating
processes such as Sales and Operations Planning to improve integration between demand and
supply and in turn improve forecast accuracy, requires cross-functional cooperation and
therefore action must be taken to reduce silo-mentality between departments of the company.
25
The ultimate objective of integrated business processes is both to ensure that demand, supply,
and financial plans are synchronized and executed according to plan. As well as ensuring that
the decisions taken with regards to these plans will yield top financial performance for the
organization as a whole (Crum & Palmatier, 2003). If demand information is properly shared
throughout the supply chain, it also reduces the uncertainty about volumes. Fluctuations in
demand decrease the use of safety stock and other methods to secure delivery is made redundant
(Crum & Palmatier, 2003).
The demand management process includes four elements, the planning, communication,
influencing and managing of demand. Within these elements it is vital to remember that
planning demand goes beyond the creation of a forecast and that estimated demand should be
communicated to all supply chain partners. The third stage relates more to the marketing
function and how customer demand can be influenced by company activities. Lastly, the
estimated demand should be matched with current capacity (Crum & Palmatier, 2003). The
S&OP process is often used as method for integrating these processes and ensure that they are
performed efficiently (Basu & Wright, 2017). In essence, demand management is created by
integrating historical forecasts with other elements that could potentially influence sales
(Bowersox, et al., 2010).
Another aspect of demand management brought forward by Bowersox et al. (2010) is its use to
create forecast consistency through all aspects of business operations. The aggregate plan must
reflect both sales, financial as well as operational targets and constraints. Demand management
is a component of the S&OP process, developing the unconstrained demand plan. Demand
management within S&OP begins with the development of a sales forecast including market
demand, pricing and promotional activities along with the mix of products that is predicted to
be sold (Bowersox, et al., 2010).
3.3.1 Forecasting
As mentioned previously forecasting within demand management should be treated as an
ongoing process, to be updated regularly to maintain high accuracy (Crum & Palmatier, 2003).
Forecasting is the process of estimating what is to be sold, at what time and in what market
(Bowersox, et al., 2010). Contrary to what most think, forecasting should not be about
predicting what the customers are going to buy, but rather affecting their actions and proactively
steer demand. This means that marketing and sales departments must analyze the impact of

26
their strategies on the market. Forecast accuracy refers to the difference in what is projected to
be sold and the actual sales. This calculation should be done continuously measuring the
forecast error over time using statistical methods (Bowersox, et al., 2010). Being able to forecast
demand with 100 percent accuracy is very rare, end even top organizations expect an error
between 15-20 percent (Sheldon, 2006). Therefore, the recommendation made by Sheldon
(2006) is that it is better to estimate demand a little lower, to avoid having excess inventory that
they are unable to sell. However, if the forecast is continuously wrong in estimating future
volumes, the confidence in it declines and the forecasts will not be used by the different
departments. This creates a vicious circle as little effort will be put on improving the forecast if
it is not used. Often when faced with forecast accuracy issues, one or more of the elements of
demand planning is not operated efficiently. By using tools such as the S&OP process to
integrate the demand management elements, a broader view of demand will be achieved thus
improving the quality of the forecasting process (Crum & Palmatier, 2003). To achieve forecast
accuracy a business, need to take a long-term commitment to drive the process (Bowersox, et
al., 2010). However, it is important to be aware of the importance not only of forecast accuracy,
but also forecast allocation. Based on the forecast, supplies are allocated to regions or business
areas as outlined in the forecasted demand. However, the actual demand may differ from the
forecast, and improper forecast allocation is then a source of supply chain disruption (Ganesan,
2015). The demand planning process enables companies to determine the potential for profits
while estimating capacity and financial figures. This makes the forecast one of the most
valuable elements in the risk management process (Sheldon, 2006).
3.3.2 Forecasting Techniques
When producing forecasts, companies can employ a number of different techniques dependent
on the type of business and the characteristics of the products. Qualitative forecasting is done
by using knowledge, experience, and judgement in combination with existing data. It is
however, very difficult to predict the future simply by looking at the past. Common approaches
within qualitative forecasting is expert opinion and market surveys. Expert opinion is often
done by a group of people, using scenario planning to try understanding the impact of future
trends on the organization. The second method of forecasting is quantitative and often uses
statistical methods such as time series analysis. This approach uses mathematical and statistical
analysis to estimate future demand based on historical data. Casual forecasting is the third
forecasting method that is commonly used to see what effect a small event may have on demand.
This approach put emphasis on analysis past events to understand how they impacted demand
27
historically. The common-sense approach is the last forecasting method and is a combination
of qualitative and quantitative forecasting approaches. As can be understood from the name,
the manager uses common sense to interpret existing data using their judgement and expertise
(Basu & Wright, 2017).
3.3.3 Demand Sales & Operations Planning
Using Demand Management in combination with Sales and Operations Planning processes
improves the performance of the supply chain (Vollmann et. al, 2005). In short, meaning that
products are available to satisfy customer demand. As well as potential problems in capacity
are communicated to the sales organization so that the correct information is shared with
customers. Improving these processes also enhances the performance of the firm in terms of
profitability and market share (Crum & Palmatier, 2003; Schorr, 2007c). The development of a
robust S&OP process, provides a connection between the demand side and the operational side
of the business. Good collaboration between demand and supply, is an important tool to
minimize risk. In essence, the S&OP process is about ensuring that goals are shared throughout
the organization, but also to make sure that each function understands what effect their decision
has on other functions within the organization (Sheldon, 2006).
Sheldon (2006) outlines the inputs used to create the demand plan as the business plan,
marketing plan, sales plan and historical data. Schorr (2007c) includes other information that is
important to create the demand plan, as amongst other, customer orders, division volume
requirements, spare parts and internal needs. For these inputs to be used to create a good demand
plan, the information must be of high quality, and it must be carefully linked to the strategic
goals of the business plan. Only then can the demand plan be used to improve decision making
throughout the business. As the demand plan is the basis for the continued S&OP process, the
inputs used to generate it is important to company success. In a high performing organization
measurement tools are implemented to ensure that the results of the process match those
predicted in the strategic plan (Sheldon, 2006). In his article, Schorr (2007c) outlines four steps
to create the demand plan. Initially, a preliminary demand plan should be created based on a
prediction on customer demand, this includes a sales forecast and other actions that may impact
demand. This is done as a collaborative effort by the sales and marketing function providing a
best estimate of future sales. The second step is to communicate the demand plan on both an
aggregate and detailed level to other functions such as supply and finance. In doing so each
function can evaluate the estimated demanded volumes against the business plan and existing

28
resources. In the third step of the demand plan process, a consensus demand plan should be
developed. The purpose of this step is to align different opinions and perspectives to generate
one demand plan that everyone can agree on. Lastly any exceptions should be managed
throughout the S&OP process, this includes responding to market fluctuations and allocation
of resources (Schorr, 2007c). The demand process is similarly explained by Sheldon (2006),
with the development of a preliminary meeting that is reviewed in challenge meetings where
the likelihood of the demand plan to be executed according to strategic goals and allocation of
resources is evaluated. In the review meeting, information on strategy, the forecast and product
management are considered in order to create an unconstrained demand plan (Schorr, 2007c).
The control mechanism in the S&OP process, utilizes the challenge meeting to control and
balance plans to improve the management of risk (Sheldon, 2006). The output of the demand
planning process is therefore, the unconstrained challenged demand plan, developed on
different levels of detail for different functions. The unconstrained challenged demand plan
shows what the sales and marketing function estimates can be sold in the different markets
without considering any constraints within the organization (Schorr, 2007c). Sheldon (2006)
describes the unconstrained challenged demand plan as a forecast divided by product groups
with a 12-month rolling planning horizon. This plan is then used as the input to the supply plan,
enabling the planning of capacity (Sheldon, 2006). Demand plans can also be used to prioritize
demand when faced with capacity constraints. The demand plan determines how resources
should be allocated between customers when demand exceeds supply (Schorr, 2007c).
According to Sheldon (2006), the demand plan is the most discussed aspect of the S&OP
process. Often this is because the forecast is blamed for issues in planning, however, some
researcher claim that the forecast is not always to blame. As the forecast is based on customer
demand the discrepancy between forecasted and actual volumes is more often due to the
unpredictable nature of customers and the difficulty in predicting human behavior (Sheldon,
2006). The main strength of S&OP is that if performed effectively it provides forecasts of higher
accuracy. However, since its planning horizon extends over a longer timeframe than the more
commonly used production planning tools, it could have a negative effect on forecast accuracy.
However, there are several techniques to reduce forecast error, for instance, aggregating
demand into family groups will often lead to higher accuracy (Basu & Wright, 2017).
3.3.3.1 Forecasting in S&OP
To develop a forecast within the S&OP process Lapide (2006) highlights two approaches, the
top-down and bottom-up forecasting. These approaches can be used to develop the forecasts

29
used to create the demand plan. By using these two methods in combination; the accuracy of
the forecast can be improved. To create a brand level forecast, the top-down approach is
suitable to be able to disaggregate the brand level forecast to a SKU (Stock Keeping Unit) level
forecast. However, product group level forecast can be developed by aggregating the brand
level forecast using bottom-up forecasting. For all departments involved in S&OP to commit to
the process, and increase the accuracy of the forecast, every function should be involved in
developing and reviewing the forecast. For this to be possible, the forecast must be developed
at different levels so that it is presented in such a way that it translates to the "language" used
in the specific department. For example, in operations the forecast should be presented at the
SKU level, while for sales a brand or product group level is more appropriate. In order to
generate different level forecasts a combination of top-down and bottom-up forecasting should
be used (Lapide, 2006).
3.3.4 Bullwhip Effect
Forrester (1958) was the first one to refer to the impact of demand variations on the supply
chain. However, according to Rong, Shen & Snyder. (2017), the term Bullwhip Effect (BWE)
was introduced in 1997 by Lee, Padmanabhan and Whang. The term refers to the fact that
fluctuations in demand are amplified as they move upstream within the supply chain causing
order variability (Croson & Donohue, 2005; Basu & Wright, 2017). To elaborate, the variability
of demand on the customer side of the supply chain is noticeably smaller compared to the
supplier end of the chain (Lee et al., 1997; Croson & Donohue, 2005); this effect becomes more
significant the more stakeholders the supply chain contains (Lee et al., 1997), as each
stakeholder tries to interpret the demand, even small demand changes result in large order
variations upstream in the chain (Basu & Wright, 2017). However, the BWE excludes variations
that stem from seasonality. More often than not, BWE variability is generated as a result of
supply chain stakeholders´ behavior to one another (Jonsson & Mattsson, 2009). The process
is present in most linear supply chain processes and causes increased costs, lower customer
satisfaction (Basu & Wright, 2017), unnecessary stock and lower product quality (Lee et al.,
1997).
According to Lee et al. (1997), some of the main causes to the BWE are demand fluctuations,
batch ordering and price variations. Jonsson & Mattsson (2009) further expand on the topic,
their identified causes are: larger than usual order quantities, small number of customers, lack
of alignment between planning and control, insufficient information sharing and price

30
variability. The variations in orders are amplified exponentially when moving upstream from
company to company. Hence, larger order quantities result in higher order variations and more
intense BWE. Similarly, when the number of customers is small, orders will have high
variability, as small customers will give more flat orders. In addition, when control and planning
activities are not aligned among supply chain stakeholders, several imbalances can be created.
Manufacturers and wholesalers often enlist different promotions in order to boost their sales.
Consequently, customers experience price fluctuations and might actively adjust their
purchasing habits to take advantage of benefits, which is another cause of order fluctuations
(Lee et al., 1997; Jonsson & Mattsson, 2009). Another reason that leads to the bullwhip effect
is lack of communication within the supply chain. Many companies tend to only consider the
orders of their direct customers hence ignoring the supply chain as a whole. Lastly, if the
manufacturer is unable to satisfy high demand within a specified period of time, and the
customer is aware of this, they are likely to act by inflating their orders to secure a higher order
fulfillment (Jonsson & Mattsson, 2009).
The improved accuracy of forecasts and real-time exchange of data reduce the bullwhip effect,
but also the costs in operations and improved customer satisfaction (Basu & Wright, 2017). In
their research, Croson & Donohue (2005) attempt to explore whether sharing inventory
information with supply chain stakeholders has an impact on the bullwhip effect. What they
find is that downstream information sharing is mitigating the bullwhip effect more efficiently
compared to its upstream counterpart; however, the intensity of this mitigation depends on the
position of that information in the supply chain. Therefore, supply chain stakeholders that are
located in the upper end of the supply chain benefit more from the information sharing.
3.4 Capacity Planning
In this section, different concepts within capacity and production planning will be explained.
Capacity Planning is one of the main topics discussed in the paper, and therefore the use of
capacity planning and capacity management in daily production is important to understand. The
connection between Capacity Planning and Sales and Operations Planning will be explained
along with a distinction between internal and external capacity. In the field of Supply Chain
Management, the theoretical term capacity is used to describe the sum of products or material
that the supply chain can hold. In practice, however, the term capacity refers to the products or
material that the supply chain can deliver to the end customers at any given time. It is a common
misconception that capacity only refers to the products produced or stored. In reality, all
31
products traversing through the chain within a specific time period are part of the collected
capacity, which is referred to as effective capacity. Hereafter, when capacity is mention, what
is referred to is effective capacity. Therefore, capacity is not about the amount that can be
produced but rather the amount that could be supplied to meet demand (Basu & Wright, 2017).
Capacity Planning is very much connected to Master Production Scheduling (MPS), defined as,
"a central module in the manufacturing planning and control system" (Vollmann et al., 2005,
p.168). Jonsson & Mattsson (2009) go into more detail and define MPS as "a line on the master
schedule grid that reflects the anticipated build schedule for those items assigned to the master
schedule. The master scheduler maintains this schedule, and in turn, it becomes a set of planning
numbers that drives material requirements planning. It represents what the company plans to
produce expressed in specific configurations, quantities and dates" (Jonsson & Mattsson, 2009,
p. 450). MPS is, therefore, the core of all capacity planning processes (Tenhiälä, 2011).
Through MPS, manufacturing resources are planned in order to achieve on-time customer
deliveries and consequently customer satisfaction (Vollmann et al., 2005; Sheldon, 2006).
Capacity planning from an MPS perspective is working with estimating resource requirement
and scheduling to avoid implications capacity might have on the MPS, which is done in a mid-
term time horizon (Vollmann et al., 2005)
3.4.1 Capacity Management
There is a small distinction between Capacity Management and Capacity Planning. While the
main goal of Capacity Planning is to perform scheduling and planning in terms of capacity,
Capacity Management is more oriented towards the execution of those plans and how they can
be completed efficiently. There are a number of factors that can smooth out the execution of
said plans. First and foremost, if forecasting and demand management are done successfully,
execution of capacity plans could be improved. Furthermore, product mix has a high impact on
capacity planning. The less complex the product mix the easier capacity planning and execution
is both at production and supplier level. The term product mix refers to the types of products
that can be produced in the plant and the rate at which they go through production (Vollmann
et al., 2005). Should capacity planning be conducted successfully, “the result is execution
systems that are simple, effective and easy to operate with minimal inventories and fast
throughput times” (Vollmann et al., 2005, p. 352)

32
Without an estimation of the product mix and forecasted demand it is difficult to plan
production capacity and to determine what resources are required (Vollmann et. al, 2005),
especially for the long-term (Olhager et al., 2001). What can be delivered to customers is limited
by production capacity; capacity is in turn measured by availability of resources. The primary
goal of capacity management is, therefore, to respond to demand. In order to match capacity
with the forecasted demand, different time periods need to be considered, ranging from long-
term facility planning to short-term order planning (Olhager et al., 2001; Vollmann et al, 2005).
The need for more accurate forecasts increases as the planning horizon moves from long-term
towards short-term. If actual demand is not known at least a few months before the order is
received there is little possibility for the suppliers to adjust their capacity. Effective capacity is
also influenced by the product mix that can be produced in the existing plants (Vollmann et. al,
2005). Other determinants of capacity are the operational time of the plant, determined by
working hours and number of shifts, and the efficiency of the plant, determined by effective
operational time of the plant. This refers to the amount of time the plant is operating without
disruptions to the production line (Basu & Wright, 2017; Vollmann et. al, 2005). According to
Basu & Wright (2017), the management of capacity can be performed in two ways, either by
modifying capacity or by influencing demand. Nowadays, organizations usually manage their
capacity by combining the two methods.
3.4.2 Capacity Imbalances
Understanding the market requirements and estimating the demand is especially important
when attempting to plan capacity (Jonsson & Mattsson, 2009). This includes considering
customer needs and taking them into account in the planning process. Doing so, capacity is
planned in a way that is advantageous to the customers (Vollman et al., 2005). Failing to
understand market needs is likely to lead to capacity imbalances (Jonsson & Mattsson, 2009).
Capacity imbalances can appear in two forms, overcapacity which is created if the available
capacity exceeds the demand, and insufficient capacity, which appears when the organizations
is unable to meet customer demand. However, as value creation is tightly connected to both
production cost and loss of revenue, it is of high importance to avoid these imbalances (Olhager
et al., 2001; Vollmann et al, 2005).
According to Jonsson & Mattsson (2009), the manufacturing approach influences the
limitations and opportunities within capacity planning. It is important to note that planning for
make-to-order (MTO) or make-to-stock (MTS) production has different characteristics. MTS

33
production has higher possibilities to handle disruptions in production and demand fluctuations,
as there is always an inventory of finished goods to act as a buffer (Sheldon, 2006). However,
MTO is based on customer demand, hence the alternatives are fewer and the risk of delivery
issues increase. The goal of an MTO approach is to minimize the tied-up capital in inventories
as well as mitigate the effect of the order backlog. This is done by limiting production so that
each item in production is matched with a sales order (Olhager et al., 2001; Sheldon, 2006).
However, many organizations use a combination of the two approaches to take advantage of
the benefits of both planning methods. Utilizing a combination of the two methods usually
translates to adjusting production capacity more frequently than in a MTO approach but not
every time there is a fluctuation in demand (Olhager et al., 2001).
In order to counter imbalances in capacity, they must first be identified. This is done by
comparing available capacity to capacity requirements. As each actor within the supply chain
is affected by different factors, it must adjust the method to discover capacity constraints to best
fit their needs (Vollmann et. al, 2005; Tenhiälä, 2011). When considering the long-term, Rough-
Cut Capacity Planning (RCCP) is a commonly used method because of its simplicity (Tenhiälä,
2011). Its simplicity stems from the fact that RCCP disregards work-in-process (Vollmann et
al., 2005). The RCCP method is initiated by the yearlong demand plan (Sheldon, 2006), which
is multiplied with the historically required capacity (Jonsson & Mattsson, 2009) and is based
on the data from MPS (Vollmann et al., 2005). From an S&OP perspective, RCCP can be used
as an input when there are uncertainties in terms of capacity constraints (Sheldon, 2006).
According to Sheldon (2006), RCCP is performed with a distinction of product families and the
allocation of the products in these families. This is done in order to efficiently plan capacity;
including machinery and working hours (Vollmann et al., 2005).
A major concern of many manufacturing companies is ensuring the reliability of material flows,
this has been done by applying the Materials Requirements Plan (MRP). It is a technique that
combines bills of material, inventory and order data along with production plans in order to
calculate material volumes and provide material plans of high detail (Vollmann et. al, 2005).
MRP makes recommendations about material orders for replenishment purposes when
necessary (Jonsson & Mattsson, 2009). With proper coordination of the existing data MRP can
achieve balance between inventory and demand. By using MRP information a yearly business
plan can be developed to determine and communicate the estimated delivery of each product
type (Vollmann et al., 2005).

34
3.4.3 Capacity Measurements
Demand should be supported by supply (Cecere, Barrett & Mooraj, 2009) measuring capacity
is a crucial part of Capacity Planning and Capacity Management and choosing the appropriate
measure is critical for reaching the end result. The choice is determined by each specific
company´s needs (Vollmann et al., 2005), in order to identify opportunities for capacity
expansion, supply constraints and demand deficiencies (Cecere et al., 2009). The first step is
selecting a measure that can appropriately identify which resources could be in a critical
situation. Checking capacity to identify constraints is very resource intensive and if it should
be extended to the entire organization requires support in terms of time and investments
(Vollmann et al., 2005; Jonsson & Mattsson, 2009). This implies that the unit of measurement
for capacity should be carefully considered (Vollmann et al., 2005). A commonly used unit of
measurement is capacity accuracy, determining the difference between the forecasted volume
and what is actually produced (Sheldon, 2006). The last step is to identify the capacity that is
available in production, thereafter planning can proceed (Vollmann et al., 2005).
3.4.4 External Capacity
In most manufacturing industries, there are both internal and external suppliers. External
suppliers are suppliers that are not owned by the manufacturing company, but operate as a
stand-alone company within the supply chain. Internal suppliers are part of the same
organization as the main company, but act as a supplier within the supply chain, providing parts
or components to final assembly. When working with external suppliers, the cost focus is more
asserted than with internal suppliers where quality is emphasized to a greater extent (Feldmann
& Olhager, 2008).
Within the supply chain, capacity planning is an area that has been extensively explored and
developed (Ding, Raghavan & Pollard, 2007). Internal and external capacities both play an
important role towards efficient operations. Manufacturers are highly dependent on their supply
chain partners and managing their own capacity is no longer enough (Sheldon, 2006; Ding et
al., 2007). Supplier (or external) capacity is of equal importance and should be taken into
account when scheduling production (Ding et al., 2007) Within the global supply chain this can
be a challenging, when considering transportation costs and lead time (Sheldon, 2006). As most
manufacturing companies work with Just in Time and Lean approaches in production, they are
dependent on smooth flows of material to be successful (Sheldon, 2006). Therefore,
communication and transparency among supply chain partners is crucial (Ding et al., 2007;
35
Jonsson & Mattsson, 2009). Production that is exceeding external capacity is equally unfeasible
as with internal capacity (Ding et al., 2007), therefore, manufacturers are depended on smooth
flows of material in order to be successful (Sheldon, 2006). So, communication and
transparency between supply chain partners is crucial (Ding et al, 2007; Jonsson & Mattsson,
2009).
A manufacturing company is highly dependent on the capacity of its suppliers, adjusting
supplier capacity is more difficult than changing internal capacity. Therefore, it is crucial that
suppliers can efficiently communicate information on capacity to align with manufacturing
production planning (Ding et al, 2007; Jonsson & Mattsson, 2009). According to the case study
performed by Ding et al. (2007) one way of mapping supplier capacity, is a Supplier Capacity
Analysis (SCA). Industries such the automotive industry, studied by Ding et al. (2007), with
high product variability can benefit greatly from an SCA when faced with high supply
uncertainty.
3.4.5 Reverse Bullwhip Effect
As the bullwhip effect has the customer end of the supply chain as its starting point, it is mainly
concerned with demand uncertainty and assumes unlimited supply. However, supply
uncertainty may also have similar effects on the supply part of the chain. In the contemporary
supply chain, both demand and supply uncertainties coexist at the same time. However, most
of the research focuses on demand uncertainty while overlooking its supply counterpart (Rong,
et al., 2017). Rong, Snyder and Shen (2008; 2009) also pioneered the research on the impact of
supply uncertainty.
The term reverse bullwhip effect (RBWE) refers to the phenomenon in which “demand (order)
variability increases as one moves downstream in a supply chain” (Rong, 2008, p.1). According
to Rong et. al (2008) supply uncertainty is the main reason behind the RBWE, just as demand
uncertainty is the main cause of the BWE. However, the impact of the RBWE on supply chains
may be more significant compared to the BWE because of the inventory holding costs (Rong,
2008). A specific point in the middle of the supply chain is, therefore affected by both the BWE
and the RBWE, and as such is being faced with higher order volatility (Cachon, Randall &
Schmidt, 2007). In many cases that point can be a manufacturer, who is then faced with the
issue of capacity constraints on the ground of supply disruptions and difficulties meeting
demand variation (Rong et. al, 2017). The existence of both BWE and RBWE is being referred

36
to as an “umbrella pattern” in the supply chain because the impact is more severe in the middle
of the supply chain, hence making the order variability form the shape of an “umbrella” (see
figure 2). According to this, order variability is most volatile in the point where the two bullwhip
effects meet (Rong, 2008).
Figure 2: Umbrella Pattern (Rong et al., 2008)
Information sharing is a commonly accepted method of increasing the efficiency of the supply
chain. The communication of demand information throughout the supply chain has proven to
be an appropriate way to mitigate the effect of the BWE and, in general, increase the efficiency
of the supply chain (Rong et. al, 2008). Lee et al. (1997) bring up three methods to mitigate the
impact of the RBWE. The first one is to assign supply according to capacity based on each
customer´s historic data. Furthermore, one can communicate information about capacity,
enabling supply chain partners to plan accordingly. However, when it comes to the RBWE,
communicating capacity information has been proven unsuccessful at times (Rong et. al, 2017).
The last method proposed is to limit the flexibility a buyer has over orders. This last method is
also described as the most efficient one as it restricts order variability from the supplier´s
perspective (Lee et al., 1997).
3.4.6 Supply Sales and Operations Planning
The Sales & Operations Planning originated from the MRP techniques as a way to link plans
developed by different departments within the organization, and thus coordinating sales,
finance and operation processes (Vollmann et. al, 2005; Basu & Wright, 2017). Olhager et al.
(2001) and Jonsson & Mattsson (2009) name the supply side of the S&OP process “the
production plan”, however this term appears to be overlooking other important activities of the
supply side, therefore, we will be using the term “supply plan” as it is more inclusive and is
described as by numerous other authors (Vollmann et al., 2005; Sheldon, 2006; Schorr, 2007b;
Cecere et al. 2009; Basu & Wright, 2017). The aim of the supply planning side of S&OP is to
provide input from operations regarding production, internal and external capacity. The supply

37
plan is generated from the demand plan and attempts to fulfill estimated demand with current
operational capacity (Basu & Wright, 2017; Sheldon, 2006; Bowersox et al., 2010), with the
aim of responding to the market´s needs while working within the organization´s strategic and
financial plans (Olhager et al., 2001). In other words, the S&OP process aims to achieve a
balance between supply and demand, which is the "key to good business performance"
(Vollmann et. al., 2005, p. 61).
In this step of the S&OP process, data from the previously created demand plan is utilized as
an input in order to assess the volumes that need to be produced and delivered (Jonsson &
Mattsson, 2009). The demand plan is interpreted and an appropriate supply plan is being
developed. This means that capacity is readjusted according to the demand plan (Olhager et al.,
2001) The aim of this stage within the process is to examine and find the best alternative for
production to meet the goals set by sales (Cecere et al., 2009). According to Cecere et al. (2009)
the supply plan part of the S&OP process is divided into two steps, initiated with the
development of a constrained plan by supply and is followed by the supply review. The first
stage is concerned with resource and capacity planning activities, which is done per product
family (Vollmann et al., 2005; Thomé et al., 2012a). If the demand plan cannot be met by
available capacity, it becomes constrained and cannot be supported (Jonsson & Mattsson,
2009). In that case the supply plan has to be readjusted (Jonsson & Mattsson, 2009). Readjusting
the supply plan means that the gaps between demand and supply need to be minimized, hence
alterations need to be made to the supply plan. Alterations can include assessing the profitability
of potential supply alternatives, examining issues that might come up for each said alternative
and ultimately, a recommendation for the favored supply plan (Schorr, 2007d). In case of a
capacity demand surplus, resource utilization will be high, leading to lower costs. This,
however, comes with the added risk of low customer satisfaction because of, for instance long
delivery lead times. On the other hand, in the case of a capacity supply surplus, costs will be
higher but high delivery rates will be achieved. This can be interpreted as a trade-off between
lower costs and high deliver rates/customer satisfaction (Olhager et al., 2001).
Finally, the last step, the “supply review” meeting is to take place, just like in the demand plan
stage (Schorr, 2007d). This evaluates the supply plan´s ability to respond to the demand plan,
which is done by attempting to identify supply constraints, demand deficiencies and the
potential opportunities for capacity expansions (Cecere et al., 2009). Inputs like the overall
business strategy, internal and external performance and potential capacity expansion are to be

38
reviewed in order to do so (Schorr, 2007d). During this meeting, the launch of dependable
supply plans is done and suggestions on how to narrow existing gaps are made. It should be
noted, that Schorr (2007d) points out that it is the higher management´s decision, whether to
hold down demand or expand capacity, hence the supply review is to recommend solutions, but
the final decision is taken during the following stage of the S&OP process, the top management
review. As a result, the supply review step needs to be cross-functional. Engineering, operations
and logistics have to confirm that there is sufficient internal capacity to respond to the supply
plan, equally, the purchasing department has to assess the capacity on supplier lever and make
sure that external capacity can meet the set goals (Schorr, 2007d). On the other hand, Olhager
et al. (2001) states that the S&OP process as a whole should be a balance between demand and
supply, meaning that adjustments need to be made from both sides in order to achieve proper
execution of the plans and, in turn, achieve the strategic goals. In cases where a change in the
supply plan is necessary, authorization by top management may be required. These are type of
issues that are carried into the top management review (Vollmann et al., 2005).
3.4.7 Reconciliation Sales and Operations Planning
A meeting between the different functions involved in the S&OP process must be held in order
to align the demand and supply plans. Involved departments may include; sales, operations,
logistics and purchasing, which create a package of information based on the two plans (Schorr,
2007e; Cecere et al., 2009; Jonsson & Mattsson, 2009). This is then communicated towards the
top management where finalization of the plans is taking place, and marks the beginning of
production and the developments of the delivery plans (Sheldon, 2006; Cecere et al., 2009).
Descriptions of the reconciliation step by Cecere et al. (2009) as well as Jonsson & Mattsson
(2009) emphasize that the main target is the achievement of an alignment between the demand
and supply plans. As part of this step, there should be a presentation of the demand and supply
plans that were decided on during the previous steps of the process, while addressing the
strengths, weaknesses, risks and opportunities, with high emphasis given towards risks
(Sheldon, 2006; Schorr, 2007e; Cecere et al, 2009). It should be noted that the output of the
step is of high importance, which is a decision on the finalized demand and supply plans for the
pre-decided planning horizon (Vollmann et al., 2005; Sheldon, 2006; Cecere et al., 2009).
Schorr’s (2007e) approach of the S&OP process follows different steps, including an additional
step after the supply plan, which is called “the integrated reconciliation meeting” or “pre-SOP

39
meeting” as mentioned by Vollmann et al. (2005). In this meeting, the decisions on the supply
and demand plans are coordinated by representatives of different functions. The expected
output of this step in the process is to collect a bundle of information, with the aim of presenting
it to the top management (Schorr, 2008, Basu & Wright, 2017). Several authors then, go on to
present a fifth step, “the senior management review” (Schorr, 2007e; Schorr, 2008) or
“executive SOP meeting” (Vollmann et al., 2008). This is the step where the final decision
making is taking place, which aims to reach an agreement for the overall volume target for the
pre-decided planning horizon, which is the alignment of the two plans (Schorr, 2008). The
effectiveness of this step is highly dependent on the efficiency with which the previous steps
have been completed, if the necessary steps were followed properly, this stage should be able
to easily provide an answer on the plans (Schorr, 2007a). It, essentially, means that the
preliminary decisions that have been taken during the reconciliation meetings are presented to
the top management, which is responsible for making the final decision and accept or reject the
presented plans. The goal of this final meeting is the release of the final approved S&OP volume
plan (Schorr, 2008, Jonsson & Mattsson, 2009).
3.5 Measurement and Communication
Sheldon (2006) and Grimson & Pyke (2007) mention an additional step in the S&OP process, which
is the measurement and communication step. In this step, the responsibility of meeting the targets
set by the S&OP process often falls on the operations team, while sales and marketing rarely have
to adjust their sales plan (Grimson & Pyke, 2007). This perspective is not share by Olhager et al.
(2001), who mention that both sides need to make adjustments in order for the final goal to be
achieved. However, Grimson & Pyke (2007) mention that by the time of their study S&OP
measurements were not widely spread among organizations, which does not seem to be the case
nowadays, where high emphasis is put on measurement of the process (Basu & Wright, 2017)
For the S&OP process to be successful, it is vital to create and implement measurements capable of
assessing the efficiency of the process (Lapide, 2004). The measurements provide indicators on
how well the business is performing, with the goal of driving continuous improvement (Grimson &
Pyke, 2007; Bowersox et al., 2010). The measures can be KPIs that are linked to production, sales,
profits and costs, inventory levels, customer satisfaction rate and forecast accuracy, with emphasis
being put on areas in which the organization is currently lacking (Sheldon, 2006; Grimson & Pyke,
2007; Cecere et al., 2009). The accuracy of the demand forecast imperfectly tends to be the most
important indicator when evaluating the alignment of the S&OP process with the strategic goals of

40
the organization as a whole, however all indicators should be considered equal (Lapide, 2004;
Sheldon, 2006).
4 Empirical Framework
The empirical framework is based on documented S&OP processes at Company X, and
interviews held with people involved in this process. Initially the types of forecasts developed
within the company will be outlined. This is followed by a description of the S&OP process in
Company X. After this, supplier relationships are mapped along with the results of the supplier
interviews. The people interviewed internally are presented in the table below.
Table 1: Internal Interviewees
Title of the Interviewee Area of Responsibility
Sales Support Manager Demand Plan
Demand Planning Manager Demand Plan
Commercial Pipeline Development Manager Forecast
Manager Program and Order Supply Plan
Process Manager Volume and Order Planning Supply Plan
Manager Supplier Relations Management Supplier Relationship Management
Director Program and Order Planning Supply Plan
Program and Forecast Manager Supply Plan
Market Analyst Forecast Forecast
4.1 Forecasts
There are three different forecasts within Company X (see figure, 2), that will be presented in
the following sections.
Table 2: Forecasts in Company X
Forecast Planning
Horizon Description
Total Market
Forecast 2 years
Forecast for the total number of products that will be sold
by all companies in the industry within a market.
Long-Term Volume
Forecast 5 years The Total Market Forecast extended to cover five years.
Production Plan
Forecast 10 years
The Long-Term Volume Forecast extended to cover ten
years.

41
4.1.1 Total Market Forecast
The Total Market Forecast (TMF) was brought up during the interview with sales, market and
forecast development. This prompted a further interview with the department developing the
TMF. Their knowledge and experience of the TMF process as well as their thoughts and ideas,
will be presented below.
The Total Market Forecast is a forecast that measures the total number of products sold by all
brands and companies in a market, in the specific industry. The market refers to a specific
commercial sales area. The forecast is updated four times a year by Business Intelligence, and
stretches over two years, including the current year. The process is similar for all sales areas
and starts with an independent analysis of what can be seen and there are several
macroeconomic indicators that are used to analyze the market, these will be examined in more
detail later. The TMF is the responsibility of the largest brand in each market. The forecast is
performed for all markets in a sales area for the different product segments. After an analysis
of market indicators is performed, it is transformed into figures that are put into a proposal and
sent to the markets. The markets then perform their analysis of the figures and include what
indicators they can see in their respective market. The market has one week to answer to the
proposal and thereafter they have a discussion with Business Intelligence about the proposed
numbers. The discussion is especially important when they disagree on the forecasted demand.
The most important aspect of this dialogue is to hear what the markets base their figures on. As
Business Intelligence has a higher perspective, determining demand in all markets, compared
to the markets that only determine local demand, other approaches can be very valuable.
Thereafter, Business Intelligence prepares a final proposal after discussion with the sales areas,
divided into Europe, North America, Latin America and International. In this meeting, the sales
manager includes different perspectives and experiences to give a good overview of the
potential demand. In the meeting, the sales manager has the final say on what numbers should
be in the forecast. Lastly, the forecast is presented to the sales, operations and technical
departments.
4.1.2 Long-term Volume Forecast & PPL
The Long-Term Volume Forecast (LTVF) and the Product Plan (PPL) are forecasts developed
from the TMF, information on this process was mainly gathered in the interviews with sales
and demand planning.

42
The LTVF is an annual process with two releases per year, the time horizon includes the current
year and five years forward. The sales function coordinates the process for all brands within
Company X, but also coordinate the different sales areas within Company X’s brands. The
brands are responsible for creating their own LTVF, for their markets on the five-year time
horizon. The LTVF is a combination of the TMF and the estimated brand volumes. The brand
volumes can be estimated by combining the TMF and the market share for that specific market,
and thus generating the volumes that could be sold. The forecast is divided in the product
segments. Internally for the Company X brand there is a different need for the split, so the
forecast is broken down into product models and vehicle segment. There are strategic benefits
from breaking the forecast down to lower levels, as the managers can see the plan per product
segment. The LTVF is used as the base for the creation of the demand plan in the S&OP process,
and is reviewed when creating the yearly business plan.
The LTVF is used as an input to a process called PPL. This process prolongs the five-year
LTVF, to a ten-year forecast. This forecast has very high management attention, with the
President for each brand deciding on and approving the forecast numbers. Thereafter the PPL
is communicated as information to the CEO. In the ten-year forecast, the volumes are split into
product models and component level in the different sales areas.
The purpose and usage of the LTVF and the PPL is to have a forecast spanning to up to ten
years that can be used in the product plan, calculating for new projects, profitability, etc. It is
also used in the industrial plan for operations and the plants so that they can plan the
manufacturing setup balance to meet future demand. Beyond this it is used by purchasing in
sourcing negotiations and by the finance function when developing financial plans. However,
it becomes very difficult to forecast for more than five years, as there are too many
contingencies to account for. When the sales areas perform their forecast they work with
assumptions, for example in light of new emission regulations it is common to see a pre-buy
effect. Other laws and regulations may have a large impact on sales in the specific sales area,
and therefore is very important to be aware of.
4.1.3 The Forecast Process
The forecast processes are all interlinked (see figure 3) and start with TMF in January; this
forecast is released in February. The TMF is updated four times a year, and this is released
every quarter. The TMF for quarter one is used as an input in developing the LTVF in March,

43
with the release in April. After the release of the LTVF it is then used to develop the PPL to a
ten-year forecast, with a release in May. Thereafter the process starts over again, with the TMF
updated quarterly, and the LTVF and PPL released twice annually.
Figure 3: The Forecast Process
4.1.4 Comments on the forecast processes
In many of the interviews the topic of supplier confidence in the forecast was brought up, this
indicates that there can be work done to improve the forecast accuracy. One aspect of the
forecast accuracy is that the markets and sales areas have been too shy in asking for volumes in
the demand plan. This is based on the TMF that showed much lower sales volumes than the
actual orders. Once the TMF was adjusted upwards it was too late to change supplier capacity.
Connected to this issue, the difficulty to change the forecast when faced with long lead times
to change capacity at both internal and external suppliers.
In order to improve forecast accuracy and planning, Company X must ensure that demand is
leveled and that the flexibility to meet demand both above and below the forecasted volumes
exists for all actors in the supply chain. Another part of forecasting mentioned as an area for
improvement is the use of statistical methods in forecasting. Today statistical methods are used
to a limited extent in developing the TMF but not in the development of other forecasts. The
use of statistical methods when developing the forecast on both the market and sales area level,
could possibly improve the accuracy of the forecast and align the way of working with the
forecast. Another aspect to consider for the different forecasts is the time-horizon and the
development of new technologies. According to research and industrial information the
introduction of autonomous and electric vehicles is already introduced and will be launched on
January
TMF Initiated
FebruaryTMF Released
MarchLTVF Initiated
AprilLTVF ReleaseTMF Initiated
MayPPL ReleaseTMF Release
JuneJuly
TMF InitiatedAugust
TMF Released
September
LTVF Initiated
OctoberTMF Initiated
LTVF Released
NovemberTMF Released
PPL Released
December
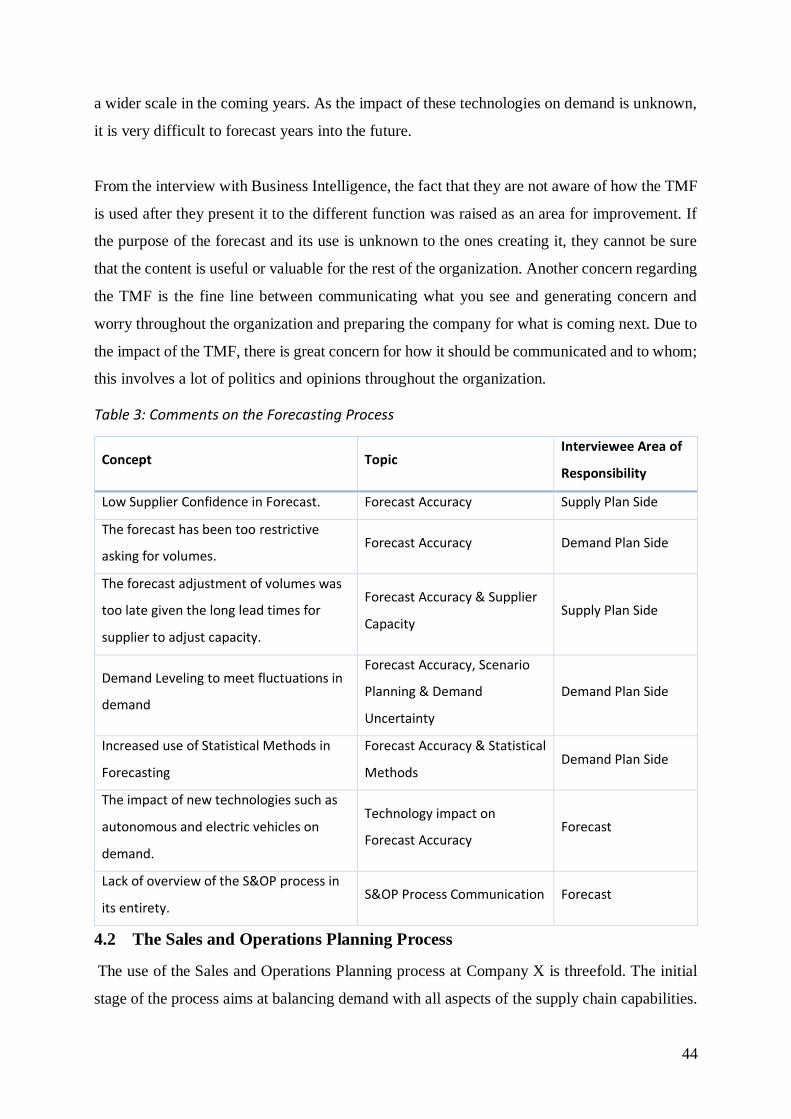
44
a wider scale in the coming years. As the impact of these technologies on demand is unknown,
it is very difficult to forecast years into the future.
From the interview with Business Intelligence, the fact that they are not aware of how the TMF
is used after they present it to the different function was raised as an area for improvement. If
the purpose of the forecast and its use is unknown to the ones creating it, they cannot be sure
that the content is useful or valuable for the rest of the organization. Another concern regarding
the TMF is the fine line between communicating what you see and generating concern and
worry throughout the organization and preparing the company for what is coming next. Due to
the impact of the TMF, there is great concern for how it should be communicated and to whom;
this involves a lot of politics and opinions throughout the organization.
Table 3: Comments on the Forecasting Process
Concept Topic Interviewee Area of
Responsibility
Low Supplier Confidence in Forecast. Forecast Accuracy Supply Plan Side
The forecast has been too restrictive
asking for volumes. Forecast Accuracy Demand Plan Side
The forecast adjustment of volumes was
too late given the long lead times for
supplier to adjust capacity.
Forecast Accuracy & Supplier
Capacity Supply Plan Side
Demand Leveling to meet fluctuations in
demand
Forecast Accuracy, Scenario
Planning & Demand
Uncertainty
Demand Plan Side
Increased use of Statistical Methods in
Forecasting
Forecast Accuracy & Statistical
Methods Demand Plan Side
The impact of new technologies such as
autonomous and electric vehicles on
demand.
Technology impact on
Forecast Accuracy Forecast
Lack of overview of the S&OP process in
its entirety. S&OP Process Communication Forecast
4.2 The Sales and Operations Planning Process
The use of the Sales and Operations Planning process at Company X is threefold. The initial
stage of the process aims at balancing demand with all aspects of the supply chain capabilities.
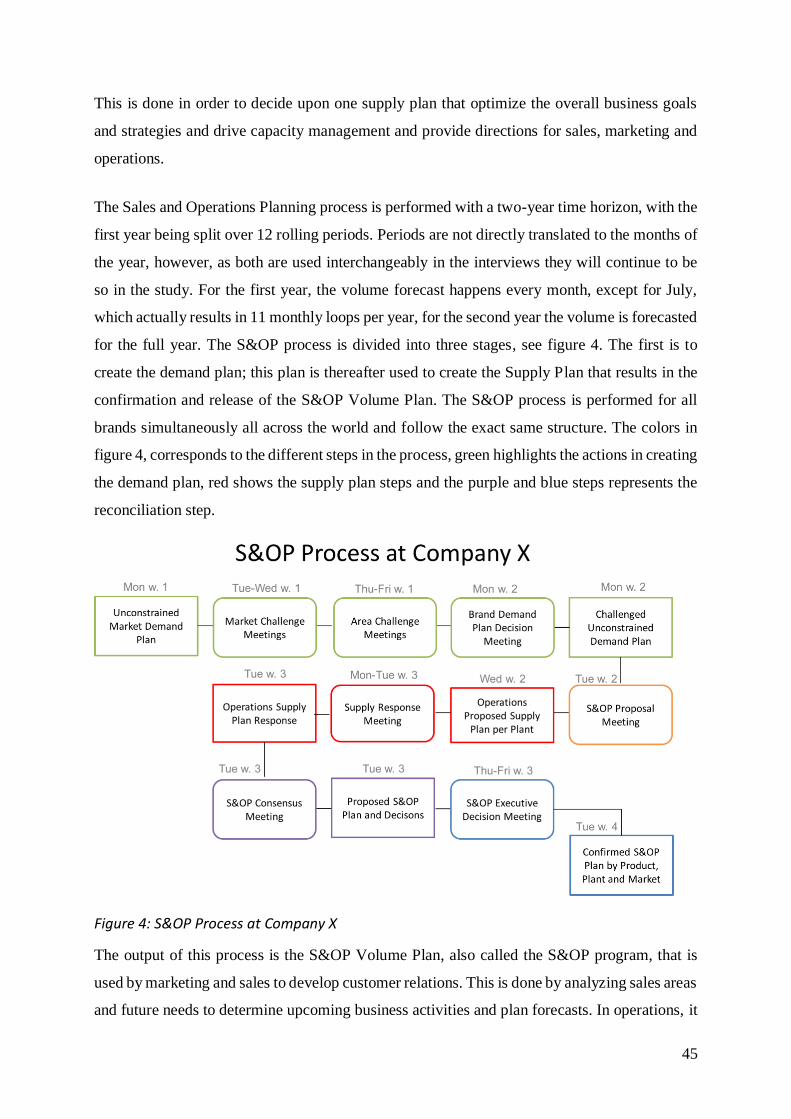
45
This is done in order to decide upon one supply plan that optimize the overall business goals
and strategies and drive capacity management and provide directions for sales, marketing and
operations.
The Sales and Operations Planning process is performed with a two-year time horizon, with the
first year being split over 12 rolling periods. Periods are not directly translated to the months of
the year, however, as both are used interchangeably in the interviews they will continue to be
so in the study. For the first year, the volume forecast happens every month, except for July,
which actually results in 11 monthly loops per year, for the second year the volume is forecasted
for the full year. The S&OP process is divided into three stages, see figure 4. The first is to
create the demand plan; this plan is thereafter used to create the Supply Plan that results in the
confirmation and release of the S&OP Volume Plan. The S&OP process is performed for all
brands simultaneously all across the world and follow the exact same structure. The colors in
figure 4, corresponds to the different steps in the process, green highlights the actions in creating
the demand plan, red shows the supply plan steps and the purple and blue steps represents the
reconciliation step.
Figure 4: S&OP Process at Company X
The output of this process is the S&OP Volume Plan, also called the S&OP program, that is
used by marketing and sales to develop customer relations. This is done by analyzing sales areas
and future needs to determine upcoming business activities and plan forecasts. In operations, it
46
is used to plan and schedule production, product distribution and defining future competence
and workforce demands, in addition to this it is also used to create the Electronic Data
Interchange (EDI). The EDI refers to the information including orders, forecast information and
delivery schedules that is sent to suppliers. These decisions are all evaluated using the S&OP
volume plan, which is thereafter used to estimate the financial impact on the organization by
the finance function.
4.2.1 Comments on the S&OP process
During the interviews two projects related to the planning-horizon for the S&OP process was
brought forward. One project mentioned is the extension of the 12- months rolling forecasting
to a 24-months rolling planning horizon. Currently there is much focus on the current year in
the demand S&OP meetings, and the second year is not given much consideration. This can be
an issue especially from a supplier point of view as the planning horizon is only one year. By
extending the process to forecast monthly demand for 24 months rolling, will improve the
ability to plan production capacity after the S&OP volume plan. The S&OP process will then
be extended to cover three years as mentioned by another interviewee, the third year will then
be forecasted on a full-year volume.
Another aspect that was highlighted during the interviews was the involvement of the
purchasing department in the S&OP process. In the proposal meeting between the sales and
operations functions, today operations have the responsibility for gathering and presenting
information from purchasing on external supplier capacity. There is however an ongoing
process to include purchasing in the proposal meeting and increase the transparency in the
process. There are several benefits to including purchasing earlier in the process. Today the
supplier capacity is reviewed in the steps after the proposal meeting, and therefore it has
happened that the demand plan has been accepted by operations in the proposal meeting only
to be rejected in the consensus meeting in the later stages of the S&OP process. There are
therefore potential benefits from including purchasing in the proposal meeting between sales
and operations.

47
Table 4: Comments on the Sales & Operations Planning Process
Concept Topic
Interviewee Area of
Responsibility
Extending the S&OP process from 12-month
rolling to a 24-months rolling. This includes the
extension of the S&OP process to cover three
years in total.
S&OP Process &
Planning Horizon
Demand Plan Side,
Forecast
Including purchasing and reviewing supplier
capacity already in the S&OP proposal meeting.
Involvement of
Purchasing in the
S&OP process
Demand Plan Side
4.3 The Demand Plan
The demand plan process at Company X has been mapped by performing interviews with
individuals involved in creating the plan. The creation of the demand plan consists of a stepwise
process from the point where information is received from sales to delivering a challenged and
unconstrained demand plan. The information used to create the demand plan is market demand
from the dealer or market, for a 12-month period, the product introduction plan as well as the
TMF and LTVF. The monthly S&OP volume plan should in the best of worlds align with the
volumes estimated by the TMF and the market share ambition. However, due to changes in the
market, discrepancies do occur. The forecast in S&OP is very specific to demand, it determines
what actions to be taken and what number of products that is actually required for the coming
two years.
The demand plan can be broken down into further components to describe the process in detail.
The two steps to generate a demand plan, is to first create an unconstrained demand plan and
thereafter creating a challenged unconstrained demand plan, as it can be seen in the figure 5.
How these plans are created will be further explained in the following sections.
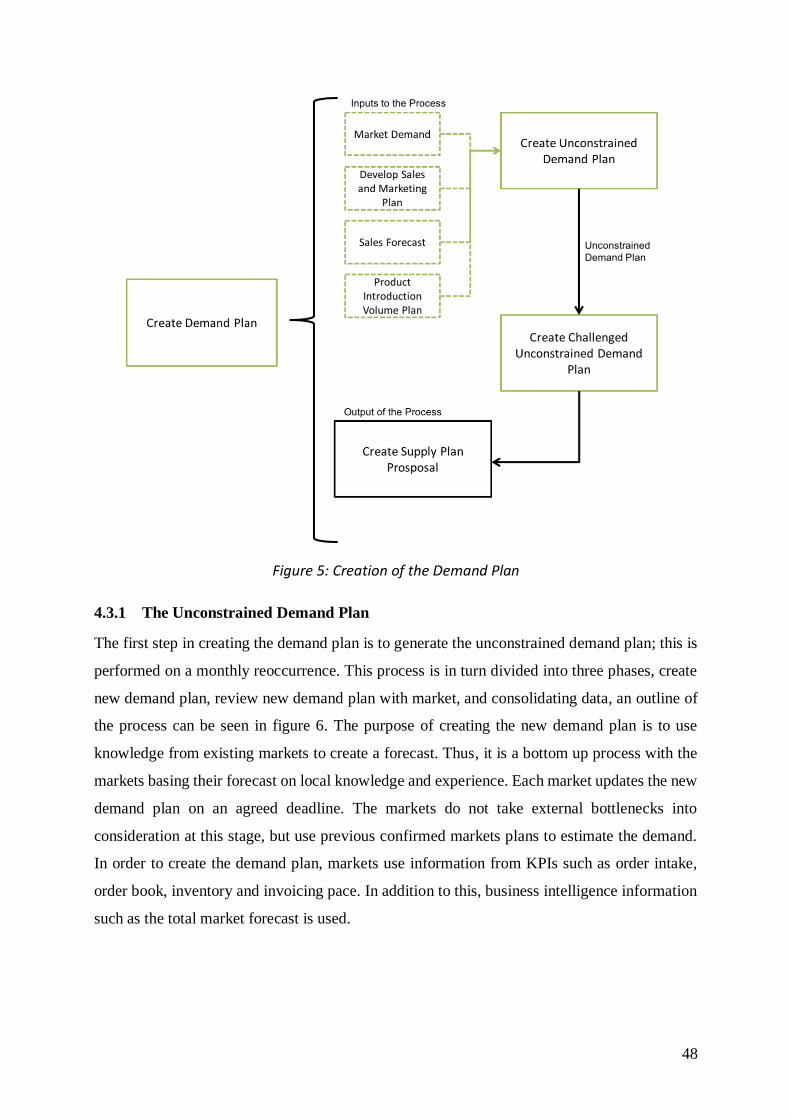
48
Figure 5: Creation of the Demand Plan
4.3.1 The Unconstrained Demand Plan
The first step in creating the demand plan is to generate the unconstrained demand plan; this is
performed on a monthly reoccurrence. This process is in turn divided into three phases, create
new demand plan, review new demand plan with market, and consolidating data, an outline of
the process can be seen in figure 6. The purpose of creating the new demand plan is to use
knowledge from existing markets to create a forecast. Thus, it is a bottom up process with the
markets basing their forecast on local knowledge and experience. Each market updates the new
demand plan on an agreed deadline. The markets do not take external bottlenecks into
consideration at this stage, but use previous confirmed markets plans to estimate the demand.
In order to create the demand plan, markets use information from KPIs such as order intake,
order book, inventory and invoicing pace. In addition to this, business intelligence information
such as the total market forecast is used.
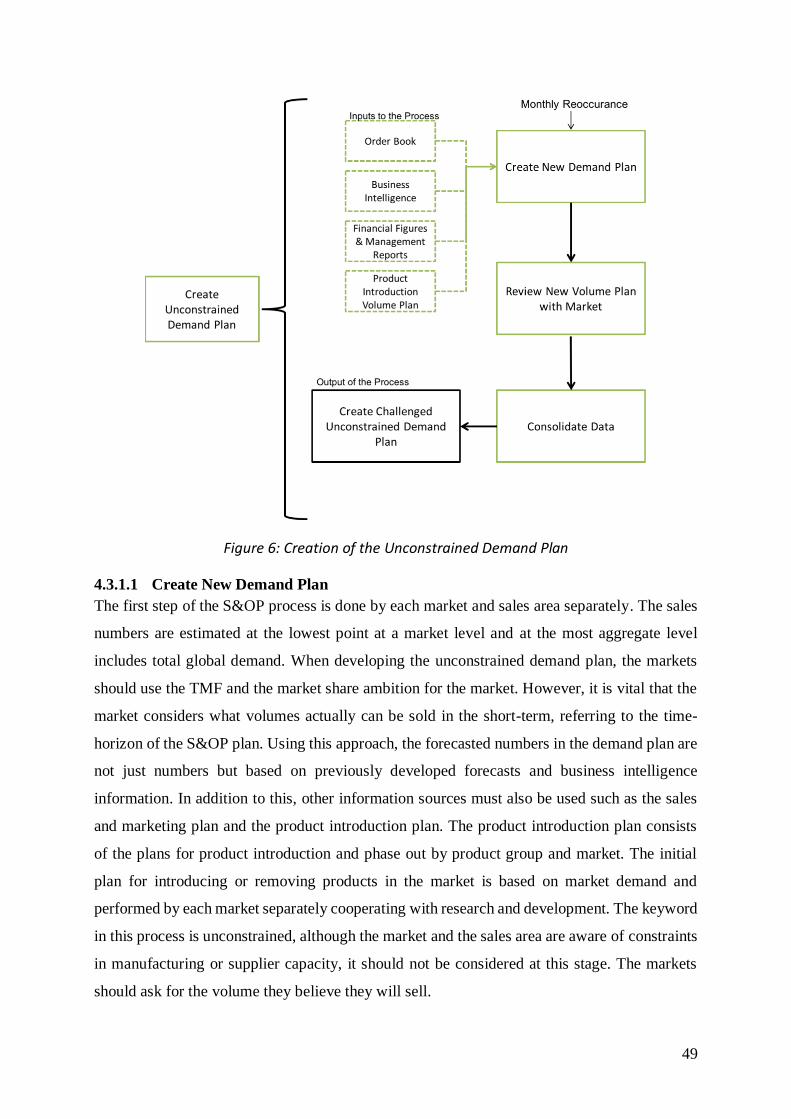
49
Figure 6: Creation of the Unconstrained Demand Plan
4.3.1.1 Create New Demand Plan
The first step of the S&OP process is done by each market and sales area separately. The sales
numbers are estimated at the lowest point at a market level and at the most aggregate level
includes total global demand. When developing the unconstrained demand plan, the markets
should use the TMF and the market share ambition for the market. However, it is vital that the
market considers what volumes actually can be sold in the short-term, referring to the time-
horizon of the S&OP plan. Using this approach, the forecasted numbers in the demand plan are
not just numbers but based on previously developed forecasts and business intelligence
information. In addition to this, other information sources must also be used such as the sales
and marketing plan and the product introduction plan. The product introduction plan consists
of the plans for product introduction and phase out by product group and market. The initial
plan for introducing or removing products in the market is based on market demand and
performed by each market separately cooperating with research and development. The keyword
in this process is unconstrained, although the market and the sales area are aware of constraints
in manufacturing or supplier capacity, it should not be considered at this stage. The markets
should ask for the volume they believe they will sell.
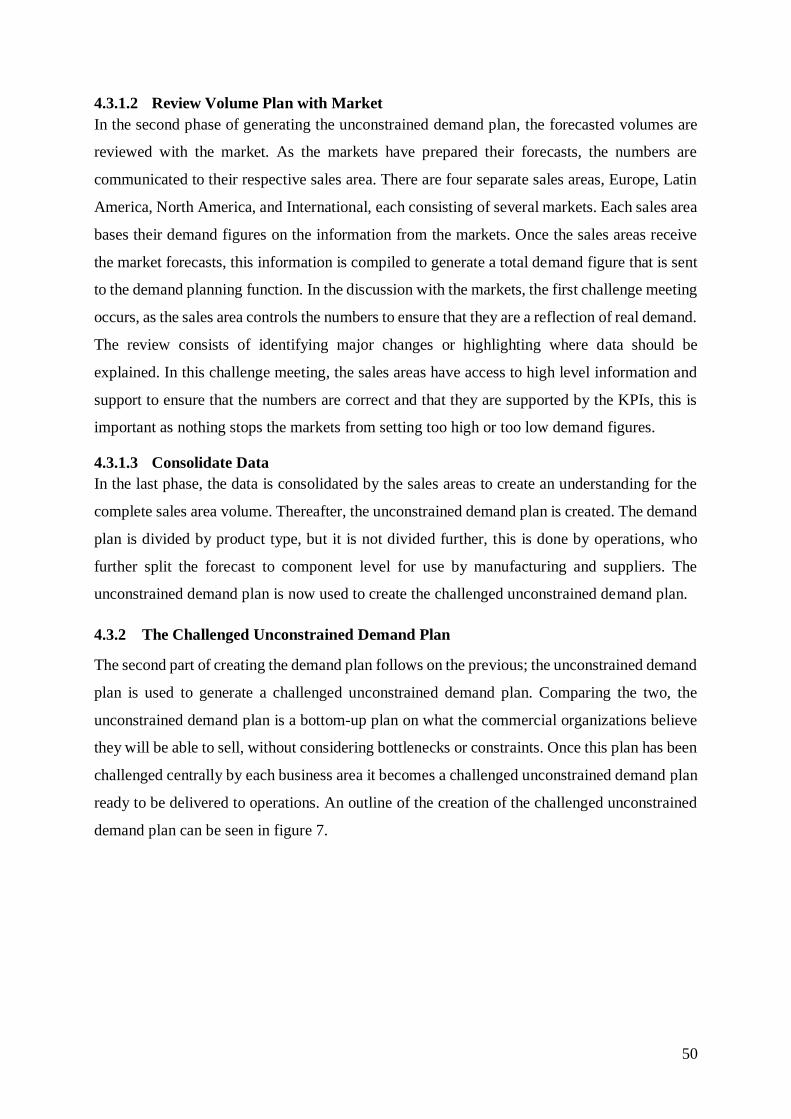
50
4.3.1.2 Review Volume Plan with Market
In the second phase of generating the unconstrained demand plan, the forecasted volumes are
reviewed with the market. As the markets have prepared their forecasts, the numbers are
communicated to their respective sales area. There are four separate sales areas, Europe, Latin
America, North America, and International, each consisting of several markets. Each sales area
bases their demand figures on the information from the markets. Once the sales areas receive
the market forecasts, this information is compiled to generate a total demand figure that is sent
to the demand planning function. In the discussion with the markets, the first challenge meeting
occurs, as the sales area controls the numbers to ensure that they are a reflection of real demand.
The review consists of identifying major changes or highlighting where data should be
explained. In this challenge meeting, the sales areas have access to high level information and
support to ensure that the numbers are correct and that they are supported by the KPIs, this is
important as nothing stops the markets from setting too high or too low demand figures.
4.3.1.3 Consolidate Data
In the last phase, the data is consolidated by the sales areas to create an understanding for the
complete sales area volume. Thereafter, the unconstrained demand plan is created. The demand
plan is divided by product type, but it is not divided further, this is done by operations, who
further split the forecast to component level for use by manufacturing and suppliers. The
unconstrained demand plan is now used to create the challenged unconstrained demand plan.
4.3.2 The Challenged Unconstrained Demand Plan
The second part of creating the demand plan follows on the previous; the unconstrained demand
plan is used to generate a challenged unconstrained demand plan. Comparing the two, the
unconstrained demand plan is a bottom-up plan on what the commercial organizations believe
they will be able to sell, without considering bottlenecks or constraints. Once this plan has been
challenged centrally by each business area it becomes a challenged unconstrained demand plan
ready to be delivered to operations. An outline of the creation of the challenged unconstrained
demand plan can be seen in figure 7.
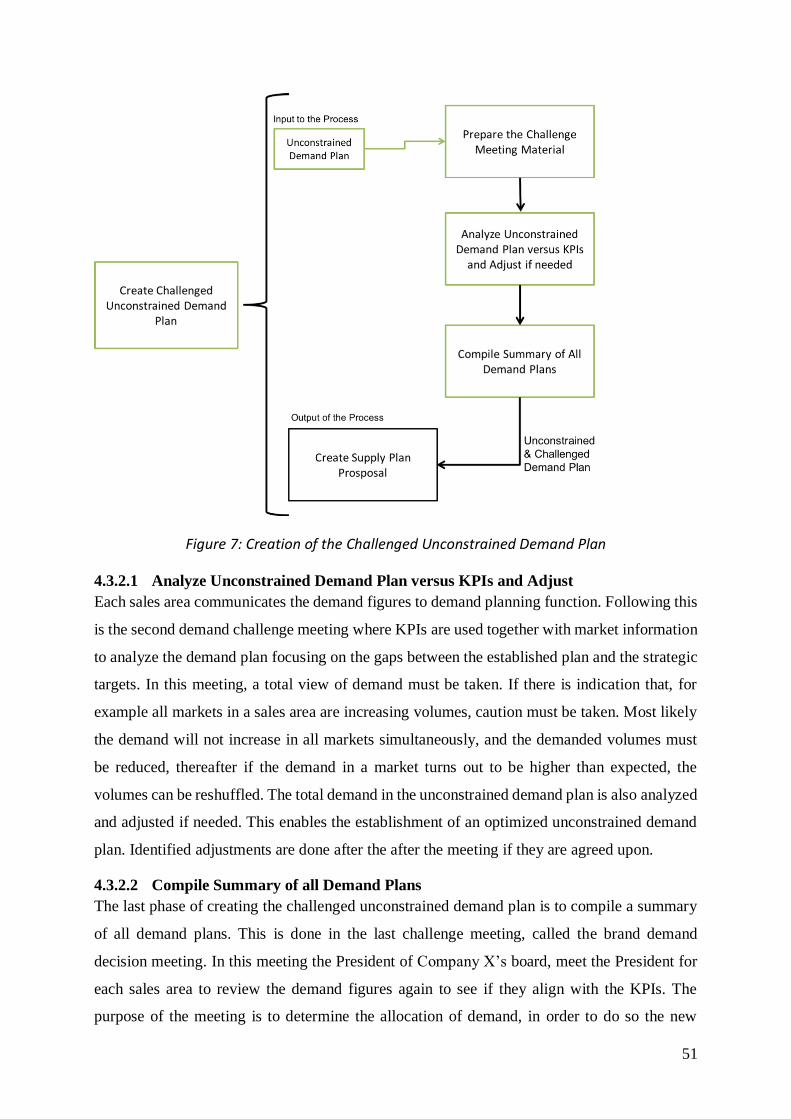
51
Figure 7: Creation of the Challenged Unconstrained Demand Plan
4.3.2.1 Analyze Unconstrained Demand Plan versus KPIs and Adjust
Each sales area communicates the demand figures to demand planning function. Following this
is the second demand challenge meeting where KPIs are used together with market information
to analyze the demand plan focusing on the gaps between the established plan and the strategic
targets. In this meeting, a total view of demand must be taken. If there is indication that, for
example all markets in a sales area are increasing volumes, caution must be taken. Most likely
the demand will not increase in all markets simultaneously, and the demanded volumes must
be reduced, thereafter if the demand in a market turns out to be higher than expected, the
volumes can be reshuffled. The total demand in the unconstrained demand plan is also analyzed
and adjusted if needed. This enables the establishment of an optimized unconstrained demand
plan. Identified adjustments are done after the after the meeting if they are agreed upon.
4.3.2.2 Compile Summary of all Demand Plans
The last phase of creating the challenged unconstrained demand plan is to compile a summary
of all demand plans. This is done in the last challenge meeting, called the brand demand
decision meeting. In this meeting the President of Company X’s board, meet the President for
each sales area to review the demand figures again to see if they align with the KPIs. The
purpose of the meeting is to determine the allocation of demand, in order to do so the new

52
figures are compared to historical data, and all information is reviewed again. The meeting is
similar to the other challenge meetings with the exception that the Presidents for each sales area
tend to have more information, and financial aspects are discussed to a greater extent. To
understand the S&OP process it is important to understand that demand is challenged three
times over the course of a week and therefore the result is a carefully considered plan. The
unconstrained and challenged demand plan becomes the demand plan that is used for creating
the supply plan.
The demand plan is presented in the proposal meeting between sales and operations. The
demand plan numbers are sent to operations the night before via EDI, so that operations have a
chance to get an overview of existing capacity in order to provide feedback during the proposal
meeting. The meeting mainly circles around if the demand can be met, and what can be done
to ensure that the actual numbers can be produced. Operations have the total overview of all
brands, and can see the total change in volumes as well as where constraints are likely to occur.
Along with this they also have a cost perspective, making this challenge meeting very important
for the creation of the final S&OP volume plan. In this stage, there is little involvement from
the purchasing side, as of now, and therefore supplier capacity is not considered until later in
the process.
4.3.3 Comments on Demand Plan
An issue previously mentioned when creating the TMF, is mentioned again in the creation of
the demand plan. When markets are asked to create their demand forecast, there is sometimes
the perception from the market that they need a certain volume or demand according to the
TMF or the market share ambition. This can be a problem as the demand is not what they need
to sell, but what they think they can sell. Therefore, it is important to have a discussion with the
markets, if they believe that they can sell the forecasted volume in the short-term or if they will
just build up inventory. There are no consequences if the markets set a demand figure that is
too high or low compared to real demand. The repercussions of an inaccurate forecast are
however great throughout the supply chain and especially impact production and suppliers that
will plan for an incorrect sales volume. This results in undercapacity or overcapacity in
production, with overcapacity being the highest risk as capacity is increased with investments
in production facilities and staffing, and results in high inventory. The challenge meeting is the
mechanism that ensures that demand is leveled and carefully reviewed before the creation of
the demand plan. There is a need for a standardized way of working in the markets when

53
estimating demand volumes, such as what indicators to look at and how the TMF and market
share ambitions should be interpreted.
Table 5: Comments on the Demand Plan Process
Concept Topic Interviewee Area of
Responsibility
Market Forecasting based on the
wrong assumptions.
Demand Plan Accuracy &
Quality Demand Plan Side
The impact of inaccurate demand
figures from the market.
Forecast Accuracy &
Production Capacity Demand Plan Side
Aligning the process of forecasting
demanded volumes in the markets.
Forecast Accuracy &
Organizational Consistency
Forecast, Demand Plan
Side
4.4 Supply Plan
After sales deliver their final demand plan, which is the number of products they are planning
to sell to all markets. The creation of the supply plan is initiated. The creation of the supply
plan at Company X is a combination of two actions; the creation of the supply plan proposal
and the creation of the supply plan response. The unconstrained and challenged demand plan
and the external supply capacity are used as input for the creation of the supply plan proposal,
while production capacity is used as input for both processes. An outline of this process can be
seen in figure 8.

54
Figure 8: Creation of the Supply Plan
4.4.1 Supply Plan Proposal
The creation of the supply plan proposal is initiated with the analysis of the demand plan
material. Its purpose is to review the challenged demand plan according to KPIs related to
demand plan data, to prepare for a decision on the supply plan proposal. The process for creating
the supply plan proposal can be seen below in figure 9.

55
Figure 9: Creation of the Supply Plan Proposal
Once the analysis is complete, the following step is to challenge and agree on a supply plan
proposal. In order for the meeting to be effective, known constraints are considered to avoid
that an unrealistic demand is put forward, this is in essence an analysis performed to see if
demand can be met. Constraints could occur in the form of capacity bottlenecks, working time
limitations or supply disruptions. For those issues to be resolved, cooperation between
operations, the local plants and purchasing is required to increase the understanding of capacity.
The third and final step is to create a detailed supply plan proposal by supply chain unit, using
internal capabilities as an input. The purpose is to break down the supply plan volume proposal
into component level, so that a response can be given by the stakeholders. The component, or
part number level, refers to the individual components that make up the product, an example to
explain this, is that the ball bearing in a wheel is a component. During this step, the operations
function creates a detailed supply plan proposal per product type, factory and month. This is
done to get an overview on if the volumes in the program can be matched with the capacity of
production plant.

56
4.4.2 Supply Plan Response
The next stage, the response, begins after the creation of the proposal (see figure 10). It starts
with the consolidation of the detailed supply plan proposal by supply chain unit and preparing
the material to be analyzed. The consolidated supply plan is based on variants and sent to each
respective plant for a capacity analysis. Variant refers to a division by product type, the level
below variant is referred to as component or product type. Each plant performs an analysis of
production capacity based on the supply plan proposal. In this process, the plant performs an
internal review, on production rates, workforce needs and ability to adjust capacity. The
response of each plant is combined with information on external capacity in the second step in
order to evaluate if the demand plan volumes can be accepted. In the capacity limit control step,
adjustments are also done to account for new product introduction.
The next step is to analyze, evaluate and choose scenarios. The purpose is to adjust and level
the supply plan proposal according to known capacity restrictions. At this level, internal
capacity is the main concern of the process. The volume changes in the new supply plan
proposal are analyzed and alternative production or sourcing scenarios are considered. The final
step is to consolidate a supply plan response with the purpose of creating one coordinated
proposed supply plan response. A small team consolidates all the volumes to understand the
demand from all plants, which contains the volumes for the whole company. The supply plans
are created by production plant and are then consolidated by region into a proposed supply plan
response. One preferred supply plan scenario will be presented, based on capacity and cost
efficiency in the global production and sourcing system. The presented preferred supply plan
scenario ends the supply plan step in the process. The final plan is released by the same people
creating the proposal. The information is controlled by others before it is released, but it is
released through the system.

57
Figure 10: Creation of the Supply Plan Response
4.4.3 The EDI Creation
The difference between the S&OP Volume Plan, or program and the EDI is that the EDI outlines
daily requirements matching current production rate. While the forecast in the S&OP process
outline the gross requirement for a determined period. Both the S&OP program and the EDI
contain forecast information for 12-months rolling, with the difference being that the EDI
contains actual orders in addition to the forecast and is adjusted for lead-time and buffers. The
information in the final S&OP program is used to create the EDI that is transmitted to the
supplier base. The EDI contains order information in the form of delivery schedules, fixed
orders, preliminary orders and forecasted orders, with the first showing actual customer orders
and thus true demand. The logic of the EDI is based on the current order board, with a division
on product variant. The order roof is set by the S&OP program, which is then filled with firm
orders and preliminary orders. Firm orders usually cover between two to three weeks of
production and the preliminary orders cover 10 to 12 weeks in the case that the order board is

58
not filled with firm and preliminary orders, forecast orders are used to cover remaining orders
slots in the program. The EDI is updated almost daily, as new orders are received replacing
preliminary and forecasted orders.
Since the forecast is based on variants, a new mix of variants also results in the forecast being
updated because of the product configuration and production characteristics. The division of
variants is done by looking at the historic data. Based on this historic data, the system calculates
the percentage split per variant. In the case of non-existing historic data, the split is done based
on data connected to the specific project. Once the variant combination is calculated by the
system a component level forecast can be created, detailing a forecast for delivering gross
requirement on a part number level for each period. Thus, the information communicated to
external suppliers in the EDI is divided on the part number level.
4.4.4 The Role of Purchasing in the Supply Plan
In the S&OP process, the role of the purchasing organization is to provide a response to the
program with regards to supplier capacity. The aim is to have an as accurate response as possible
as to if the supplier can manage the forecasted volumes within their capacity. Operations is
responsible for consolidating all responses and rolling out the program. As outlined previously,
external supplier capacity is an input to the supply plan process, used to determine if the demand
plan should be accepted or rejected.
Supplier capacity information is collected both by Supplier Delivery Assurance Engineers
(SDAs) and the buyers. Thereafter the supplier response is prepared for each supplier, in this
stage the SRM is also involved. Today there is no clear split of responsibility between these
roles. There are several tools and processes used by purchasing to determine supplier capacity,
such as Supplier Capacity Audits (SCAs) and capacity surveys. The responsibility to collect
supplier capacity information mainly falls on the buyer, however, sometimes the SRM also
provide information connected to capacity.
The information on the volumes is received through the S&OP program, showing the expected
number of products to be sold and thus the production per plant. This information is
communicated to suppliers by the purchasing organization to determine supplier capacity. The
other source of information to suppliers on forecasted volumes and orders is received through
the EDI. The EDI information is more related to delivery planning and orders and is the
responsibility of operations. Purchasing is not involved in creating the EDI, as they are not

59
involved with delivery planning. The EDI is generated by a program that merge enormous
amounts of information together with assumptions regarding planning to create the detailed
EDI transmission. This means that the information on the EDI and the program is very different,
the EDI information is in more detail and more complex, as it is adjusted for lead time,
inventory, etc. This means that the information in the program will not be a complete match
with the information in the program, and thus the capacity information at the suppliers may not
be accurate once the actual orders are received. The forecasted volumes are received through
the program for each brand, and it is based on this information that the response is given to
accept or reject the program.
4.4.5 Comments on Supply Plan
When the supply plan is communicated to the internal plants it is divided by product variant,
and thereafter further divided into component level. However, in production demand needs to
be leveled to fit the production schedule, accounting for lead-time and the building of
production buffers. The lead-time and part produced for buffers are not visualized in the S&OP
process; however, they are visible in the EDI. When the production schedule is created, the
point of production may move several weeks and thus requiring suppliers to deliver parts at an
earlier day than outlined in the S&OP program. This results in deviations between the
information in the EDIs and the S&OP volume plan; hence questions are raised from suppliers
as to what numbers should be trusted.
The frequent changes in the forecast can have a high impact on both internal and external
capacity. Even if the forecast remains unchanged on vehicle level, more often than not the
variants shift. This results in even greater variations on the component level. If, for instance,
the variant mix shifts, this greatly increases the number of components required for production
and therefore has a significant impact on production structure even though the total volume
might remain unchanged. This effect is enhanced exponentially in case both total volume and
the variants shift. This process makes plant production planning difficult but also has a very
negative impact on supplier capacity planning.
During the interview process insight was provided on the ability of purchasing to review the
forecasts for volume planning. Compared to other departments with supplier contact, such as
the material planners and supplier relationship managers, who have access to a volume forecast
on the part number level through the MRP system and S&OP program, purchasing has little
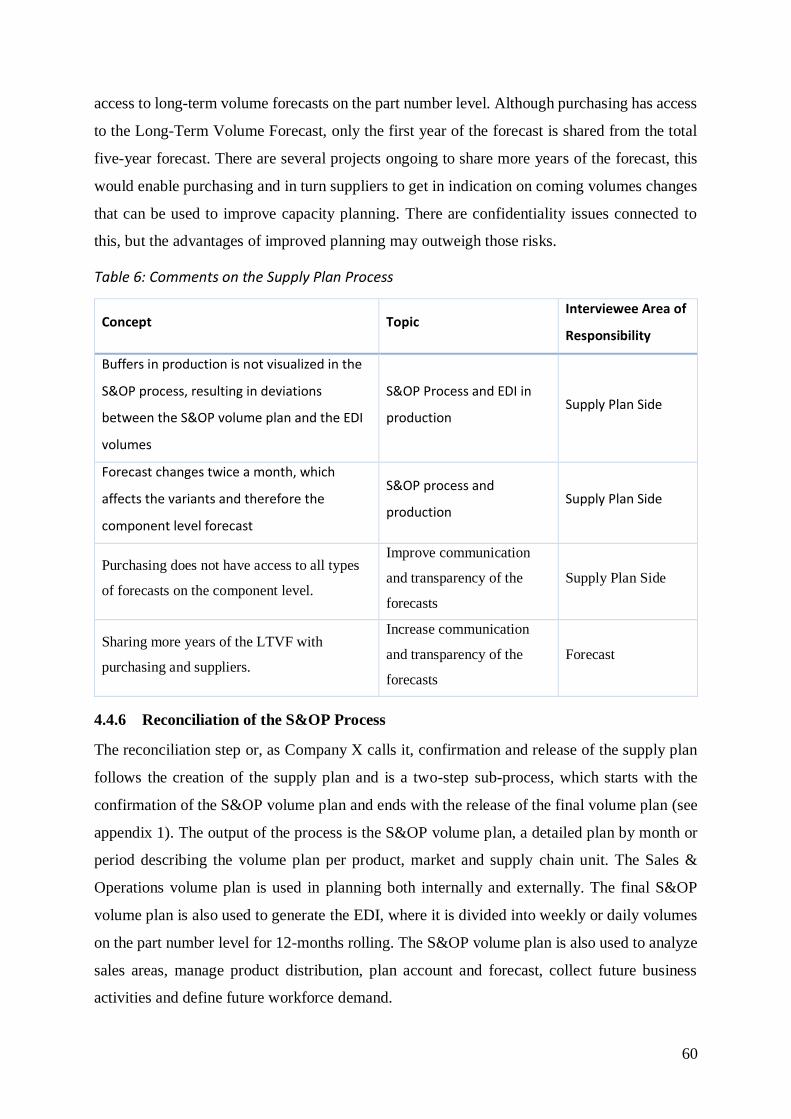
60
access to long-term volume forecasts on the part number level. Although purchasing has access
to the Long-Term Volume Forecast, only the first year of the forecast is shared from the total
five-year forecast. There are several projects ongoing to share more years of the forecast, this
would enable purchasing and in turn suppliers to get in indication on coming volumes changes
that can be used to improve capacity planning. There are confidentiality issues connected to
this, but the advantages of improved planning may outweigh those risks.
Table 6: Comments on the Supply Plan Process
Concept Topic Interviewee Area of
Responsibility
Buffers in production is not visualized in the
S&OP process, resulting in deviations
between the S&OP volume plan and the EDI
volumes
S&OP Process and EDI in
production Supply Plan Side
Forecast changes twice a month, which
affects the variants and therefore the
component level forecast
S&OP process and
production Supply Plan Side
Purchasing does not have access to all types
of forecasts on the component level.
Improve communication
and transparency of the
forecasts
Supply Plan Side
Sharing more years of the LTVF with
purchasing and suppliers.
Increase communication
and transparency of the
forecasts
Forecast
4.4.6 Reconciliation of the S&OP Process
The reconciliation step or, as Company X calls it, confirmation and release of the supply plan
follows the creation of the supply plan and is a two-step sub-process, which starts with the
confirmation of the S&OP volume plan and ends with the release of the final volume plan (see
appendix 1). The output of the process is the S&OP volume plan, a detailed plan by month or
period describing the volume plan per product, market and supply chain unit. The Sales &
Operations volume plan is used in planning both internally and externally. The final S&OP
volume plan is also used to generate the EDI, where it is divided into weekly or daily volumes
on the part number level for 12-months rolling. The S&OP volume plan is also used to analyze
sales areas, manage product distribution, plan account and forecast, collect future business
activities and define future workforce demand.

61
Confirm the S&OP Volume Plan
The first step is to confirm the S&OP volume plan, which is done in a two-step process. It starts
with a review of the supply plan in a consensus meeting to identify potential gaps or risks in
the supply response. Thereafter, the next sub-process is initiated, which involves requesting the
approval of the S&OP volume plan from the senior management committee. The senior
management committee evaluates proposed decisions from the S&OP team, which can be either
approved or adjusted. In certain cases, it is possible that actions are added in order to cover
emerging needs, when all parties leave the meeting, consensus should have been reached.
Release the Final Volume Plan
The second and final step in this process is to release the final volume plan. It takes into account
the decisions taken in the previous steps and starts by adjusting the high-level S&OP volume
plan. The S&OP plan is adjusted according to the decisions taken in S&OP decision meeting
and senior management approval meeting. It is then followed by the allocation of the S&OP
volume plan per division and market. Each division then performs the detailed planning per
market within the overall S&OP volume plan. The last step is to consolidate, analyze and
evaluate each scenario and then adjust the capacity per division and market. With the
concluding step of the S&OP process, the S&OP volume plan is released, consolidated and
communicated.
4.5 Measurements
There are four Key Performance Indicators (KPIs) that measure the quality of the S&OP process
as a whole. They are: S&OP Quality, Delivery Precision, Factory Response Lead Time and
Flexibility. S&OP Quality measures the volumes that were decided three months ago versus
the last decided program. When it is over 100 percent it means that consumption is more than
what has been decided three months ago. Delivery precision measures how the confirmed
delivery dates are executed, while Factory Response Lead Time measures how long it takes the
plant to free up enough production slots to cover one day of production. Lastly, Flexibility
measures the ability to meet the demand requested from the markets, which is affected by a
number of factors, including internal and external capacity.
The demand plan is also checked against four other KPIs; Order Intake, Factory Order Book,
Inventory and Invoicing. The order intake shows how many orders there are for four weeks
rolling. This is compared to the target in the confirmed program, to see if the slots in the
program have been filled. If it is above the target line for a long time it is an indicator that the

62
program volume is too low, and the reverse if it is below target. The factory order book relates
to how many orders there are in the pipeline, orders that are on their way to be delivered to the
market, which is also measured against the program target. The inventory measures the number
of finished products in stock and finally invoicing measures if orders are being invoiced at the
right level.
5 Supplier Communication
To provide an overview of how Company X communicates with suppliers, interviews was held
with two departments that have extensive communication with suppliers regarding forecasts,
volumes, capacity and delivery. These topics being the focus of the thesis these roles have been
selected as especially important for continuous communication on capacity. Purchasing also
play a large role in supplier communication, however the relationship is more characterized
by commercial negotiations and long-term planning for investments. Therefore, this role will
not be discussed in this section.
5.1 Supplier Relationship Management
With focus on reviewing how the forecasting process at Company X impacts capacity planning
and processes at suppliers, both internal and external. An interview was performed with a
manager in Supplier Relationship Management, to further investigate the communication
between Company X and its suppliers and consequently their relationship.
Within the organization, there are several teams with Supplier Relationship Managers (SRMs),
approximately 30-35 people, which are responsible for all suppliers. The suppliers are divided
into two categories, high-profile and low-profile. The SRMs are obliged to share the S&OP
volume plan information with high-profile suppliers on a monthly basis. The information that
the SRMs share with suppliers is provided by the S&OP organization in a presentation, which
also includes the purchasing department. The low-profile suppliers receive volume forecast via
EDI; this is information that all suppliers receive and is connected to the order system. The
difference between the two categories of suppliers is that the high-profile suppliers receive more
information, often in a meeting or phone call. In the EDI, the supplier receives a 12-months
rolling forecast that is updated daily, but it is mostly the numbers in the coming days or weeks
that fluctuates on a daily basis. The information in the EDI is compiled by the operations
department, and is divided into part number level. This is the best and only source that supplier
have for the part number level volumes.

63
Some suppliers are very good at using the information they receive in the EDI; planning
production based on the numbers and question it to ensure that the demand is true and
confirmed. There are also suppliers that do not put as much effort on interpreting the EDI
information. Internal suppliers, on the other hand, are handled differently, they are not managed
by SRMs and are involved in the S&OP process, and therefore they are more informed about
forecasts and upcoming changes. One aspect of this is that the information shared with external
suppliers is subject to confidentiality restrictions. The SRMs are not allowed to send any
information to the high-profile suppliers, instead they can only show it in a presentation, and
all material has been adjusted for external use. This means that the volumes are highly
aggregated to only show demand for the different sales areas. The reason for this is the impact
of the information on company stock price and other factors. There are ongoing projects to
extend the SRM function to more suppliers, so that relationships can be improved. Supplier
relationships require attention and focus by Company X as they are currently not world-class
in this area. Company X must become better in utilizing their existing knowledge and to share
information by improving communication. Today there are situations where they SRMs know
that the information they communicate is incorrect and thus the confidence in the forecasts is
low among suppliers. It must be made clearer why the forecasts change and additional
information must be provided beyond the automatic EDI, in order to improve supplier
confidence.
5.1.1 Comments on Supplier Communication
One source of the low supplier confidence in the forecast was discussed in the interview with
Business Intelligence. The financial crisis in 2007 highly impacted the automotive industry and
may have led to caution among companies when it comes to increasing capacity to safeguards
against similar occurrences. This results in a lower confidence in the forecast and predictions
on a sharp increase in demand is not believed. Another reason for the low of supplier confidence
in the forecast is that historically the accuracy of the forecast has been low. For a long time
before the actual increase in demand, every forecast showed an increase in two months, this
increase was thereafter postponed with every forecast, to the point where no one believed it
would actually happen. When all of a sudden, demand increased, no suppliers were prepared
for the high volumes. This shows that there is much to be done in increasing transparency to
build confidence and relationships with suppliers.

64
The high confidentially surrounding the forecasts means that little information can be shared
with suppliers. There are projects and ideas on increasing the transparency to improve the
relationship with suppliers. There are also ongoing projects to see how Supplier Relationship
Managers can share the S&OP Volume Forecast with more than the high-profile suppliers.
Today there are only few suppliers that get this information from a person and not only EDI
information. The forecast information that is shared by SRMs with suppliers is also on a very
aggregated level. This means that for the supplier to interpret what it means for their business
they must be very knowledgeable in forecast analysis and knowing on exactly what product
models their part is fitted. As an example, an increase by 1000 vehicles in a market does not
mean that the demand for the supplier’s component will be 1000; it depends on the
configuration and type of product. For a project aimed at improving supplier relationships to be
successful, there must be available material that is allowed to be shared with suppliers. It is
important that this material is followed by speaking notes so that suppliers get the same
information from everyone. Today the information is shared with SRMs and purchasing in a
short meeting, where each person needs to remember and interpret the information before it is
communicated to suppliers. This can result in suppliers receiving different information
depending on who is delivering it. The ongoing projects aim at harmonizing this process.
Furthermore, through a past project, some key issues regarding supplier capacity constraints
were identified. Besides the previously mentioned issues regarding processes, some matters
concerning the company´s overall strategy was brought up. First, the company lacks a risk
prevention mindset to support single suppliers in critical situations, thus when problems occurs
all decisions must be taken reactively responding to the already existing problem. there had to
be reactive actions to resolve them, which is also another of the identified issues. This means
that it takes longer than supposed to implement crisis control teams with an efficient cross-
functional setup. This only happened after the number of critical suppliers became
overwhelming. The organization’s reactive mindset means it takes too long to mobilize required
resources to handle the situation. Lastly, there have been difficulties in knowing suppliers´
capacities and capabilities, which made it difficult to anticipate bottleneck situations. Thereby,
external capacity investments were not triggered in time and the critical situation among
suppliers snowballed out of control. Hence, there are suppliers that have been a problem for the
last five years, regardless of volumes.

65
Table 7: Comments on the Supplier Communication Process
Concept Topic Interviewee Area of
Responsibility
Supplier caution stemming from the
financial crisis.
Supplier Capacity and
Confidence Demand Plan Side
An unclear and complex interface
towards suppliers Supplier Communication
Supply & Demand Plan
Side
The forecast accuracy has historically
been low, reducing supplier
confidence.
Supplier Confidence
Supplier Relationship
Management & Supply
Plan Side
Lack of transparency and
communication of forecast
information to suppliers
Supplier Communication Forecast & Supply Plan
Side
Sharing S&OP Volume Forecast with
more suppliers.
Supplier Communication &
Transparency
Supplier Relationship
Management & Supply
Plan Side
Difficulty in interpreting the impact of
the aggregated forecast on supplier
production.
Supplier Communication &
Capacity Planning
Supplier Relationship
Management & Supply
Plan Side
Projects aimed at improving supplier
relationships and transparency
Supplier Communication &
Transparency
Supplier Relationship
Management & Supply
Plan Side
Not a clear strategy to resolve crisis
situations
Crisis resolution/Supplier
Relationship Supply Plan Side
Reactive implementation of crisis
control Crisis resolution Supply Plan Side
Lack of risk prevention mindset to
backup single sourcing Single Sourcing Supply Plan Side
5.2 Material Control
There is a department for material control at each plant within Company X, the main purpose
of the material controllers is to monitor supplier deliveries to ensure that production does not
run out of material. A system called the global inbound logistic management is used to create
delivery schedules that is sent in the EDI to suppliers. The information available in the system
66
on inventory balance, line balance, as well as the dispatch dates and delivery information from
suppliers is combined with order status and call off dates to calculate the delivery schedule. The
system is monitored daily to see if deliveries are on time and in the right quantity. When a
supplier sends their delivery, they should report this through the EDI system, if this is not done,
the material controller receives an alarm list. The material planner is then responsible for
contacting the supplier to resolve the issue and calculate when production run out of material.
In the communication with suppliers, agreements can be made to change the delivery schedule,
for this to be possible there must be enough material in stock so that production is not disrupted.
The difference between the EDI and the S&OP volume forecast is that the EDI outlines the
daily requirements to match the production rate. The forecast created in the S&OP process
instead outline a gross requirement for a period. In production, it is common to plan for buffers
to handle demand in case of stop days, vacation or machine failure. The buffer volumes are not
visible in the forecast but is only shown in the EDI and delivery schedule. This means that the
volumes that the supplier has been informed of in the forecast may be moved several weeks
ahead. In some cases, this means that a demand peak can move across the border of the period
in the system and occur several weeks before the forecast said it would.
The communication between the material controller and the suppliers are mainly centered
around deliveries. Material planners have a report divided by supplier where they measure
delivery precision and can take action if they see performance issues to find the root cause.
Information regarding volumes over a longer time horizon should be provided by the SRM.
However, if the supplier has questions on the EDI and the delivery information they should
contact the material planner so that they can help in finding out where the issue may be. For the
material planner to know where the problem stems from, requires a long process to see where
the deviations in the EDIs actually occur. As the forecast process is very complicated it can be
hard for the material planner to find to cause of the problem. The system for controlling delivery
schedule quality has been taken out of use as it did not work very well. This means that the
material controllers and the operations department do not know what they are sending to the
suppliers. If there is a problem with the EDI or the delivery information, they are made aware
of it by the suppliers that contact them if something looks off. Measuring the delivery schedule
quality could be important to improve internal processes.

67
Table 8: Comments on the Role of Material Controllers in Supplier Communication
Concept Topic Interviewee Area of
Responsibility
Discrepancies between the forecast and
the EDI due to buffers in production.
Supplier Communication &
Forecast Accuracy Supply Plan Side
The complex forecast and EDI creation
process makes it difficult to find errors.
Supplier Communication &
Forecast Accuracy Supply Plan Side
EDI Quality and thus delivery schedule
quality is not measured.
Supplier Communication &
EDI Accuracy Supply Plan Side
6 Supplier Interviews
Presented in the following section are the results from the supplier interviews performed with both internal and external suppliers to Company X. The aim of the interviews is to further investigate the impact of the forecast process, the S&OP process, on capacity planning.
6.1 Internal Supplier
The internal supplier is a production facility within in Company X and is responsible for
forging, machining and assembly of components for the product. The plant is part of the S&OP
process within the supply plan stage. It is the responsibility of the plant to determine if available
production capacity can be matched with the volumes in the demand plan. Therefore, it is
involved in the “S&OP Proposal Meeting” with the goal of producing a proposed supply plan
for the whole production facility. Because this is an internal plant, the process of receiving
forecasts and capacity planning differs from external suppliers as the local plant process is
highly connected to the Sales and Operations Planning process.
It is important to highlight that despite the fact that the internal process goes through a number
of steps; it is performed in a short time span. The S&OP process is run simultaneously all around
the world, and thus it is important to complete this process in a timely manner. The creation of
the proposed supply plan for the internal plant is done as a result of a specific sequence of local
processes. The local process starts with the program planner receiving the program volumes
from the supply plan team within the operations function at 15:00 on Wednesday. Initially the
volumes are received and translated into a format that can be used and analyzed in the plant. In
essence, this means translating the volumes into the different product types produced at the
plant. The volumes received in the program reflects the core volumes, the demand from
68
customers, however they are not adjusted for lead time and therefore not ready to be used for
production planning. These numbers are presented to the higher management at the plant,
including the supply chain director and the plant vice president. Although the volumes are not
adjusted for lead time they are often well balanced, as the supply plan organization at the
operations department for the Company X has already made an estimation of plant capacity and
split the volumes by product category before sending the program volumes to the plant. This is
something that differs between the brands within the Company X, some volumes are not as
balanced and therefore harder to interpret. The purpose of the initial review with management
is to see the changes from the last program and what effect the change will have on production.
One aspect of the S&OP process is that the plant must accept the full program for two-years
forward. For the internal plant that has existing processes, tools and the information to make
this decision, the capacity planning can be done relatively accurately. External plants may
however lack both the tools and the information for them to respond to the full program.
A number of tools are used locally to interpret the volumes, such as pivot tables for displaying
the volumes and a Program Capacity Check (PCC) tool, which adjusts the volumes for lead
time. In the review meeting with the top management, pivot tables are used to show the program
volumes, this information must thereafter be adjusted for both lead time and buffers to be used
to create the actual production schedules. After the review meeting with the top management,
the full global volumes are further split into different product configurations depending on the
characteristics of the product and the production line set up. In order to fit the volumes to
production they must be analyzed by using the PCC tool, adjusting for lead time and buffers.
In order to fit the product variation to the different production lines a good knowledge and
understanding of the production set up is necessary. Another aspect to consider when planning
production is the nature of the demand, if demand consists of a constant flow of products or if
the products ordered in batch volumes. This depends on what brand within the Company X the
products are delivered, some brands have more constant, balanced demand, while others order
in batches as they have a buy-from-stock setup. This is in essence dependent on the purchasing
behavior of the customers.
Once the volumes have been broken down to component level and adjusted with the use of the
PCC tool, the next step in the process is to extract the volumes in a spreadsheet where they are
translated in to assembly rate per period. In order for this information to be accurate, an
overview of the changes from the last program must be known. It is important to get the right

69
information in this stage, to inform, in as much detail as possible, the production units about
the volumes, so that they can answer to if they can manage the volumes or not. Up until now
an analysis has been performed of capacity on a high level, with meetings with production
planners, trying to make sure that the program volumes for the first quarter match the actual
orders as closely as possible, to reduce the volume fluctuations in production. On Thursday at
12:00, the information on production rates, and the main differences from the previous program
gathered until now, is released and distributed to the production units within the plant. Where
the volume information is analyzed per department in order to check if they are capable of
meeting the new demand. The information is presented in a spreadsheet that outline the weekly
production rate for the coming month. If the production units believe that demand can be met
with the existing production capacity, they respond that they accept the program.
Once that analysis has been performed, the local program which includes the average rates for
production plus comments regarding the main important differences compared to the last
program, is distributed. Along with this, support documents are also handed out for different
functions such as production planning and finance. The volume information is often in line with
the actual order board, the order board reflect the actual demand in form of orders and can be
seen on Friday for all the brands within the Company X. The reason for the adjustment of the
volumes before they are presented to production, is that the production units are not interested
in the period demand, but rather the required production rate. This way the production unit can
plan the rate of production within the period themselves. The production setup is highly
connected to suppliers as they need to deliver according to when production needs the
components rather than when the end customer expects delivery. The ability to meet the
program is measured and visualized by comparing the volumes to the existing capacity and the
buffer volumes.
The PCC tool is also used to see the plant capacity with different number of shifts, from 2-shift
production to 5-shift production. This is done to visualize capacity constraint risks, as when
production runs on 5-shifts, capacity cannot be increased further. Production capacity is
affected not only by the number of shifts, but also by machine failure and supplier capacity.
The plant´s ability to meet the volumes greatly affects all supply chain units involved, including
external suppliers. Suppliers are located all over the world and therefore disruptions can be
amplified when lead times are included. Due to the fragility of the supply chain, any risks
related to supplies or receive volume forecasts early to plan production accordingly. Major

70
changes of capacity, such as purchase of new machines, sourcing decisions or major changes
to the workforce, can take years to implement.
The different production units should be done with their analysis on Friday morning, the
answers are collected and presented in the production program answer meeting on Friday at
14:00. In this meeting, the different departments are informed of the core volumes from the
program and how this demand is balanced with the figures in the order board. KPIs related to
forecast accuracy is presented, to see if the orders match the forecast, often it is found that the
forecast volumes are too conservative and estimate demand too low. In this meeting, the ability
to match volumes with production capacity is measured along with the impact of stop days and
vacations on production. This information is added to the local program and presented to
internal stakeholders. This way, everyone has the same information, and can see what analyses
and calculations have been made, to understand what will happen and get a sense of in what
direction the company is moving. They can also understand the reason why the plant gave that
particular response to the program.
Thereafter, the internal program conference takes place. The same material as with the
production meetings is being used with the addition of the program issue log, outlining potential
setbacks within the current program. The goal of this meeting is for the joint internal plant to
answer to the new program request. The last step of the local processes is to present the internal
plant program answer material to the responsible team. This team then represents the plant as
the consensus meeting and the program conference with operations. During this meeting, the
final decision to load the volumes into the system and run the program is taken. The decided
volumes are directly communicated to the finance department to calculate if they follow the
financial plan. The overall plant business is tightly linked to the decided program and therefore
it is important to follow the financial plan accordingly. One important thing to take into
consideration is that not all production plants are the same, each plant is using their own local
processes to handle the program. There are certain differences in the plants and the markets that
are serviced by each plant.
6.1.1 Production Planning
The actual production planning is performed weekly based on the information in the loaded
program, which includes the order board, with the actual decided and preliminary orders. The
information in the order board is already split by flow, so the analysis performed includes
71
determining the optimal start of production given the lead time and the customer delivery date.
The orders for the nearest two to three months are carefully controlled against the program
volumes. Depending on to what brand the product should be delivered and to what market, the
start of production and planning horizon is affected. For markets with long transport time, the
start of production must be moved forward, this means that orders for the Asian market is moved
up by eight weeks and for the US market, five weeks. This can create problems as the production
is moved across period borders in the S&OP program. When planned production moves, this
affects the suppliers as their EDI will not reflect the volumes in the forecast. If an increase in
demand was shown to happen in period five, the actual EDI may request these volumes in
period one due to lead time and buffers in production. This could result in the EDI showing a
lot lower volumes in the later quarters as the volumes have all been pushed forward, sometimes
as far as five to six months ahead of the information presented in the forecast.
6.2 External Supplier – Supplier A
The external supplier that was interviewed is a one-product company that supplies a component
used in production. It is a relatively newly created company that supplies component to the
entire industry. The interview has been performed with a representative from the commercial
side of the company, and thus technical details from production may be less in focus. The results
from the interview will be presented in two sections, the first focused on the communication
and analysis of the forecast, the second will focus on capacity planning at the supplier’s plant.
6.2.1 Forecast Communication
The volume forecast, detailing demand on the component level, is only received in an EDI
message that is sent directly into their system from Company X. Upon receiving the EDI there
is no communication with Company X, they simply receive the information about the ordered
volumes for the coming 12 months rolling. The time horizon and information in the EDI varies
dependent on from what brand within the Company X it is received.
Information about forecasts and volumes has also been received from a supplier relationship
manager at Company X. In a monthly meeting between the SRM and the representatives from
sales and material planning at supplier A, a discussion about volumes and practical issues was
held. The SRM wants to make sure that supplier A can see the upcoming changes in demand,
in this case the large increase, and if they can see that in the EDI numbers. The SRM acts as an
intermediate with whom volume and practical issues could be discussed, someone able to give
a heads up on coming changes, and who could help with certain problems. As Company X is a

72
large company with many internal business units, the SRM was able to step in and help when
issues with deliveries or payments occurred. The SRM can also be helpful when the supplier
face issues related to the internal organization at Company X. This often happens when
communicating with different brands within Company X as they have different systems that
cannot communicate with each other. The SRM have a good overview of both the internal
organization and who to contact as well as good communication with external suppliers. This
was a valued two-way communication as compared to the EDI that only provides one-way
information. It is important that the role of the SRM is kept independent and objective.
Compared to receiving the information from a buyer, supplier A felt they could be more open
with the SRM due to the nature of their roles. The role of a buyer is to negotiate prices and
having a commercial relationship with the supplier and thus certain information may be
sensitive to share. Today, they have less contact with their SRM and only receive information
via email, this is a contact that they miss, as the information is now completely neutral with no
personal contact.
Compared to the information received in the EDI, the SRM provided a bigger picture. The EDI
numbers only communicated what is ordered and demanded by Company X, and is updated
almost daily as the orders are changed. Any information regarding future orders or volumes is
communicated through the EDI or in the contact with the SRM. The EDI is delivered into the
business system, from where the numbers are extracted daily and used to plan production, in
material planning and to review future plans. As they have suppliers delivering components to
their production, the EDI numbers are also used to plan order volumes from their suppliers.
Using the EDI number in combination with the system a longer time horizon can be achieved,
this review is performed quarterly and includes an analysis of sales numbers and the forecasted
volumes in the EDI. This is done to get an overview of future volumes to improve and facilitate
production planning and material supply in the long-term. From experience, supplier A have
learnt that the volume forecast in the EDI can be trusted for the first two quarters, when it comes
to the third and fourth quarters in the 12-months rolling forecast, the accuracy declines rapidly.
As the EDI is not complete for the last quarter, the supplier must make their own estimation
and add volumes for the forecast to be more correct. For this estimate the information received
from the SRM is used together with the EDI and a market analysis. This process enables the
supplier to make a good estimation of coming volumes, but if the material from Company X
would be more accurate and stretch over a longer time horizon, of course planning can be
improved further.

73
The forecast communication is similar among all supplier A’s customers, most work in the
same way, which in essence good. Order and volume forecasts is received via EDI, this makes
communication easy for the customers but can be frustrating for the supplier as they cannot
respond to the information. One thing that does differ between supplier A’s customers is the
accuracy of the forecast, the level of confidence they can put in the forecast numbers, which is
something that has been established from experience.
6.2.2 Forecast Accuracy
There is no formal measurement of the accuracy of the forecast received from Company X. As
the EDI numbers are updated almost daily, it is difficult to know what numbers to use as the
actual forecast, this would mean measuring against a moving target. Receiving updates to the
EDI several times a week poses a dilemma in production as they must always be prepared. Then
of course too high fluctuations cannot be handled on a daily or weekly basis, as there is no
excess capacity or workforce available in the short-term. One measure that is used is the
delivery precision based on the firm orders received from Company X. As the forecast is a mix
of firm, preliminary and forecasted orders and the numbers for the nearest weeks and months it
must be reliable as it relates to actual customer orders. If supplier A would not have any
confidence in the EDI numbers they would be unable to plan production. For the third and
fourth quarter of the EDI information, however, the confidence is lower. The estimated volume
numbers can be seen to decrease already in the third quarter, and often in the fourth quarter the
volumes have dropped by half, supplier A knows that these numbers are not reliable. The
forecasts they receive from the SRM is often more accurate for the full rolling 12-months,
however this is not as detailed as the EDI, and is not split by component level.
Therefore, the first step of improving supplier A’s confidence in the forecast from Company X
is to improve the information in the EDI so that the volumes are more accurate over the full 12-
month period. The time horizon of how often and quickly the EDI numbers are updated can
also be improved. With updates received more or less on a daily basis, it is difficult to plan
production and it is easy to see that it is a system rather than a person who performs the
calculations that lead to the changes in orders. Of course, there is an understanding for that
orders and forecasts can change, but a monthly update that could give an indication of in what
direction Company X is heading would be very valuable. This meeting would preferably be
with a person to allow for two-way communication. The information could then be incorporated

74
in the planning process to see what type of products are increasing in demand, or if certain
markets are increasing or decreasing. The sooner supplier A can receive the information, the
precision in planning can be improved, this is also of value for Company X as they are
dependent on each other.
6.2.3 Capacity Planning
The capacity planning is performed by representatives from logistics, material planning and
production planning that daily extract incoming data on orders, outbound and incoming
transports and production status in order to steer capacity in the best way possible. In
production, there is always a base throughput of volume and then the EDI information is used
to align that capacity for the coming week. In case of larger fluctuations in order volumes, there
will be a need to increase or decrease the workforce and the number of shifts.
In order to estimate how quickly the capacity can be adjusted, a definition of the short-and long-
term horizon of capacity planning must be determined. Small changes in volumes without
changes to the workforce or shifts can be done weekly and thus is defined as the short-term.
Larger changes to capacity involving hiring staff and increasing the number of shifts can be
done on a monthly basis and can thus be determined as mid-term. More extreme fluctuations in
demand that requires expansion of the production facility takes over a year to implement, and
is defined as the long-term planning horizon. If expansion of capacity should be achieved by
building new production lines or rebalancing the production set-up, continuous communication
with Company X is required and this is often done as a project. The main concern of supplier
A is to get their suppliers to follow the demand fluctuations. A disruption to the supply chain,
no matter where it occurs has a massive effect on the entire supply chain. The ramifications can
be unimaginable, with companies affected worldwide. Today the entire industry faces capacity
constraints due to the high demand in the market. When reviewing production to see if
constraints are likely to occur the first signals are if the orders do not match available capacity.
This indicates that the capacity should be expanded or compressed. In order to identify this
earlier, the numbers received from the customers must be of higher accuracy and received
earlier. Company X has a tool called the supplier capacity audit (SCA) that is used to measure
and map supplier capacity. Supplier A is not able to nor willing to share this information with
Company X, both as they have other customers that would oppose this and that they are
unwilling to share information for the risk of it being used against them in negotiations.
75
In order to extend the communication of information regarding capacity, risk and deliveries to
Company X, there is a cross-functional meeting every second week. In this meeting
representatives from engineering, quality, and purchasing is involved from both companies.
Production-and material planning is not involved in this setting, material planners are however
in daily communication regarding deliveries as discussed earlier. In this meeting, risks and
quality questions can be discussed and solutions can be found to problems with delivery or
supply.
6.2.4 Concluding Remarks
To summarize, the conclusion that supplier A draws from the communication with Company
X is that the SRM is a very important role that is highly appreciated. This is an area in which
they would be happy if Company X placed more resources to expand this role, now the SRMs
have many suppliers to attend to and the time per supplier is quite short. As supplier A has not
yet faced difficulties in delivering the desired capacity, they have been receiving less attention
than suppliers with more capacity problems. One opinion expressed was that the supplier fear
that this means they receive less support and information from Company X, and thus creating
problems in the future. This is connected to the role of the SRM, supplier A wants to increase
communication with Company X related to capacity and forecasts. It is also important to keep
the SRM role neutral, and not involve purchasing. This way, the different objectives of the roles
can be kept separate with focus on practical issues and volumes with the SRM and focus on
price, negotiations, and quality with the buyers.
Today almost the entire automotive industry face capacity constraints, the high demand makes
everyone struggle with deliveries. However, in order to expand capacity with more actions than
just increasing the workforce or the number of shifts, investments must be made to building
production lines or replacing machines. This cost cannot be carried by the supplier alone, and
there is no automotive manufacturer willing to commit to that large investments in the long-
term, thus creating an eternal dilemma. Everyone knows that at some point the market will turn,
and do not want to be stuck with overcapacity.
6.3 External Supplier – Supplier B
Supplier B, is the second external supplier that was interviewed and supplies several
components used in production at Company X. The interview has been conducted with a
representative from the commercial side of the company, that has in turn discussed the questions
with representatives from production planning. As with the first interview, the results from the

76
interview will be presented in two sections, the first focused on the communication and analysis
of the forecast and the second will focus on capacity planning at the supplier’s plant.
6.3.1 Forecast Communication
Supplier B has two sources of volume forecast information. Similarly, with supplier A, the EDI
is received on a daily basis including orders, a volume forecasts for 12 rolling periods and
delivery schedules. The EDI information includes the firm, preliminary and forecasted orders
on a part number level. The delivery schedule is also included in the EDI detailing where the
components should be delivered. The S&OP program in turn displays the aggregate volumes,
which also used in production planning. In addition to this, monthly meetings are held with the
designated SRM from Company X. In the meetings with the SRM, the S&OP program is
presented, showing the volume forecast for the full year. The meeting allows for a two-way
dialogue regarding the forecast, capacity or any other issue the supplier may have. Furthermore,
in addition to the recurring monthly meetings, meetings are scheduled when the EDI displays
large upcoming variations, to confirm that the received volumes are realistic. Once demand has
been confirmed, the material controller is contacted to reach an agreement on the delivery
schedule. In addition to the scheduled meetings, the commercial side at supplier B has
continuous communication with buyers at the purchasing department and material controllers
at Company X. By doing this supplier B can ensure that the volumes in the EDI are correct and
are therefore better prepared for fluctuations in demand.
The software used by Supplier B to receive and analyze the EDI performs most tasks
automatically, and does to quite efficiently. As the EDI volume information is received on a
daily basis, the system is flags for unexpected peaks in demand and sends an alert to the logistics
department, which then can perform the necessary actions and plan accordingly. One of the
issues that can impede smooth operations and lead to issues is that, from experience, the EDI
information cannot be trusted further than six months. The interviewee claimed that forecasted
volumes are displayed accurately for the first two quarters of the 12 rolling periods. In the third
quarter the volumes drop to unrealistically low volumes, in the fourth quarter the volumes are
completely inaccuracy, presenting volumes even lower than the previous quarter and also
placing the total weekly volume on the first day of the week. Another issue raised by supplier
B, is the number of days before the shipment date that the order is frozen. Freezing the order
means that no changes can be made by Company X to the quantities demanded. Currently the
ordered volumes can be changed up to three days before the shipment date, as this time is shorter

77
than the lead time in production it forces supplier B to hold stock at all times. If this period
could be extended to a week before the shipment date, the supplier believed it would increase
efficiency and improve performance.
6.3.2 Capacity Planning
Production capacity planning is performed by the operations department, including production,
material planning and logistics, at supplier B. The process is initiated when the EDI is received;
production planners verify the capacity to see if available capacity covers the demanded
volumes. Production is thereafter planned for the different time periods and internal production
is launched. Additional planning takes place in case there is a need for external operations.
When internal capacity is not sufficient to cover the demanded volumes, supplier B outsource
certain production activities to other companies.
Supplier B is satisfied with their production planning, the automated system is able to support
production, plan capacity and help avoid bottlenecks by providing alerts when risks are
detected. The system uses various indicators such as the ordered volumes and available
inventory to identify capacity issues; however, reactive planning is done by the production
manager. The EDI information is the main source of information to production planning as it
includes actual orders, this information is reviewed daily to ensure that the planning of
production capacity is accurate. When production is planned, a fluctuation of around 10 to 15
percent is being considered, however, the fluctuations are often higher than expected. Based on
the personal experience of the interviewee at supplier B, over the last periods demand
fluctuations have increased dramatically, to the point where they can have a serious impact on
production planning and in turn deliveries.
6.3.3 Concluding Remarks
In general, supplier B has confidence in the information provided in their communication with
Company X. The contact with the different departments at Company X is highly valued and the
recurring meetings with the SRM help maintain a well-functioning relationship between the
two companies. The supplier also feels comfortable discussing delivery issues with the material
controllers, which is another indicator of good relationship between the companies. Lastly,
compared to supplier A, supplier B is comfortable discussing commercial and capacity issues
with the purchasing department at Company X. The supplier values a good relationship with
the buyers, as they realize the importance of cooperation in the case of investments. If a large

78
investment is required at the supplier’s plant to increase long-term capacity, the discussion will
have to be held with purchasing.
When it comes to production planning, the process is done more or less automatically by the
software used at the supplier. One issue that comes up in this stage is the low confidence in the
EDI information for a longer period than six months. The system cannot automatically plan
production as the volumes must be confirmed by the material controller and SRM to ensure that
they reflect real demand. This is closely related to the frequency of volume fluctuations, and
the period before the shipment date that the orders are freezed. Therefore, production planning
is performed to account for a certain degree of volume fluctuations. These issues were
mentioned as the most important for supplier B.
7 Discussion
In the following section the results of the empirical study is discussed from the perspective of
the theoretical background and the information gathered in the interviews. The purpose of
the discussion is to answer the research questions. The discussion is divided into a number
of categories identified as the major areas for discussion in the empirical
findings. The discussion aims at highlighting the connection between the different processes
and how they impact one another. Thereafter a number of recommendations are presented for
future actions based on the discussion.
7.1 The Internal Processes
7.1.1 Forecasts
One of the main topics raised in the initial stages of the study, was that the large increase in
demand and the following capacity constraints had not been seen in the forecasts. As the
forecasts had not anticipated the increase in demand correctly, suppliers were unprepared for
the high volumes demanded. However, the forecasts have for a long time shown a demand that
ends up being lower than the actual orders, and thus when the increase was shown in the
forecast, suppliers did not have confidence in that these numbers were actually accurate.
Connected to this issue, is that the forecasts were adjusted too close to the actual increase for
suppliers to be able to make large adjustments to capacity. Therefore, it may be that the
departments creating the different forecasts have been too shy in asking for volumes. However,
referring to theoretical studies showing that even organizations that are excellent at estimating
79
demand, can expect an error of between 15 to 20 percent. This led Sheldon (2006) to make the
recommendation that when developing a forecast, it is better to estimate demand a little lower,
to avoid the high cost of excess inventory that cannot be sold. Thus, comparing the actual
forecast process at Company X with literature on forecasting, the process seems to adopt the
recommendations from researchers within the field.
There are however, ways to improve the accuracy of the forecast, one is the use of statistical
methods to analyze the forecast error over time. Increased use of statistical methods both when
developing the TMF and especially in the creation of the demand plan in S&OP, could allow
for a better analysis of data and thus more accuracy in the forecast. Company X can also develop
another approach to forecasting, Bowersox et al. (2010), claim that forecasting is not predicting
what customers will buy but rather to affect what they will buy and steer demand. This would
mean that sales and marketing would have to analyze the impact of their strategies on the
market. If this approach would be adopted by Company X it could mean that the estimation of
demand can be improved. By steering demand, the forecasted volumes can be leveled, so that
the demand is balanced over time. This could reduce forecast fluctuations in the forecasts and
in the S&OP program. For Company X to improve forecast accuracy and
planning, the flexibility to meet demand must be present at all stages of the supply chain,
something that could be achieved if demand is balanced over time.
However, it is vital to be aware of the significance not only of forecast accuracy, but also
forecast allocation. In the S&OP process, when the departments responsible for the different
markets communicate volume forecast to their respective sales area and to demand planning,
the allocation of volumes is determined based on past experience. From the information
gathered in the interviews it appeared that the allocation of volumes to each market
is rather arbitrary with the thought that volumes can always be redistributed at a later stage
when the forecast has been confirmed by orders. However, according Ganesan
(2015), inappropriate forecast allocation can be a source of supply chain disruption and should
be carefully considered before proceeding with the forecast.
Often, the forecast is blamed for planning issues, as mentioned before this is also the case
at Company X. However, as mentioned by Sheldon (2006) the forecast is not always the single
source of the problem. The forecasted volumes are based on customer demand and low forecast
accuracy can more often be due to the unpredictable nature of customer behavior. During
80
the study, the impression was that internally the accuracy of the forecasts and the S&OP
program has been identified as one of the main sources behind the
capacity constraints. However, when interviewing external and internal suppliers the
impression was rather that the accuracy of the EDI information was more to blame for the
problems with capacity planning.
7.2 Sales & Operations Planning
According to literature on S&OP, the purpose of the process is to increase communication,
cooperation and align the objectives of the demand and supply side of the company. These
and other benefits from the process thus lead to improved customer satisfaction and
profitability. The S&OP process at Company X has been developed and aligned with theoretical
best practice within the research field. However, in the study, some areas within the S&OP
process has been identified that can be further developed. Initially, the degree of cross-
functional communication could be increased, so that everyone involved have an overview of
the process as a whole and the responsibility of the involved departments. In the development
of the demand plan, the role of marketing could be more prominent to see the
effect marketing activities have on demand. In the supply plan stage, the role of purchasing as
a source of information on external capacity could be promoted further to increase the
knowledge of supplier capacity. When performing interviews with stakeholders in the S&OP
process, there is an expressed interest in increasing communication across departmental borders
to get a full understanding for the S&OP process. The communication of the S&OP program
information and forecasts also differs extensively between internal and external suppliers. Both
because internal suppliers are highly involved in creating the S&OP volume plan, and because
external suppliers are subject to high confidentiality.
7.2.1 Demand Plan
One thing that was mentioned in the interviews with the demand side of S&OP was the lack of
a standardized way to create the market forecasts. The markets can set the forecasted
volume according to their own understanding of demand. To make sure that the market forecast
is accurate, the demand volumes are adjusted in a number of meetings. The consequences of
inaccurate demand are large for production both internally and externally. As production is
planned according to the forecasted volumes, the repercussions from overestimating demand
are high both in terms of investment cost and high inventory holding costs. This calls for the
need of a standardized way of creating market forecasts, such as how to interpret the Total
Market Forecast and market shares.
81
There are several ongoing projects to develop the S&OP process, both related to the time-
horizon. The first is focused on extending the 12-months rolling forecast to cover 24-months,
and the other aims at extending the entire S&OP process to three years, with the third year
being forecasted as a full-year volume. The purpose of these projects is to move the focus
of the process from the first year, to also consider the second year in the planning process.
Today the high focus on the current year can be an issue from the supplier point of view, when
planning production and capacity in the long-term. Although these projects address an
important topic related to the planning horizon, the main issue raised by suppliers is rather the
accuracy of the EDI information. When the EDI is received by suppliers it should contain
volumes for the full 12 rolling periods. However, in the last three months the volume
information is not complete which makes it hard to plan for the long-term as it is the supplier's
only source of volumes on the part-number level. This would imply that the development of the
EDI is more valuable to suppliers than the development of the S&OP process.
7.2.2 Supply Plan
When production is planned according to the S&OP program, demand needs to be leveled to
account for lead-time and production buffers. The adjustments done in production
result in demand for the products used in production moves up to account for the additional
lead-times and planning. Thus, the demand displayed in the EDI sent to supplier can
vary significantly from the demand in the S&OP program. This could then mean that the
volume that the supplier was informed about would be needed in period five, may actually
be ordered in period one. This results in questions from the suppliers at to what numbers should
be trusted and increases the difficulty to plan ahead.
Another thing that impacts the suppliers' ability to plan capacity is the frequent changes to the
EDI, as the product mix changes when orders are placed, the volume fluctuations on the
component level can be large. Faced with almost daily updates to the EDI, suppliers sometimes
struggle to deliver according to schedules. This is also influenced by the time in which the order
can be changed, often being only three days before the shipment date. As the production lead
time for many products often exceeds three days, it can be very difficult to meet the new
volumes without holding large inventory.

82
7.2.3 Purchasing
Another aspect that was highlighted during the interviews, and mentioned above, is the
involvement of the purchasing department in the S&OP process. If purchasing would be
involved already in the supply plan proposal, information about external capacity would be
known in time for the plants to plan their own production. By knowing whether the program
will be accepted or not in an earlier stage, the production plants would have to put less effort in
trying to fit the volumes within their capacity. Therefore, there are ongoing projects to involve
purchasing more in the S&OP process.
7.3 External Processes
7.3.1 Forecast Communication & Accuracy
For an organization to provide a reliable estimate of demand, it must develop effective
communication of information even beyond company borders. By sharing information with
suppliers, cooperation and in turn planning can be improved. If suppliers are given access to
information regarding the expected volumes the managing of potential capacity bottlenecks
could be improved. Basu and Wright (2017) state that the development of a successful supply
chain enables an organization to balance capacity and customer satisfaction while improving
company performance.
7.3.2 Electronic Data Interchange Quality
Information regarding forecasted volumes and orders are communicated to suppliers either
through a Supplier Relationship Manager, EDI or both. The S&OP program information,
showing forecasted volumes on an aggregate level is communicated by the SRM, while part
number level information is sent via EDI. These volumes consist of both firm, preliminary and
forecasted orders and it is used to plan daily production. However, suppliers need to
forecast their production and supply requirements over a longer time-horizon. Due to the low
accuracy of the EDI in the long-term, it must be used in combination with the S&OP program
information and existing knowledge of the market for the suppliers to generate their own
forecast.
The information on the volumes in the EDI is often very different to the S&OP program, this is
due to lead-time and buffers in production. As the production schedule moves the planned
volumes across the periods, the volumes end up being pushed forward. This could be a reason
why the EDI often show inaccurate numbers in the last quarter. To improve the quality of the

83
EDI it is vital to be aware of what information is being transmitted to the suppliers. Previously a
tool was used to control the quality of the delivery schedule in the EDI, however the tool
seldom worked well enough for it to be used. This means that if there is a problem with the
EDI, the suppliers must contact their assigned material controller in Company X and inform
them of the problem. A tool measuring the quality of the delivery schedule and the
EDI transmission could be important to improve the internal process and supplier
relationships.
For the suppliers to be able to have increased confidence in the EDI information received from
Company X, the first step would be to make sure that the volumes are accurately displayed over
the full 12 rolling months period. Secondly the frequency of the changes to the EDI can also be
improved, with, more or less, daily changes in the demanded volumes it is difficult to
accurately plan production. Another aspect that can be improved is to have increased
communication with the SRM about the changes to get an idea of the market situation. Having
a meeting with a representative from Company X allows for a two-way communication and
suppliers can discuss concerns or raise potential questions. To summarize, if the supplier
receives highly accurate information about volumes earlier, planning can be done with higher
precision, benefiting the commercial relationship between the supplier and Company X.
7.4 Supplier Relationships
According to Bowersox, et al. (2010), one of the main reasons for unsatisfactory supply chain
performance is lack of visibility. By increasing the visibility and transparency of supply chain
information, the risk of disruptions could be decreased. Over the last decades the relationship
between supply chain partners has evolved. Especially supplier relationships are to a higher
extent characterized by long-term contracts, cooperation and information sharing. Building
relationships with suppliers, means sacrificing some power in negotiations, however in times
of market uncertainty it is highly motivated. Building relationships improves the flexibility of
the supply chain and the ability to handle demand fluctuations (Helper, 1991).
To build a successful partnership, Basu & Wright (2017) mention mutual trust as the single
most important aspect. Jarillo (1988) mention that trust is built over time
by establishing processes for information sharing and showing commitment to the relationship.
For suppliers, committing a large share of capacity to a single customer is a large risk, if
anything would disrupt customer demand (von Massow & Canbolat, 2014). In today's market
climate, with high demand uncertainty, Company X is acknowledging the value of improving
84
supplier relationships and has initiated a number of projects to do so. The focus of the projects
is to improve the utilization of existing knowledge in the company and improving
communication and information sharing. One of the projects reviews the possibility to share
the S&OP program with more suppliers. The responsibility of improving supplier relationships
is largely part of the SRM role, the idea has been explored to extend the SRM responsibility to
buyers. In their communication with the suppliers, the SRMs need to provide information
beyond the automated EDI and make clear why the numbers change, otherwise trust cannot be
generated. Although there are projects aimed at improving supplier relationship by
communicating more information, they are still restricted by confidentiality. Since
confidentiality restricts the amount of information that can be communicated to the suppliers,
the projects must ensure that the material can be shared with the supplier, and that it includes
speaking points so that all suppliers receive the same information. The SRM role is very valued
by the suppliers that have access to it. However, one external supplier expressed the importance
of keeping the SRM role neutral and separate from purchasing, as they then felt freer to share
information on volumes and capacity.
Previously, Company X has had a reactive approach to risk prevention, and thus the reaction
time to supplier related issues, has been long. Only after the capacity problem had become
overwhelming, teams were created to work together with supplier to solve it. As Company X
has not focused on building relationships with suppliers, there has been difficulties knowing
their production capacity and capabilities. In turn, this inhibited the ability to anticipate capacity
constraints. This means that the capacity issue is not only caused by the high demand but also
by the low focus on supplier relationship management. Improving supplier relationships also
includes committing to investments to increase capacity in the long-term. If demand increases
from the customer, the supplier cannot bear the cost alone and most automotive manufacturers
are unwilling to commit to large investments. This was mentioned by one of the external
suppliers as an eternal dilemma as everyone knows that the market will at some point turn.
7.4.1 Trust, Confidence and Confidentiality
The topic of trust between suppliers and Company X, the supplier confidence in the forecasts
and the high confidentiality, are related to much of the discussion above. One reason for low
forecast confidence could be the large impact of the financial crisis in 2007 on the industry. As
many companies were affected by the low demand, the willingness to believe in high demand
peaks and make investments to cover the high volumes may be low. Companies with this

85
experience tend to act with caution when making investments to increase capacity. Another
reason why supplier confidence in the forecast may be low, is that the forecast accuracy has
historically been low. For a long time, the forecast predicted a demand increase that never
came, it kept being postponed until no one thought it would actually happen. Then when the
demand suddenly increased and suppliers were not prepared for such a peak in volumes. This
shows that much can be done to increase transparency, trust and to build supplier relationships.
7.5 Recommendations
In the following section, recommendations based on the previous discussion
will be outlined. The purpose of the recommendations is to provide Company X with our ideas
on what actions could be taken to further investigate existing processes and improve
performance. We provide recommendations for the main issues identified during the
discussion, however, specific recommendations might solve more than one of said issues, as
the underlying reasons behind them are of similar nature.
The first recommendation focuses on communication, as this is related to most the topics
reviewed in the discussion. Something highlighted during most of the interviews on the internal
forecasting process, is the low degree of cross-functional communication in the S&OP process.
Each department only has limited contact with other departments involved in the process. Thus,
creating a lack of understanding of the process as a whole and the responsibility of
each department. However, as the S&OP process spans over the whole organization and
includes a large amount of people, having continuous communication with everyone would be
impossible. To improve internal communication related to the S&OP process our suggestion is
to increase the knowledge and understanding of the S&OP process. By sharing the information
with everyone in the involved departments, knowledge and thus confidence in the process can
be increased. This would in turn mean that more people are incentivized to use the program and
improve company performance.
The next recommendation is connected to external communication, as this is something that
was brought up as an area for improvement. With ongoing projects aimed at improving supplier
relationships and thus transparency in communication, this seems to have already been solved.
However, the confidentiality surrounding external communication is a large obstacle to
increased communication. Forecast information shared by suppliers is either limited to a one-
year horizon or highly aggregated. If external communication is to be improved, the
86
confidentiality must be loosened. The reasoning behind the high confidentiality is related
to corporate valuation and the financial market. Therefore, our suggestion is to review the
policies on confidentiality and perform an analysis on whether the high confidentiality hurts the
company more than it protects it, or if it is justified. It may be possible that by loosening the
confidentiality, better relationships with suppliers can be created and thus costs related to
planning and purchasing could be reduced. Another aspect of loosening the confidentiality
restrictions, is that more years of the forecast can be shared with the suppliers and thus the
accuracy pf long-term capacity planning can be improved. For Company X, this could result in
capacity constraints and potential disruptions being discovered earlier along with
counteractions to avoid these problems.
Forecast accuracy is mentioned as one of the main sources of the capacity constraint, and thus
our third recommendation will focus on this. Initially, the difference between the forecast in the
S&OP process and the forecast presented in the EDI must be made clear. As the EDI numbers
have been adjusted for lead-time and buffers it will not match the S&OP program forecast, this
must be communicated to both internal and external actors as there is still much confusion
regarding what numbers to trust. Internally the problem is also that the quality of
the information in the EDI cannot be seen before it is delivered to suppliers. This means that
the suppliers must contact someone at Company X if they identify something questionable in
the EDI. Secondly, because the information in the EDI is based on the S&OP volume plan, the
quality of the forecast used to create it must be improved. This could be done by applying a
standardized way to develop market forecasts and increasing the use of statistical methods in
forecast creation. By applying these recommendations, the estimation of demand can be
harmonized across all markets, improving the accuracy of the demand figures and thus there
would be less need for adjustment during the challenge meetings. In the development of the
demand plan in the S&OP process there are no or few statistical methods used, if the common-
sense approach, outlined in the theoretical framework, would be employed, a combination of
the current qualitative method of forecasting can be merged with quantitative forecast methods
to improve the analysis of historical data and in turn forecast accuracy.
The next recommendation relates to the role of purchasing in the S&OP process. In the current
process the role of purchasing is to provide information on external supplier capacity. This
information is used as an input to the supply plan response that occurs after internal capacity
has been determined. Our recommendation is to provide this information earlier in the process.

87
Today the supply plan proposal process is performed to see if the demand plan volumes can be
met, however in the last stage of the process, the program can still be rejected due to limits to
external capacity. If the supplier capacity is known earlier it can be taken into consideration
when evaluating internal capacity. For purchasing to know how the S&OP program and EDI
information is perceived by suppliers, a measurement of forecast accuracy performed by
suppliers could be valuable. Suppliers currently find it difficult to measure the accuracy of the
EDI information due to the frequent updates of the information. An additional recommendation
is therefore that Company X and suppliers to develop a way to measure forecast accuracy
together as it is useful for both parties for planning purposes.
Finally, the role of Supplier Relationship Managers (SRM) to supplier relationships should be
reviewed. One of the points that was brought up during supplier interviews, was the importance
of keeping the role of the SRM neutral and limiting the commercial presence. This way the
SRM could act as an impartial mediator between the supplier and Company X´s commercial
departments. Important issues that a supplier might be facing can then be discussed freely with
the SRM, without the suspicion of the information provided on capacity being used in
negotiations. The SRMs also have a good overview of internal processes and can be of help
when suppliers face problems with the internal systems at Company X regarding delivery and
payments. Given that the number of suppliers interviewed is limited and only one expressed
the desire for a neutral SRM role separated from the commercial side as Company X it is
something that might not reflect the opinion of all suppliers. The recommendation is however,
to take this into consideration in the ongoing projects related to supplier relationships. It is
however clear the role of the SRM is highly valued by suppliers and there could be value in
extending it to even more suppliers.
8 Conclusion
In the global economy, all companies are part of a vast supply chain and the vulnerability this
implies becomes apparent when faced with market uncertainty. Today the automotive industry
has the pleasant situation of growing demand, however, when this results in supply constraints,
companies are unable to deliver the desired volumes. The motivation behind this study
is therefore, to identify factors that may explain part of the reason why this situation occurred.
With the focus on forecasting, it required us to study both internal and external processes.

88
What we found is that the internal forecast processes are highly structured and developed from
an established theory called Sales and Operations Planning, this then answers the first part of
our twofold research question. The remaining study is focused on communication with internal
and external suppliers and their capacity planning. Forecast communication was found to be
different dependent on what category the supplier was placed in. Internal suppliers are part of
the Sales and Operations Planning process and thus have access to detailed and long-term
volume forecasts. External suppliers do however, not have access to the same information due
to confidentiality constraints. There is also a difference among the external suppliers as some
are categorized as high-profile and some as low-profile, with more forecast information
provided to those distinguished as high-profile. It was found that the amount of forecast
information and its accuracy has an impact on long-term supplier capacity planning.
The findings of the study and the discussion can provide Company X with an insight as to how
the problem emerged, within the confines of this paper. The process maps that have been created
for this paper, allows for a review of the process to create an understanding and thus allow for
improvements. However, some findings contradict the early assumptions as to why the problem
occurred. In the introductory interviews and discussions, it was believed that the capacity
constraints were mainly the result of inaccurate forecasts. The findings do however suggest that
there are more aspects that has had an influence on the existing situation. The fact that we as
students could take another approach to the topic, is believed to have been valuable. This
because we did not have preconceived notions as to the source of the problem and thus could
be open to other perspectives.
Based on the discussion and recommendations we could identify three aspects important to
understand the source of the problem; communication, supplier relationships and
confidentiality. To secure a well-functioning supply chain in a volatile market, integration of
supply chain actors has become increasingly important. With the development of new
technologies such as the electrification of propulsion systems and autonomous driving, the
future direction of the industry is even more difficult to predict. However, by
improving cooperation and transparency in communication with supply chain actors, the
impact of supply chain disruptions can be controlled. The future of the industry looks
promising despite the highly volatile market. However, it is impossible to predict how the
society´s move towards electromobility and autonomous driving will impact the industry as a
whole.

89
8.1 Recommendations for Future Research
The purpose of this paper is to investigate processes specific to a company, therefore continued
research on the specific processes may prove difficult. However, we encourage a continued
internal review of the processes following our recommendations and other identified
improvement areas. As for continued academic research, the field of Sales and Operations
Planning is thoroughly researched, however, we can identify a need for more studies as to how
it works in practice. The theoretical evidence on the advantages of the S&OP process is
extensive but would be nicely complemented by empirical evidence. This is something this
study aims at contributing to, as well as increasing the understanding of the connection between
forecast processes and supplier capacity planning.
1
References
Adams, J., Khan, H., Raeside, R., & White, D. (2007). Research Methods for Graduate Business
and Social Science Students. New Delhi: SAGE Publications India Pvt.
Barney, J. B., & Hansen, M. H. (1994). Trustworthiness as a source of competitive advantage.
Strategic management journal, 15(S1), 175-190.
Basu, R., & Wright, J. Nevan. (2017). Managing global supply chains. London New York:
Routledge, Taylor & Francis Group.
Bowersox, D., Closs, D. and Cooper, M. (2010). Supply chain logistics management. 3rd ed.
New York: McGraw-Hill Higher Education.
Bryman, A., & Bell, E. (2015). Business research methods. Oxford University Press, USA.
Cachon, G. P., Randall, T., & Schmidt, G. M. (2007). In search of the bullwhip effect.
Manufacturing & Service Operations Management, 9(4), 457-479.
Cecere, L., Barrett, J., & Mooraj, H. (2009). Sales and operations planning: transformation from
tradition. Industry Value Chain Strategies. AMR Research, Boston, MA, USA.
Cohen, L., Manion, L., & Morrison, K. (2011). Research methods in education (7.th ed.).
Abingdon, Oxon; New York: Routledge.
Collis, J., & Hussey, R. (2013). Business Research: A Practical Guide for Undergraduate and
Postgraduate Students. 4th ed. New York: Palgrave Macmillan Higher Education.
Croson, R., & Donohue, K. (2005). Upstream versus downstream information and its impact
on the bullwhip effect. System Dynamics Review, 21(3), 249-260.
Crum, C., & Palmatier, G. E. (2003). Demand Management Best Practices: Process, Principles
and Collaboration. Boca Raton, Fla: J. Ross Publishing.

2
Ding, F. Y., Raghavan, B., & Pollard, S. (2007). Supplier capacity analysis for a manufacturing
firm with a case study. Production Planning and Control, 18(6), 514-525.
Feldmann, A., & Olhager, J. (2008). Internal and external suppliers in manufacturing
networks—An empirical analysis. Operations Management Research, 1(2), 141-149.
Feng, Y., D’Amours, S., & Beauregard, R. (2008). The value of sales and operations planning
in oriented strand board industry with make-to-order manufacturing system: Cross functional
integration under deterministic demand and spot market recourse. International Journal of
Production Economics, 115(1), 189-209.
Forrester, J. (1958). Industrial dynamics, a major breakthrough for decision makers. Harvard
Business Review: HBR, 36(4), 37-66.
Ganesan, R. (2015). The Profitable Supply Chain: A Practitioner’s Guide. New York, NY:
Apress Business, Springer Science + Business Media Finance Inc.
Grimson, J. A., & Pyke, D. F. (2007). Sales and operations planning: an exploratory study and
framework. The International Journal of Logistics Management, 18(3), 322-346.
Helper, S. (1991). Strategy and irreversibility in supplier relations: the case of the US
automobile industry. Business history review, 65(4), 781-824.
Jarillo, J. C. (1988). On strategic networks. Strategic management journal, 9(1), 31-41.
Jonsson, P. and Mattsson, S. (2009). Manufacturing, Planning and Control. London: McGraw-
Hill Higher Education, pp.161, 171.
Lapide, L. (2004). Sales and operations planning part I: the process. The Journal of business
forecasting, 23(3).
Lapide, L. (2006). Top-down & bottom-up forecasting in S&OP. The journal of business, 1.

3
Lapide, L. (2011). S&OP: the linchpin planning process. The Journal of Business Forecasting,
30(3), 18.
Lee, H. L., Padmanabhan, V., & Whang, S. (1997). The bullwhip effect in supply chains. Sloan
management review, 38(3), 93.
Lee, H., Padmanabhan, V., & Whang, S. (2004). Information Distortion in a Supply Chain: The
Bullwhip Effect. Management Science, 43(4), 546-558.
Mentzer, J. T., DeWitt, W., Keebler, J. S., Min, S., Nix, N. W., Smith, C. D., & Zacharia, Z. G.
(2001). Defining supply chain management. Journal of Business logistics, 22(2), 1-25.
Meyr, H. (2004). Supply chain planning in the German automotive industry. OR spectrum,
26(4), 447-470.
Mohr, J., & Spekman, R. (1994). Characteristics of partnership success: partnership attributes,
communication behavior, and conflict resolution techniques. Strategic management journal,
15(2), 135-152.
Oh, S. Y. (2014). Shifting gears: industrial policy and automotive industry after the 2008
financial crisis. Business and Politics, 16(4), 641-665.
Olhager, Jan, Rudberg, Martin, & Wikner, Joakim. (2001). Long-term capacity management:
Linking the perspectives from manufacturing strategy and sales and operations planning.
International Journal of Production Economics, 69(2), 215-225
Rong, Y. (2008). Studying the impact of supply uncertainty on multi-echelon supply chains.
Lehigh University.
Rong, Y., Shen, Z. J. M., & Snyder, L. V. (2008). The impact of ordering behavior on order-
quantity variability: a study of forward and reverse bullwhip effects. Flexible services and
manufacturing journal, 20(1-2), 95.
4
Rong, Y., Shen, Z. J. M., & Snyder, L. V. (2009). Pricing during disruptions: A cause of the
reverse bullwhip effect.
Rong, Y., Snyder, L., & Shen, Z. (2017). Bullwhip and reverse bullwhip effects under the
rationing game. Naval Research Logistics: An International Journal, 64(3), 203.
Sako, M., & Helper, S. (1998). Determinants of trust in supplier relations: Evidence from the
automotive industry in Japan and the United States. Journal of Economic Behavior &
Organization, 34(3), 387-417.
Schorr, J. E. (2007a). Integrated Business Management. Business Excellence, June 07, 8-11.
Schorr, J. E. (2007b). Product development. Business Excellence, July 07, 10-13.
Schorr, J. E. (2007c). The demand review. Business Excellence, September 07, 8-11.
Schorr, J. E. (2007d). The supply review. Business Excellence, October 07, 8-11.
Schorr, J. E. (2007e). The language of management. Business Excellence, November 07, 10-
13.
Schorr, J. E. (2008). The proven path. Business Excellence, January 08, 8-11.
Sheffi, Y. & Bovet, D. (1998). The Brave New World of Supply Chain Management. Supply
Chain Management Review. 14-23.
Sheldon, D. H. (2006). World class sales & operations planning: A guide to successful
implementation and robust execution. J. Ross Publishing.
Simonsson, C., Hjorth, M., Sandberg, H., & Thelander, Å. (1998). Möten på fältet. Kvalitativ
metod i teori och praktik (Vol. 1998:1).
Sturgeon, T., Van Biesebroeck, J., & Gereffi, G. (2008). Value chains, networks and clusters:
reframing the global automotive industry. Journal of economic geography, 8(3), 297-321.
5
Tenhiälä, A. (2011). Contingency theory of capacity planning: The link between process types
and planning methods. Journal of Operations Management, 29, 65-77.
Thomé, A. M. T., Scavarda, L. F., Fernandez, N. S., & Scavarda, A. J. (2012a). Sales and
operations planning: A research synthesis. International Journal of Production Economics,
138(1), 1-13.
Thomé, A. M. T., Scavarda, L. F., Fernandez, N. S., & Scavarda, A. J. (2012b). Sales and
operations planning and the firm performance. International Journal of Productivity and
Performance Management, 61(4), 359-381.
Tuomikangas, N., & Kaipia, R. (2014). A coordination framework for sales and operations
planning (S&OP): Synthesis from the literature. International Journal of Production
Economics, 154, 243-262.
Vollmann, T. E., Berry, W.L., & Whybark, D.C. (2005). Manufacturing planning and control
for supply chain management. Boston: McGraw Hill.
von Massow, M., & Canbolat, M. (2014). A strategic decision framework for a value-added
supply chain. International Journal of Production Research, 52(7), 1940-1955.
Weber, R. (2004). Editor's Comments: The Rhetoric of Positivism versus Interpretivism: A
Personal View. MIS Quarterly, 28(1), Iii-Xii.
Yin, R. (2014). Case Study Research: Design and Methods, Third edition. London: Sage
Publications.
Zacharia, Z. G., Nix, N. W., & Lusch, R. F. (2009). An analysis of supply chain collaborations
and their effect on performance outcomes. Journal of business logistics, 30(2), 101-123.
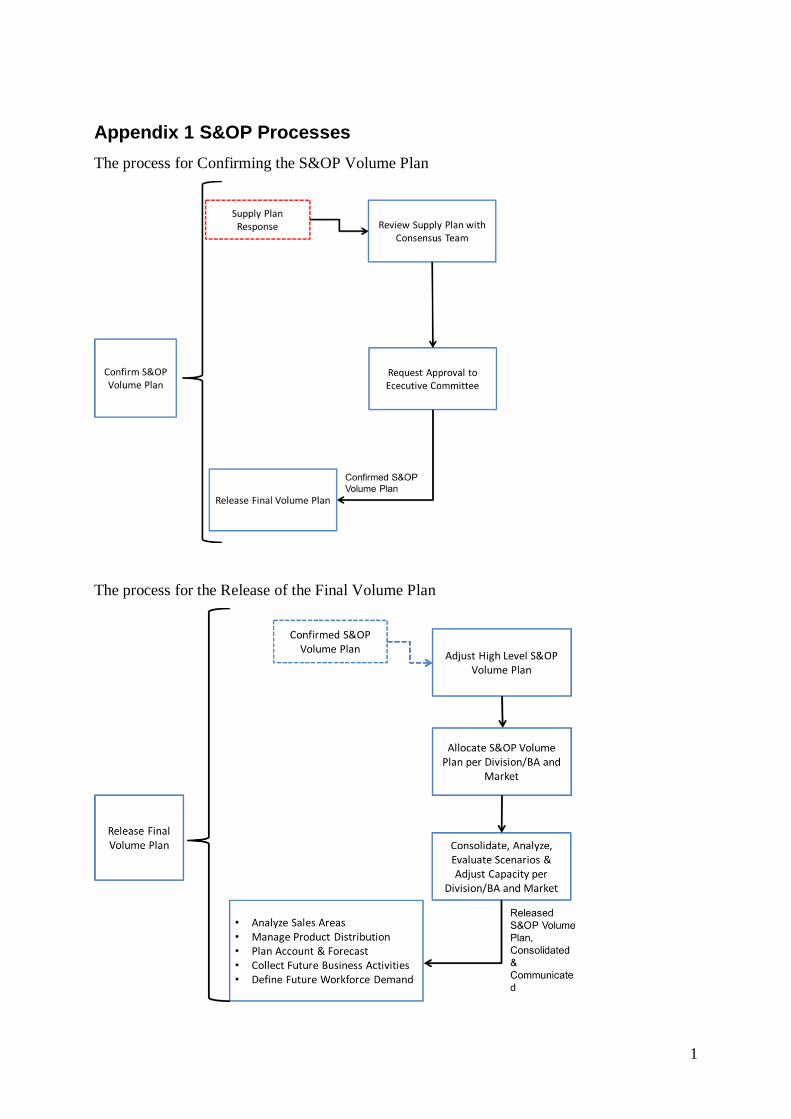
1
Appendix 1 S&OP Processes
The process for Confirming the S&OP Volume Plan
The process for the Release of the Final Volume Plan

2
Appendix 2 Interview Guide - Internal Interviews
The interview guide contains the topics discussed in the interviews.
• The S&OP Process
o Demand Plan
o Supply Plan
o Reconciliation
• Forecasts
o The different types of forecasts
• Measurements and Communication

3
Appendix 3 Interview Guide - External Interviews
The interview guide contains the topics discussed in the interviews.
• Forecast Communication
• The Forecast Process
• Forecast Information Systems
• Supplier Capacity Audit
• Capacity Planning