supply chain outsourcing under exchange rate risk...
TRANSCRIPT
Supply Chain Outsourcing Under Exchange Rate Risk and Competition
Zugang Liu
Department of Business and Economics
Pennsylvania State University
Hazleton, Pennsylvania, 18202
and
Anna Nagurney
Department of Finance and Operations Management
Isenberg School of Management
University of Massachusetts
Amherst, Massachusetts 01003
May 2010; revised November 2010
Omega 39: (2011) pp 539-549.
Abstract: This paper studies the impacts of foreign exchange risk and competition intensity
on supply chain companies who are involved in offshore outsourcing activities. In particular,
we develop a variational inequality model that considers firms’ decision-making regarding
pricing, offshore outsourcing, transportation, and in-house production under competition
and foreign exchange uncertainty. We also use a series of simulation examples to answer
questions regarding outsourcing and pricing strategies of supply chain firms with different
risk attitudes, and explore numerically their associated profits and incurred risks.
Keywords: Supply Chain Management, Variational Inequality, Outsourcing, Exchange
Rate Risk
1

1. Introduction
Offshore outsourcing refers to the practice of procuring goods or services from outside
foreign suppliers rather than producing them in-house. Since outsourcing manufacturing
to lower-wage countries generally reduces production costs it has been growing rapidly in
the past decade. From 2000 to 2007, 70 percent of U.S. non-oil import growth was driven
by imports from developing countries with imports from China alone accounting for 39
percent of the growth [1]. However, although offshore outsourcing can provide significant cost
reduction opportunities it also exposes supply chain firms to various risks including: foreign
exchange risk, production disruption risk, quality risk, supplier default risk, etc. Among
these risks, foreign exchange risk is consistently considered to be on the list of top concerns
of supply chain executives. For example, a study conducted by The Economist, which
surveyed 500 global company executives with responsibility for risk management, showed
that, in 2009, exchange rate uncertainty was ranked as the second most important risk
factor next to demand uncertainty due to the economic recession. Moreover, the executives
ranked foreign exchange risk as their number one concern for the subsequent twelve months
[2]. In particular, in 2010, the high volatility of the euro and possible appreciation of the
Chinese yuan have posed significant risks to many companies involved in offshore outsourcing
and global trades.
The management of foreign exchange risk of supply chains has drawn considerable atten-
tion from researchers. Huchzermeier and Cohen [3] developed dynamic programming models
to study the value of operational flexibility of global supply chains under exchange rate risk.
Cohen and Huchzermeier [4] further applied a lattice programming model to evaluate the
benefit of supply chain flexibility under exchange risk and demand uncertainty. In particu-
lar, the authors used real option theory to estimate the values of operational flexibility and
managerial flexibility, respectively. Dasu and Li [5] investigated firms’ optimal operating
strategies under foreign exchange risk. That research studied the network of plants located
in different countries, and used linear programming to facilitate the development of the op-
timal policy. Kazaz, Dada, and Moskowitz [6] examined the impact of foreign exchange risk
on the choice of production policies when the allocation decision can be postponed. The
authors modeled the production planning problem as a two-stage recourse program where
both production hedging and allocation hedging strategies are considered.
Goh, Lim, and Meng [7], in turn, developed a stochastic model of the multi-stage global
supply chain network problem where foreign exchange risk, demand and supply risk as well
as disruption risk are considered. The authors also provided a new solution methodology
2

to solve the supply chain network problem with profit maximization and risk minimization
objectives. These studies, however, focused on the optimal decisions of an individual firm
and did not consider the impact of competition on the behaviors of supply chain players.
Nagurney, Cruz, and Matsypura [8], in contrast, proposed a modeling framework to analyze
the dynamics of global supply chains. The authors assumed competitive firms and mod-
eled three tiers of decision-makers: manufacturers, retailers, and consumers and derived a
variational inequality formulation to investigate the global supply chain network, along with
qualitative properties. They utilized projected dynamical systems theory to track the evo-
lution of product flows and prices. Subsequently, Nagurney and Matsypura [9] extended the
results to include risk and uncertainty and different speeds of adjustment. Cruz, Nagurney,
and Wakolbinger [10] later integrated social networks with global supply chains with risk
management and explored their co-evolution.
Our paper differs from the above-mentioned studies in that we focus on the impacts of
competition and exchange rate uncertainty on the decision-making of firms with different
risk attitudes. Our model explicitly considers the firms’ optimal pricing, production, and
outsourcing decisions, and studies how the firms with different risk attitudes behave when
competition intensity and exchange rate uncertainty vary, and how such decisions affect their
profits and risks. In particular, we use simulation examples to answer the following: How
do competition intensity and foreign exchange uncertainty affect:
• the offshore-outsourcing decisions of risk-neutral firms and those of risk-averse firms?
• the pricing strategies of risk-neutral firms and those of risk-averse firms?
• the profits of risk-neutral firms and those of risk-averse firms?
• the risks of risk-neutral firms and those of risk-averse firms?
In our paper, we utilize the classic mean-variance framework to model the decision makers’
behaviors. We assume that each firm maximizes its expected profit and minimizes its risk
where the risk is proxied by the variance of the profit. We allow each firm to assign different
weights to the variance term in its objective function to reflect different risk-aversion levels
of the firms.
The mean-variance (MV) framework, which was originally introduced in the seminal
work of the Nobel laureate Harry Markowitz, provides an intuitive and practical approach
to analyze the risk-return tradeoff, and has become one of the pillars of modern finance
theory. The MV approach has also been increasingly used in supply chain management
3

studies to model the behaviors of decision-makers under risk and uncertainty. Lau [11] first
examined the optimal order quantity that maximized an objective function consisting of
both the profit and standard deviation of the profit for the newsvendor problem. Hodder
[12], Hodder and Jucker [13, 14], and Hodder and Dincer [15] also used an MV method to
study facility location problems under risk and uncertainty. Lau and Lau [16] studied a
two-echelon supply chain where both the manufacturer and the retailer analyzed the return
policy under the MV framework. Chen and Federgruen [17], on the other hand, assumed
a quadratic utility function and utilized MV analysis to construct the efficient frontier of a
single echelon inventory problem. Gan, Sethi, and Yan [18, 19] first investigated a supply
chain coordination problem using the MV approach. The MV approach has also been utilized
to study the newsvendor problem where the decision-maker was assumed to be risk-averse
[20, 21]. Kim, Cohen, and Netessine [22] studied performance-based contracting in after-sale
supply chains where the decision makers behaved under the MV assumption. Choi, et al.
[23, 24] also investigated channel coordination problems and return policies of supply chains
using the MV approach. Choi and Chow [25] analyzed the quick response program in fashion
supply chains via a mean-variance method. Tsay [26] investigated how risk-sensitivity affects
the manufacturer-retailer relationship under various scenarios of strategic power, and how
these dynamics are influenced by a manufacturer return policy. Wei and Choi [27] studied
the wholesale pricing and profit sharing scheme in supply chains using a mean-variance
approach. For additional research that analyzed risk-averse supply chain decision-makers
using the MV framework as well as other risk measures, see [28, 29, 30, 31, 32, 33]. For
a variational inequality approach for the assessment of multitiered supply chain network
supply side and demand side risk, in the presence of electronic commerce and general risk
functions, see Nagurney et al. [34].
This paper is organized as follows: In Section 2, we develop the supply chain model under
foreign exchange risk and competition. We model the decision-makers with different risk
attitudes, and construct the equilibrium conditions, along with the variational inequality
formulation. In Section 3, we provide the model’s qualitative properties, and propose a
computational procedure.
In Section 4, we present a series of simulation examples to study the impacts of competi-
tion intensity and foreign exchange risk on supply chain firms with different risk attitudes.
Our results suggest that executives first evaluate the levels of risks that their investors can
tolerate before making supply chain decisions since risk-aversion levels may lead to com-
pletely different pricing, production, and outsourcing decisions, and result in different levels
of profit and risk. For example, our simulation results indicate that in general risk-averse
4
firms have lower profitability and lower risk than risk-neutral firms. When the competition
intensity increases, the risks of both risk-neutral and risk-averse firms will increase which is
consistent with the recent empirical findings in [35]; the profits of risk-averse firms will always
decrease; and the profits of risk-neutral firms will decrease if exchange rate uncertainty is
relatively low and will increase if exchange rate uncertainty is high. On the other hand, when
exchange rate volatility increases, the average profits of risk-neutral firms will first increase
and then become stable, while the profits of risk-averse firms will always decrease. Moreover,
as the exchange rate variability becomes higher risk-averse firms will reduce their outsourc-
ing activities while risk-neutral firms may increase their outsourcing activities. These results
explain the phenomenon regarding how exchange rate uncertainty affects imports of devel-
oped countries [36, 37, 38, 39]. Section 5 highlights the managerial insights and concludes
the paper.
2. The Supply Chain Model Under Foreign Exchange Risk and Competition
The model that we develop in this paper is based on variational inequality theory. Recall
that the finite-dimensional variational inequality problem, VI(F,K), is to determine a vector
X∗ ∈ K ⊂ Rn, such that
〈F (X∗)T , X −X∗〉 ≥ 0, ∀X ∈ K, (1)
where F is a given continuous function from K to Rn, K is a given closed convex set, and
< ·, · > denotes the inner product in n-dimensional Euclidian space.
The variational inequality formulation allows for a unified treatment of equilibrium and
optimization problems, and is closely related to many mathematical problems, such as:
constrained and unconstrained optimization problems, fixed point problems, and comple-
mentarity problems. For an introduction to finite-dimensional variational inequality theory,
we refer the reader to the book by Nagurney [40].
Variational inequality models provide a great level of flexibility which allows one to model
complex network equilibrium problems in supply chain, transportation, and finance (see, for
example, [41, 42, 43]). Moreover, when system-wide data is available the model proposed in
this paper can be directly applied to perform large-scale empirical research. For instance,
Liu and Nagurney [44] conducted a large-scale empirical study for the New England fuel and
electric power supply chain network based on a variational inequality model extended from
the work in Matasypura et al. [45] and Nagurney et al. [46].
5

We now develop the supply chain model that focuses on the impact of exchange rate
risk and competition. We consider M firms that sell partially substitutable products in the
market of a developed country (e.g. the U.S. market), and have choices of manufacturing the
products in-house and/or outsourcing the manufacturing to suppliers in up to J countries.
Producing the products in-house will require K raw materials and vendor-supplied parts. We
assume that each firm can decide the product price, the outsourced quantities, and the in-
house production quantity. The notation of the model is defined in Table 1. An equilibrium
solution is denoted by “∗”. All vectors are assumed to be column vectors, except where
noted otherwise.
Multi-Criteria Decision-Making Behavior of the Supply Chain Firms and Their
Optimality Conditions
The firms produce partially substitutable products and compete in the market of a de-
veloped country (e.g. the U.S. market). Each firm decides the product price, the in-house
production quantity, the material procurements, and the offshore outsourced quantities. We
assume that the firms consider both profits and risks in their operations, where firm m’s
total cost at country j (in country j’s currency), Smj, can be expressed as:
Smj =K∑
k=1
ckjumkj + hmjvmj +K∑
k=1
t1kjumkj + t2jvmj. (2)
where the first, second, third, and fourth terms in (2) represent the material procurement
cost, the purchasing cost of finished products, the transportation cost of materials and
vendor-supplied parts, and the transportation cost of finished products, respectively. We
group the Smjs over all countries into the vector Sm.
The expected total profit (in U.S. dollars) of firm m can, hence, be expressed as follows:
Profitm = pmdm(P )−K∑
k=1
ckumk − hmqm −J∑
j=1
θjSmj, (3)
where the first term in (3) represents the total revenue from the market; the second and
third terms represent the domestic material procurement cost and the in-house production
cost, respectively; the last term represents the expected cost incurred in other countries.
In addition, the firms consider exchange rate risk induced by offshore outsourcing activi-
ties using a mean-variance framework. In particular, if we calculate the variance of firm m’s
6

profit, since the revenue and cost in U.S. dollars are not subject to exchange rate uncertainty
the variance of the profit is equal to the variance of the total cost incurred in other countries,
which can be expressed as: rm(Um, Vm) = STmCOVθSm, where COVθ denotes the covariance
matrix of exchange rates.
The optimization problem faced by firm m is:
MAXpm,Um,Um,Vm,qmpmdm(P )−
K∑k=1
ckumk − hmqm −J∑
j=1
θjSmj − βmSTmCOVθSm, (4)
subject to:J∑
j=1
umkj + umk = wmkqm, k = 1, . . . , K; (5)
qm ≤ CAPm; (6)
dm(P ) = qm +J∑
j=1
vmj; (7)
dm(P ) = a− (1 + γ)pm +γ
(M − 1)
∑n6=m
pn, (8)
pm ≥ 0, umkj ≥ 0, umk ≥ 0, vmj ≥ 0, qm ≥ 0, j = 1, . . . , J ; k = 1, . . . , K. (9)
Note that βm in the objective function reflects the risk-aversion level of the firm. If βm is
equal to zero firm m is risk-neutral and is not concerned about risk. Constraint (5) models
the conversion from raw materials to finished goods at the firm’s in-house production facility.
Constraint (6) is the production capacity constraint. Constraint (7) states that the demand
is satisfied by outsourced productions and in-house productions. Constraint (8) models the
demand for firm m’s product under competition where γ represents the substitutability of
the products which indicates the competition intensity between the firms. The same form
of demand functions has been widely used in supply chain and marketing studies to model
the demands for partially substitutable products (see, for example, [47, 48]).
Note that, the higher the γ, the higher the competition intensity, and that if γ is zero, the
firms’ products are completely differentiated and there is no competition. We can generalize
the model by specifying a parameter, γm1m2 , for any pair of firms m1 and m2. However, since
the focus of this paper is to study the general impacts of the overall competition level on
supply chains under exchange rate risk, we use a single γ to represent the general competition
intensity of the industry to keep the model simpler and more focused. Moreover, as pointed
7

out by Li and Zhang [48], the total demand, Ma−∑M
m=1 pm, does not depend on γ directly,
which keeps the market potential unchanged for different values of γ. Note that we can
simplify the constraint set by combining constraints (7) and (8), which yields:
a− (1 + γ)pm +γ
(M − 1)
∑n6=m
pn = qm +J∑
j=1
vmj; (10)
We assume that the firms compete in a noncooperative manner in the sense of Nash [49,
50]. The optimality conditions for all firms simultaneously, under the above assumptions,
can be expressed using the variational inequality formulation in Theorem 1.
Theorem 1: Variational Inequality Formulation of the Supply Chain Equilibrium
Under Exchange Rate Risk and Competition
The equilibrium conditions governing the supply chain under exchange rate risk and compe-
tition coincide with the solution of the variational inequality given by:
determine (P ∗, U∗, U∗, V ∗, Q∗) ∈ K1 satisfying
M∑m=1
[2(1 + γ)p∗m − a− γ
(M − 1)
∑n6=m
p∗n
]× [pm − p∗m]
+M∑
m=1
K∑k=1
J∑j=1
[θjckj + θjt
1kj + βm
∂rm(U∗, V ∗)
∂umkj
]× [umkj − u∗mkj]
+M∑
m=1
K∑k=1
ck × [umk − u∗mk]
+M∑
m=1
J∑j=1
[θjhmj + θjt
2j + βm
∂rm(U∗, V ∗)
∂vmj
]× [vmj − v∗mj]
+M∑
m=1
hm × [qm − q∗m] ≥ 0, ∀(P, U, U , V, Q) ∈ K1, (11)
where K1 ≡ (P, U, U , V, Q)|(P, U, U , V, Q) ∈ RM+MKJ+MK+MJ+M+ and (5), (6), and (10) hold.
Proof: The formulation is developed using the standard variational inequality theory (see
[40, 51, 52, 53]). Note that we have substituted the demand function (8) into the objective
function.
8
Remark
Note that, in the above model, we allowed each firm to consider exchange rate risk in decision-
making depending on its degree of risk aversion denoted by βm; m = 1, . . . ,M . We will use
numerical examples to compare how risk-averse firms and risk-neutral firms make supply
chain decisions under competition and foreign exchange risk.
The variational inequality problem (11) can be rewritten in standard form as follows:
determine X∗ ∈ K satisfying
⟨F (X∗)T , X −X∗⟩ ≥ 0, ∀X ∈ K, (12)
where X ≡ (P, U, U , V, Q)T , K ≡ K1, and
F (X) ≡ (F Pm , FU
mkj, FUmk, F
Vmj, F
Qm), (13)
with indices m = 1, . . . ,M ; k = 1, . . . , K; and j = 1, . . . , J , and the functional terms
preceding the multiplication signs in (11), respectively. Here < ·, · > denotes the inner
product in Ω-dimensional Euclidian space where Ω = M + MKJ + MK + MJ + M .
3. Qualitative Properties and the Computational Method
In this Section, we derive qualitative properties of the solution and the function that
enters the variational inequality problem of concern. In addition, for the sake of convenience
for the reader, we also provide the computational method.
3.1 Qualitative Properties
We now present some qualitative properties of the model. In particular, we provide
conditions for existence of a solution to variational inequality (11). We also show that, in
our model, the F (X) given by (13) that enters the variational inequality (12) is monotone,
and the Jacobian of F (X) is positive semidefinite.
Theorem 2: Existence
There exists a solution to variational inequality (11).
Proof: We first prove that the feasible set is compact. Since all variables are nonnegative,
the lower bounds of the variables are zero. The in-house production quantities, qms, are
directly bounded by the production capacities, which means that the domestic and global
procurements of materials, ums and umjs, are also bounded due to constraint (5).
9

We now show that the prices, pms, are also bounded by the set of the constraints. First, we
sum up constraint (10) over all firms, and we obtain that the total demand of all firms, Ma−∑Mm=1 pm, is equal to the sum of all firms’ in-house production quantities and outsourcing
quantities,∑M
m=1 qm +∑J
j=1 vmj. Since the qms and vmjs are nonnegative, the total demand,
Ma−∑M
m=1 pm, must be nonnegative, which implies that all pms are bounded by Ma. On the
other hand, since all pms are nonnegative, Ma−∑M
m=1 pm is less than or equal to Ma, which
implies that all qms and vmjs are bounded by Ma. Therefore, the feasible set is compact.
Since the feasible set K1 is compact and nonempty, and the functions that comprise
F (X) are continuous, according to the standard theory, variational inequality (11) admits a
solution (see [40, 54]). Q.E.D.
Theorem 3: Monotonicity
The vector F (X) that enters the variational inequality (12) as expressed in (11) is monotone,
that is, ⟨(F (X ′)− F (X ′′))T , X ′ −X ′′⟩ ≥ 0, ∀X ′, X ′′ ∈ K, X ′ 6= X ′′. (14)
Proof: See the Appendix.
3.2 The Computational Method
We now consider the computation of solutions to variational inequality (11). In particular,
we recall the modified projection method (cf. [40, 55]). The method converges to a solution
of the model provided that F (X) is monotone and Lipschitz continuous, and a solution
exists, which is the case for our model. Next, we present the modified projection method.
The Computational Procedure
Step 0: Initialization
Start with an X0 ∈ K and select ω, such that 0 < ω ≤ 1L, where L is the Lipschitz constant
for function F (X). Let T = 1.
Step 1: Construction and Computation
Compute XT −1 by solving the variational inequality subproblem:
⟨(XT −1 + (ωF (XT −1)−XT −1))T , X ′ − XT −1
⟩≥ 0, ∀X ′ ∈ K. (15)
10

Step 2: Adaptation
Compute XT by solving the variational inequality subproblem:
⟨(XT + (ωF (XT −1)−XT −1))T , X ′ −XT ⟩
≥ 0, ∀X ′ ∈ K. (16)
Step 3: Convergence Verification
If ||XT − XT −1||∞ ≤ ε with ε > 0, a pre-specified tolerance, then stop; otherwise, set
T := T + 1 and go to Step 1. (We set the parameter ω = 0.1 and the tolerance ε = 0.00001
for all computations of the numerical examples in Section 4.)
Note that the subproblems in Steps 1 and 2 above are separable quadratic program-
ming problems and, hence, there are numerous algorithms that can be used to solve these
embedded subproblems.
4. Simulation Examples
In this section we study the impacts of foreign exchange uncertainty and competition
intensity on the decision-making of the supply chain firms with different risk attitudes. In
particular, we utilize a series of simulation examples to answer the questions raised in the
Introduction.
We answer questions 1 and 2 by comparing the pricing and outsourcing strategies of
risk-neutral and risk-averse firms under exchange rate uncertainty and competition in the
examples. We then answer questions 3 and 4 by discussing the consequences of the firms’
strategies in the examples.
In order to present detailed results we keep the supply chain network in the example
simple and focused. In particular, the supply chain consists of two supply chain firms
(M=2), one offshore-outsourcing country (J=1), and one raw material (K=1). Since this
paper focuses on the impacts of competition intensity and foreign exchange uncertainty on
the decision-making of supply chain players with different risk attitudes, in the examples we
assume that one firm is risk-neutral (β1 = 0) and the other firm is risk-averse (β2 = 0.25).
We also control the other firm-specific factors where we assume that all firms have the same
cost and production parameters. The parameters are specified in Table 2.
We set the values of various cost parameters based on the recent PRTM global supply
chain trends study which surveyed three hundred international firms, and reported relative
11

savings in total costs, labor costs, material costs, and other costs due to offshore-outsourcing
[56]. The cost parameters are also consistent with the cost reduction information of a typical
labor-intensive industry studied in [57]. Our cost and demand function parameters lead to
12% to 35% price-cost markups across different parameter combinations in the simulation
results, which is consistent with the average markups of the manufacturing industries in
various countries [58,59,60]. Based on the exchange rate volatilities in several normal and
crisis periods [61], we assume that the exchange rate variance, σ2, varies from 0 to 0.07 where
σ2 =0 and 0.005 represents low exchange variability; σ2 =0.01 and 0.03 represents medium
exchange rate uncertainty; and σ2 =0.05 and 0.07 represents high foreign exchange risk.
For each combination of the exchange rate variability σ2 and competition intensity γ, the
firms’ strategic outsourcing and pricing decisions are first determined based on the expected
exchange rate as well as the exchange rate uncertainty. We then estimate the profitabilities
and risks of these decisions by randomly generate a sample 1000 exchange rate values from the
normal distribution where the mean is equal to the expected exchange rate and the variance
is equal to σ2. The profitability and risk measures are calculated based on the generated
sample and the firms’ decisions. We repeat this simulation process for all combinations of
exchange rate uncertainty and competition intensity. The results are shown in Tables 3 to
7.
Before discussing the detailed results we first briefly summarize how Firm 1 and Firm 2
behave under exchange rate uncertainty in the examples. Since Firm 1 is risk-neutral it only
maximizes its profit and is not concerned about the risk. Firm 2, which is risk-averse, has
two strategies to mitigate the impact of increasing exchange rate volatility:
• Strategy 1: To reduce outsourcing quantity and to increase the price of the product
where the incremental price is used to compensate the foreign exchange risk;
• Strategy 2: To use more in-house production and to reduce the outsourcing quantity
to lower the foreign exchange risk.
We find that Firm 2 mainly uses the first strategy when exchange rate uncertainty is
low and mainly relies on the second strategy when the foreign exchange uncertainty is high.
Note that Firm 2 chooses the strategies by optimally balancing between profit and risk.
The decision shift between the two strategies can be observed in the trends of Firm 2’s
outsourcing activities, pricing plans, profitability, and risks.
Table 3 shows the outsourcing decisions of the risk-neutral and risk-averse firms under
exchange rate risk and competition, and answer the first question posted in the Introduction.
12
We can see that the risk-neutral firm’s in-house production is always 0 since it always chooses
the offshore productions to lower costs. The risk-averse firm, on the other hand, only uses
offshore productions when the uncertainty is relatively low, and starts using Strategy 2 to
switch to in-house productions when the exchange rate uncertainty becomes higher. For
example, when the competition intensity is 0.40, the in-house production of the risk-averse
firm remains zero till the exchange rate uncertainty is 0.010 and then start to increase. It is
also interesting to observe the trends of offshore-outsourcing activities of the two firms when
the exchange rate risk increases. The risk-averse firm always reduces its offshore-outsourcing
activities as the exchange rate variability increases since it needs to reduce the risk exposure
when uncertainty becomes higher. The outsourcing activities of the risk-neutral firm, on the
other hand, keep unchanged when the competition intensity is zero. If there is competition
Firm 1’s outsourcing activity level first increases with the exchange rate variability when
the exchange rate variability is low to medium, and then become stable when the exchange
rate variability is high. For example, when the competition intensity is 0.80, the outsourcing
activities of the risk-neutral firm increase from 4.821 to 5.347 as the exchange rate variability
increases from 0.000 to 0.030, and remain 5.347 when the variability becomes higher. The
reason is that when the exchange uncertainty is low or medium, the risk-averse firm will
reduce its outsourcing level which will also reduce it’s total supply to the market. This
supply reduction from the risk-averse firm provides opportunities for the risk-neutral firm
to sell more products, and increase its markets share. Therefore, in order to provide more
products to the market, the risk-neutral firm increases its offshore-outsourcing activities.
When the exchange rate variability is high, the risk-averse uses the second strategy where
it keeps the total market supply unchanged, and starts to switch to in-house productions.
Hence, the opportunity for the risk-neutral firm disappears and its outsourcing activity
becomes stable.
In summary when the exchange rate variability increases, the outsourcing activities of
the risk-averse firm always decrease while the outsourcing activities of the risk-neutral firm
are always nondecreasing, and will increase when the exchange risk is low to medium.
These simulation results provide explanations to phenomenons of import activities of de-
veloped countries under exchange risk. Since risk-aversion is the prevalent decision-making
behavior in business and economics we expect that in most cases increasing exchange rate
variability should reduce overall offshore-outsourcing activities. For example, various em-
pirical studies found that rising exchange rate variability significantly reduces imports in
U.S., U.K., and European Union (see, for example, [36,37,38]). However, our results also
indicate that in certain circumstances or periods if there are more decision-makers who are
13

relatively risk insensitive, the offshore-outsourcing activities may not be greatly affected by
the increase of exchange rate uncertainty. Indeed, some empirical studies reported weak
impacts of exchange rate volatility on imports to developed countries [39].
Table 4 presents the pricing strategies, the average costs of the product, and the price-cost
markups, and answers the second question raised in the Introduction. First, the markups
of the two firms across different scenarios range from 12% to 35%, which is consistent with
the reported average markups of the manufacturing industries in different countries (see, for
example, [58,59,60]).
From Table 4, we observe that at each exchange rate variability level, for both risk-
neutral and risk-averse firms the market prices and the markups consistently decrease as the
competition intensity increases. For example, if the exchange rate variability is 0.010 when
the competition intensity increases from 0.00 to 2.00 the markup of the risk-neutral declines
from 30.00% to 17.20%, and the markup of the risk-averse firm decreases from 34.90% to
21.56%. This indicates that higher competition intensity leads to lower profit margins for
both firms at all uncertainty levels.
The results also show that as the exchange rate uncertainty becomes higher the prices in
general do not respond significantly. We can see that only when the exchange rate variability
is from low to medium the product prices slightly increase with the exchange uncertainty.
Such marginal increase is due to the fact the risk-averse firm uses the first strategy to cope
with the risk.
Table 5 and 6 compare the average profitabilities of the two firms in different scenarios,
and answer the third question posed in the Introduction. In particular, Table 5 shows the
average profits as well as the 95% confidence interval for the average profit estimations. For
example, if the competition intensity is 0.80 and the exchange rate variability is 0.010, the
point estimate of the average profit of the risk-neutral firm is 14.582, and the probability
that the true average profit is between the lower limit, 14.196, and the upper limit, 14.969,
is 95%.
We can see that when the exchange rate uncertainty is zero, the two firms’s profits
are equal and certain since they make identical decisions. However, when the exchange
rate variability is non-zero, the risk-neutral firm always has a significantly higher average
profit than the risk-averse firm except when the competition is 0.00 and the exchange rate
variability is less than or equal to 0.030.
The rightmost column of Table 5 shows the sensitivity (regression slope) of the average
14

profits to the competition intensity. It is interesting to see that all the slopes in Panel 2 of
Table 5 are significantly negative which imply that the competition intensity always has a
significantly negative impact on the risk-averse firm’s average profit at all uncertainty levels.
On the other hand, in Panel 1 of Table 5 the slope is significantly negative (-1.83 and
-0.88) when the exchange rate variability is less than or equal to 0.005, is insignificant when
the variability is equal to 0.010, and is significantly positive when the variability is greater
than or equal to 0.030 (1.08, 1.53, and 1.43). The signs and the significance of the slopes
imply that the average profit of the risk-neutral firm is significantly negatively influenced by
the competition intensity when the exchange rate variability is low while it is significantly
positively affected by the competition when the exchange uncertainty is high.
Such results indicate that the risk-averse firm should always benefit from more product
differentiation while the risk-neutral firm may benefit from more intense competition when
the exchange rate uncertainty is high. The intuition is that if the exchange rate variability
is large, when the products are less differentiated the risk-neutral firm may be able to take
more advantage of the risk-averse firm’s declining total production to get more market share
and more profits.
From Table 5, we can also observe trends of the average profits of the two firms when the
exchange uncertainty increases. We can easily see that the risk-averse firm’s profit always
decreases as the exchange uncertainty rises. We can also observe that if the competition
intensity is non-zero the profit of the risk-neutral firm will increase with the exchange rate
variability when the uncertainty is less than 0.050, and will not change significantly when
the uncertainty is greater than or equal to 0.050.
Franke [62] used a real option approach to argue that higher exchange rate volatility may
present profit opportunities for risk-neutral exporters. Our results in Table 5 show that
risk-insensitive importing firms may also benefit from higher exchange rate uncertainty due
to the competition with more risk-averse firms.
Table 6 exhibits the probability that the risk-neutral firm has higher profit than the
risk-averse firm as well as the 95% confidence interval for the probability estimations. For
example, when the competition intensity is 0.40 and the exchange variability is 0.070, the
point estimate of the probability that the risk-neutral firm has higher profitability is 70.40%,
and with 95% chance, the true probability is between 67.57% and 73.23%.
Similar to Table 5, the results in Table 6 show that the risk-neutral firm has significantly
higher probability to obtain more profit than the risk-averse firm across all combinations of
15
exchange rate variability and competition intensity. The point estimate of the probability
ranges from 66% to 93%.
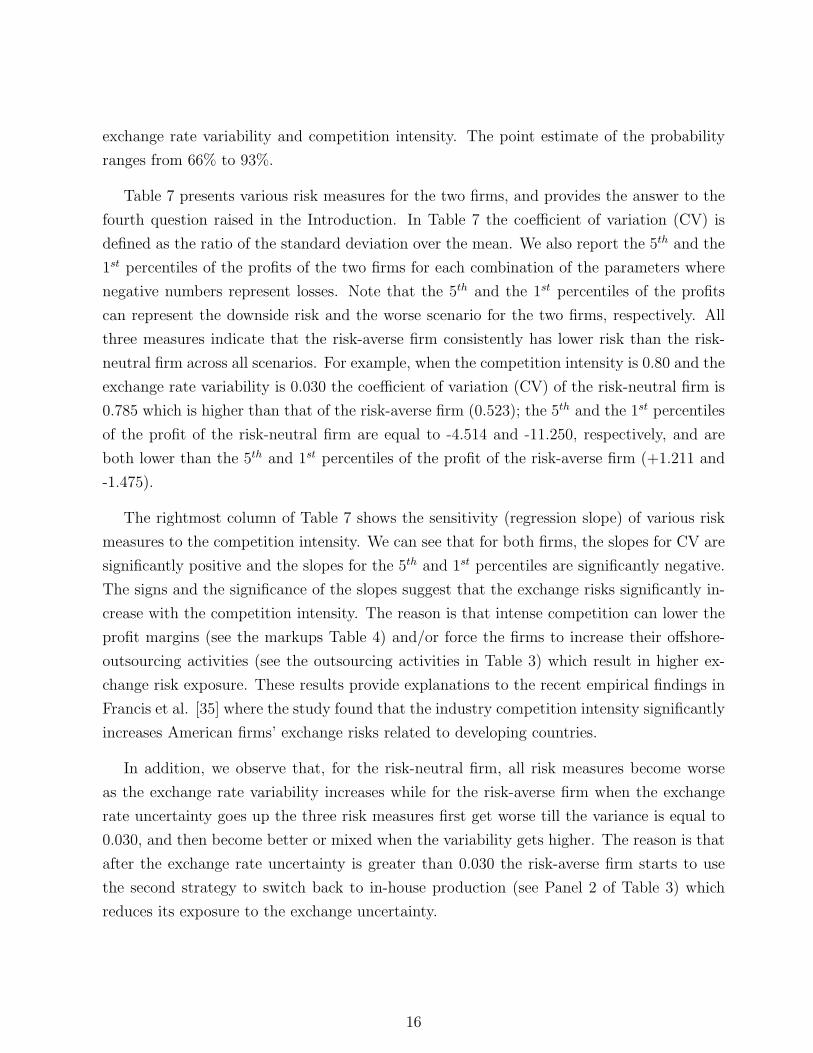
Table 7 presents various risk measures for the two firms, and provides the answer to the
fourth question raised in the Introduction. In Table 7 the coefficient of variation (CV) is
defined as the ratio of the standard deviation over the mean. We also report the 5th and the
1st percentiles of the profits of the two firms for each combination of the parameters where
negative numbers represent losses. Note that the 5th and the 1st percentiles of the profits
can represent the downside risk and the worse scenario for the two firms, respectively. All
three measures indicate that the risk-averse firm consistently has lower risk than the risk-
neutral firm across all scenarios. For example, when the competition intensity is 0.80 and the
exchange rate variability is 0.030 the coefficient of variation (CV) of the risk-neutral firm is
0.785 which is higher than that of the risk-averse firm (0.523); the 5th and the 1st percentiles
of the profit of the risk-neutral firm are equal to -4.514 and -11.250, respectively, and are
both lower than the 5th and 1st percentiles of the profit of the risk-averse firm (+1.211 and
-1.475).
The rightmost column of Table 7 shows the sensitivity (regression slope) of various risk
measures to the competition intensity. We can see that for both firms, the slopes for CV are
significantly positive and the slopes for the 5th and 1st percentiles are significantly negative.
The signs and the significance of the slopes suggest that the exchange risks significantly in-
crease with the competition intensity. The reason is that intense competition can lower the
profit margins (see the markups Table 4) and/or force the firms to increase their offshore-
outsourcing activities (see the outsourcing activities in Table 3) which result in higher ex-
change risk exposure. These results provide explanations to the recent empirical findings in
Francis et al. [35] where the study found that the industry competition intensity significantly
increases American firms’ exchange risks related to developing countries.
In addition, we observe that, for the risk-neutral firm, all risk measures become worse
as the exchange rate variability increases while for the risk-averse firm when the exchange
rate uncertainty goes up the three risk measures first get worse till the variance is equal to
0.030, and then become better or mixed when the variability gets higher. The reason is that
after the exchange rate uncertainty is greater than 0.030 the risk-averse firm starts to use
the second strategy to switch back to in-house production (see Panel 2 of Table 3) which
reduces its exposure to the exchange uncertainty.
16

5. Managerial Insights and Conclusions
This paper studied the impact of foreign exchange rate uncertainty and competition inten-
sity on supply chain firms who are involved in offshore outsourcing activities. In particular,
we developed a variational inequality model that considers firms’ decision-making regarding
pricing, material procurement, offshore-outsourcing, transportation, and in-house produc-
tion under competition and foreign exchange rate uncertainty. Our model also allowed the
firms to have different attitudes toward risk. We provided important qualitative properties
for the model and presented an algorithm that was guaranteed to converge. We then utilized
a series of simulation examples to answer four interesting questions regarding supply chain
firms’ pricing and outsourcing decisions, and the associated profits and risks.
In summary, our simulation results indicate that in general the risk-averse firm has lower
profitability and lower risk than the risk-neutral firm. When the competition intensity
increases, the exchange rate risks of both risk-neutral and risk-averse firms will increase
which is consistent with the recent empirical findings in [35]; the profit of the risk-averse
firm will always decrease; and the profits of the risk-neutral firm will decrease if exchange
rate uncertainty is relatively low and will increase if exchange rate uncertainty is high. On
the other hand, when exchange rate volatility increases, the average profit of the risk-neutral
firm will first increase and then become stable while the profits of risk-averse firms will always
decrease. As exchange rate variability increases, the risk of the risk-neutral firm will always
increase, and the risk of the risk-averse firm will increase when the firm increase prices to
compensate the risks, and will decrease if the firm switches from outsourcing to in-house
production. Moreover, as the exchange rate variability becomes higher the risk-averse firm
will reduce its outsourcing activities while the risk-neutral firm may increase its outsourcing
activities. These results explain the phenomenon regarding how exchange rate uncertainty
affects imports of developed countries [36,37,38,39].
Our results reveal important managerial insights for supply chain decision-makers in-
volved in offshore outsourcing. The supply chain managers should first evaluate the risk
tolerance level of the firm. If the firm is more concerned about risk they should try to dif-
ferentiate their products from their competitors since intense competition will both reduce
their profitability and increase their risk. In addition, they should also maintain certain
in-house production capacity for operational hedging purposes when the exchange rate un-
certainty is high. For the firms that are not sensitive to risk high exchange rate uncertainty
may provide opportunity for them to get an edge on the competition with more risk-averse
firms. For example, when the exchange rate variability is relatively high they should expand
17

their outsourcing operations in order to gain more market share from more risk-sensitive
competitors which may help them increase average profits. However, the firms that exploit
these opportunities should understand that such strategies can also cause significant risk and
loss.
This research can be extended in several directions. First, the model can be directly ap-
plied for large-scale empirical studies when system-wide data is available (see, for example,
[44]). Secondly, the model can further incorporate supply disruption risk and demand uncer-
tainty to study how these risks interact with exchange rate risk and affect decision-making
in supply chains. Additionally, we can expand our model to consider and compare the
decision-making of the supply chain firms based on different risk measures (see, for example,
[63]).
Acknowledgments: The authors thank the Editor, the Area Editor, the Associate Editor,
and the two anonymous reviewers for their helpful comments and suggestions.
18

References
[1] Houseman, S.N. Measuring offshore outsourcing and offshoring. Employment Research
2009;16:1-3.
[2] The Economist Intelligence Unit. Managing supply-chain risk for reward, 2009.
[3] Huchzermeier, A., Cohen, M. Valuing operational flexibility under exchange rate risk.
Operations Research 1996;44:100-13.
[4] Cohen, M.A., Huchzermeier, A. Global supply chain network management under price/exchange
rate risk and demand uncertainty. In: Muffato, M., Paswar, K.S., editors. Logistics in the
Information Age. SGE Ditorali, 1999, p. 219-34.
[5] Dasu, S., Li, L. Optimal operating policies in the presence of exchange rate variability.
Management Science 1997;43:705-22.
[6] Kazaz, B., Dada, M., Moskowitz, H. Global production planning under exchange-rate
uncertainty. Management Science 2005;51;1101-19.
[7] Goh, M., Lim, J.Y.S., Meng, F. A stochastic model for risk management in global supply
chain networks. European Journal of Operational Research 2007;182:16473.
[8] Nagurney, A., Cruz, J., Matsypura, D. Dynamics of global supply chain supernetworks.
Mathematical and Computer Modelling 2003;37:963-83.
[9] Nagurney, A., Matsypura, D. Global supply chain network dynamics with multicriteria
decision-making under risk and uncertainty. Transportation Research Part E 2005;41:585-
612.
[10] Cruz, J.M., Nagurney, A., Wakolbinger, T. Financial engineering of the integration of
global supply chain networks and social networks with risk management. Naval Research
Logistics 2006;53:674-96.
[11] Lau, H.S. The newsboy problem under alternative optimization objectives. Journal of
the Operational Research Society 1980;31:525-35.
[12] Hodder, J.E. Financial market approaches to facility location under uncertainty. Oper-
ations Research 1984;32:1374-80.
[13] Hodder, J.E., Jucker, J.V. International plant location under price and exchange rate
uncertainty. Engineering and Production Economy 1985;9:225-29.
19

[14] Hodder, J.E., Jucker, J.V. A simple plant-location model for quantity-setting firms
subject to price uncertainty. European Journal of Operational Research 1985;21:39-46.
[15] Hodder, J.E., Dincer, M.C., A multifactor model for international plant location and
financing under uncertainty. Computer and Operations Research 1986;13:601-609.
[16] Lau, H.S., Lau, A.H.L. Manufacturer’s pricing strategy and returns policy for a single-
period commodity. European Journal of Operational Research 1999;116:291-304.
[17] Chen, F., Federgruen, A. Mean-variance analysis of basic inventory models. Working
paper, Columbia Business School, Columbia University, New York, 2000.
[18] Gan, X., Sethi, S.P., Yan, H. Coordination of supply chains with Risk-Averse Agents.
Production and Operations Management 2004;13:135-49.
[19] Gan, X., Sethi, S., Yan, H. Channel coordination with a risk-neutral supplier and a
downside risk-averse retailer. Production and Operations Management 2005;14:8089.
[20] Choi, T.M., Li, D., Yan, H. Newsvendor problems with mean-variance objectives. In:
The Proceedings of the 5th International Conference on Optimization: Techniques and Ap-
plications, 2001, p. 1860-1870.
[21] Wu, J., Li, J., Wang, S., Cheng, T.C.E. Mean-variance analysis of the newsvendor model
with stockout cost. Omega 2009;37: 724-30.
[22] Kim, S.H., Cohen, M., Netessine, S. Performance contracting in after-sales service supply
chains. Management Science 2007;53:1843-58.
[23] Choi, T.M., Li, D., Yan, H., Chui, C. Channel coordination in supply chains with agents
having mean-variance objectives. Omega 2008;36:565-76.
[24] Choi, T.M., Li, D., Yan, H. Mean-variance analysis of a single supplier and retailer supply
chain under a returns policy. European Journal of Operational Research 2008;184:356-76.
[25] Choi, T.M., Chow, P.S. Mean-variance analysis of quick response program. International
Journal of Production Economics 2008;114:456-75.
[26] Tsay, A.A. Risk sensitivity in distribution channel partnerships: implications for man-
ufacturer return policies. Journal of Retailing 2002;78:147-60.
[27] Wei, Y., Choi, T.M.. Mean-variance analysis of supply chains under wholesale pricing
and profit sharing scheme. European Journal of Operational Research 2010;204:255-62.
20

[28] Tomlin, B., On the value of mitigation and contingency strategies for managing supply
chain disruption risks. Management Science 2006;52:639-57.
[29] Martinez-de-Albeniz, V., Simchi-Levi, D. Mean-variance trade-offs in supply contracts.
Naval Research Logistics 2006;53:603-16.
[30] Lee, T.Y.S. Supply chain risk management. International Journal of Information and
Decision Sciences 2008;1:98-114.
[31] Buzacott, J., Yan, H., Zhang, H. Risk analysis of commitment-option contracts with
forecast updates. Working paper, The Chinese University of Hong Kong, Hong Kong, 2003.
[32] Chahara, K., Taaffe, K. Risk averse demand selection with all-or-nothing orders. Omega
2009;37:996-1006.
[33] Sawik, T. Selection of supply portfolio under disruption risks. Omega 2011;39:194-208.
[34] Nagurney, A., Cruz, J. M., Dong, J., Zhang, D., Supply chain networks, electronic
commerce, and supply side and demand side risk. European Journal of Operational Research
2005; 164:120-142.
[35] Francis, B. B., Hasan, I. Hunter, D., Can hedging tell the full story? Reconciling differ-
ences in United States aggregate-and industry-level exchange rate risk premium. Journal of
Financial Economics 2008;90:169-196.
[36] Arize, A. C. The effects of exchange rate volatility on U.S. Imports: An empirical
investigation. International Economics Journal 1998;12(3):31-40.
[37] Cheong, C. Does the risk of exchange rate fluctuation really affect international trade
flows between countries? Economics Bulletin 2004;6(4):1-8.
[38] Anderton, R., Skundlny, F., Volatility and Euro area imports, European Central Bank
Working Paper No. 64, 2001.
[39] Koray, F., William, D. Real exchange rate volatility and U.S. bilateral trade: A Var
Approach. The Review of Economics and Statistics 1989:71:708-712.
[40] Nagurney, A. Network Economics: A Variational Inequality Approach. Kluwer Aca-
demic Publishers, Dordrecht, The Netherlands, 1999.
[41] Zhang, D. A network economic model for supply chain versus supply chain competition.
Omega 2006;34:283-95.
21
[42] Cruz, J. Dynamics of supply chain networks with corporate social responsibility through
integrated environmental decision-making. European Journal of Operational Research 2008;184:1005-
1031.
[43] Nagurney, A., Ke, K. Financial networks with intermediation: Risk management with
variable weights. European Journal of Operational Research 2006;172:40-63.
[44] Liu, Z., Nagurney, A. An integrated electric power supply chain and fuel market network
framework: Theoretical modeling with empirical analysis for New England. Naval Research
Logistics 2009:56;600-24.
[45] Matsypura, D., Nagurney,A., Liu, Z. Modeling of electric power supply chain networks
with fuel suppliers via variational inequalities, International Journal of Emerging Electric
Power Systems 2007;8:Article 5.
[46] Nagurney, A., Liu, Z., Cojocaru, M., Daniele, P. Dynamic electric power supply chains
and transportation networks: An evolutionary variational inequality formulation. Trans-
portation Research E: Logistics and Transportation Review 2007;43:624-46.
[47] Choi, S.C. Price competition in a duopoly common retailer channel. Journal of Retailing
1996;72:117-34.
[48] Li, L., Zhang, H. Confidentiality and information sharing in supply chain coordination.
Management Science 2008;54: 1467-81.
[49] Nash, J. F. Equilibrium points in n-person games, Proceedings of the National Academy
of Sciences 1950;36:48-49.
[50] Nash, J. F. Noncooperative games. Annals of Mathematics 1951;54:286-98.
[51] Gabay, D., Moulin, H. On the uniqueness and stability of Nash equilibria in noncoop-
erative games. In: Bensoussan, A., Kleindorfer, P., and Tapiero, C. S., editors. Applied
Stochastic Control in Econometrics and Management Science. Amsterdam, The Nether-
lands: North-Holland; 1980, p. 271-294.
[52] Bazaraa, M. S., Sherali, H. D., Shetty, C. M. Nonlinear Programming: Theory and
Algorithms. New York:John Wiley & Sons; 1993.
[53] Bertsekas, D. P., Tsitsiklis, J. N. Parallel and Distributed Computation - Numerical
Methods. Englewood Cliffs, New Jersey:Prentice Hall; 1989.
[54] Kinderlehrer, D., Stampacchia, G. An Introduction to Variational Inequalities and Their
22

Applications. New York:Academic Press; 1980.
[55] Korpelevich, G.M. The extragradient method for finding saddle points and other prob-
lems. Matekon 1977;13:35-49.
[56] Cohen, S., Geissbauer R., Bhandari, A., Dheur, M. Sixth annual survey by PRTM
management consultants: Global supply chain trends 2008 - 2010, 2008.
[57] Knutsen, H. M., Environmental practice in the commodity chain: The dyestuff and
tanning industries compared. Review of International Political Economy 2000;7:254-288.
[58] Morrison C. J., The cyclical nature of markups in canadian manufacturing: A production
theory approach, Journal of Applied Econometrics 1994;9:269-82.
[59] Epifani, P., Gancia, G., Trade, markup heterogeneity and misallocations, Institute for
Empirical Research in Economics, University of Zurich, Working Paper, 2010.
[60] Christopoulou, R., Vermeulen, P. Markups in the Euro area and the U.S. over the period
1981 - 2004. European Central Bank Working Paper Series, 2008.
[61] Coudert, V., Couharde, C., Mignon, V. Exchange rate flexibility across financial crises.
Working Papers from CEPII Research Center, 2010.
[62] Franke, G. Exchange rate volatility and international trading strategy. Journal of Inter-
national Money and Finance 1991;10:292-307.
[63] Graves, S. B., Rinquest, J. L. Probabilistic dominance criteria for comparing uncertain
alternatives: A tutorial, Omega 2009;37:346-57.
23

Table 1: Notation for the Supply Chain Model
Notation Definition
umkj The quantity of material/part k purchased by firm m from supply market in coun-
try j. We group all umkjs of firm m into the KJ-dimensional vector Um, and group
all umkjs into the MKJ-dimensional vector U .
umk The quantity of material/part k purchased by firm m from supply market in the
U.S. We group all umks of firm m into the K-dimensional vector Um, and group
all umks into the MK-dimensional vector U .
vmj The quantity of finished products purchased by firm m from country j. We group
all vmjs of firm m into the J-dimensional vector Vm, group all vmjs into the MJ-
dimensional vector V .
qm The quantity of the product produced by firm m in-house. We group all qms into
the M -dimensional vector Q.
pm The price of the product of firm m. We group all qms into the M -dimensional
vector P
dm(P ) The demand function of the product of firm m
ckj The unit purchasing cost of material/part k in country j
ck The unit purchasing cost of material/part k in the U.S.
hmj The unit purchasing cost of the product from suppliers in country j
hm The unit production cost of the product at firm m’s manufacturing plant
t1kj The unit transportation cost of the material/part k from country j
t2j The unit transportation cost of the product from country j
CAPm The capacity of the production facility of firm m
wmk The quantity of material/part k needed to produce one unit of the product at firm
m’s manufacturing plant
θj The expected exchange rate between the U.S. dollar and the currency of country
j
COVθ The covariance matrix of the exchange rates between the U.S. dollar and the other
countries’ currencies
βm Firm m’s degree of risk aversion
γ The competition intensity level
24
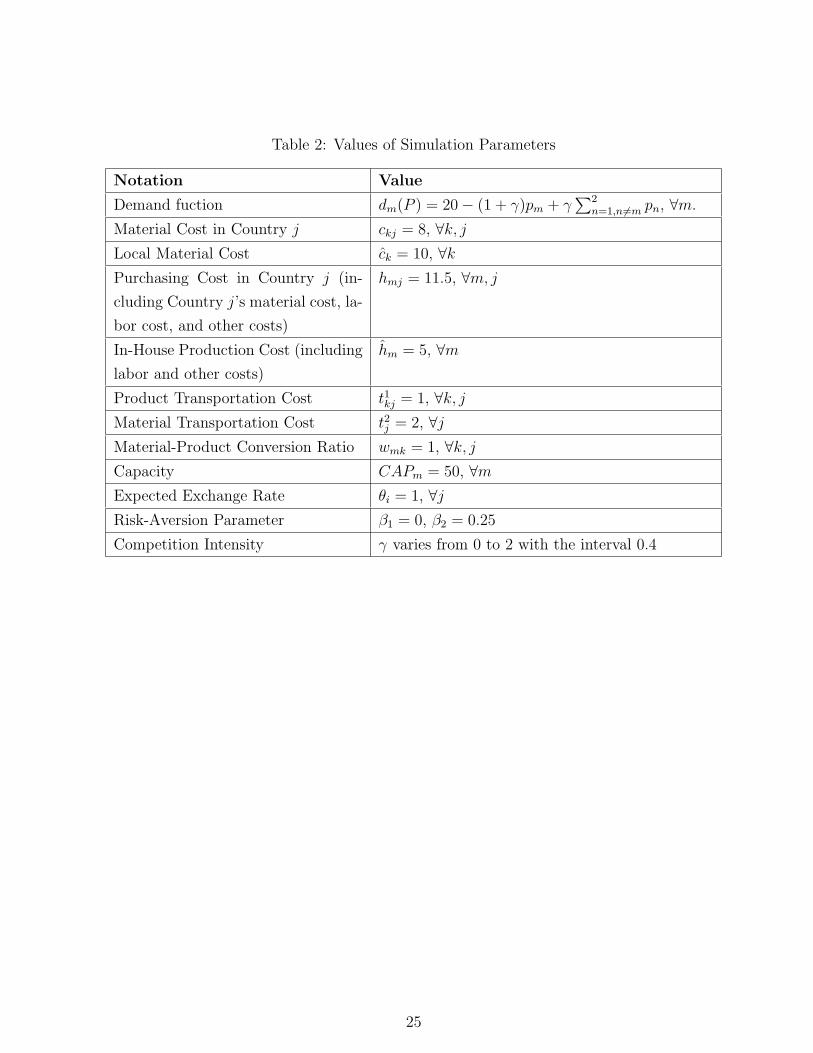
Table 2: Values of Simulation Parameters
Notation Value
Demand fuction dm(P ) = 20− (1 + γ)pm + γ∑2
n=1,n6=m pn, ∀m.
Material Cost in Country j ckj = 8, ∀k, j
Local Material Cost ck = 10, ∀kPurchasing Cost in Country j (in-
cluding Country j’s material cost, la-
bor cost, and other costs)
hmj = 11.5, ∀m, j
In-House Production Cost (including
labor and other costs)
hm = 5, ∀m
Product Transportation Cost t1kj = 1, ∀k, j
Material Transportation Cost t2j = 2, ∀jMaterial-Product Conversion Ratio wmk = 1, ∀k, j
Capacity CAPm = 50, ∀mExpected Exchange Rate θi = 1, ∀jRisk-Aversion Parameter β1 = 0, β2 = 0.25
Competition Intensity γ varies from 0 to 2 with the interval 0.4
25

Table 3: Outsourcing and In-House Production Decisions
Panel 1: Risk-Neutral Firm Competition Intensity
Exchange Rate Variance 0.00 0.40 0.80 1.20 1.60 2.00
0.000Outsourced 3.750 4.375 4.821 5.156 5.417 5.625In-House 0.000 0.000 0.000 0.000 0.000 0.000Total 3.750 4.375 4.821 5.156 5.417 5.625
0.005Outsourced 3.750 4.452 4.991 5.429 5.798 6.117In-House 0.000 0.000 0.000 0.000 0.000 0.000Total 3.750 4.452 4.991 5.429 5.798 6.117
0.010Outsourced 3.750 4.513 5.119 5.624 6.059 6.442In-House 0.000 0.000 0.000 0.000 0.000 0.000Total 3.750 4.513 5.119 5.624 6.059 6.442
0.030Outsourced 3.750 4.630 5.347 5.967 6.521 7.031In-House 0.000 0.000 0.000 0.000 0.000 0.000Total 3.750 4.630 5.347 5.967 6.521 7.031
0.050Outsourced 3.750 4.630 5.347 5.967 6.521 7.031In-House 0.000 0.000 0.000 0.000 0.000 0.000Total 3.750 4.630 5.347 5.967 6.521 7.031
0.070Outsourced 3.750 4.630 5.347 5.967 6.521 7.031In-House 0.000 0.000 0.000 0.000 0.000 0.000Total 3.750 4.630 5.347 5.967 6.521 7.031
Panel 2: Risk-Averse Firm Competition Intensity
Exchange Rate Variance 0.00 0.40 0.80 1.20 1.60 2.00
0.000Outsourced 3.750 4.375 4.821 5.156 5.417 5.625In-House 0.000 0.000 0.000 0.000 0.000 0.000Total 3.750 4.375 4.821 5.156 5.417 5.625
0.005Outsourced 3.416 3.859 4.133 4.306 4.413 4.477In-House 0.000 0.000 0.000 0.000 0.000 0.000Total 3.416 3.859 4.133 4.306 4.413 4.477
0.010Outsourced 3.137 3.451 3.616 3.696 3.724 3.719In-House 0.000 0.000 0.000 0.000 0.000 0.000Total 3.137 3.451 3.616 3.696 3.724 3.719
0.030Outsourced 2.133 2.133 2.133 2.133 2.133 2.133In-House 0.367 0.528 0.555 0.494 0.373 0.210Total 2.500 2.662 2.688 2.627 2.507 2.344
0.050Outsourced 1.280 1.280 1.280 1.280 1.280 1.280In-House 1.220 1.381 1.408 1.347 1.227 1.064Total 2.500 2.662 2.688 2.627 2.507 2.344
0.070Outsourced 0.914 0.914 0.914 0.914 0.914 0.914In-House 1.586 1.747 1.774 1.713 1.592 1.429Total 2.500 2.662 2.688 2.627 2.507 2.344
26

Table 4: Pricing Strategy, Average Costs, and Markups
Panel 1: Risk-Neutral Firm Competition Intensity
Exchange Rate Variance 0.00 0.40 0.80 1.20 1.60 2.00
0.000Price 16.250 15.625 15.179 14.844 14.583 14.375Avg Cost 12.500 12.500 12.500 12.500 12.500 12.500Markup 30.00% 25.00% 21.43% 18.75% 16.67% 15.00%
0.005Price 16.250 15.680 15.273 14.968 14.730 14.539Avg Cost 12.451 12.508 12.560 12.453 12.477 12.513Markup 30.51% 25.36% 21.60% 20.19% 18.05% 16.19%
0.010Price 16.250 15.723 15.344 15.057 14.831 14.647Avg Cost 12.500 12.531 12.495 12.473 12.486 12.498Markup 30.00% 25.48% 22.80% 20.72% 18.77% 17.20%
0.030Price 16.250 15.807 15.471 15.212 15.008 14.844Avg Cost 12.547 12.447 12.660 12.590 12.495 12.526Markup 29.52% 26.99% 22.20% 20.83% 20.12% 18.50%
0.050Price 16.250 15.807 15.471 15.212 15.008 14.844Avg Cost 12.508 12.486 12.386 12.465 12.572 12.281Markup 29.92% 26.60% 24.91% 22.04% 19.38% 20.87%
0.070Price 16.250 15.807 15.471 15.212 15.008 14.844Avg Cost 12.555 12.772 12.554 12.622 12.509 12.491Markup 29.43% 23.76% 23.23% 20.52% 19.97% 18.84%
Panel 2: Risk-Averse Firm Competition Intensity
Exchange Rate Variance 0.00 0.40 0.80 1.20 1.60 2.00
0.000Price 16.250 15.625 15.179 14.844 14.583 14.375Avg Cost 12.500 12.500 12.500 12.500 12.500 12.500Markup 30.00% 25.00% 21.43% 18.75% 16.67% 15.00%
0.005Price 16.584 16.010 15.603 15.298 15.059 14.867Avg Cost 12.452 12.508 12.560 12.453 12.477 12.513Markup 33.18% 28.00% 24.23% 22.85% 20.69% 18.81%
0.010Price 16.863 16.313 15.922 15.624 15.387 15.192Avg Cost 12.500 12.531 12.495 12.473 12.486 12.498Markup 34.90% 30.19% 27.43% 25.26% 23.23% 21.56%
0.030Price 17.500 16.901 16.494 16.194 15.964 15.781Avg Cost 12.906 12.954 13.143 13.043 12.868 12.748Markup 35.59% 30.47% 25.50% 24.16% 24.06% 23.79%
0.050Price 17.500 16.901 16.493 16.194 15.964 15.781Avg Cost 13.724 13.791 13.755 13.765 13.760 13.515Markup 27.52% 22.55% 19.91% 17.65% 16.02% 16.77%
0.070Price 17.500 16.901 16.494 16.194 15.964 15.781Avg Cost 14.106 14.235 14.168 14.173 14.092 14.021Markup 24.06% 18.73% 16.41% 14.26% 13.29% 12.55%
27

Table 5: Profits of the Two Firms
Panel 1: Risk-Neutral Firm Competition Intensity
Exchange Rate Variance 0.00 0.40 0.80 1.20 1.60 2.00 slope
0.000Average 14.064 13.673 12.913 12.086 11.286 10.546 −1.83∗∗∗
Lower Limit 14.064 13.673 12.913 12.086 11.286 10.546Upper Limit 14.064 13.673 12.913 12.086 11.286 10.546
0.005Average 14.245 14.123 13.540 13.652 13.059 12.394 −0.88∗∗∗
Lower Limit 14.030 13.876 13.264 13.361 12.736 12.062Upper Limit 14.460 14.371 13.816 13.943 13.381 12.726
0.010Average 14.063 14.407 14.582 14.532 14.204 13.847 -0.12Lower Limit 13.765 14.056 14.196 14.104 13.737 13.345Upper Limit 14.360 14.758 14.969 14.961 14.671 14.349
0.030Average 13.887 15.557 15.030 15.645 16.391 16.297 1.08∗
Lower Limit 13.388 14.944 14.298 14.851 15.509 15.347Upper Limit 14.386 16.169 15.762 16.440 17.274 17.247
0.050Average 14.032 15.377 16.497 16.389 15.888 18.020 1.53∗
Lower Limit 13.380 14.589 15.546 15.355 14.745 16.826Upper Limit 14.685 16.166 17.447 17.423 17.031 19.214
0.070Average 13.855 14.052 15.596 15.456 16.295 16.546 1.43∗∗
Lower Limit 13.078 13.101 14.498 14.227 14.955 15.125Upper Limit 14.632 15.003 16.693 16.684 17.634 17.966
Panel 2: Risk-Averse Firm Competition Intensity
Exchange Rate Variance 0.00 0.40 0.80 1.20 1.60 2.00 slope
0.000Average 14.064 13.673 12.913 12.086 11.286 10.546 −1.83∗∗∗
Lower Limit 14.064 13.673 12.913 12.086 11.286 10.546Upper Limit 14.064 13.673 12.913 12.086 11.286 10.546
0.005Average 14.116 13.512 12.576 12.25 11.395 10.54 −1.75∗∗∗
Lower Limit 13.920 13.298 12.347 12.019 11.150 10.297Upper Limit 14.312 13.727 12.804 12.481 11.641 10.783
0.010Average 13.686 13.054 12.392 11.646 10.799 10.018 −1.85∗∗∗
Lower Limit 13.437 12.785 12.119 11.364 10.513 9.728Upper Limit 13.935 13.322 12.665 11.927 11.086 10.308
0.030Average 11.484 10.504 9.007 8.278 7.760 7.109 −2.20∗∗∗
Lower Limit 11.200 10.222 8.715 7.994 7.471 6.820Upper Limit 11.768 10.787 9.300 8.562 8.048 7.397
0.050Average 9.440 8.276 7.362 6.382 5.524 5.312 −2.13∗∗∗
Lower Limit 9.217 8.058 7.134 6.160 5.300 5.095Upper Limit 9.662 8.494 7.589 6.603 5.749 5.530
0.070Average 8.485 7.096 6.251 5.311 4.692 4.124 −2.14∗∗∗
Lower Limit 8.296 6.908 6.063 5.122 4.504 3.939Upper Limit 8.675 7.283 6.438 5.499 4.880 4.309
***: p < 0.001; **: p < 0.01; *: p < 0.05 The upper and lower limits are based on 95% confidence interval
28

Table 6: Probability that the Risk-Neutral Firm Has Higher Profit
Competition Intensity
Exchange Rate Variance 0.00 0.40 0.80 1.20 1.60 2.00
0.000Point Estimate N/A N/A N/A N/A N/A N/ALower Limit N/A N/A N/A N/A N/A N/AUpper Limit N/A N/A N/A N/A N/A N/A
0.005Point Estimate 66.30% 86.90% 89.90% 93.40% 90.50% 89.20%Lower Limit 63.37% 84.81% 88.03% 91.86% 88.68% 87.27%Upper Limit 69.23% 88.99% 91.77% 94.94% 92.32% 91.13%
0.010Point Estimate 70.60% 84.30% 89.00% 89.50% 87.00% 85.70%Lower Limit 67.77% 82.04% 87.06% 87.60% 84.91% 83.53%Upper Limit 73.43% 86.56% 90.94% 91.40% 89.09% 87.87%
0.030Point Estimate 76.00% 82.60% 79.60% 81.20% 80.50% 81.40%Lower Limit 73.35% 80.25% 77.10% 78.78% 78.04% 78.99%Upper Limit 78.65% 84.95% 82.10% 83.63% 82.96% 83.82%
0.050Point Estimate 75.20% 79.40% 76.60% 77.90% 75.10% 78.70%Lower Limit 72.52% 76.89% 73.97% 75.33% 72.42% 76.16%Upper Limit 77.88% 81.91% 79.23% 80.48% 77.78% 81.24%
0.070Point Estimate 71.60% 70.40% 72.70% 72.80% 73.00% 72.80%Lower Limit 68.80% 67.57% 69.94% 70.04% 70.25% 70.04%Upper Limit 74.40% 73.23% 75.47% 75.56% 75.76% 75.56%
The upper and lower limits are based on 95% confidence interval
29

Table 7: Risks of the Two Firms
Panel 1: Risk-Neutral Firm Competition Intensity
Exchange Rate Variance 0.00 0.40 0.80 1.20 1.60 2.00 slope
0.000CV 0.000 0.000 0.000 0.000 0.000 0.000
5th Percentile 14.064 13.673 12.913 12.086 11.286 10.5461st Percentile 14.064 13.673 12.913 12.086 11.286 10.546
0.005CV 0.244 0.282 0.329 0.343 0.398 0.432 0.09∗∗∗
5th Percentile 8.636 7.498 6.036 5.986 4.348 3.462 −2.53∗∗∗
1st Percentile 5.443 4.131 3.086 1.941 0.857 0.069 −2.70∗∗∗
0.010CV 0.341 0.393 0.427 0.475 0.530 0.584 0.12∗∗∗
5th Percentile 6.156 4.963 4.934 3.211 2.110 0.732 −2.67∗∗∗
1st Percentile 3.104 1.254 0.814 -1.587 -1.338 -3.862 −3.21∗∗
0.030CV 0.580 0.634 0.785 0.818 0.867 0.939 0.18∗∗∗
5th Percentile 0.564 -0.905 -4.514 -5.669 -7.098 -8.525 −4.66∗∗∗
1st Percentile -4.965 -6.104 -11.247 -13.621 -17.389 -19.570 −7.80∗∗∗
0.050CV 0.749 0.826 0.928 1.017 1.159 1.068 0.19∗∗
5th Percentile -2.848 -5.651 -7.956 -10.458 -12.429 -13.369 −5.39∗∗∗
1st Percentile -11.168 -14.739 -16.645 -22.139 -28.160 -28.175 −9.34∗∗∗
0.070CV 0.904 1.091 1.134 1.281 1.325 1.383 0.23∗∗∗
5th Percentile -6.554 -10.613 -14.162 -17.705 -19.537 -20.663 −7.20∗∗∗
1st Percentile -15.446 -20.051 -30.441 -28.872 -35.111 -36.108 −10.49∗∗
Panel 2: Risk-Averse Firm Competition Intensity
Exchange Rate Variance 0.00 0.40 0.80 1.20 1.60 2.00 slope
0.000CV 0.000 0.000 0.000 0.000 0.000 0.000
5th Percentile 14.064 13.673 12.913 12.086 11.286 10.5461st Percentile 14.064 13.673 12.913 12.086 11.286 10.546
0.005CV 0.224 0.256 0.293 0.303 0.347 0.372 0.07∗∗∗
5th Percentile 9.006 7.770 6.362 6.170 4.764 4.002 −2.44∗∗∗
1st Percentile 6.097 4.852 3.920 2.962 2.107 1.519 −2.29∗∗∗
0.010CV 0.293 0.331 0.355 0.390 0.428 0.466 0.08∗∗∗
5th Percentile 7.071 5.831 5.576 4.206 3.367 2.447 −2.28∗∗∗
1st Percentile 4.518 2.995 2.665 1.053 1.249 -0.204 −2.18∗∗
0.030CV 0.399 0.433 0.523 0.553 0.599 0.653 0.13∗∗∗
5th Percentile 3.905 2.920 1.211 0.657 0.076 -0.422 −2.19∗∗
1st Percentile 0.759 0.524 -1.475 -2.186 -3.291 -3.773 −2.49∗∗∗
0.050CV 0.380 0.424 0.498 0.560 0.654 0.659 0.15∗∗∗
5th Percentile 3.678 2.464 1.509 0.623 -0.033 -0.402 −2.06∗∗∗
1st Percentile 0.838 -0.049 -0.571 -1.884 -3.121 -3.097 −2.16∗∗∗
0.070CV 0.360 0.426 0.484 0.571 0.645 0.722 0.18∗∗∗
5th Percentile 3.510 2.226 1.163 0.230 -0.331 -0.714 −2.12∗∗∗
1st Percentile 1.342 0.362 -1.620 -1.482 -2.515 -2.722 −2.06∗∗
***: p < 0.001; **: p < 0.01; *: p < 0.05
30

Appendix: Proof of Theorem 3
The Jacobian of F (X) that enters (12) can be written as
Jacobian =
A 0 0
0 B 0
0 0 C
, (A.1)
where A is the M × M submatrix corresponding to F Pm , m = 1, . . . ,M ; B is the (MKJ +
MJ)×(MKJ+MJ) submatrix corresponding to FUmkj and F V
mj, m = 1, . . . ,M ; k = 1, . . . , K;
and j = 1, . . . , J , and C is the (MK + M) × (MK + M) submatrix corresponding to F Umk
and FQm , m = 1, . . . ,M and k = 1, . . . , K. We can easily verify that C is zero.
We now show A is positive semidefinite.
A =
2(1 + γ) − γ(M−1)
. . . . . . − γ(M−1)
− γ(M−1)
. . . . . . . . . − γ(M−1)
... . . . 2(1 + γ) . . ....
− γ(M−1)
. . . . . .. . . − γ
(M−1)
− γ(M−1)
. . . . . . − γ(M−1)
2(1 + γ)
. (A.2)
Since 2(1+γ) >∑M−1
m=1 |−γ
(M−1)| = γ A is symmetric and diagonally dominant A is positive
semidefinite.
We now show B is also positive semidefinite. First the covariance matrix of the exchange
rate can be written as:
COVθ =
σ11 · · · · · · σ1J
σ21 σ22...
.... . .
...
σJ1 · · · · · · σJJ
. (A.3)
We now can write B as
B =
B1 0 · · · · · · 0
0. . . · · · · · · 0
... · · · Bm · · · ...
0 · · · · · · . . . 0
0 · · · · · · 0 BM
, (A.4)
31

where Bm = 2Zm × Φ× Zm. Zm is a diagonal matrix
Zm =
Z1m 0 · · · · · · 0
0. . .
...... Zj
m
......
. . ....
0 · · · · · · · · · ZJm
, (A.5)
where the submatrix Zjm is a (K + 1)× (K + 1) diagonal matrix:
Zjm =
c1j + t11j 0 · · · 0
0. . .
...... cKj + t1Kj
...
0 · · · · · · hmj + t2j
, (A.6)
The matrix Φ is a J(K + 1)× J(K + 1) matrix:
Φ =
Φ11 Φ12 · · · · · · Φ1J
Φ21. . .
...... Φj1j2
......
. . ....
ΦJ1 · · · · · · · · · ΦJJ
, (A.7)
where the submatrix Φj1j2 is a (K +1)× (K +1) matrix with all entries equal to σj1j2 . Note
that the matrix Φ is identical to the covariance matrix of the vector of random variables
where elements (j − 1)(K + 1) + 1 to j(K + 1) are equal to the exchange rate of country j,
j = 1, . . . , J . Hence, Φ is positive semidefinite.
Since Zm is a diagonal matrix and Bm = 2Zm ×Φ×Zm, Bm is also positive semidefinite,
which implies that B is positive semidefinite.
Since matrices A, B, and C are all positive semidefinite, the Jacobian matrix is also
positive semidefinite. Therefore, F (X) is monotone. Q.E.D.
32